A monoclonal antibody for G protein–coupled receptor crystallography
A monoclonal antibody for G protein–coupled receptor crystallography
A monoclonal antibody for G protein–coupled receptor crystallography

You also want an ePaper? Increase the reach of your titles
YUMPU automatically turns print PDFs into web optimized ePapers that Google loves.
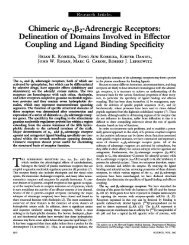
A <strong>monoclonal</strong> <strong>antibody</strong> <strong>for</strong> G <strong>protein–coupled</strong> <strong>receptor</strong><br />
<strong>crystallography</strong><br />
Peter W Day, Søren G F Rasmussen, Charles Parnot, Juan José Fung, Asna Masood,<br />
Tong Sun Kobilka, Xiao-Jie Yao, Hee-Jung Choi, William I Weis, Daniel K Rohrer &<br />
Brian K Kobilka<br />
Supplememtary figures and text:<br />
Supplementary Figure 1 Fluorescence images showing <strong>monoclonal</strong> <strong>antibody</strong> detection<br />
of flag tagged !2AR stably expressed in HEK-293 cells.<br />
Supplementary Figure 2 Affinity of Fab 5 <strong>for</strong> purified !2AR determined by isothremal<br />
titration calorimetry.<br />
Supplementary Figure 3 Image of Fab 5-!2AR-TMR crystals.<br />
Supplementary Table 1 Antagonist and agonist binding properties of the !2AR with and<br />
without prebound Fab 5.<br />
Supplementary Methods<br />
Note: In the version of this supplementary file originally posted online, there were several<br />
typographical errors. The errors have been corrected in this file.
Supplementary Figure 1. Fluorescence images showing <strong>monoclonal</strong> <strong>antibody</strong><br />
detection of flag tagged !2AR stably expressed in HEK-293 cells.<br />
Supplementary Figure 1.<br />
Fluorescence images showing <strong>monoclonal</strong> <strong>antibody</strong> detection of flag tagged<br />
!2AR stably expressed in HEK-293 cells. HEK-293 cells stably expressing a flag<br />
tagged version of the !2AR were cultured on coverslips and processed <strong>for</strong><br />
immunocytochemistry. After fixation, with 4% para<strong>for</strong>maldehyde, the cells were<br />
washed and blocked with 2.5% goat serum in PBS alone (nonpermeabilized) or<br />
with 0.5% NP-40 in PBS (permeabilized). The cells were incubated with the<br />
!2AR specific <strong>antibody</strong> indicated on the left side of the figure. After several<br />
washes, the !2AR <strong>monoclonal</strong> antibodies were detected with a Texas Red<br />
conjugated anti-mouse secondary <strong>antibody</strong>. To demonstrate that all of the cells<br />
are expressing the <strong>receptor</strong> they were subsequently stained with an Alexa-488<br />
conjugated M1 <strong>antibody</strong> (M1 column), which recognizes the amino terminal flag<br />
tag on the !2AR. Antibodies 1, 3, 4 and 8 stain cells in the absence of<br />
permeabilization and there<strong>for</strong>e bind an epitope on the extracellular face of the<br />
<strong>receptor</strong>. In contrast, antibodies 2, 5, 6, 7 and 9 only stain cells that have been<br />
permeabilized indicative of an intracellular epitope. The images shown are<br />
representative of at least 3 experiments. All images were acquired using an<br />
Axioplan 2 microscope (Carl Zeiss MicroImaging), fitted with a camera<br />
(RTE/CCD-1300-Y/HS; Roper Scientific) controlled using IPLab software (BD<br />
Bioscience).
Supplementary Figure 2. Affinity of Fab 5 <strong>for</strong> purified !2AR determined by<br />
isothermal titration calorimetry.
Supplementary Figure 2. Affinity of Fab 5 <strong>for</strong> purified !2AR determined by<br />
isothermal titration calorimetry.<br />
Supplementary Figure 2<br />
Affinity of Fab 5 <strong>for</strong> purified !2AR determined by isothermal titration calorimetry<br />
(ITC). ITC measurements were per<strong>for</strong>med at 25 °C using a VP-ITC calorimeter<br />
(Microcal, Inc.). The ITC cell contained 11 µM detergent-solubilized !2AR or<br />
!2AR buffer (blank titration), and the injection syringe contained 70 µM Fab 5.<br />
Titrations were initiated with a 3 µl injection, followed by a series of 8 µl injections<br />
(37 !2AR and 31 <strong>for</strong> !2AR buffer blank), with 240 s between injections. After<br />
subtracting the blank titration, the measured heat released upon binding was<br />
plotted against the Fab: !2AR molar ratio, and the data were fitted to a single-site<br />
binding model to obtain the association constant Ka, enthalpy change "H, and<br />
stoichiometry n using the Origin software package 1 (Microcal, Inc.)
Supplementary Figure 3. Image of Fab 5-!2AR-TMR crystals.<br />
Supplementary Figure 3.<br />
Image of Fab 5-!2AR-TMR crystals. !2AR was labeled with<br />
tetramethylrhodamine (!2AR-TMR) and mixed with an excess of Fab 5. The<br />
complex was purified by size exclusion chromatography. Crystals were grown in<br />
bicelles and ammonium sulfate (Rasmussen et al manuscript). Images were<br />
obtained by light (A) and fluorescence (B) microscopy. The fluorescence<br />
confirms the presence of !2AR-TMR in the crystals. Bar represents 50 !m. All<br />
images were acquired using an Axioplan 2 microscope (Carl Zeiss<br />
MicroImaging), fitted with a camera (RTE/CCD-1300-Y/HS; Roper Scientific)<br />
controlled using IPLab software (BD Bioscience).<br />
Literature Cited<br />
1. T. Wiseman, S. Williston, J. F. Brandts et al., Anal Biochem 179 (1), 131<br />
(1989).
Supplementary Table 1. Antagonist and agonist binding properties of the !2AR<br />
with and without prebound Fab 5.<br />
Supplementary Table 1.<br />
[ 3 H]dihydroalprenolol Isoproterenol<br />
Kd ± S.E. Ki [S.E. interval]<br />
(nM) (nM)<br />
!2AR 1.02 ± 0.09 290 [269-311]<br />
!2AR-Fab5 1.08 ± 0.05 329 [310-348]<br />
Antagonist and agonist binding properties of the !2AR with and without prebound<br />
Fab 5. Saturation and competition binding assays were per<strong>for</strong>med on purified<br />
!2AR reconstituted in phospholipid vesicles in the absence and presence of<br />
prebound Fab 5. Values are from three independent experiments per<strong>for</strong>med in<br />
triplicate. The IC50 values used <strong>for</strong> calculations of Ki values were obtained from<br />
means of pIC50 values determined by nonlinear regression analysis and the S.E.<br />
interval from pIC50 ± S.E.
SUPPLEMENTAL METHODS<br />
Antigen preparation<br />
!2AR having an amino terminal Flag epitope tag and a carboxyl hexahistidine tag<br />
was expressed in Sf9 insects cells and purified by sequential M1 <strong>antibody</strong> and<br />
alprenolol affinity chromatography as previously described 1 . Purified !2AR was<br />
immobilized on a Ni column and equilibrated with 10 column volumes of a<br />
mixture of 5 mg/ml DOPC (Avanti Polar Lipids) and 0.5 mg/ml Lipid A (Sigma) in<br />
1% (w/v) octylglucoside (Anatrace), 100 mM NaCl, 20 mM Hepes pH 7.5 and 1<br />
!M carazolol (a !2AR antagonist). The !2AR was then eluted in the same buffer<br />
containing 200 mM imidazole. The concentration of the eluted !2AR was<br />
adjusted to 5 mg/ml. This usually involved diluting the protein with the same<br />
buffer, but occasionally required concentrating the protein up to two-fold with an<br />
Amicon ultrafiltration cell (100 kDa pore). The protein was then dialyzed against<br />
phosphate buffered saline containing 1 !M carazolol at 4ºC to remove detergent.<br />
The reconstituted protein was stored at -80ºC prior to use <strong>for</strong> immunization.<br />
Hybridoma Production<br />
Myeloma cell lines<br />
The P3x63Ag8.653 myeloma cell line (ATCC # CRL-1580; Lot No.1131010) was<br />
used <strong>for</strong> the fusion experiment per<strong>for</strong>med with splenocytes from immunized mice.<br />
Cell culture<br />
Myeloma cells were routinely propagated in Dulbecco’s Modified Eagle’s Medium<br />
(DMEM-high glucose) supplemented with 10% Fetal Bovine Serum (FBS), 0.15 g<br />
/L oxaloacetate, 0.05 g/L pyruvate, 0.0082 g/L bovine insulin (OPI supplement),<br />
10% NCTC109 medium and 4 mM L-glutamine. This <strong>for</strong>mulation is referred to<br />
the SDMEM <strong>for</strong>mulation. Newly <strong>for</strong>med hybridoma were selected in SDMEM<br />
supplemented with HAT mixture (1.0x10 -4 M Hypoxanthine, 4.0x10 -6 M<br />
Aminopterin, 1.6x10 -5 M thymidine), 5% hybridoma cloning factor, gentamicin (50<br />
!g/ml) and !-mercaptoethanol at 0.055 mM. This <strong>for</strong>mulation is referred as
SDMEM-HAT. After selection, the newly <strong>for</strong>med hybridomas were propagated in<br />
SDMEM supplemented with 2% hybridoma cloning factor HT mixture (1.0x10 -4 M<br />
hypoxanthine, 1.6x10 -5 M thymidine). This <strong>for</strong>mulation is referred as DMEM-HT.<br />
For in vitro <strong>antibody</strong> production, the hybridomas were propagated in SDMEM<br />
supplemented with 1% hybridoma cloning factor and 5-10% low-IgG FBS.<br />
Cell Fusion Protocol<br />
Balb/c mice were immunized weekly with 30 µg of !2AR in liposomes. The mice<br />
were injected intraperitoneally with 15 µg of antigen and subcutaneously at 2<br />
sites with 7.5 mg of antigen. Final boosts of 10 µg of !2AR were given<br />
intraperitoneally and intravenously on day 3 and 4 be<strong>for</strong>e fusion. Spleens were<br />
harvested aseptically, placed in cold DMEM, diced and homogenized. The<br />
homogenate was centrifuged at 1000 rpm <strong>for</strong> 5 minutes. The cell pellet was<br />
incubated with 5 ml of Red cell lysis buffer (Sigma R7757) <strong>for</strong> 3-5 mins. DMEM<br />
(20 ml) was added and the cells were centrifuged at 1000 rpm <strong>for</strong> 5 minutes. The<br />
pellet was rinsed twice in 20 ml DMEM. The final pellet was resuspended in 30<br />
mL DMEM. Spleen and myeloma cells were combined at a 3:1 ratio, centrifuged<br />
(1000 rpm) and resuspend in DMEM. The centrifugation was repeated and 1 mL<br />
PEG-1500 (50% solution) was added to the cell pellet over 3 min with gentle<br />
mixing. 4 mL of SDMEM was slowly added to cells over 2 min. After 1 min<br />
incubation, 20 mL of SDMEM was added over 1 min. The suspension was<br />
centrifuge (1000 rpm) and the pellet was resuspended in a total of 30 mL HAT-<br />
SDMEM and incubate at 37 °C <strong>for</strong> 2 hours. HAT-SDMEM media was added to<br />
achieve a cell density of 5x10 4 cells/well and dispensed into 96-well plates at 200<br />
µL per well. Cells were incubated <strong>for</strong> 11 days be<strong>for</strong>e screening media <strong>for</strong><br />
<strong>antibody</strong> production.<br />
Bimane Fluoresence.<br />
Purified <strong>receptor</strong> was reacted with 1:1 equivalent of monobromobimane (mBBr,<br />
Invitrogen) in buffer A (100 mM NaCl, 20 mM HEPES, pH 7.5, 0.1% dodecyl
maltoside) and incubated overnight on ice in the dark. The fluorophore-labeled<br />
<strong>receptor</strong> was purified right be<strong>for</strong>e use by gel filtration on a desalting column<br />
equilibrated with buffer B. Fluorescence spectroscopy experiments were<br />
per<strong>for</strong>med on a Spex FluoroMax-3 spectrofluorometer (Jobin Yvon Inc, NJ) with<br />
photon counting mode by using an excitation and emission bandpass of 4 nm. All<br />
experiments were per<strong>for</strong>med at 25°C. For emission scans, excitation was set at<br />
370 nm and emission was measured from 430-530 nm with an integration time of<br />
1 s/nm. To determine the effect of Fab5 <strong>antibody</strong> and drug, three individual<br />
labeled protein samples were incubated with <strong>antibody</strong> (1 µM Fab5) or 100 µM<br />
Isoproterenol or both. Emission spectra of the samples were taken after 15<br />
minutes incubation. Fluorescence intensity was corrected <strong>for</strong> background<br />
fluorescence from buffer and ligands in all experiments. The data are the mean ±<br />
S.E. of two independent experiments per<strong>for</strong>med in triplicate.<br />
Literature Cited.<br />
1. Kobilka, B. K. Amino and carboxyl terminal modifications to facilitate the<br />
production and purification of a G protein-coupled <strong>receptor</strong>. Anal Biochem<br />
231, 269-71 (1995).