Wed.P7c.05 Normalization of Spectro-Temporal Gabor Filter Bank ...
Wed.P7c.05 Normalization of Spectro-Temporal Gabor Filter Bank ...
Wed.P7c.05 Normalization of Spectro-Temporal Gabor Filter Bank ...

Create successful ePaper yourself
Turn your PDF publications into a flip-book with our unique Google optimized e-Paper software.
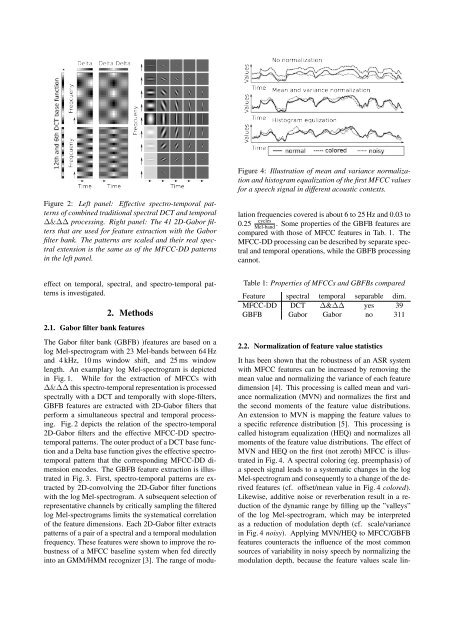
Figure 2: Left panel: Effective spectro-temporal patterns<br />
<strong>of</strong> combined traditional spectral DCT and temporal<br />
∆&∆∆ processing. Right panel: The 41 2D-<strong>Gabor</strong> filters<br />
that are used for feature extraction with the <strong>Gabor</strong><br />
filter bank. The patterns are scaled and their real spectral<br />
extension is the same as <strong>of</strong> the MFCC-DD patterns<br />
in the left panel.<br />
effect on temporal, spectral, and spectro-temporal patterns<br />
is investigated.<br />
2. Methods<br />
2.1. <strong>Gabor</strong> filter bank features<br />
The <strong>Gabor</strong> filter bank (GBFB) )features are based on a<br />
log Mel-spectrogram with 23 Mel-bands between 64 Hz<br />
and 4 kHz, 10 ms window shift, and 25 ms window<br />
length. An examplary log Mel-spectrogram is depicted<br />
in Fig. 1. While for the extraction <strong>of</strong> MFCCs with<br />
∆&∆∆ this spectro-temporal representation is processed<br />
spectrally with a DCT and temporally with slope-filters,<br />
GBFB features are extracted with 2D-<strong>Gabor</strong> filters that<br />
perform a simultaneous spectral and temporal processing.<br />
Fig. 2 depicts the relation <strong>of</strong> the spectro-temporal<br />
2D-<strong>Gabor</strong> filters and the effective MFCC-DD spectrotemporal<br />
patterns. The outer product <strong>of</strong> a DCT base function<br />
and a Delta base function gives the effective spectrotemporal<br />
pattern that the corresponding MFCC-DD dimension<br />
encodes. The GBFB feature extraction is illustrated<br />
in Fig. 3. First, spectro-temporal patterns are extracted<br />
by 2D-convolving the 2D-<strong>Gabor</strong> filter functions<br />
with the log Mel-spectrogram. A subsequent selection <strong>of</strong><br />
representative channels by critically sampling the filtered<br />
log Mel-spectrograms limits the systematical correlation<br />
<strong>of</strong> the feature dimensions. Each 2D-<strong>Gabor</strong> filter extracts<br />
patterns <strong>of</strong> a pair <strong>of</strong> a spectral and a temporal modulation<br />
frequency. These features were shown to improve the robustness<br />
<strong>of</strong> a MFCC baseline system when fed directly<br />
into an GMM/HMM recognizer [3]. The range <strong>of</strong> modu-<br />
Figure 4: Illustration <strong>of</strong> mean and variance normalization<br />
and histogram equalization <strong>of</strong> the first MFCC values<br />
for a speech signal in different acoustic contexts.<br />
lation frequencies covered is about 6 to 25 Hz and 0.03 to<br />
0.25 cycles<br />
Mel-band . Some properties <strong>of</strong> the GBFB features are<br />
compared with those <strong>of</strong> MFCC features in Tab. 1. The<br />
MFCC-DD processing can be described by separate spectral<br />
and temporal operations, while the GBFB processing<br />
cannot.<br />
Table 1: Properties <strong>of</strong> MFCCs and GBFBs compared<br />
Feature spectral temporal separable dim.<br />
MFCC-DD DCT ∆&∆∆ yes 39<br />
GBFB <strong>Gabor</strong> <strong>Gabor</strong> no 311<br />
2.2. <strong>Normalization</strong> <strong>of</strong> feature value statistics<br />
It has been shown that the robustness <strong>of</strong> an ASR system<br />
with MFCC features can be increased by removing the<br />
mean value and normalizing the variance <strong>of</strong> each feature<br />
dimension [4]. This processing is called mean and variance<br />
normalization (MVN) and normalizes the first and<br />
the second moments <strong>of</strong> the feature value distributions.<br />
An extension to MVN is mapping the feature values to<br />
a specific reference distribution [5]. This processing is<br />
called histogram equalization (HEQ) and normalizes all<br />
moments <strong>of</strong> the feature value distributions. The effect <strong>of</strong><br />
MVN and HEQ on the first (not zeroth) MFCC is illustrated<br />
in Fig. 4. A spectral coloring (eg. preemphasis) <strong>of</strong><br />
a speech signal leads to a systematic changes in the log<br />
Mel-spectrogram and consequently to a change <strong>of</strong> the derived<br />
features (cf. <strong>of</strong>fset/mean value in Fig. 4 colored).<br />
Likewise, additive noise or reverberation result in a reduction<br />
<strong>of</strong> the dynamic range by filling up the ”valleys”<br />
<strong>of</strong> the log Mel-spectrogram, which may be interpreted<br />
as a reduction <strong>of</strong> modulation depth (cf. scale/variance<br />
in Fig. 4 noisy). Applying MVN/HEQ to MFCC/GBFB<br />
features counteracts the influence <strong>of</strong> the most common<br />
sources <strong>of</strong> variability in noisy speech by normalizing the<br />
modulation depth, because the feature values scale lin-