RSI - FXstreet.com
RSI - FXstreet.com
RSI - FXstreet.com

You also want an ePaper? Increase the reach of your titles
YUMPU automatically turns print PDFs into web optimized ePapers that Google loves.
10<br />
TECHNICAL ANALYSIS<br />
BRANDON WENDELL<br />
It’s All<br />
Relative<br />
Brandon Wendell provides new ideas on how to<br />
interpret an old indicator. Do you know how to<br />
successfully interpret and use Welles Wilder’s <strong>RSI</strong>?<br />
Learn new interpretations of the <strong>RSI</strong> in this article.<br />
APRIL 2008
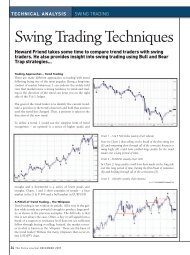
Figure 1 AUD with bullish signal followed by negative divergence The chart source : Procharts<br />
Many traders look to technical indicators for clues<br />
as to where price action will be moving in the future.<br />
There are many problems associated with this<br />
approach. First and foremost, technical indicators lag current<br />
price. The indicators are created from data that is <strong>com</strong>piled from<br />
where price has been at some point in the past, the rate at which<br />
it is changing, and perhaps use volume as an additional filter.<br />
Technical indicators are simply a mathematical way of analyzing<br />
and representing price action and offering a different perspective<br />
of what price is doing. A trader should never rely exclusively<br />
on an indicator for a buy or sell signal. However, when used<br />
in conjunction with price behavior analysis, a trader can gain<br />
confidence for entries and exits as well as identify opportunities<br />
as they appear. Technical indicators should be used as a decision<br />
support tool.<br />
I constantly study methods of trading and consider myself to<br />
be a student of the market. I was surprised to learn that there<br />
are different methods of applying popular indicators and I found<br />
that by making some minor modifications, an indicator I previously<br />
had no use for became a nearly indispensible tool in my<br />
trading arsenal. One tool that fits this description is the Relative<br />
Strength Index.<br />
As part of my market studies, I came across a book by Connie<br />
Brown entitled, Technical Analysis for the Trading Professional. In<br />
this book, Connie describes a method of adjusting signals of the<br />
<strong>RSI</strong> for maximum efficiency.<br />
The typical Relative Strength Index (<strong>RSI</strong>) calculation uses 14 periods.<br />
This means that the strength of the current price is measured<br />
against the prices over the preceding 14 time periods. The<br />
indicator measures the strength of upward movements in price as<br />
well as the strength of downward moves in price. The <strong>RSI</strong> can be<br />
applied to any trading security. Positive and negative divergences<br />
are the strongest signals provided by the indicator.<br />
Positive divergence occurs when the indicator makes higher lows<br />
while the security’s price makes lower lows. In this case, the <strong>RSI</strong><br />
is telling us the downward price movement is losing strength.<br />
Generally, the price will reverse and head higher. A negative divergence<br />
is when the indicator fails to make new highs while price<br />
does. This tells us that the upward trend is weakening. Generally,<br />
the price will fail and enter a downtrend. Unfortunately,<br />
divergence signals do not give us exact timing for the reversals in<br />
price but simply warn that one may be <strong>com</strong>ing.<br />
The <strong>RSI</strong> also provides a good indicator of a market’s overbought<br />
and oversold status. If the indicator rises above 70, the security<br />
is considered overbought and is ready for a pullback or reversal.<br />
Do not automatically sell a long position at this point! If the <strong>RSI</strong><br />
drops below 70 after moving above it, that is the signal to exit a<br />
long position or initiate a short one in a bearish market.<br />
A similar signal occurs when the indicator drops below 30. When<br />
this occurs, the market is oversold and may reverse to the upside.<br />
Wait to buy when the indicator crosses back above 30. If you are<br />
short the market, buy to close the position. If opening a long<br />
position, be sure that the market is in a bullish trend before entering<br />
the long position.<br />
Shown in Figure 1, there is a nice buy signal on the left side of the<br />
chart from the <strong>RSI</strong> going long the AUD/USD at approximately<br />
0.80. We are able to ride the trend up and exit from the position<br />
on the sell signal at 0.89 for a nice profit. Unfortunately, the<br />
<strong>RSI</strong> exits the position too early and the pair rises while we wait<br />
APRIL 2008<br />
11
12<br />
TECHNICAL ANALYSIS<br />
Figure 2: AUD with bullish <strong>RSI</strong> The chart source : Procharts<br />
Figure 3: JPY with bearish <strong>RSI</strong> The chart source : Procharts<br />
for another buy signal that never arrives. The price continues to<br />
make higher highs while the <strong>RSI</strong> shows negative divergence. On<br />
the break of the <strong>RSI</strong> below 70, a short can be entered but the <strong>RSI</strong><br />
fail and never offers a signal to exit the trade or to participate in<br />
the following rally.<br />
One thing to notice is that in a very bullish trend, buy signals<br />
are rare since the <strong>RSI</strong> does not drop below 40. In a very bearish<br />
APRIL 2008<br />
trend, the <strong>RSI</strong> will not move above 60. In this scenario, how<br />
can you hope to have the 70 – 30 signals needed to get you into<br />
trades? The answer is that you cannot unless the indicator is<br />
adjusted. Many trading platforms will allow you to adjust the<br />
lines for overbought and oversold indications. Let’s see how this<br />
adjusts our trading signals.<br />
In a bullish trend, I mentioned that the <strong>RSI</strong> does not drop below
40. In this case, we can use a reading of 40 as an area of support<br />
to tell us when the bear market is ending. We can also adjust our<br />
overbought and oversold signal lines upward to provide quality<br />
signals. By making the overbought line 80 and the oversold 40,<br />
you will have a useful indicator. Do not enter any short positions<br />
against a bullish trend! Use the overbought signal to exit trade<br />
longs only, not enter short positions.<br />
In Figure 2, the <strong>RSI</strong> has been adjusted for a bullish trend and<br />
provides better quality signals that allow participation in the<br />
trend. We will still use the original <strong>RSI</strong> buy signal but then<br />
exit the trade for a larger profit at approximately 0.94 when the<br />
<strong>RSI</strong> makes a much lower peak while the AUD made new highs<br />
against the USD. Once price and the <strong>RSI</strong> begin dropping, we<br />
take that as a signal to exit with a profit but do not short the<br />
market as the <strong>RSI</strong> remains above 40. e adjusted <strong>RSI</strong> allows us<br />
to enter another profitable trade in January. We see a great buy<br />
signal near the lows and a sell signal near the highs.<br />
When the <strong>RSI</strong> drops below 40, it is time to adjust the <strong>RSI</strong> for a<br />
bearish trend. In a bearish trend, the <strong>RSI</strong> uses 60 as resistance.<br />
So, we adjust our signal lines downward. Our overbought line<br />
be<strong>com</strong>es 50 and our oversold is 25. Sell short on a crossover<br />
from above 50 to the downside and exit shorts on the crossover<br />
of 25 to the upside. Do not enter longs against a bearish trend.<br />
Remember, the trend is your friend!<br />
In the chart of the USD/JPY pair, I have identified a nice downtrend<br />
and have adjusted the <strong>RSI</strong> for proper signals. We were able<br />
to sell the pair successfully with the adjusted <strong>RSI</strong> and exited for<br />
profit with timely signals or divergence.<br />
I have shown examples on a daily charts only. Do not worry,<br />
this technique works just as well intraday on stocks as well as for<br />
Forex, E-minis and anything else you can use an <strong>RSI</strong> on. Give it<br />
a try and see if you get better signals!<br />
Brandon Wendell has appeared as a guest on CNBC Asia’s Cash Flow and<br />
conducted special seminars for CNBC sta on technical analysis of the<br />
nancial markets. Brandon was also an industry expert speaker at the<br />
Asia Traders and Investors Conference 2008.<br />
Brandon is a full time trader in the US Equities, Options and Forex markets.<br />
He also teaches trading courses for Online Trading Academy. As a former<br />
stockbroker, brokerage trader, and hedge fund trader, Brandon brings<br />
various market views and insights to his trading classes and lectures. A<br />
wealth of knowledge, he has held NASD securities series 7 and 63 licenses.<br />
Brandon taught for Online Trading Academy in 1999 to 2001 before<br />
be<strong>com</strong>ing a Realtor and Commercial Mortgage broker also managing a<br />
venture capital rm. Returning to the Online Trading Academy family late<br />
2005, he now balances trading, teaching and a mortgage and nance<br />
career. Brandon is also a member of the Market Technicians Association<br />
and the Chartered Financial Analyst Institute.<br />
To advertise to the readers of<br />
THE<br />
FOREX JOURNAL<br />
Call Dennis Yap at<br />
(65) 9040 4151 or email at<br />
dennis@forexjournal.<strong>com</strong><br />
001001010000101010011011<br />
001001010000101010011011<br />
001001010000101010011011<br />
001001010000101010011011<br />
001001010000101010011011<br />
001001010000101010011011<br />
001001010000101010011011<br />
001001010000101010011011<br />
001001010000101010011011<br />
001001010000101010011011<br />
001001010000101010011011<br />
001001010000101010011011
14<br />
TECHNICAL ANALYSIS<br />
Bollinger<br />
Bands in Forex<br />
Trading<br />
APRIL 2008<br />
Bollinger bands can be used eectively to analyze prot<br />
opportunities in the Forex markets.
![Hedge [Modo de compatibilidad] - FXstreet.com](https://img.yumpu.com/17927360/1/190x135/hedge-modo-de-compatibilidad-fxstreetcom.jpg?quality=85)