Uncertainty and dependency in causal inference - Cognitive ...
Uncertainty and dependency in causal inference - Cognitive ...
Uncertainty and dependency in causal inference - Cognitive ...

Create successful ePaper yourself
Turn your PDF publications into a flip-book with our unique Google optimized e-Paper software.
asymptotically approach 1.0 (see Figure 2). The salience of<br />
cue i depends on whether the cue is present (sj = α) or absent<br />
(si = 0.0), <strong>and</strong> the salience of cue j (which could be the<br />
effect) also depends on whether the cue is present (sj = α) or<br />
absent (sj = k1).<br />
A f<strong>in</strong>al 2 parameter k2 controls the strength of the<br />
competition from the <strong>in</strong>direct activation of the effect.<br />
Follow<strong>in</strong>g Stout <strong>and</strong> Miller (2007), we set α = .7071, k1 =<br />
.1768, k2 = .9 as the default parameters of the model. In all<br />
of our simulations, we assume that context is ignored.<br />
Bayesian models of <strong>causal</strong> <strong>in</strong>ference<br />
Many Bayesian models of <strong>causal</strong> <strong>in</strong>ference have been<br />
proposed. These models often represent possible<br />
explanations of the data as <strong>causal</strong> graphs. In these models,<br />
<strong>in</strong>ferential dependencies arise from the ability of the model<br />
to distribute belief across multiple explanations. Consider<br />
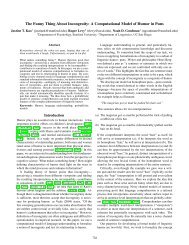
Figure 3, which shows what a Bayesian model that assumes<br />
determ<strong>in</strong>istic causation might <strong>in</strong>fer from AB+ trials. The<br />
AB+ trials will concentrate belief on the explanations where<br />
at least one of the cues causes the effect. This belief<br />
distribution sets up an <strong>in</strong>ferential <strong>dependency</strong>. To see why,<br />
observe that the probability that cue B causes the effect<br />
given that cue A causes the effect is 0.33/(0.33+0.33) = 0.5,<br />
whereas the probability that cue B causes the effect given<br />
that cue A does not cause the effect is 0.33/(0.33+.00) = 1.0.<br />
This suggests a <strong>dependency</strong> where learn<strong>in</strong>g whether or not<br />
cue A causes the effect will <strong>in</strong>fluence the model’s beliefs<br />
about cue B.<br />
Figure 3: The predictions of a simple Bayesian model when<br />
given AB+ evidence. The numbers are the posterior<br />
probabilities of the explanations given the data, P(G|D).<br />
We adopt a Bayesian model of <strong>causal</strong> <strong>in</strong>ference that<br />
extends Griffiths <strong>and</strong> Tenenbaum’s (2005) model. Provided<br />
with a set of cues, the model considers all of the <strong>causal</strong><br />
graphs where each cue is either a cause of the effect or does<br />
not <strong>in</strong>fluence the effect. Given some data D, the model uses<br />
Bayes theorem to calculate the posterior probability of each<br />
graph G:
Table 1: The data presented <strong>in</strong> Experiment 1.<br />
condition phase 1 phase 2<br />
two causes A+ B+ AB+<br />
one cause C– D+ CD+<br />
competition control EF+<br />
forgett<strong>in</strong>g control G+ H–<br />
Method<br />
Participants<br />
Eighteen undergraduates at the University of California, Los<br />
Angeles participated for course credit.<br />
Materials <strong>and</strong> Procedure<br />
The experimental <strong>in</strong>structions <strong>in</strong>formed the participants that<br />
they would be attempt<strong>in</strong>g to diagnose the fruit allergies of a<br />
patient at the hospital. Participants were told that the<br />
diagnoses would be made by review<strong>in</strong>g the patient’s “fruit<br />
journal.” The fruit journal provided a daily log of the fruits<br />
that the patient ate <strong>and</strong> of his allergic reactions.<br />
Table 1 summarizes the content of the fruit journal. S<strong>in</strong>ce<br />
we wanted to assess how the participant’s <strong>causal</strong> beliefs<br />
changed over the course of the experiment, we presented the<br />
fruit journal <strong>in</strong> two separate learn<strong>in</strong>g phases. Participants<br />
reported their <strong>causal</strong> beliefs after each learn<strong>in</strong>g phase.<br />
With<strong>in</strong> a learn<strong>in</strong>g phase, there were five trials for each<br />
trial-type (i.e., <strong>in</strong> the first phase, there were five A+ trials,<br />
five B+ trials, <strong>and</strong> so on), <strong>and</strong> the trials were presented <strong>in</strong><br />
r<strong>and</strong>om order. Each trial began by display<strong>in</strong>g the icons <strong>and</strong><br />
labels of whichever fruits the patient ate on that day. The<br />
icons <strong>and</strong> labels of the fruits were displayed alone for 1.5<br />
seconds, at which po<strong>in</strong>t an cartoon face appeared. The<br />
cartoon face signified whether the patient had an allergic<br />
reaction on that day: a smiley face with the text “ok”<br />
<strong>in</strong>dicated that the patient did not have an allergic reaction<br />
<strong>and</strong> a frown<strong>in</strong>g face with the text “allergic reaction”<br />
<strong>in</strong>dicated that the patient had an allergic reaction. The trial<br />
concluded after the fruit or fruits <strong>and</strong> cartoon face were<br />
displayed together for 2.0 seconds.<br />
After each learn<strong>in</strong>g phase, participants reported their<br />
<strong>causal</strong> beliefs by answer<strong>in</strong>g questions such as:<br />
Suppose that on a given day, coconuts are the only<br />
fruit that the patient eats. Do you th<strong>in</strong>k that the<br />
patient will have an allergic reaction on that day?<br />
The participants responded on a slider with seven tick<br />
marks. The leftmost tick was labeled “def<strong>in</strong>itely not,” the<br />
middle mark was labeled “maybe,” <strong>and</strong> the rightmost tick<br />
was labeled “def<strong>in</strong>itely.” Responses were coded as <strong>in</strong>tegers<br />
rang<strong>in</strong>g from 1 (“def<strong>in</strong>itely not”) to 7 (“def<strong>in</strong>itely”).<br />
Results <strong>and</strong> Discussion<br />
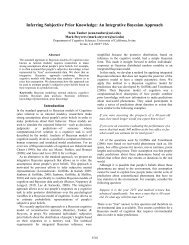
Figure 4 shows the participant’s <strong>causal</strong> rat<strong>in</strong>gs <strong>and</strong> the<br />
predictions of the Bayesian model <strong>and</strong> comparator<br />
1421<br />
hypothesis. The most <strong>in</strong>formative comparisons are between<br />
the f<strong>in</strong>al rat<strong>in</strong>gs for the cues <strong>in</strong> the experimental conditions<br />
(i.e., cues A, B, C, <strong>and</strong> D) to the f<strong>in</strong>al rat<strong>in</strong>gs for the relevant<br />
forgett<strong>in</strong>g control cue (i.e., cue G for the <strong>causal</strong> cues; cue H<br />
for the non<strong>causal</strong> cues). Because the comparator hypothesis<br />
predicts that competition will develop between the<br />
experimental cues dur<strong>in</strong>g phase 2, it predicts that the f<strong>in</strong>al<br />
<strong>causal</strong> rat<strong>in</strong>gs for the experimental cues will be lower. This<br />
was not the case. No significant differences were found<br />
between the f<strong>in</strong>al <strong>causal</strong> rat<strong>in</strong>gs for cue G <strong>and</strong> the f<strong>in</strong>al<br />
<strong>causal</strong> rat<strong>in</strong>gs for cue A, t(17) = 0.79, p = .44, cue B, t(17) =<br />
0.11, p = .91, or cue C, t(17) = 0.77, p = .45. Similarly, the<br />
difference between the <strong>causal</strong> rat<strong>in</strong>gs for cue H <strong>and</strong> cue D<br />
was also non-significant, t(17) = 1.49, p = .15. 3 The failure<br />
to f<strong>in</strong>d differences between these cues is not due to a simple<br />
lack of statistical power: the participants clearly<br />
dist<strong>in</strong>guished between different cues <strong>in</strong> phase 1, F(5, 85) =<br />
126.01, p < .001, <strong>and</strong> phase 2, F(7, 119) = 30.51, p < .001.<br />
The Bayesian model correctly predicts the relative stability<br />
of the experimental cues.<br />
As one might expect, therefore, the Bayesian model<br />
provided a better fit to the data (r = .98) than the comparator<br />
hypothesis (r = .59). To <strong>in</strong>vestigate whether the comparator<br />
hypothesis could expla<strong>in</strong> the results when other parameter<br />
sett<strong>in</strong>gs were adopted, we searched for the parameters that<br />
maximized the correlation between the model predictions<br />
<strong>and</strong> the <strong>causal</strong> rat<strong>in</strong>gs across both phases. With the bestfitt<strong>in</strong>g<br />
parameters, the model offered a much better fit (r =<br />
0.99 with α = .30, k1 = .08; k2 did not <strong>in</strong>fluence the model<br />
predictions). The better fit was achieved by slow<strong>in</strong>g down<br />
the learn<strong>in</strong>g rate (α). With a slower learn<strong>in</strong>g rate, the<br />
associations between the cues <strong>and</strong> the effect did not<br />
approach asymptote on the trials <strong>in</strong> phase 1. Consequently,<br />
the associations cont<strong>in</strong>ued to <strong>in</strong>crease <strong>in</strong> phase 2. The bestfitt<strong>in</strong>g<br />
parameters adjusted the magnitude of this <strong>in</strong>crease so<br />
that it exactly offset the <strong>in</strong>creased competition that arises<br />
through the formation of the with<strong>in</strong>-compound association.<br />
Although post-hoc better-fitt<strong>in</strong>g parameters made the<br />
comparator hypothesis’s predictions correlate well with the<br />
results, there are reasons to be suspicious of this adjustment.<br />
First, <strong>in</strong> the better fitt<strong>in</strong>g model, the predicted cue-effect<br />
associations <strong>in</strong> phase 1 (.37) are far from asymptote, mak<strong>in</strong>g<br />
it awkward to expla<strong>in</strong> why participants viewed the <strong>causal</strong><br />
cues (cues A, B, D, <strong>and</strong> G) as “def<strong>in</strong>ite” causes of the effect.<br />
Furthermore, the model only predicts a stable cue A-effect<br />
association under very specific parameter sett<strong>in</strong>gs. The<br />
<strong>causal</strong> <strong>in</strong>fluence of cue A will only be stable dur<strong>in</strong>g the AB+<br />
trials when the <strong>in</strong>crease <strong>in</strong> the direct activation of the effect<br />
from cue A is exactly offset by the <strong>in</strong>crease <strong>in</strong> the <strong>in</strong>direct<br />
activation via cue B. This delicate balance would be difficult<br />
to ma<strong>in</strong>ta<strong>in</strong> across many situations.<br />
3 Rather than compar<strong>in</strong>g the f<strong>in</strong>al rat<strong>in</strong>gs for the<br />
experimental <strong>and</strong> control cues, one could compare the <strong>in</strong>itial<br />
<strong>and</strong> f<strong>in</strong>al rat<strong>in</strong>gs for the experimental cues. However, the<br />
small differences between these rat<strong>in</strong>gs were not statistically<br />
significant <strong>and</strong> could be attributed to forgett<strong>in</strong>g <strong>in</strong> any case.
Figure 4: The data from Experiment 1 <strong>and</strong> the predictions of the models.<br />
Experiment 2<br />
Experiment 2 sought to f<strong>in</strong>d a clearer refutation of the<br />
comparator hypothesis <strong>and</strong> to modify the experimental<br />
procedure so that the Van Hamme <strong>and</strong> Wasserman model<br />
also predicts <strong>in</strong>ferential dependencies. Because the Van<br />
Hamme <strong>and</strong> Wasserman model predicts that with<strong>in</strong>compound<br />
associations are only utilized when there is an<br />
expected but absent cue, test<strong>in</strong>g the predictions of the model<br />
<strong>in</strong>volves present<strong>in</strong>g one of the cues <strong>in</strong> isolation after a<br />
with<strong>in</strong>-compound association has been formed.<br />
Method<br />
Participants<br />
Eleven undergraduates at the University of California, Los<br />
Angeles participated for course credit.<br />
Materials <strong>and</strong> Procedure<br />
Except where noted, the materials <strong>and</strong> procedure were<br />
identical to those <strong>in</strong> Experiment 1. The data were presented<br />
<strong>in</strong> three phases rather than two, <strong>and</strong> Table 2 shows the<br />
presented data. We also altered the experimental procedure<br />
<strong>in</strong> an attempt to limit the <strong>in</strong>fluence of forgett<strong>in</strong>g across the<br />
phases. Rather than present<strong>in</strong>g data about the allergic<br />
reactions of a s<strong>in</strong>gle patient to many fruits, we presented<br />
data about the allergic reactions of three different patients<br />
(one for each experimental condition). Participants viewed<br />
all of the data for one patient before mov<strong>in</strong>g on to the next<br />
patient. As was the case <strong>in</strong> the previous experiment,<br />
participants reported their <strong>causal</strong> beliefs after each phase.<br />
Table 2: The presented data. The bold trials <strong>in</strong>volved cues<br />
whose associations with the effect were analyzed. The other<br />
cues were only <strong>in</strong>cluded as controls.<br />
condition phase 1 phase 2 phase 3<br />
two causes A+ G– AB+ B+<br />
one cause C– H+ CD+ D+<br />
recovery from<br />
overshadow<strong>in</strong>g<br />
Figure 5: Results <strong>and</strong> predictions for Experiment 2.<br />
1422<br />
I+ J– EF+ F–<br />
Results <strong>and</strong> Discussion<br />
Figure 5 shows the <strong>causal</strong> rat<strong>in</strong>gs for the cues across the<br />
phases, as well as the predictions of the Bayesian model <strong>and</strong><br />
the associative models with the best-fitt<strong>in</strong>g parameters. The<br />
model predictions differ most <strong>in</strong>formatively for cues A, C,<br />
<strong>and</strong> E. Across the learn<strong>in</strong>g phases, the <strong>causal</strong> rat<strong>in</strong>gs for<br />
cues A <strong>and</strong> C were much more stable than the <strong>causal</strong> rat<strong>in</strong>gs
for cue E. The Bayesian model predicts the relative stability<br />
of these rat<strong>in</strong>gs. The associative models do not, even when<br />
the parameters of the associative models were selected to<br />
maximize the correlation with the <strong>causal</strong> rat<strong>in</strong>gs.<br />
Consequently, the parameter-free Bayesian model (r = .98)<br />
provides a better fit to the data than the Van Hamme <strong>and</strong><br />
Wasserman model (r = .81 with α1β1 = .06, α2 / α1 = -.60, β2<br />
/ β1 = 5.53) <strong>and</strong> the comparator hypothesis (r = .81 with α =<br />
.37, k1 = .41, <strong>and</strong> k2 = .84).<br />
Planned comparisons confirmed that the rat<strong>in</strong>gs for cues A<br />
<strong>and</strong> C were stable across phases 2 <strong>and</strong> 3 (<strong>in</strong> fact, none of the<br />
participants gave these cues different <strong>causal</strong> rat<strong>in</strong>gs <strong>in</strong> the<br />
two phases) <strong>and</strong> that there was a clear change <strong>in</strong> the rat<strong>in</strong>gs<br />
for cue E across these phases, t(10) = 5.04, p < .001. S<strong>in</strong>ce<br />
the Van Hamme <strong>and</strong> Wasserman model predicts (1) that a<br />
with<strong>in</strong>-compound association will form on the AB+ trials<br />
<strong>and</strong> (2) that the B+ trial will be very surpris<strong>in</strong>g, it<br />
<strong>in</strong>correctly predicts that beliefs about cue A will change<br />
dramatically dur<strong>in</strong>g phase 2. The comparator hypothesis can<br />
only predict stable rat<strong>in</strong>gs for cue A on the AB+ trials if the<br />
learn<strong>in</strong>g rate is slow, but a slower learn<strong>in</strong>g rate <strong>in</strong>sures that<br />
the B-effect association will still be <strong>in</strong>creas<strong>in</strong>g dur<strong>in</strong>g the<br />
B+ trials. It is impossible for the comparator hypothesis to<br />
predict the stability of the <strong>causal</strong> rat<strong>in</strong>gs for cue A on both<br />
the AB+ <strong>and</strong> the B+ trials.<br />
General Discussion<br />
Associative models predict that <strong>in</strong>ferential dependencies can<br />
arise whenever two cues are simultaneously presented. In<br />
situations where the <strong>causal</strong> <strong>in</strong>fluence of one of the cues is<br />
already known with near-certa<strong>in</strong>ty, this prediction can be<br />
dist<strong>in</strong>guished from the predictions of Bayesian models,<br />
which will not predict <strong>in</strong>ferential dependencies <strong>in</strong> such<br />
circumstances. The results <strong>in</strong> Experiments 1 <strong>and</strong> 2 favor the<br />
Bayesian model over the associative models.<br />
These experiments suggest that any model of <strong>causal</strong><br />
<strong>in</strong>ference should represent uncerta<strong>in</strong>ty by distribut<strong>in</strong>g belief<br />
across multiple explanations. A model that does so –<br />
whether through probabilistic <strong>in</strong>ference, propositional<br />
reason<strong>in</strong>g, or other mechanisms – will be able to expla<strong>in</strong> the<br />
appropriate <strong>in</strong>ferential dependencies. This is someth<strong>in</strong>g that<br />
the Bayesian models of <strong>causal</strong> <strong>in</strong>ference clearly do. It is also<br />
someth<strong>in</strong>g that with<strong>in</strong>-compound associations clearly fail to<br />
approximate.<br />
Acknowledgments<br />
The preparation of this article was supported by AFOSR<br />
FA 9550-08-1-0489. The authors wish to thank Betty Huang<br />
<strong>and</strong> Aaron Placensia for assistance with data collection.<br />
References<br />
Carroll, C. D., Cheng, P. W., & Lu, H. (2010). <strong>Uncerta<strong>in</strong>ty</strong><br />
<strong>in</strong> <strong>causal</strong> <strong>in</strong>ference: The case of retrospective revaluation.<br />
In S. Ohlsson, & R. Catrambone (Eds.), Proceed<strong>in</strong>gs of<br />
the 32nd Annual Conference of the <strong>Cognitive</strong> Science<br />
Society.<br />
1423<br />
Cheng, P. W. (1997). From covariation to causation: A<br />
<strong>causal</strong> power theory. Psychological Review, 104, 367-405.<br />
Courville, A. C., Daw, N. D., Gordon, G. J., & Touretzky, D.<br />
S. (2003). Model uncerta<strong>in</strong>ty <strong>in</strong> classical condition<strong>in</strong>g. In<br />
S. Thrun, S. L, & B. Schoelkopf (Eds.), Advances <strong>in</strong><br />
Neural Information Process<strong>in</strong>g Systems 16. Cambridge,<br />
MA: MIT Press.<br />
Denniston, J. C., Savastano, H. I., & Miller, R. R. (2001).<br />
The extended comparator hypothesis: Learn<strong>in</strong>g by<br />
contiguity, respond<strong>in</strong>g by relative strength. In R. R.<br />
Mowrer, & S. B. Kle<strong>in</strong>, H<strong>and</strong>book of contemporary<br />
learn<strong>in</strong>g theories. Mahwah, NJ: Lawrence Erlbaum<br />
Associates.<br />
Dick<strong>in</strong>son, A., & Burke, J. (1996). With<strong>in</strong>-compound<br />
associations mediate the retrospective revaluation of<br />
<strong>causal</strong>ity judgments. The Quarterly Journal of<br />
Experimental Psychology, 49B (1), 60-80.<br />
Griffiths, T. L., & Tenenbaum, J. B. (2005). Structure<strong>and</strong><br />
strength <strong>in</strong> <strong>causal</strong> <strong>in</strong>duction. <strong>Cognitive</strong> Psychology, 51,<br />
334-384.<br />
Hull, C. L. (1952). A behavior system: An <strong>in</strong>troduction to<br />
behavior theory concern<strong>in</strong>g the <strong>in</strong>dividual organism. New<br />
Haven, CT: Yale University Press.<br />
Kruschke, J. K. (2008). Bayesian approaches to associative<br />
learn<strong>in</strong>g: From passive to active learn<strong>in</strong>g. Learn<strong>in</strong>g &<br />
Behavior, 36 (3), 210-226.<br />
Lu, H., Rojas, R. R., Becker, T., & Yuille, A. (2008).<br />
Sequential <strong>causal</strong> learn<strong>in</strong>g <strong>in</strong> humans <strong>and</strong> rats. In<br />
Proceed<strong>in</strong>gs of the 29th Annual Conference of the<br />
<strong>Cognitive</strong> Science Society.<br />
Miller, R. R., & Matzel, L. D. (1988). The comparator<br />
hypothesis: A response rule for the expression of<br />
associations. In G. H. Bower (Ed.), The Psychology of<br />
learn<strong>in</strong>g <strong>and</strong> motivation (Vol. 2). San Diego, CA:<br />
Academic Press.<br />
Rescorla, R. A., & Wagner, A. R. (1972). A theory of<br />
Pavlovian condition<strong>in</strong>g: Variations <strong>in</strong> the effectiveness of<br />
re<strong>in</strong>forcement <strong>and</strong> non-re<strong>in</strong>forcement. In A. H. Black, &<br />
W. F. Prokasy (Eds.), Classical condition<strong>in</strong>g II: Current<br />
research <strong>and</strong> theory. New York: Appleton-Century-Crofts.<br />
Sobel, D. M., Tenenbaum, J. B., & Gopnik, A. (2004).<br />
Children's <strong>causal</strong> <strong>in</strong>ferences from <strong>in</strong>direct evidence:<br />
Backwards block<strong>in</strong>g <strong>and</strong> Bayesian reason<strong>in</strong>g <strong>in</strong><br />
preschoolers. <strong>Cognitive</strong> Science, 28, 303-333.<br />
Stout, S. C., & Miller, R. R. (2007). Sometimes-compet<strong>in</strong>g<br />
cue retrieval (SOCR): A formalization of the comparator<br />
hypothesis. Psychological Review, 114 (3), 759-783.<br />
Van Hamme, L. J., & Wasserman, E. A. (1994). Cue<br />
competition <strong>in</strong> <strong>causal</strong>ity judgments: The role of<br />
nonpresentation of compound stimulus elements.<br />
Learn<strong>in</strong>g & Motivation, 25, 127-151.<br />
Wasserman, E. A., & Castro, L. (2005). Surprise <strong>and</strong><br />
change: Variations <strong>in</strong> the strength of present <strong>and</strong> absent<br />
cues <strong>in</strong> <strong>causal</strong> learn<strong>in</strong>g. Learn<strong>in</strong>g & Behavior, 33 (2), 131-<br />
146.