fossil fuel co2 and the angry climate beast - American Public Media
fossil fuel co2 and the angry climate beast - American Public Media
fossil fuel co2 and the angry climate beast - American Public Media

Create successful ePaper yourself
Turn your PDF publications into a flip-book with our unique Google optimized e-Paper software.
FOSSIL FUEL CO2<br />
AND<br />
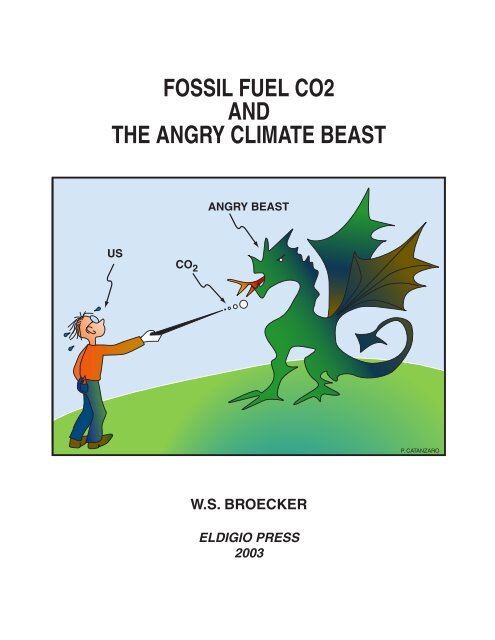
THE ANGRY CLIMATE BEAST<br />
US<br />
CO 2<br />
ANGRY BEAST<br />
W.S. BROECKER<br />
ELDIGIO PRESS<br />
2003<br />
P. CATANZARO
Lecture #1<br />
FOSSIL FUEL CO2 AND THE ANGRY CLIMATE BEAST<br />
Wallace S. Broecker<br />
Eighty-five percent of <strong>the</strong> world s energy is produced by burning coal, petroleum<br />
<strong>and</strong> natural gas. The carbon in this <strong>fossil</strong> <strong>fuel</strong> combines with oxygen from <strong>the</strong><br />
atmosphere to form carbon dioxide gas (i.e., CO2). As <strong>the</strong> result, since <strong>the</strong> onset of <strong>the</strong><br />
Industrial Revolution, <strong>the</strong> CO2 content of <strong>the</strong> atmosphere has risen from 280 to 370 parts<br />
per million. If <strong>the</strong> world continues along its business-as-usual pathway, a century from<br />
now CO2 could reach triple its pre-industrial content (i.e., 840 parts per million).<br />
Environmentalists consider <strong>the</strong> <strong>climate</strong> change which would likely accompany such a rise<br />
to be totally unacceptable. While <strong>the</strong> obvious solution is to turn to o<strong>the</strong>r sources of energy<br />
(i.e, solar, wind, nuclear, hydro, vegetation ), currently <strong>the</strong>se alternatives cannot<br />
compete with regard to price <strong>and</strong>/or capacity. Fur<strong>the</strong>r, even though global petroleum<br />
reserves will run short during <strong>the</strong> next 50 years, tar s<strong>and</strong>s, oil shales, <strong>and</strong> coal could be<br />
refined to take its place as sources of liquid <strong>fuel</strong>s. Hence, until some miracle<br />
breakthrough occurs, <strong>fossil</strong> <strong>fuel</strong>s will continue to dominate our energy supply during <strong>the</strong><br />
21 st century.<br />
To date, we have no proven way out of this dilemma. Energy consumption has<br />
been key to prosperity. Currently <strong>the</strong> average per capita CO2 production for <strong>the</strong> 6.5<br />
billion inhabitants of our planet is three tons of CO2 per year. As population rises <strong>and</strong> as<br />
<strong>the</strong> planet s poor achieve a better st<strong>and</strong>ard of living, global energy use will surely rise.<br />
Although we will become more efficient in our use of energy, this by itself is not a<br />
solution. Ra<strong>the</strong>r, if, for example, we were to attempt to prevent <strong>the</strong> atmosphere s CO2<br />
content from rising above 500 parts per million, emissions would have to be reduced to<br />
near zero during <strong>the</strong> latter half of this century. Storing carbon in trees <strong>and</strong> soil humus,<br />
while laudable, is also not <strong>the</strong> answer. The maximum capacity for such storage is only a<br />
1
small fraction of <strong>the</strong> amount of <strong>fossil</strong>-<strong>fuel</strong> carbon we are likely to burn. This being <strong>the</strong><br />
case, a backstop strategy must be created so that if <strong>fossil</strong> <strong>fuel</strong>s continue to dominate our<br />
energy supply <strong>and</strong> if <strong>the</strong> planet warms at <strong>the</strong> rate predicted by computer simulations, we<br />
have a means to bail ourselves out. Only one plausible safety net is currently on <strong>the</strong> table.<br />
As will be discussed in Lecture #3, it involves <strong>the</strong> capture <strong>and</strong> permanent storage of<br />
CO2 emitted by stationary power plants <strong>and</strong> also storage of CO2 removed from <strong>the</strong><br />
atmosphere. The development of such a backstop involves not only <strong>the</strong> creation of<br />
complex new technologies but also evaluations of environmental side effects, a workable<br />
plan for payments <strong>and</strong> global political agreements. Hence it is a task that will require two<br />
or more decades to accomplish. We must add to <strong>the</strong>se two or more decades <strong>the</strong> four or<br />
more decades which would be required to implement CO2 sequestration worldwide.<br />
Hence not only are we in a race against time but we start well behind <strong>the</strong> curve.<br />
Concern regarding <strong>the</strong> environmental impacts of excess atmospheric CO2 is based<br />
on computer simulations. Although predictions based on <strong>the</strong>se simulations are subject to<br />
large uncertainties, <strong>the</strong> majority of scientists accept <strong>the</strong>m as a useful guide to what a<br />
world with tripled CO2 could be like. However, a small, but highly vocal, minority of<br />
scientists rejects <strong>the</strong>se simulations claiming that <strong>the</strong>y greatly exaggerate <strong>the</strong> magnitude of<br />
<strong>the</strong> impacts. This is music to <strong>the</strong> ears of <strong>the</strong> Bush administration.<br />
These lectures will focus on an alternate way to look at this problem. The record<br />
of past <strong>climate</strong> changes sends us a startling message. During <strong>the</strong> last 12,000 years over<br />
which our civilization developed, <strong>climate</strong> has been relatively stable, but during <strong>the</strong><br />
preceding 100,000 years, it was a very bad actor undergoing abrupt reorganizations<br />
which resulted in large globe-wide impacts. The record of past <strong>climate</strong> found in polar ice;<br />
in marine sediments; in stalagmites; <strong>and</strong> in deposits created by mountain glaciers, is<br />
convincing in this regard. While we have some hot clues as to what may have triggered<br />
<strong>the</strong>se reorganizations, no one has been able to figure out why <strong>the</strong> <strong>climate</strong> system reacted<br />
so violently to <strong>the</strong>m. When <strong>the</strong> same models used to predict <strong>the</strong> consequences of excess<br />
2
CO2 are applied, <strong>the</strong>y produce temperature responses far smaller than those documented<br />
in <strong>the</strong> geologic record. This leads many of us to urge prudence. Our <strong>climate</strong> system has<br />
surely proven itself in <strong>the</strong> past to be an <strong>angry</strong> <strong>beast</strong>. We are poised to give it a nasty poke.<br />
Not a good idea!<br />
Production of <strong>fossil</strong> <strong>fuel</strong> CO2<br />
A good way to get a feel for <strong>the</strong> immense amount of CO2 produced by <strong>the</strong> burning<br />
of <strong>fossil</strong> <strong>fuel</strong>s is to consider your automobile. If it s an average sedan about one pound of<br />
CO2 comes out of <strong>the</strong> tail pipe for each mile you drive. The tank holds 12 gallons of<br />
gasoline (weighing close to 100 pounds or 45 kilograms). The combustion of this amount<br />
of gasoline produces 314 pounds (or 143 kilograms) of CO2 (see Figure 1). Even if <strong>the</strong>re<br />
were some way to capture it (which <strong>the</strong>re is not), you d have to find a place to dump it<br />
before your next trip to <strong>the</strong> gas station.<br />
With this in mind, it is not difficult to comprehend that as an average <strong>American</strong><br />
your share of <strong>fossil</strong> <strong>fuel</strong> burning adds up to <strong>the</strong> release of a staggering 22 tons of CO2<br />
during <strong>the</strong> course of a single year. Taken toge<strong>the</strong>r, your 290 million fellow U.S. residents<br />
produce <strong>the</strong> gr<strong>and</strong> total of about 6 billion tons of CO2 each year (see Figure 2).<br />
Fortunately, our neighbors in o<strong>the</strong>r developed countries use energy more<br />
sparingly <strong>and</strong> consequently <strong>the</strong>ir per capita CO2 generation rates are about 60 percent of<br />
our own. In developing countries a large fraction of <strong>the</strong> people remain too poor to afford<br />
<strong>fossil</strong> <strong>fuel</strong> energy. However, as is <strong>the</strong> case in China <strong>and</strong> India, this situation is changing<br />
very rapidly. Taken toge<strong>the</strong>r, <strong>the</strong> aggregate production of CO2 by <strong>the</strong> world s inhabitants<br />
now averages three tons per year (see Figure 2).<br />
Future <strong>fossil</strong> <strong>fuel</strong> use will depend on three things:<br />
1) global population<br />
2) per capita energy use<br />
3) <strong>the</strong> fraction of this energy derived from <strong>fossil</strong> <strong>fuel</strong>s.<br />
3
Figure 1<br />
CO 2 PRODUCTION BY AUTOMOBILES<br />
H 2 O + CO 2<br />
12 GAL.<br />
CH 2 + 1.5 O 2 CO 2 + H 2 O<br />
100<br />
POUNDS<br />
342<br />
POUNDS<br />
314<br />
POUNDS<br />
~ 1 POUND OF CO 2 PER MILE !<br />
128<br />
POUNDS<br />
12 GAL. GASOLINE WEIGHS ~ 100 POUNDS (45 KILOGRAMS)<br />
CO2 PRODUCED<br />
314 POUNDS (143 KILOGRAMS)<br />
26 MILES / GALLON X 12 GALLONS = 312 MILES (502 KILOMETERS)<br />
O 2
Figure 2<br />
AS OF THE YEAR 2000<br />
WORLD 6.5 x 10 9 PEOPLE<br />
3 TONS CO 2 / PERSON YEAR<br />
~20 x 10 9 TONS CO 2 / YEAR<br />
USA 0.3 x 10 9 PEOPLE<br />
CO 2 BUDGET<br />
2 x 10 9<br />
TONS / YR<br />
TAKEN UP BY VEGETATION<br />
20 TONS CO 2 / PERSON YEAR<br />
6 x 10 9 TONS CO 2 / YEAR<br />
20 x 10 9 TONS / YR<br />
PRODUCED BY BURNING FOSSIL FUELS<br />
10 x 10 9 TONS / YR<br />
REMAINS IN THE ATMOSPHERE<br />
8 x 10 9 TONS / YR<br />
SUCKED UP BY<br />
THE SEA<br />
CAUSES ATM. CO 2 CONTENT TO RISE<br />
BY 1.7 PARTS PER MILLION / YEAR
At least for <strong>the</strong> next 50 years 1) <strong>and</strong> 3) can be predicted reasonably well. Global<br />
population is expected to rise to between 9 <strong>and</strong> 10 billion by <strong>the</strong> year 2050 <strong>and</strong> <strong>fossil</strong><br />
<strong>fuel</strong>s will very likely remain <strong>the</strong> world s dominant source of energy. However, 2) has a<br />
large uncertainty for it depends on how rapidly <strong>the</strong> world s impoverished people reach<br />
<strong>the</strong> main stream of <strong>the</strong> world economy. If, as we all hope, during <strong>the</strong> next 50 years<br />
poverty is largely eliminated, per capita energy use will surely rise for <strong>the</strong> increase in<br />
energy use by <strong>the</strong> world s have nots will greatly eclipse any savings achieved by <strong>the</strong><br />
haves. For example, in 50 years if <strong>the</strong> average global per capita energy use were to rise<br />
to one half that in <strong>the</strong> USA (i.e., 10 tons of CO2 per person per year), if population were<br />
10 billion <strong>and</strong> if <strong>fossil</strong> <strong>fuel</strong> share of energy production were to remain at 85 percent, <strong>the</strong><br />
amount of CO2 produced each year would rise by a factor of<br />
10 10<br />
× or ~5<br />
3 6.<br />
5<br />
Of course this assumes that by that time <strong>the</strong> dire poverty suffered by so many humans<br />
will be largely eliminated.<br />
Fate of <strong>fossil</strong> <strong>fuel</strong> CO2<br />
To date only about half of <strong>the</strong> CO2 generated by <strong>the</strong> burning of <strong>fossil</strong> <strong>fuel</strong>s has<br />
remained in <strong>the</strong> atmosphere. This fraction is determined by comparing <strong>the</strong> amount by<br />
which <strong>the</strong> atmosphere s CO 2 inventory has increased with <strong>the</strong> amount of carbon<br />
recovered from <strong>the</strong> Earth in <strong>the</strong> form of coal, petroleum <strong>and</strong> natural gas. Only two o<strong>the</strong>r<br />
carbon reservoirs of importance exist into which <strong>the</strong> o<strong>the</strong>r half of <strong>the</strong> combustion CO2<br />
might have gone, i.e., <strong>the</strong> ocean <strong>and</strong> <strong>the</strong> terrestrial biosphere (see Figure 2). The ocean<br />
takes up significant amounts of CO2 because its dissolved salt contains carbonate ions.<br />
These ions are able to react with CO2 molecules to form bicarbonate ions (CO2 + CO = 3 +<br />
H2O → 2HCO − 3 ). Therefore <strong>the</strong> ocean has been able to absorb some of <strong>the</strong> atmosphere s<br />
extra CO2. Prior to <strong>the</strong> Industrial Revolution, <strong>the</strong> ocean <strong>and</strong> atmosphere had achieved a
happy balance; just as many CO2 molecules left <strong>the</strong> sea for residence in <strong>the</strong> atmosphere<br />
as left <strong>the</strong> atmosphere for residence in <strong>the</strong> sea. However, with <strong>the</strong> advent of <strong>fossil</strong> <strong>fuel</strong><br />
burning <strong>the</strong> balance was upset. More CO2 now enters <strong>the</strong> sea than escapes. These extra<br />
CO2 molecules are retained in solution by reaction with <strong>the</strong> sea s carbonate ions.<br />
The situation in <strong>the</strong> terrestrial biosphere is more complicated. Because of<br />
extensive deforestation, it might be expected that this global reservoir has been dwindling<br />
ra<strong>the</strong>r than growing. However, <strong>the</strong>re is reason to believe that loss by deforestation has<br />
been more than offset by <strong>the</strong> fact that our remaining forests appear to be packing away<br />
carbon atoms at a greater rate than <strong>the</strong>y did prior to <strong>the</strong> Industrial Revolution. A plausible<br />
explanation is <strong>the</strong> enhanced availability of two of <strong>the</strong> basic ingredients for plant growth<br />
(i.e., CO2 <strong>and</strong> fixed nitrogen). As <strong>the</strong> result of <strong>fossil</strong> <strong>fuel</strong> burning, <strong>the</strong> atmosphere now<br />
has more CO2 than before. Forests receive extra fixed nitrogen as <strong>the</strong> result of<br />
evaporation of part of <strong>the</strong> ammonia added as fertilizer to farml<strong>and</strong>s <strong>and</strong> as <strong>the</strong> result of<br />
production of nitrogen oxides (NO, N2O) in automobile engines. This airborne fixed<br />
nitrogen is subsequently incorporated into raindrops <strong>and</strong> by this route some of it gets<br />
deposited in forests.<br />
It must be pointed out that even though <strong>the</strong> vast majority of <strong>the</strong> Earth s nitrogen<br />
resides in <strong>the</strong> atmosphere as N2, this huge reservoir is unavailable for use by higher<br />
plants. Only a few species of microorganisms which live symbiotically on <strong>the</strong> roots of<br />
certain plants have enzymes capable of breaking <strong>the</strong> strong N2 bond. Plants such as<br />
clover feed <strong>the</strong>se microbes with root exudates <strong>and</strong> in return receive fixed nitrogen.<br />
Ralph Keeling, now a scientist at <strong>the</strong> University of California, while a graduate<br />
student, came up with a very clever means of assessing contributions of <strong>the</strong> ocean <strong>and</strong> of<br />
<strong>the</strong> terrestrial biosphere to <strong>the</strong> removal of CO2 from <strong>the</strong> atmosphere. Following in <strong>the</strong>
footsteps of his fa<strong>the</strong>r Charles David Keeling, who has kept track of <strong>the</strong> atmosphere s<br />
rising CO2 content since 1958, Ralph took on <strong>the</strong> very difficult task of measuring <strong>the</strong> rate<br />
of depletion of O2 from <strong>the</strong> atmosphere. This is far more difficult because <strong>the</strong>re is so<br />
much more O2 (210,000 ppm) than CO2 (370 ppm) in <strong>the</strong> atmosphere. Since 1990 Ralph<br />
has accurately monitored <strong>the</strong> decline of O2. Taken toge<strong>the</strong>r, <strong>the</strong> rise in CO2 <strong>and</strong> <strong>the</strong> drop<br />
in O2 allow <strong>the</strong> fate of <strong>fossil</strong> <strong>fuel</strong> CO2 to be partitioned among <strong>the</strong> atmosphere, ocean <strong>and</strong><br />
terrestrial biosphere (see Figure 3).<br />
To see how this is done requires an underst<strong>and</strong>ing of <strong>the</strong> graph shown in Figure 4.<br />
On <strong>the</strong> vertical axis is plotted <strong>the</strong> atmosphere s O 2 content <strong>and</strong> on <strong>the</strong> horizontal axis its<br />
CO2 content. Instead of plotting <strong>the</strong> actual amounts, only <strong>the</strong> changes in <strong>the</strong> amounts are<br />
shown. Thus, <strong>the</strong> red dot in <strong>the</strong> upper left-h<strong>and</strong> corner corresponds to <strong>the</strong> starting point of<br />
<strong>the</strong> measurement series (i.e., January 1, 1989). The second red dot shows <strong>the</strong> changes<br />
which had occurred as of January 1, 2003. During this 13-year period, <strong>the</strong> atmosphere s<br />
O2 dropped by about 49 parts per million <strong>and</strong> its CO2 content rose about 20 parts per<br />
million. Based on <strong>the</strong> amounts of coal, petroleum <strong>and</strong> natural gas burned during this<br />
period <strong>the</strong> changes expected if <strong>the</strong> atmosphere were a closed reservoir (i.e., it did not<br />
communicate with <strong>the</strong> ocean or with <strong>the</strong> terrestrial biosphere) can be estimated. The O2<br />
drop would have been 56 parts per million <strong>and</strong> <strong>the</strong> CO2 rise would have been 40 parts per<br />
million. The white dot shows this composition. The ratio of 56 ppm to 40 ppm (i.e., ~1.4)<br />
reflects <strong>the</strong> mix of <strong>fuel</strong>s (see Figure 5). To burn coal requires 1.17 molecules of oxygen<br />
per atom of carbon; to burn petroleum 1.44 molecules of O2 per carbon atom, <strong>and</strong> to burn<br />
natural gas 1.95 molecules of O2 per carbon atom. It turns out that over this 13-year<br />
period <strong>the</strong> CO2 rise was only about half of that expected <strong>and</strong> <strong>the</strong> O2 drop only about<br />
seven eights of that expected. Two routes are available to get from <strong>the</strong> white dot to <strong>the</strong>
ATMOSPHERIC CO2 RECORD<br />
Figure 3<br />
CO 2 CONCENTRATION (ppm)<br />
380<br />
375<br />
370<br />
365<br />
360<br />
355<br />
350<br />
345<br />
340<br />
335<br />
330<br />
325<br />
320<br />
315<br />
310<br />
DELTA O 2 / N 2 (per meg)<br />
CO 2 (ppm)<br />
MAUNA LOA OBSERVATORY, HAWAII<br />
1958 60 62 64 66 68 70 72 74 76 78 80 82 84 86 88 90 92 94 96 98 00 02 04 YEAR<br />
0<br />
-40<br />
-80<br />
-120<br />
-160<br />
-200<br />
-240<br />
-280<br />
-320<br />
-360<br />
384<br />
376<br />
368<br />
360<br />
352<br />
344<br />
FLASK DATA<br />
FITTED CURVES<br />
LA JOLLA, CALIFORNIA<br />
1989 90 91 92 93 94 95 96 97 98 99 00 01 02 03<br />
YEAR
Figure 4<br />
DECREASE IN O 2 (ppm)<br />
INCREASE IN CO2 (ppm)<br />
0 10<br />
0<br />
1989<br />
20 30 40 50<br />
10<br />
20<br />
30<br />
40<br />
50<br />
60<br />
70<br />
CHANGE IN<br />
ATMOSPHERE<br />
IN 13 YEARS<br />
FOSSIL FUEL BURNING<br />
& CEMENT PRODUCTION<br />
O2 / CO2 = -1.4<br />
2002<br />
BIOMASS INCREASE<br />
O2 / CO2 = -1.1 OCEAN UPTAKE<br />
O2 / CO2 = 0<br />
50%<br />
ATM<br />
15<br />
BIOS<br />
35<br />
OCEAN
Figure 5<br />
SOLID FUELS<br />
COAL, LIGNITE...<br />
LIQUID FUELS<br />
GASOLINE, KEROSENE....<br />
GASEOUS FUELS<br />
METHANE, PROPANE<br />
FLARING<br />
CEMENT<br />
ALL TOGETHER<br />
O 2/CO 2<br />
1.17<br />
1.44<br />
1.95<br />
1.98<br />
0.00<br />
1.39<br />
PERCENT OF<br />
CO 2 EMISSIONS<br />
36.8<br />
41.6<br />
18.0<br />
0.6<br />
3.0<br />
100
ed dot. One is horizontal <strong>and</strong> to <strong>the</strong> left representing uptake of CO2 by <strong>the</strong> ocean. The<br />
o<strong>the</strong>r is diagonal representing enhanced photosyn<strong>the</strong>sis (CO2 + H2O → O2 + CH2O) (up<br />
<strong>and</strong> to <strong>the</strong> left) <strong>and</strong> deforestation (O2 + CH2O → CO2 + H2O) (down <strong>and</strong> to <strong>the</strong> right)<br />
(mostly in <strong>the</strong> temperate zone). As <strong>the</strong> red point clearly lies above <strong>the</strong> white one, extra<br />
forest growth must have more than compensated for deforestation. The result is that 50<br />
percent of <strong>the</strong> CO2 produced during this 13-year period remained in <strong>the</strong> air <strong>and</strong> 35<br />
percent went into <strong>the</strong> ocean. The remaining 15 percent represents <strong>the</strong> difference between<br />
enhanced biomass storage on <strong>the</strong> one h<strong>and</strong> <strong>and</strong> deforestation on <strong>the</strong> o<strong>the</strong>r. 1<br />
How will <strong>the</strong> partitioning of excess CO2 among <strong>the</strong>se three reservoirs evolve as<br />
ever more <strong>fossil</strong> <strong>fuel</strong>s are burned? The fraction taken up by <strong>the</strong> ocean will slowly wane.<br />
One reason is that <strong>the</strong> ocean s carbonate ion inventory is being consumed through<br />
reaction with excess CO2. This will reduce <strong>the</strong> ocean s capacity for additional CO2<br />
uptake. The o<strong>the</strong>r reason is that as <strong>the</strong> Earth warms, <strong>the</strong> contrast in density between <strong>the</strong><br />
warm upper waters <strong>and</strong> <strong>the</strong> cold deep waters of <strong>the</strong> ocean will increase. This will lead to a<br />
reduction in <strong>the</strong> already slow rate of mixing between <strong>the</strong>se two realms. In fact, <strong>the</strong><br />
ongoing decline in ocean O2 suggests that a decrease in <strong>the</strong> rate of vertical mixing is<br />
already underway.<br />
The situation for <strong>the</strong> terrestrial biosphere is less clear. While plant fertilization by<br />
excess atmospheric CO2 <strong>and</strong> by extra fixed nitrogen should continue to foster increased<br />
storage of carbon in trees <strong>and</strong> in soil humus, a second factor will work in <strong>the</strong> opposite<br />
direction. The amount of humus in soils depends not only on how much new humus is<br />
created by decaying plant matter but also on how long <strong>the</strong> humus survives destruction.<br />
1 The presentation in Figure 4 has been simplified in order to make it more easily understood. For example,<br />
a small release of oxygen from <strong>the</strong> ocean to atmosphere is not shown nor explained. Also, <strong>the</strong> use of parts<br />
per million units for O2 is an approximation since Keeling s measurements are of <strong>the</strong> O2 to N2 ratio <strong>and</strong> not<br />
O2 to total air ratio. However, <strong>the</strong> graph is constructed to yield Keeling s conclusions regarding <strong>the</strong> fate of<br />
<strong>the</strong> CO2 released by our activities (i.e. <strong>fossil</strong> <strong>fuel</strong> burning <strong>and</strong> <strong>the</strong> manufacture of lime for cement).
The survival time depends on soil temperature. The warmer <strong>the</strong> soil, <strong>the</strong> more rapidly <strong>the</strong><br />
humus is eaten by soil organisms. So, as <strong>the</strong> globe warms, <strong>the</strong> lifetime of organic<br />
compounds which make up humus is likely to shorten <strong>and</strong> <strong>the</strong>reby tend to reduce <strong>the</strong> total<br />
inventory of carbon in soils. Unfortunately, we know too little about <strong>the</strong>se competing<br />
influences to say with any confidence which will gain <strong>the</strong> upper h<strong>and</strong>.<br />
The biggest wild card in connection with carbon partitioning among <strong>the</strong> various<br />
reservoirs is deforestation. Were <strong>the</strong>re no deforestation, <strong>the</strong>n Ralph Keeling s diagram<br />
would look quite different. The terrestrial biosphere s role in uptake of <strong>fossil</strong> <strong>fuel</strong> CO2<br />
would be more like 30 percent of <strong>the</strong> total. Thus, as time goes on, a critical element in <strong>the</strong><br />
carbon budget will relate to forest preservation.<br />
As <strong>the</strong> situations for both <strong>the</strong> ocean <strong>and</strong> <strong>the</strong> terrestrial biosphere are complex,<br />
reliable prediction of future partitioning of <strong>the</strong> excess CO2 generated by <strong>fossil</strong> <strong>fuel</strong><br />
burning currently lies beyond our reach. However, we do know enough to say <strong>the</strong> fifty-<br />
fifty split between <strong>the</strong> atmosphere on <strong>the</strong> one h<strong>and</strong> <strong>and</strong> <strong>the</strong> ocean plus terrestrial<br />
biosphere on <strong>the</strong> o<strong>the</strong>r will change only slowly. If so, by 2050 <strong>the</strong> CO2 content of our<br />
atmosphere will likely have climbed to more than 500 ppm.<br />
At <strong>the</strong> end of <strong>the</strong> last section, we estimated that if <strong>fossil</strong> <strong>fuel</strong>s continued to<br />
dominate <strong>the</strong> energy market <strong>and</strong> if poverty were to be largely conquered, <strong>the</strong>n over <strong>the</strong><br />
next 50 years global energy use could rise 5 fold. Currently, <strong>the</strong> atmosphere CO2 content<br />
is rising at <strong>the</strong> rate of 1.7 ppm per year. Assuming that <strong>the</strong> 50-50 split between<br />
atmosphere versus ocean plus terrestrial biosphere prevails, <strong>the</strong>n by 2050, <strong>the</strong> annual CO2<br />
rise in atmospheric CO2 content would be more like 8 ppm per year. Were <strong>the</strong> 8 ppm per<br />
year increase to prevail for a half century (say 2050 to 2100 AD), <strong>the</strong> atmosphere s CO 2
content would increase by ano<strong>the</strong>r 400 ppm. Hence, one cannot dismiss <strong>the</strong> likelihood<br />
that <strong>the</strong> atmosphere s CO 2 content will triple by <strong>the</strong> end of <strong>the</strong> 21 st century (see Figure 6).<br />
Climatic impacts of <strong>fossil</strong> <strong>fuel</strong> CO2<br />
The Earth s mean temperature is not only set by <strong>the</strong> amount of sunlight reaching<br />
<strong>the</strong> upper atmosphere, but also by <strong>the</strong> fraction of this sunlight which is reflected back to<br />
space <strong>and</strong> <strong>the</strong> amount of outgoing earth light which is captured by greenhouse gases <strong>and</strong><br />
particulates (see Figure 7). Were <strong>the</strong>re no reflection <strong>and</strong> no greenhouse gases, <strong>the</strong> Earth<br />
temperature would average +5°C. As summarized in Figure 8, <strong>the</strong> cooling due to<br />
reflection is more than offset by <strong>the</strong> warming due to our greenhouse blanket <strong>and</strong> hence<br />
<strong>the</strong> Earth s average temperature is 15°C ra<strong>the</strong>r than 5°C. Our activities are impacting<br />
both <strong>the</strong> planet s reflectivity <strong>and</strong> its greenhouse capacity. Extra CO2, CH4 <strong>and</strong> also extra<br />
dark particulates capture <strong>and</strong> <strong>the</strong>n re-radiate outgoing infrared radiation <strong>and</strong> <strong>the</strong>reby tend<br />
to warm <strong>the</strong> Earth. Extra white aerosols (mainly H 2SO4 created by <strong>the</strong> oxidation of <strong>the</strong><br />
SO2 released as a byproduct of coal burning) tend to cool <strong>the</strong> Earth.<br />
Of <strong>the</strong>se atmospheric changes, that of CO2 poses <strong>the</strong> greatest concern. The reason<br />
is that, unlike particulates <strong>and</strong> aerosols which remain airborne only days to weeks, <strong>and</strong><br />
methane which survives oxidation to CO2 <strong>and</strong> H2O for about one decade, <strong>the</strong> lifetime of<br />
CO2 in <strong>the</strong> atmosphere is measured in hundreds of years. Fur<strong>the</strong>r, as we have already<br />
seen, CO2 is a necessary byproduct of our industrial civilization.<br />
Were <strong>the</strong> water vapor content of <strong>the</strong> atmosphere to remain unchanged, <strong>the</strong>n a<br />
tripling of CO2 would produce an average warming of close to 2°C. However, when<br />
simulated in global models, <strong>the</strong> warming is more like 5°C (see Figure 9). The reason is<br />
that water vapor serves as an amplifier (i.e., a positive feedback). As <strong>the</strong> Earth warms, <strong>the</strong><br />
vapor pressure of water rises allowing <strong>the</strong> atmosphere to hold more water vapor. Keeping
Figure 6<br />
YEAR ATM CO2 1800 280 ppm<br />
1957<br />
315 ppm<br />
2000 365 ppm<br />
IF POPULATION LEVELS OFF AT 10 BILLION<br />
IF FOSSIL FUELS CONTINUE TO SUPPLY 85%<br />
OF GLOBAL ENERGY<br />
IF PER CAPITA ENERGY USE RISES THREE FOLD<br />
(POVERTY LARGELY ELIMINATED)<br />
IF 50% OF CO2 REMAINS IN ATMOSPHERE<br />
THEN ANNUAL CO2 RISE WILL BE<br />
1.7 x<br />
IF THIS GOES ON FOR 50 YEARS<br />
10<br />
ppm<br />
x 3 = 7.8<br />
6.5 year<br />
50 x 7.8 ~<br />
= 400 ppm RISE IN CO2 (2050 TO 2100)
Figure 7<br />
REFLECTION<br />
SEA<br />
ICE<br />
"BLACK"<br />
AEROSOL<br />
OCEAN<br />
SUN<br />
GG*<br />
"WHITE"<br />
AEROSOL<br />
, CO2, N2O, CFCs, O3<br />
CLOUDS<br />
REFLECTION
Figure 8<br />
PREINDUSTRIAL SITUATION<br />
NO REFLECTION, NO<br />
GREENHOUSE GASES<br />
REFLECTIVE COOLING<br />
CLOUDS, SNOW, SOIL.......<br />
GREENHOUSE WARMING<br />
H2O, CO2 , CH4 .........<br />
ACTUAL EARTH<br />
MEAN GLOBAL<br />
TEMPERATURE<br />
+5 C<br />
-25 C<br />
+35 C<br />
+15 C
MODELS<br />
LINDZEN<br />
Figure 9<br />
MAN'S CHANGES<br />
IF CO 2 WERE TO TRIPLE, i.e. 280 TO 840 ppm<br />
T NO FEEDBACKS<br />
T WITH WATER VAPOR FEEDBACK<br />
T WITH WATER VAPOR FEEDBACK<br />
OTHER PERTURBATIONS<br />
GREENHOUSE ENTITIES (WARM)<br />
CH 4 , N 2 O, SOOT......<br />
REFLECTIVITY ENTITIES (COOL)<br />
SO 2 + 1/2 O 2 + H 2 O H 2 SO 4<br />
MEAN GLOBAL<br />
TEMPERATURE CHANGE<br />
~ + 2 C<br />
~ + 5 C<br />
~ + 0 C<br />
WHITE<br />
AEROSOLS<br />
CLOUD<br />
CONDENSATION<br />
NUCLEII
in mind that water vapor is <strong>the</strong> Earth s dominant greenhouse gas, <strong>the</strong> more water vapor in<br />
<strong>the</strong> atmosphere, <strong>the</strong> warmer <strong>the</strong> Earth.<br />
MITs Richard Lindzen is <strong>the</strong> guru for a group strongly opposed to any action<br />
aimed at stemming <strong>the</strong> buildup of CO2 in our atmosphere. Lindzen claims that instead of<br />
amplifying <strong>the</strong> warming, changes in water vapor will largely null it. While agreeing that<br />
<strong>the</strong> water vapor content of <strong>the</strong> tropical air column will increase as <strong>the</strong> Earth warms,<br />
Lindzen is convinced that <strong>the</strong> water vapor content of <strong>the</strong> air over <strong>the</strong> Earth s desert<br />
regions will decrease. Fur<strong>the</strong>r, because clear skies prevail over deserts, <strong>the</strong>se regions<br />
constitute <strong>the</strong> primary escape hatch for outward-bound infrared light. Hence, Lindzen<br />
contends that because water vapor increases everywhere in model simulations, <strong>the</strong>se<br />
models must be seriously flawed. He believes instead that over desert regions water vapor<br />
will decrease, <strong>the</strong>reby opening wider <strong>the</strong> escape hatch for outgoing radiation. As one of<br />
<strong>the</strong> world s premier atmospheric physicists, his claim cannot be disregarded. Thus he gets<br />
lots of press. However, to calibrate Professor Lindzen, it must be said that in private<br />
conversations, he also denies <strong>the</strong> reliability of studies which link cancer to cigarette<br />
smoking. Hence, he is clearly a contrarian who enjoys challenging establishment<br />
thinking. While no one pays any attention to his claims regarding lung cancer, his views<br />
on <strong>climate</strong> carry a lot of weight.<br />
O<strong>the</strong>r changes in <strong>the</strong> cycle of atmospheric water vapor may well take place. Not<br />
only do <strong>the</strong> sulfuric acid aerosols produced in <strong>the</strong> atmosphere by <strong>the</strong> oxidation of SO2 gas<br />
reflect away sunlight but <strong>the</strong>y also act as cloud condensation nuclei. Raindrops can only<br />
form if <strong>the</strong>y have something to form around (i.e., a condensation nucleus). The more<br />
nuclei available in a cloud, <strong>the</strong> more cloud droplets that will form. However, as <strong>the</strong>re is<br />
only so much water vapor available for condensation, <strong>the</strong> more nuclei, <strong>the</strong> smaller <strong>the</strong><br />
1
drops will be. Drop size has two impacts. First, many smaller droplets are more reflective<br />
than fewer large ones; hence sulfuric acid aerosols can also cool <strong>the</strong> Earth by increasing<br />
cloud reflectivity. Second, smaller droplets fall more slowly <strong>and</strong> hence are more subject<br />
to transport by wind than large droplets. In this way, sulfuric acid aerosols could<br />
contribute to a significant redistribution of precipitation on our planet.<br />
A striking example of <strong>the</strong> impact of extra cloud condensation nuclei is shown in<br />
Figure 10. The bright streaks in this aerial photograph of low cloud cover off <strong>the</strong> west<br />
coast of North America are created by smoke rising from passing ships. Where <strong>the</strong> smoke<br />
plume intersects <strong>the</strong> clouds, more condensation nuclei are available. Hence, <strong>the</strong> droplets<br />
are smaller <strong>and</strong> <strong>the</strong> clouds more reflective. Ano<strong>the</strong>r example is <strong>the</strong> contrails left behind<br />
by high flying jet aircraft. During <strong>the</strong> week-long shutdown of air travel after <strong>the</strong> World<br />
Trade Tower disaster, <strong>the</strong> day-night temperature contrast over <strong>the</strong> U.S. increased by 1°C.<br />
This change was <strong>the</strong> result of <strong>the</strong> short term absence of contrails produced by jet aircraft,<br />
thus incresing <strong>the</strong> nighttime loss of Earth heat to space (i.e., night-time cooling).<br />
Although <strong>the</strong> majority of scientists concerned with global warming disagree with<br />
Lindzen, <strong>the</strong>y admit that model simulations, no matter how sophisticated, do have serious<br />
limitations. While all such simulations yield an amplification of <strong>the</strong> CO2 warming by<br />
increased water vapor, <strong>the</strong> magnitude of this amplification differs from model to model.<br />
Fur<strong>the</strong>r, <strong>the</strong> agreement among models regarding <strong>the</strong> magnitude of future <strong>climate</strong> changes<br />
for a given region of <strong>the</strong> Earth is not nearly as good as that for <strong>the</strong> global average. For<br />
example, while all models predict a melting of a large fraction of <strong>the</strong> of Arctic s sea ice<br />
<strong>and</strong> a thawing of <strong>the</strong> Arctic s tundra, <strong>the</strong>y give a wide range for <strong>the</strong> rate at which <strong>the</strong>se<br />
reductions will occur. Ano<strong>the</strong>r example is that while all models predict that warming will<br />
bring with it increases in global rainfall rate, <strong>the</strong>y also predict increases in <strong>the</strong> loss of soil
BRIGHT STREAKS IN LOW CLOUDS OFF OREGON AND WASHINGTON<br />
Figure 10
moisture through evaporation. Since moist soils are a prerequisite for agricultural<br />
productivity, it matters much whe<strong>the</strong>r extra rainfall or extra evaporation is <strong>the</strong> more<br />
important in any given region. Unfortunately, this difference is something that depends<br />
on <strong>the</strong> details of <strong>the</strong> particular model. Hence, it is not clear whe<strong>the</strong>r agricultural<br />
productivity in <strong>the</strong> world s breadbaskets (i.e., <strong>the</strong> interiors of Europe, Asia, Africa <strong>and</strong><br />
North America) will increase or decrease as a result of global warming. In <strong>the</strong> absence of<br />
consistent regional scale model predictions, it has proven difficult to get people s<br />
attention. As this situation is unlikely to improve appreciably in <strong>the</strong> near future, societies<br />
are stuck with making decisions in <strong>the</strong> face of ra<strong>the</strong>r large uncertainties.<br />
Is <strong>the</strong> planet getting warmer?<br />
An enormous effort has gone into analyzing temperature records from<br />
meteorological stations scattered across <strong>the</strong> globe. Although <strong>the</strong>se records become more<br />
sparse as one goes back in time, <strong>the</strong> consensus is that <strong>the</strong>y provide reasonably reliable<br />
estimates for <strong>the</strong> Earth s mean annual temperature back to about 1880 AD (see Figure<br />
11). The good news, for those who would like to believe predictions based on model<br />
simulations, is that during <strong>the</strong> last 25 years or so <strong>the</strong> planet s mean temperature has been<br />
increasing. Fur<strong>the</strong>r, <strong>the</strong> rate of this warming is broadly consistent with expectations from<br />
<strong>the</strong> models. However, <strong>the</strong>re are two o<strong>the</strong>r features of this record which detractors are<br />
quick to point out are not consistent with a greenhouse-gas-driven warming. The first<br />
occurred early this century when <strong>the</strong> planet underwent a warming as large as that during<br />
<strong>the</strong> last 25 years. No man-induced change has been proposed to account for this warming.<br />
Ra<strong>the</strong>r, it was very likely natural. The o<strong>the</strong>r feature of this record which doesn t fit <strong>the</strong><br />
greenhouse-gas scenario is <strong>the</strong> plateau in temperature from 1940 to 1975. Although more<br />
modest than that after 1975, increases in CO2 <strong>and</strong> o<strong>the</strong>r greenhouse gases during this<br />
2
TEMPERATURE ANOMALY (Celcius)<br />
0.8<br />
0.6<br />
0.4<br />
0.2<br />
-0.2<br />
Figure 11<br />
0<br />
MEAN GLOBAL<br />
SURFACE<br />
AIR TEMPERATURE<br />
-0.4<br />
1880 1900 1920 1940 1960 1980 2000<br />
YEAR
period should have resulted in a measurable warming. Thus <strong>the</strong> global mean <strong>climate</strong>, on<br />
its own, has been undergoing temporal changes comparable in magnitude to those<br />
predicted by simulations of <strong>the</strong> impact of man-made greenhouse gases. Hence, it is easy<br />
for detractors to attribute <strong>the</strong> entire temperature change since 1880 to natural causes.<br />
Natural recorders of temperature<br />
In order to get a sense of what Earth s <strong>climate</strong> has been doing on its own we must<br />
extend <strong>the</strong> record back much fur<strong>the</strong>r in time. A century is simply not long enough. To do<br />
this, we must turn to natural recorders of temperature which we in <strong>the</strong> field of<br />
paleo<strong>climate</strong> call proxies (see Sidebar #1). This turns out to be an extremely dem<strong>and</strong>ing<br />
task for <strong>the</strong> changes we seek to document are very small (i.e., no more than 1°C).<br />
Unfortunately, most of <strong>the</strong> available proxies are simply not up to <strong>the</strong> task.<br />
One that does meet <strong>the</strong> challenge is <strong>the</strong> extent of mountain glaciers. We know for<br />
sure that almost everywhere on <strong>the</strong> planet <strong>the</strong> tongues of ice streaming down from high<br />
mountains were much longer in <strong>the</strong> mid 1800s than <strong>the</strong>y are today. Consistent with a<br />
century of warming, <strong>the</strong>se tongues are slowly melting back. The evidence comes from<br />
paired photographs like those in Figure 12 from New Zeal<strong>and</strong> s Alps. Such pairs are<br />
available for dozens of glaciers from all parts of <strong>the</strong> planet. It turns out that <strong>the</strong>se glaciers<br />
serve as one of <strong>the</strong> most sensitive of all natural <strong>the</strong>rmometers. Indeed, so sensitive that<br />
<strong>the</strong>y can reflect a change in local air temperature as small as 0.2°C.<br />
While <strong>the</strong> most visible change in <strong>the</strong>se glaciers has been <strong>the</strong> retreat of <strong>the</strong>ir<br />
narrow snouts, <strong>the</strong> magnitude of <strong>the</strong> retreat is not simply related to temperature. Hence, it<br />
provides only qualitative information: <strong>the</strong> longer <strong>the</strong> snout, <strong>the</strong> colder <strong>the</strong> temperature. To<br />
get <strong>the</strong> actual magnitude of <strong>the</strong> temperature change, glaciologists measure <strong>the</strong> elevation<br />
of what <strong>the</strong>y refer to as <strong>the</strong> equilibrium snowline. Everywhere on <strong>the</strong> Earth <strong>the</strong> higher you