application of a taguchi-based neural network for forecasting and ...
application of a taguchi-based neural network for forecasting and ...
application of a taguchi-based neural network for forecasting and ...

Create successful ePaper yourself
Turn your PDF publications into a flip-book with our unique Google optimized e-Paper software.
UDK 621.9.025.5:620.191.35 ISSN 1580-2949<br />
Original scientific article/Izvirni znanstveni ~lanek MTAEC9, 46(5)471(2012)<br />
Y. KAZANCOGLU et al.: APPLICATION OF A TAGUCHI-BASED NEURAL NETWORK FOR FORECASTING ...<br />
APPLICATION OF A TAGUCHI-BASED NEURAL NETWORK FOR<br />
FORECASTING AND OPTIMIZATION OF THE SURFACE<br />
ROUGHNESS IN A WIRE-ELECTRICAL-DISCHARGE<br />
MACHINING PROCESS<br />
UPORABA TAGUCHIJEVE NEVRONSKE MRE@E ZA<br />
NAPOVEDOVANJE IN OPTIMIRANJE POVR[INSKE HRAPAVOSTI<br />
PRI POSTOPKU @I^NE EROZIJE<br />
Yigit Kazancoglu 1 , Ugur Esme 2 , Mustafa Kemal Kulekci 2 , Funda Kahraman 2 ,<br />
Ramazan Samur 3 , Adnan Akkurt 4 , Melih Turan Ipekci 5<br />
1 Izmir University <strong>of</strong> Economics, Department <strong>of</strong> Business Administration, 35330, Balcova-Izmir, Turkey<br />
2 Mersin University Tarsus Technical Education Faculty, Department <strong>of</strong> Mechanical Education, 33140 Tarsus-Mersin, Turkey<br />
3 Marmara University Technical Education Faculty, Department <strong>of</strong> Metal Education, 34722 Goztepe-Ýstanbul, Turkey<br />
4 Gazi University Industrial Arts Education Faculty, Department <strong>of</strong> Technological Education, 06830 Golbasi-Ankara, Turkey<br />
5Gazi University, Department <strong>of</strong> Mechanical Engineering, 06570 Maltepe-Ankara, Turkey<br />
uguresme@gmail.com<br />
Prejem rokopisa – received: 2012-02-16; sprejem za objavo – accepted <strong>for</strong> publication: 2012-06-01<br />
Wire-electrical-discharge machining (WEDM) is a modification <strong>of</strong> electro-discharge machining (EDM) <strong>and</strong> has been widely<br />
used <strong>for</strong> a long time <strong>for</strong> cutting punches <strong>and</strong> dies, shaped pockets <strong>and</strong> other machine parts on conductive materials. WEDM<br />
erodes workpiece materials by a series <strong>of</strong> discrete electrical sparks between the workpiece <strong>and</strong> an electrode flushed or immersed<br />
in a dielectric fluid. The WEDM process is particularly suitable <strong>for</strong> machining hard materials as well as complex shapes. In this<br />
paper, a <strong>neural</strong> <strong>network</strong> <strong>and</strong> the Taguchi design method have been implemented <strong>for</strong> minimizing the surface roughness in a<br />
WEDM process. A back-propagation <strong>neural</strong> <strong>network</strong> (BPNN) was developed to predict the surface roughness. In the<br />
development <strong>of</strong> a predictive model, machining parameters <strong>of</strong> open-circuit voltage, pulse duration, wire speed <strong>and</strong> dielectric<br />
flushing pressure were considered as the input model variables <strong>of</strong> the AISI 4340 steel. An analysis <strong>of</strong> variance (ANOVA) was<br />
used to determine the significant parameter affecting the surface roughness (Ra). Finally, the Taguchi approach was applied to<br />
determine the optimum levels <strong>of</strong> machining parameters.<br />
Keywords: WEDM, Taguchi-design method, <strong>neural</strong> <strong>network</strong>, surface roughness<br />
@i~na erozija (WEDM) je modifikacija potopne erozije (EDM) in se uporablja `e dolgo ~asa za izdelavo rezilnih in drugih<br />
orodij ter strojnih delov. WEDM erodira obdelovanec z iskrenjem med obdelovancem in elektrodo, ki se spira, oziroma je<br />
potopljena v dielektri~no teko~ino. WEDM-postopek je {e posebej primeren za obdelavo trdih materialov, kot tudi za<br />
kompleksne oblike. V tem ~lanku sta bili uporabljeni nevronska mre`a in Taguchijeva metoda na~rtovanja za zmanj{anje<br />
hrapavosti povr{ine. Pri razvoju modela za napovedovanje hrapavosti so bili upo{tevani parametri obdelave: elektri~na napetost,<br />
trajanje pulza, hitrost `ice in tlak dielektri~ne teko~ine za spiranje kot vhodne spremenljivke pri obdelavi jekla AISI 4340.<br />
Analiza variance (ANOVA) je bila uporabljena za dolo~anje vplivnih parametrov, ki vplivajo na povr{insko hrapavost (Ra). Na<br />
koncu je bil uporabljen Taguchijev pribli`ek za dolo~itev optimalnih parametrov procesa.<br />
Klju~ne besede: WEDM, Taguchi oblikovanje, nevronska mre`a, povr{inska hrapavost<br />
1 INTRODUCTION<br />
The technologies <strong>of</strong> the wire-electrical-discharge<br />
machining (WEDM) have been emphasized significantly<br />
<strong>and</strong> have improved rapidly in recent years due to the<br />
requirements in various manufacturing fields. WEDM is<br />
used to produce complex two- <strong>and</strong> three-dimensional<br />
shapes through electrically conductive workpieces by<br />
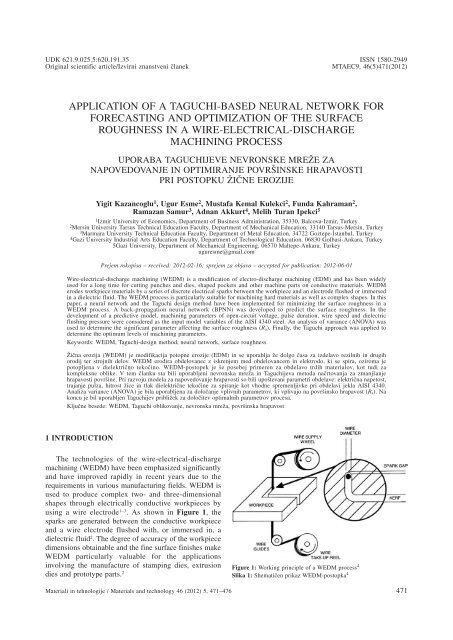
using a wire electrode 1–3 . As shown in Figure 1, the<br />
sparks are generated between the conductive workpiece<br />
<strong>and</strong> a wire electrode flushed with, or immersed in, a<br />
dielectric fluid 2 . The degree <strong>of</strong> accuracy <strong>of</strong> the workpiece<br />
dimensions obtainable <strong>and</strong> the fine surface finishes make<br />
WEDM particularly valuable <strong>for</strong> the <strong>application</strong>s<br />
involving the manufacture <strong>of</strong> stamping dies, extrusion<br />
dies <strong>and</strong> prototype parts. 2<br />
Figure 1: Working principle <strong>of</strong> a WEDM process 4<br />
Slika 1: Shemati~en prikaz WEDM-postopka 4<br />
Materiali in tehnologije / Materials <strong>and</strong> technology 46 (2012) 5, 471–476 471
Y. KAZANCOGLU et al.: APPLICATION OF A TAGUCHI-BASED NEURAL NETWORK FOR FORECASTING ...<br />
The most important per<strong>for</strong>mance measures in<br />
WEDM are cutting speed, workpiece surface roughness<br />
<strong>and</strong> cutting width. 2 Discharge current, discharge capacitance,<br />
pulse duration, pulse frequency, wire speed, wire<br />
tension, average working voltage <strong>and</strong> dielectric flushing<br />
conditions are the machining parameters that affect the<br />
per<strong>for</strong>mance measures. 1–4<br />
An optimization <strong>of</strong> the process parameters is the key<br />
step <strong>of</strong> the Taguchi method in achieving high quality<br />
without an increased cost. This is because an<br />
optimization <strong>of</strong> the process parameters can improve the<br />
quality, <strong>and</strong> the optimum process parameters obtained<br />
with the Taguchi method are insensitive to the variation<br />
<strong>of</strong> environmental conditions <strong>and</strong> other noise factors.<br />
Basically, the classical process-parameter design is<br />
complex <strong>and</strong> not easy to use. 5,6 An advantage <strong>of</strong> the<br />
Taguchi method is that it emphasizes the mean-per<strong>for</strong>mance<br />
characteristic value close to the target value rather<br />
than a value within certain specification limits, thus<br />
improving the product quality. Additionally, the Taguchi<br />
method <strong>for</strong> experimental design is straight<strong>for</strong>ward <strong>and</strong><br />
easy to apply to many engineering situations, making it a<br />
powerful yet simple tool. It can be used to quickly<br />
narrow the scope <strong>of</strong> a research project or to identify<br />
problems in a manufacturing process from the data<br />
already in existence. 5–8<br />
A large number <strong>of</strong> experiments have to be carried out<br />
when the number <strong>of</strong> the process parameters increases. To<br />
solve this task, the Taguchi method uses a special design<br />
<strong>of</strong> orthogonal arrays to study the entire process-parameter<br />
space with only a small number <strong>of</strong> experiments.<br />
Using an orthogonal array to design the experiment can<br />
help the designers to study the influence <strong>of</strong> multiple<br />
controllable factors on the average quality characteristics<br />
<strong>and</strong> variations in a fast <strong>and</strong> economic way, while using a<br />
signal-to-noise ratio (S/N) to analyze the experimental<br />
data can help the designers <strong>of</strong> a product, or a manufacturer,<br />
to easily find out optimum parametric combinations.<br />
5–8<br />
Investigations into the influences <strong>of</strong> the machining<br />
input parameters on the per<strong>for</strong>mance <strong>of</strong> WEDM have<br />
been widely reported. Huang et al. 1 determined the effect<br />
<strong>of</strong> the WEDM process parameters (pulse-on time,<br />
pulse-<strong>of</strong>f time, table feed rate, flushing pressure <strong>and</strong><br />
workpiece surface, <strong>and</strong> machining history) on the gap<br />
width, the surface roughness <strong>and</strong> the white layer depth <strong>of</strong><br />
a machined workpiece surface using the Taguchi method.<br />
Tosun et al. 2 investigated the effect <strong>and</strong> optimization <strong>of</strong><br />
the machining parameters on the cutting width <strong>and</strong> the<br />
material-removal rate (MRR) in WEDM <strong>based</strong> on the<br />
Taguchi method. The experimental studies were conducted<br />
with a varying pulse duration, open-circuit<br />
voltage, wire speed <strong>and</strong> dielectric flushing pressure.<br />
Mohammadi et al. 3 applied the statistical analysis <strong>of</strong><br />
WEDM turning on MRR using the Taguchi techniques.<br />
They considered the effects <strong>of</strong> the input parameters<br />
(power, time-<strong>of</strong>f, voltage, servo, wire speed, wire tension<br />
<strong>and</strong> rotational speed) on the responses (MRR, surface<br />
roughness). Lin et al. 9 investigated the effects <strong>of</strong> the<br />
machining parameters in electrical discharge machining<br />
on the machining characteristics <strong>of</strong> the SKH 57 highspeed<br />
steel. Moreover, they determined the optimum<br />
combination levels <strong>of</strong> the machining parameters <strong>based</strong><br />
on the Taguchi method. Tosun <strong>and</strong> Cogun 10 experimentally<br />
investigated the effects <strong>of</strong> the cutting parameters on<br />
the wire-electrode wear in WEDM. On the basis <strong>of</strong><br />
ANOVA <strong>and</strong> F-Test, they found that the most effective<br />
parameters <strong>of</strong> the wire-wear ratio are the open-circuit<br />
voltage <strong>and</strong> pulse durations.<br />
Tarng et al. 11 developed a <strong>neural</strong>-<strong>network</strong> system to<br />
determine the settings <strong>of</strong> pulse duration, pulse interval,<br />
peak current, open-circuit voltage, servo-reference<br />
voltage, electric capacitance <strong>and</strong> wire speed <strong>for</strong> an<br />
estimation <strong>of</strong> the cutting speed <strong>and</strong> the surface finish.<br />
Scott et al. 12 used a factorial-design method to determine<br />
the optimum combination <strong>of</strong> control parameters in<br />
WEDM, the measures <strong>of</strong> the machining per<strong>for</strong>mance<br />
being the MRR <strong>and</strong> the surface finish. It was found that<br />
discharge current, pulse duration <strong>and</strong> pulse frequency are<br />
significant control factors. Spedding <strong>and</strong> Wang 13 developed<br />
mathematical models using the response-surface<br />
methodology (RSM) <strong>and</strong> an artificial <strong>neural</strong> <strong>network</strong> in<br />
the WEDM process. They considered the effects <strong>of</strong> the<br />
input parameters (pulse width, time between two pulses,<br />
wire mechanical tension <strong>and</strong> wire-feed speed) on the<br />
responses (cutting speed <strong>and</strong> surface roughness). Yuan et<br />
al. 14 carried out a multi-objective optimization <strong>based</strong> on<br />
the Gaussian process regression to optimize the<br />
high-speed WEDM process, considering mean current,<br />
on-time <strong>and</strong> <strong>of</strong>f-time as the input parameters <strong>and</strong> MRR<br />
<strong>and</strong> surface roughness as the output responses. Kung <strong>and</strong><br />
Chiang 15 developed mathematical models using RSM to<br />
investigate the influences <strong>of</strong> the machining parameters<br />
on the per<strong>for</strong>mance characteristics <strong>of</strong> MRR <strong>and</strong> surface<br />
roughness in a WEDM process. Esme et al. 16 constructed<br />
both a mathematical model <strong>and</strong> a <strong>neural</strong>-<strong>network</strong> model<br />
to predict, reproduce <strong>and</strong> compare the types <strong>of</strong> surface<br />
roughness under different machining conditions. On the<br />
basis <strong>of</strong> a literature review some insight has been gained<br />
Table 1: Comparison between <strong>neural</strong> <strong>network</strong>s <strong>and</strong> the Taguchi design<br />
method 17<br />
Tabela 1: Primerjava med nevronskimi mre`ami in Taguchi metodo<br />
oblikovanja 17<br />
Comparison Neural <strong>network</strong>s Taguchi design<br />
Computational time Long Medium<br />
Model development Yes* No<br />
Optimization Through a model Straight<br />
Underst<strong>and</strong>ing Moderate Normal<br />
S<strong>of</strong>tware availability Available Available<br />
Optimization sensitivity High Normal<br />
Application rate (usage<br />
frequency)<br />
Frequent Rare<br />
* No factor-interaction effects<br />
472 Materiali in tehnologije / Materials <strong>and</strong> technology 46 (2012) 5, 471–476
into the use <strong>of</strong> <strong>neural</strong> <strong>network</strong>s <strong>and</strong> Taguchi design<br />
methods <strong>for</strong> modeling <strong>and</strong> optimizing different WEDM<br />
processes. The main advantage <strong>of</strong> the <strong>neural</strong>-<strong>network</strong><br />
method is that it provides modeling <strong>and</strong> predictions. The<br />
main advantage <strong>of</strong> the Taguchi design method is that it<br />
provides an optimization <strong>and</strong> analyzes the effect <strong>of</strong> each<br />
process parameter on the responses. Table 1 shows a<br />
comparison between <strong>neural</strong> <strong>network</strong>s <strong>and</strong> the Taguchi<br />
modeling <strong>and</strong> optimization method 17 .<br />
In the present work, two <strong>of</strong> the techniques, namely,<br />
the <strong>neural</strong> <strong>network</strong> with a back-propagation <strong>network</strong><br />
(BPN) <strong>and</strong> the Taguchi design method have been<br />
employed. Qwiknet 2.23 s<strong>of</strong>tware <strong>and</strong> Taguchi S<strong>of</strong>t<br />
program were used <strong>for</strong> the NN modeling <strong>and</strong> the Taguchi<br />
optimization technique, respectively. Open voltage, pulse<br />
duration, wire speed <strong>and</strong> dielectric flushing pressure<br />
were selected as the input factors, whereas surface<br />
roughness (Ra) was selected as the response. A BPN<br />
model was developed <strong>for</strong> the prediction <strong>of</strong> the surface<br />
roughness. An analysis-<strong>of</strong>-variance (ANOVA) table was<br />
used to determine the significant WEDM parameter<br />
affecting the surface roughness. An approach to<br />
determine the optimum machining-parameter setting was<br />
proposed on the basis <strong>of</strong> the Taguchi design method.<br />
2 EXPERIMENTAL SET-UP AND THE TEST<br />
PROCEDURE<br />
In this experimental study, all experiments were<br />
conducted on an Acutex WEDM machine. The WEDM<br />
machining set-up is shown in Figure 2.<br />
The work material, electrode <strong>and</strong> other machining<br />
conditions are given in Table 2.<br />
Table 2: Constant machining condition set-up<br />
Tabela 2: Podatki o nastavitvi naprave<br />
Y. KAZANCOGLU et al.: APPLICATION OF A TAGUCHI-BASED NEURAL NETWORK FOR FORECASTING ...<br />
Workpiece AISI 4340<br />
Wire material CuZn37<br />
Workpiece dimensions (mm) 150 × 150 × 10<br />
Table feed rate (mm/min) 8.2<br />
Pulse-interval time (μs) 18<br />
Wire diameter (mm) 0.25<br />
Wire tensile strength (N/mm 2 ) 900<br />
Machining cut-<strong>of</strong>f length (mm) 0.8<br />
Traversing length (mm) 5<br />
Open-circuit voltage (150–250 V), pulse duration<br />
(600, 800, 1000) ns, wire speed (6, 8, 10) mm/min <strong>and</strong><br />
dielectric flushing pressure (10, 12, 14) kg/cm 2 were<br />
selected as the input parameters <strong>and</strong> surface roughness<br />
was selected as the output parameter. Surface-roughness<br />
(Ra) measurements were made by using a Phynix TR-100<br />
portable surface-roughness tester with = 0.03 mm <strong>for</strong><br />
the cut-<strong>of</strong>f length. Three measurements were taken <strong>and</strong><br />
their average was calculated as Ra value. According to<br />
the Taguchi orthogonal-design concept an L18 mixed<br />
orthogonal-array table was chosen <strong>for</strong> the experiments.<br />
Figure 2: WEDM machining set-up<br />
Slika 2: WEDM-naprava<br />
The orthogonal-array table used in the Taguchi design<br />
method was applied to BPN as testing data. BPN was<br />
developed to predict the surface roughness. The optimum<br />
machining-parameter combination was obtained by using<br />
an analysis <strong>of</strong> the signal-to-noise (S/N) ratio. The<br />
signal-to-noise (S/N) ratio is a measure <strong>of</strong> the magnitude<br />
<strong>of</strong> the data set relative to the st<strong>and</strong>ard deviation. If the<br />
S/N is large, the magnitude <strong>of</strong> the signal is large relative<br />
to the noise, as measured with the st<strong>and</strong>ard deviation.<br />
8,18,19 There are several S/N ratios available depending<br />
on the types <strong>of</strong> characteristics. The nominal ratio is the<br />
best, higher is better <strong>and</strong> lower is better. We would select<br />
the S/N if the system is optimized when the response is<br />
as small as possible. 1–5 The S/N ratio <strong>for</strong> the LB (lower is<br />
better) characteristic is calculated by using Equations (1)<br />
<strong>and</strong> (2) 5 :<br />
L<br />
n 1 2<br />
j = ∑ y i n k = 1<br />
(1)<br />
j =−10 lg L j<br />
(2)<br />
where yi is the response value, Lj is the loss function, nj<br />
is the S/N ratio.<br />
3 EXPERIMENTAL RESULTS AND DATA<br />
ANALYSIS<br />
A <strong>neural</strong> <strong>network</strong> <strong>based</strong> on back propagation is a<br />
multilayered architecture made up <strong>of</strong> one or more hidden<br />
layers placed between the input <strong>and</strong> output layers. The<br />
components <strong>of</strong> the input pattern consisted <strong>of</strong> the control<br />
variables <strong>of</strong> the machining operation (open-circuit<br />
voltage, pulse duration, wire speed <strong>and</strong> dielectric flushing<br />
pressure), whereas the output-pattern components<br />
represented the measured factor (surface roughness).<br />
Table 3 shows a Taguchi L18 orthogonal-array plan <strong>of</strong> the<br />
experiment <strong>and</strong> a training set <strong>for</strong> the <strong>neural</strong>-<strong>network</strong><br />
<strong>application</strong>.<br />
Materiali in tehnologije / Materials <strong>and</strong> technology 46 (2012) 5, 471–476 473
Y. KAZANCOGLU et al.: APPLICATION OF A TAGUCHI-BASED NEURAL NETWORK FOR FORECASTING ...<br />
Table 3: L18 orthogonal array <strong>and</strong> a <strong>neural</strong>-<strong>network</strong> training set<br />
Tabela 3: L18 ortogonalna matrika za usposabljanje nevronske mre`e<br />
Exp.<br />
no.<br />
Open<br />
voltage<br />
(V)<br />
Pulse<br />
duration<br />
(ns)<br />
Wire<br />
speed<br />
(m/min)<br />
Flushing<br />
pressure<br />
(kg/cm 2 )<br />
Surface<br />
roughness<br />
(μm)<br />
1 150 600 6 10 2.08<br />
2 150 600 8 12 2.20<br />
3 150 600 10 14 2.21<br />
4 150 800 6 10 2.48<br />
5 150 800 8 12 2.51<br />
6 150 800 10 14 2.52<br />
7 150 1000 6 12 2.79<br />
8 150 1000 8 14 2.82<br />
9 150 1000 10 10 2.86<br />
10 250 600 6 14 2.62<br />
11 250 600 8 10 2.69<br />
12 250 600 10 12 2.72<br />
13 250 800 6 12 3.10<br />
14 250 800 8 14 3.06<br />
15 250 800 10 10 3.09<br />
16 250 1000 6 14 3.36<br />
17 250 1000 8 10 3.40<br />
18 250 1000 10 12 3.45<br />
The orthogonal-array table used in the Taguchi<br />
design method was applied to BPN as testing data. The<br />
<strong>network</strong> structure was selected to be <strong>of</strong> the 4:5:1type.<br />
The used BPN model is shown in Figure 3.<br />
The testing validity <strong>of</strong> the regression analysis <strong>and</strong> the<br />
<strong>neural</strong>-<strong>network</strong> results was achieved by using the input<br />
parameters according to the design matrix given in Table<br />
4.<br />
The per<strong>for</strong>mance <strong>of</strong> each BPN was calculated with<br />
the absolute error (%) <strong>of</strong> the tested subset. The average<br />
absolute error was calculated as 1.08 %. The surface<br />
roughness <strong>for</strong> various machining conditions can be<br />
predicted in a quick <strong>and</strong> accurate manner; the BPN<br />
results showed that the predicted values were very close<br />
to the experimental values. The value <strong>of</strong> the multiple<br />
coefficient R 2 is 0.99, which means that the explanatory<br />
Figure 3: 4:5:1(4inputs, 1 hidden layer with 5 neurons <strong>and</strong> 1<br />
output) type <strong>of</strong> the BPN algorithm used <strong>for</strong> modeling<br />
Slika 3: 4:5:1(4vhodni podatki, 1 skrit nivo s5nevroni in 1 izhodni<br />
podatek) vrsta BPN algoritma, uporabljenega pri modeliranju<br />
Table 4: Test set <strong>for</strong> the validity <strong>of</strong> the constructed <strong>neural</strong> <strong>network</strong><br />
Tabela 4: Zbirka podatkov za preizku{anje postavljene nevronske<br />
mre`e<br />
variables explain 99 % <strong>of</strong> the variability in the response<br />
variable. The predicted values <strong>of</strong> the surface roughness<br />
were compared with the experimental values as shown in<br />
Figure 4.<br />
The effect <strong>and</strong> optimization <strong>of</strong> machining settings <strong>for</strong><br />
the minimum surface roughness was investigated experimentally.<br />
The optimum machining-parameter combination<br />
was obtained by analyzing the S/N ratio. ANOVA<br />
was used to consider the effects <strong>of</strong> the input factors on<br />
the response <strong>and</strong> was per<strong>for</strong>med on experimental data.<br />
Figure 4: Comparison <strong>of</strong> experimental <strong>and</strong> predicted values<br />
Slika 4: Primerjava eksperimentalnih in napovedanih vrednosti<br />
Table 5: Results <strong>of</strong> ANOVA <strong>for</strong> the surface roughness<br />
Tabela 5: Rezultati analize variance (ANOVA) za hrapavost povr{ine<br />
Parameter<br />
code<br />
Factors DF SS F MS<br />
A<br />
Open-circuit<br />
voltage<br />
Contribution<br />
percentage<br />
(%)<br />
1 1.404 1378.58 1.401 49.36<br />
B Pulse duration 2 1.440 711.42 0.720 50.03<br />
C Wire speed 2 0.015 7.32 0.007 0.52<br />
D<br />
Flushing<br />
pressure<br />
2 0.003 1.68 0.001 0.10<br />
Error 10 0.020 – 0.003 –<br />
Total 17 2.844 – 100<br />
474 Materiali in tehnologije / Materials <strong>and</strong> technology 46 (2012) 5, 471–476<br />
Exp.<br />
no.<br />
Open<br />
voltage<br />
(V)<br />
Pulse<br />
duration<br />
(ns)<br />
Wire<br />
speed<br />
(m/min)<br />
Flushing<br />
pressure<br />
(kg/cm 2 )<br />
Surface roughness<br />
(μm)<br />
Experimental<br />
Predicted<br />
1 150 600 8 10 2.20 2.20<br />
2 250 600 6 12 2.62 2.58<br />
3 150 800 8 10 2.53 2.52<br />
4 250 800 6 14 2.95 2.97<br />
5 150 1000 8 10 2.85 2.90<br />
6 150 1000 6 14 2.72 2.68<br />
7 250 1000 10 10 3.56 3.46<br />
8 250 800 10 12 3.13 3.15<br />
Average maximum error: 1.08 %
Y. KAZANCOGLU et al.: APPLICATION OF A TAGUCHI-BASED NEURAL NETWORK FOR FORECASTING ...<br />
Figure 5: The effect <strong>of</strong> machining parameters on the surface roughness<br />
Slika 5: U~inek parametrov obdelave na hrapavost povr{ine<br />
The confidence level was selected as 95 %. The results <strong>of</strong><br />
ANOVA <strong>for</strong> the surface roughness are shown in Table 5.<br />
After analyzing Table 4, it is observed that the<br />
open-circuit voltage <strong>and</strong> the pulse duration have a great<br />
influence on the obtained surface roughness. The wire<br />
speed <strong>and</strong> dielectric flushing pressure do not affect<br />
significantly the obtained surface roughness. The plot <strong>of</strong><br />
the mean-factor effects is shown in Figure 5.<br />
The S/N graph <strong>for</strong> the surface roughness is shown in<br />
Figure 6. It is evident that open-circuit voltage (49.36 %)<br />
<strong>and</strong> pulse duration (50.03 %) have the most significant<br />
effect on the surface roughness, which means that by<br />
increasing these two parameters we also increase the<br />
surface roughness. Wire speed (0.52 %) has little effect<br />
on the surface roughness. The effect <strong>of</strong> dielectric<br />
flushing pressure (0.10 %) is negligible.<br />
Optimum factor levels <strong>and</strong> S/N ratios obtained at the<br />
end <strong>of</strong> the Taguchi design technique are summarized in<br />
Table 6.<br />
Figure 6: S/N graph <strong>for</strong> the surface roughness<br />
Slika 6: S/N-diagram za hrapavost povr{ine<br />
Table 6: Optimum factor levels <strong>and</strong> their S/N ratios<br />
Tabela 6: Nivoji optimalnih faktorjev in njihova S/N-razmerja<br />
S/N ratio (dB)<br />
Code Factors<br />
Level 1 Level 2 Level 3 Maxmin<br />
Rank<br />
A Open-circuit<br />
voltage<br />
–7.89 –9.66 – 1.77 2<br />
B<br />
Pulse<br />
duration<br />
–7.63 –8.88 –9.83 2.20 1<br />
C Wire speed –8.65 –8.80 –8.88 0.23 3<br />
D<br />
Flushing<br />
pressure<br />
–8.73 –8.84 –8.75 0.11 4<br />
Average S/N = –8.80<br />
Based on the S/N ratio plot in Figure 6, the optimum<br />
machining parameters <strong>for</strong> the surface roughness are<br />
open-circuit voltage at level 1, pulse duration at level 1,<br />
wire speed at level 1 <strong>and</strong> dielectric flushing pressure at<br />
level1(A1B1C1D1).<br />
4 CONFIRMATION TESTS<br />
A confirmation experiment is the final step in the first<br />
iteration <strong>of</strong> designing an experiment process. 5,8 The<br />
purpose <strong>of</strong> the confirmation experiment is to validate the<br />
conclusions drawn during the analysis phase. The<br />
confirmation experiment is per<strong>for</strong>med by conducting a<br />
test with a specific combination <strong>of</strong> the factors <strong>and</strong> levels<br />
previously evaluated. 8,20 In this study, after determining<br />
the optimum conditions <strong>and</strong> predicting the response<br />
under these conditions, a new experiment was designed<br />
<strong>and</strong> conducted with the optimum levels <strong>of</strong> the welding<br />
parameters. The final step is to predict <strong>and</strong> verify the<br />
improvement <strong>of</strong> the per<strong>for</strong>mance characteristic. The<br />
predicted S/N ratio using the optimum levels <strong>of</strong> the<br />
welding parameters can be calculated as: 5,8,20<br />
n<br />
m ∑ i m<br />
i=<br />
1<br />
+ ( −)<br />
(3)<br />
where m is the total mean <strong>of</strong> the S/N ratio, i is the<br />
mean <strong>of</strong> the S/N ratio at the optimum level, <strong>and</strong> n is the<br />
number <strong>of</strong> the main welding parameters that significantly<br />
affect the per<strong>for</strong>mance. 8,18–20 The result <strong>of</strong> the<br />
experimental confirmation using the optimum surface<br />
roughness is shown in Table 7.<br />
Table 7: Results <strong>of</strong> the confirmation experiments <strong>for</strong> the surface<br />
roughness<br />
Tabela 7: Rezultati potrditvenih eksperimentov za hrapavost povr{ine<br />
Initial parameters<br />
Optimum<br />
parameters<br />
Parameter level A1B3C3D1 A1B1C1D1<br />
Surface roughness (μm) 2.86 2.10<br />
S/N ratio (dB) –9.13 –6.57<br />
The improvement in the S/N ratio from the initial<br />
machining parameters to the optimum machining<br />
parameters is 2.56 dB. Based on the result <strong>of</strong> the<br />
Materiali in tehnologije / Materials <strong>and</strong> technology 46 (2012) 5, 471–476 475
Y. KAZANCOGLU et al.: APPLICATION OF A TAGUCHI-BASED NEURAL NETWORK FOR FORECASTING ...<br />
confirmation test, the surface roughness is decreased<br />
1.36 times.<br />
5 CONCLUSIONS<br />
This study presents a prediction, optimization <strong>and</strong><br />
modeling <strong>of</strong> the surface roughness <strong>of</strong> the AISI 4340 steel<br />
in a wire-electrical-discharge machining (WEDM)<br />
process <strong>based</strong> on the Taguchi-<strong>based</strong> <strong>neural</strong> <strong>network</strong> with<br />
the back-propagation algorithm method. The following<br />
conclusions can be drawn from this study:<br />
• The main WEDM parameters that affect the surface<br />
roughness <strong>of</strong> the machined parts were determined as<br />
pulse duration <strong>and</strong> open-circuit voltage among four<br />
controllable factors influencing the surface roughness<br />
using ANOVA,<br />
• A <strong>neural</strong> <strong>network</strong> <strong>based</strong> on the back-propagation<br />
<strong>network</strong> (BPN) algorithm was constructed <strong>for</strong> predicting<br />
the surface roughness. The predicted values<br />
were found to be very close to the experimental<br />
values,<br />
• The optimum parameter combination <strong>for</strong> the minimum<br />
surface roughness was obtained by using the<br />
Taguchi design method with an analysis <strong>of</strong> the S/N<br />
ratio,<br />
• The confirmation test supports the finding that the<br />
surface roughness is greatly decreased by using the<br />
optimum design parameters,<br />
• The obtained results indicate that the BPN model<br />
agreed well with the Taguchi analysis.<br />
6 REFERENCES<br />
1<br />
J. T. Huang, Y. S. Lmiao, W. J. Hsue, Journal <strong>of</strong> Materials Processing<br />
Technology, 87 (1999), 69–81<br />
2<br />
N. Tosun, C. Cogun, G. Tosun, Journal <strong>of</strong> Materials Processing<br />
Technology, 152 (2004), 316–322<br />
3<br />
A. Mohammadi, A. F. Tehrani, E. Emanian, D. Karimi, Journal <strong>of</strong><br />
Materials Processing Technology, 205 (2008), 283–289<br />
4<br />
D. Scott, S. Boyina, K. P. Rajurkar, Int. J. Prod. Res., 29 (1991),<br />
2189–2207<br />
5<br />
D. C. Montgomery, Design <strong>and</strong> Analysis <strong>of</strong> Experiments, Wiley,<br />
Singapore 1991<br />
6<br />
S. Fraley, M. Oom, B. Terrien, J. Z. Date, The Michigan Chemical<br />
Process Dynamic <strong>and</strong> Controls Open Text Book, USA, 2006<br />
7<br />
U. Esme, The Arabian Journal <strong>for</strong> Science <strong>and</strong> Engineering, 34<br />
(2009), 519–528<br />
8<br />
S. C. Juang, Y. S. Tarng, Journal <strong>of</strong> Materials Processing Technology,<br />
122 (2002), 33–37<br />
9<br />
Y. C. Lin, C. H. Cheng, B. L. Su, L. R. Hwang, Materials <strong>and</strong><br />
Manufacturing Process, 21 (2006), 922–929<br />
10<br />
N. Tosun, C. Cogun, Journal <strong>of</strong> Materials Processing Technology,<br />
134 (2003), 273–278<br />
11<br />
Y. S. Tarng, S. C. Ma, L. K. Chung, International Journal <strong>of</strong> Machine<br />
Tools & Manufacture, 35 (1995), 1693–1701<br />
12<br />
D. Scott, S. Boyina, K. P. Rajurkar, International Journal Production<br />
Research, 11 (1991), 2189–2207<br />
13<br />
T. A. Spedding, Z. Q. Wang, Precision Engineering, 20 (1997), 5–15<br />
14<br />
J. Yuan, K. Wang, T. Yu, M. Fang, International Journal <strong>of</strong> Machine<br />
Tools & Manufacture, 48 (2008), 47–60<br />
15<br />
K. Y. Kung, K. T. Chiang, Materials <strong>and</strong> Manufacturing Process, 23<br />
(2008), 241–250<br />
16<br />
U. Esme, A. Sagbas, F. Kahraman, Iranian Journal <strong>of</strong> Science &<br />
Technology, Transaction B, Engineering, 33 (2009), 231–240<br />
17<br />
K. Y. Benyounis, A. G. Olabi, Advances in Engineering S<strong>of</strong>tware, 39<br />
(2008), 483–496<br />
18<br />
D. S. Holmes, A. E. Mergen, Signal to noise ratio–What is the right<br />
size, www.qualitymag.com/.../Manuscript%20Holmes%20&%20<br />
Mergen.pdf, USA, 1996, 1–6<br />
19<br />
Y. Kazancoglu, U. Esme, M. Bayramoglu, O. Guven, S. Ozgun,<br />
Mater. Tehnol., 45 (2011) 2, 105–110<br />
20<br />
P. J. Ross, Taguchi Techniques <strong>for</strong> Quality Engineering, 2nd ed.,<br />
McGraw-Hill, New York 1996<br />
476 Materiali in tehnologije / Materials <strong>and</strong> technology 46 (2012) 5, 471–476