the phylogeny and biogeography of the genus zonites - Journal of ...
the phylogeny and biogeography of the genus zonites - Journal of ...
the phylogeny and biogeography of the genus zonites - Journal of ...
You also want an ePaper? Increase the reach of your titles
YUMPU automatically turns print PDFs into web optimized ePapers that Google loves.
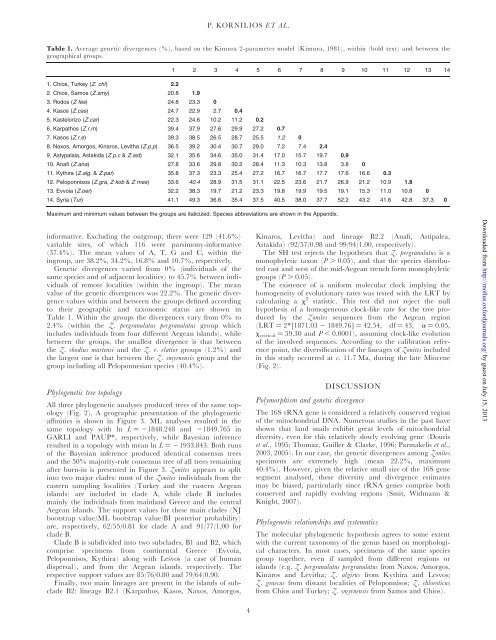
Table 1. Average genetic divergences (%), based on <strong>the</strong> Kimura 2-parameter model (Kimura, 1981), within (bold text) <strong>and</strong> between <strong>the</strong><br />
geographical groups.<br />
informative. Excluding <strong>the</strong> outgroup, <strong>the</strong>re were 129 (41.6%)<br />
variable sites, <strong>of</strong> which 116 were parsimony-informative<br />
(37.4%). The mean values <strong>of</strong> A, T, G <strong>and</strong> C, within <strong>the</strong><br />
ingroup, are 38.2%, 34.2%, 16.8% <strong>and</strong> 10.7%, respectively.<br />
Genetic divergences varied from 0% (individuals <strong>of</strong> <strong>the</strong><br />
same species <strong>and</strong> <strong>of</strong> adjacent localities) to 45.7% between individuals<br />
<strong>of</strong> remote localities (within <strong>the</strong> ingroup). The mean<br />
value <strong>of</strong> <strong>the</strong> genetic divergences was 22.2%. The genetic divergence<br />
values within <strong>and</strong> between <strong>the</strong> groups defined according<br />
to <strong>the</strong>ir geographic <strong>and</strong> taxonomic status are shown in<br />
Table 1. Within <strong>the</strong> groups <strong>the</strong> divergences vary from 0% to<br />
2.4% (within <strong>the</strong> Z. pergranulatus pergranulatus group which<br />
includes individuals from four different Aegean isl<strong>and</strong>s), while<br />
between <strong>the</strong> groups, <strong>the</strong> smallest divergence is that between<br />
<strong>the</strong> Z. rhodius martensi <strong>and</strong> <strong>the</strong> Z. r. elatior groups (1.2%) <strong>and</strong><br />
<strong>the</strong> largest one is that between <strong>the</strong> Z. smyrnensis group <strong>and</strong> <strong>the</strong><br />
group including all Peloponnesian species (40.4%).<br />
Phylogenetic tree topology<br />
All three phylogenetic analyses produced trees <strong>of</strong> <strong>the</strong> same topology<br />
(Fig. 2). A geographic presentation <strong>of</strong> <strong>the</strong> phylogenetic<br />
affinities is shown in Figure 3. ML analyses resulted in <strong>the</strong><br />
same topology with ln L ¼ 21848.248 <strong>and</strong> 21849.765 in<br />
GARLI <strong>and</strong> PAUP*, respectively, while Bayesian inference<br />
resulted in a topology with mean ln L ¼ 21933.843. Both runs<br />
<strong>of</strong> <strong>the</strong> Bayesian inference produced identical consensus trees<br />
<strong>and</strong> <strong>the</strong> 50% majority-rule consensus tree <strong>of</strong> all trees remaining<br />
after burn-in is presented in Figure 3. Zonites appears to split<br />
into two major clades: most <strong>of</strong> <strong>the</strong> Zonites individuals from <strong>the</strong><br />
eastern sampling localities (Turkey <strong>and</strong> <strong>the</strong> eastern Aegean<br />
isl<strong>and</strong>s) are included in clade A, while clade B includes<br />
mainly <strong>the</strong> individuals from mainl<strong>and</strong> Greece <strong>and</strong> <strong>the</strong> central<br />
Aegean isl<strong>and</strong>s. The support values for <strong>the</strong>se main clades (NJ<br />
bootstrap value/ML bootstrap value/BI posterior probability)<br />
are, respectively, 62/55/0.81 for clade A <strong>and</strong> 91/77/1.00 for<br />
clade B.<br />
Clade B is subdivided into two subclades, B1 <strong>and</strong> B2, which<br />
comprise specimens from continental Greece (Evvoia,<br />
Peloponnisos, Kythira) along with Lesvos (a case <strong>of</strong> human<br />
dispersal), <strong>and</strong> from <strong>the</strong> Aegean isl<strong>and</strong>s, respectively. The<br />
respective support values are 85/76/0.80 <strong>and</strong> 79/64/0.90.<br />
Finally, two main lineages are present in <strong>the</strong> isl<strong>and</strong>s <strong>of</strong> subclade<br />
B2: lineage B2.1 (Karpathos, Kasos, Naxos, Amorgos,<br />
P. KORNILIOS ET AL.<br />
1 2 3 4 5 6 7 8 9 10 11 12 13 14<br />
1. Chios, Turkey (Z. chl) 2.2<br />
2. Chios, Samos (Z.smy) 20.8 1.9<br />
3. Rodos (Z fes) 24.8 23.3 0<br />
4. Kasos (Z.cas) 24.7 22.9 2.7 0.4<br />
5. Kastelorizo (Z.car) 22.3 24.6 10.2 11.2 0.2<br />
6. Karpathos (Z.r.m) 39.4 37.9 27.6 29.9 27.2 0.7<br />
7. Kasos (Z.r.e) 39.3 38.5 26.5 28.7 25.5 1.2 0<br />
8. Naxos, Amorgos, Kinaros, Levitha (Z.p.p) 36.5 39.2 30.4 30.7 29.0 7.2 7.4 2.4<br />
9. Astypalaia, Astakida (Z.p.c & Z.ast) 32.1 35.6 34.6 35.0 31.4 17.0 15.7 19.7 0.9<br />
10. Anafi (Z.ana) 27.8 33.6 29.8 30.2 28.4 11.3 10.3 13.8 3.8 0<br />
11. Kythira (Z.alg. & Z.par) 35.8 37.3 23.3 25.4 27.2 16.7 16.7 17.7 17.6 16.6 0.3<br />
12. Peloponnisos (Z.gra, Z kob & Z mes) 33.6 40.4 28.9 31.5 31.1 22.5 23.6 21.7 26.9 21.2 10.9 1.8<br />
13. Evvoia (Z.oer) 32.2 38.3 19.7 21.2 23.3 19.8 19.9 19.5 19.1 15.3 11.0 10.8 0<br />
14. Syria (Tur) 41.1 49.3 36.6 35.4 37.5 40.5 38.0 37.7 52.2 43.2 41.6 42.8 37.3 0<br />
Maximum <strong>and</strong> minimum values between <strong>the</strong> groups are italicized. Species abbreviations are shown in <strong>the</strong> Appendix.<br />
4<br />
Kinaros, Levitha) <strong>and</strong> lineage B2.2 (Anafi, Astipalea,<br />
Astakida) (92/57/0.98 <strong>and</strong> 99/94/1.00, respectively).<br />
The SH test rejects <strong>the</strong> hypo<strong>the</strong>ses that Z. pergranulatus is a<br />
monophyletic taxon (P . 0.05), <strong>and</strong> that <strong>the</strong> species distributed<br />
east <strong>and</strong> west <strong>of</strong> <strong>the</strong> mid-Aegean trench form monophyletic<br />
groups (P . 0.05).<br />
The existence <strong>of</strong> a uniform molecular clock implying <strong>the</strong><br />
homogeneity <strong>of</strong> evolutionary rates was tested with <strong>the</strong> LRT by<br />
calculating a x 2 statistic. This test did not reject <strong>the</strong> null<br />
hypo<strong>the</strong>sis <strong>of</strong> a homogeneous clock-like rate for <strong>the</strong> tree produced<br />
by <strong>the</strong> Zonites sequences from <strong>the</strong> Aegean region<br />
(LRT ¼ 2*[1871.03 2 1849.76] ¼ 42.54, df ¼ 43, a ¼ 0.05,<br />
xcritical ¼ 59.30 <strong>and</strong> P , 0.0001), assuming clock-like evolution<br />
<strong>of</strong> <strong>the</strong> involved sequences. According to <strong>the</strong> calibration reference<br />
point, <strong>the</strong> diversification <strong>of</strong> <strong>the</strong> lineages <strong>of</strong> Zonites included<br />
in this study occurred at c. 11.7 Ma, during <strong>the</strong> late Miocene<br />
(Fig. 2).<br />
DISCUSSION<br />
Polymorphism <strong>and</strong> genetic divergence<br />
The 16S rRNA gene is considered a relatively conserved region<br />
<strong>of</strong> <strong>the</strong> mitochondrial DNA. Numerous studies in <strong>the</strong> past have<br />
shown that l<strong>and</strong> snails exhibit great levels <strong>of</strong> mitochondrial<br />
diversity, even for this relatively slowly evolving gene (Douris<br />
et al., 1995; Thomaz, Guiller & Clarke, 1996; Parmakelis et al.,<br />
2003, 2005). In our case, <strong>the</strong> genetic divergences among Zonites<br />
specimens are extremely high (mean 22.2%, maximum<br />
40.4%). However, given <strong>the</strong> relative small size <strong>of</strong> <strong>the</strong> 16S gene<br />
segment analysed, <strong>the</strong>se diversity <strong>and</strong> divergence estimates<br />
may be biased, particularly since rRNA genes comprise both<br />
conserved <strong>and</strong> rapidly evolving regions (Smit, Widmann &<br />
Knight, 2007).<br />
Phylogenetic relationships <strong>and</strong> systematics<br />
The molecular phylogenetic hypo<strong>the</strong>sis agrees to some extent<br />
with <strong>the</strong> current taxonomy <strong>of</strong> <strong>the</strong> <strong>genus</strong> based on morphological<br />
characters. In most cases, specimens <strong>of</strong> <strong>the</strong> same species<br />
group toge<strong>the</strong>r, even if sampled from different regions or<br />
isl<strong>and</strong>s (e.g. Z. pergranulatus pergranulatus from Naxos, Amorgos,<br />
Kinaros <strong>and</strong> Levitha; Z. algirus from Kythira <strong>and</strong> Lesvos;<br />
Z. graecus from distant localities <strong>of</strong> Peloponnisos; Z. chloroticus<br />
from Chios <strong>and</strong> Turkey; Z. smyrnensis from Samos <strong>and</strong> Chios).<br />
Downloaded from<br />
http://mollus.oxfordjournals.org/ by guest on July 15, 2013


