(helix aspersa) differing in shell deposition of lead - Journal of ...
(helix aspersa) differing in shell deposition of lead - Journal of ...
(helix aspersa) differing in shell deposition of lead - Journal of ...
You also want an ePaper? Increase the reach of your titles
YUMPU automatically turns print PDFs into web optimized ePapers that Google loves.
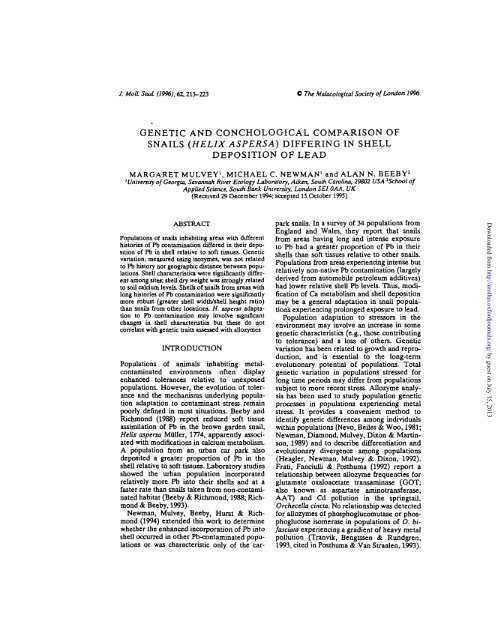
J. Moll Stud. (1996), 62,213-223 C 77K Malacological Society <strong>of</strong> London 1996<br />
GENETIC AND CONCHOLOGICAL COMPARISON OF<br />
SNAILS (HELIX ASPERSA) DIFFERING IN SHELL<br />
DEPOSITION OF LEAD<br />
MARGARET MULVEY 1 , MICHAEL C. NEWMAN 1 and ALAN N. BEEBY 2<br />
'University <strong>of</strong> Georgia, Savannah River Ecology Laboratory, Aiken, South Carol<strong>in</strong>a, 29802 USA 'School <strong>of</strong><br />
Applied Science, South Bank University, London SE1 OAA, UK<br />
(Received 29 December 1994; accepted 15 October 1995)<br />
ABSTRACT<br />
Populations <strong>of</strong> snails <strong>in</strong>habit<strong>in</strong>g areas with different<br />
histories <strong>of</strong> Pb contam<strong>in</strong>ation differed <strong>in</strong> their <strong>deposition</strong><br />
<strong>of</strong> Pb <strong>in</strong> <strong>shell</strong> relative to s<strong>of</strong>t tissues. Genetic<br />
variation, measured us<strong>in</strong>g isozymes, was not related<br />
to Pb history nor geographic distance between populations.<br />
Shell characteristic* were significantly different<br />
among sites; <strong>shell</strong> dry weight was strongly related<br />
to soil calcium levels. Shells <strong>of</strong> snails from areas with<br />
long histories <strong>of</strong> Pb contam<strong>in</strong>ation were significantly<br />
more robust (greater <strong>shell</strong> width/<strong>shell</strong> height ratio)<br />
than snails from other locations. H. aspena adaptation<br />
to Pb contam<strong>in</strong>ation may <strong>in</strong>volve significant<br />
changes <strong>in</strong> <strong>shell</strong> characteristics but these do not<br />
correlate with genetic traits assessed with allozymes<br />
INTRODUCTION<br />
Populations <strong>of</strong> animals <strong>in</strong>habit<strong>in</strong>g metalcontam<strong>in</strong>ated<br />
environments <strong>of</strong>ten display<br />
enhanced tolerances relative to unexposed<br />
populations. However, the evolution <strong>of</strong> tolerance<br />
and the mechanisms underly<strong>in</strong>g population<br />
adaptation to contam<strong>in</strong>ant stress rema<strong>in</strong><br />
poorly def<strong>in</strong>ed <strong>in</strong> most situations. Beeby and<br />
Richmond (1988) report reduced s<strong>of</strong>t tissue<br />
assimilation <strong>of</strong> Pb <strong>in</strong> the brown garden snail,<br />
Helix aspena MttUer, 1774, apparently associated<br />
with modifications <strong>in</strong> calcium metabolism.<br />
A population from an urban car park also<br />
deposited a greater proportion <strong>of</strong> Pb <strong>in</strong> the<br />
<strong>shell</strong> relative to s<strong>of</strong>t tissues. Laboratory studies<br />
showed the urban population <strong>in</strong>corporated<br />
relatively more Pb <strong>in</strong>to their <strong>shell</strong>s and at a<br />
faster rate than snails taken from non-contam<strong>in</strong>ated<br />
habitat (Beeby & Richmond, 1988; Richmond<br />
& Beeby, 1993).<br />
Newman, Mulvey, Beeby, Hurst & Richmond<br />
(1994) extended this work to determ<strong>in</strong>e<br />
whether the enhanced <strong>in</strong>corporation <strong>of</strong> Pb <strong>in</strong>to<br />
<strong>shell</strong> occurred <strong>in</strong> other Pb-contam<strong>in</strong>ated populations<br />
or was characteristic only <strong>of</strong> the car-<br />
park snails. In a survey <strong>of</strong> 34 populations from<br />
England and Wales, they report that snails<br />
from areas hav<strong>in</strong>g long and <strong>in</strong>tense exposure<br />
to Pb had a greater proportion <strong>of</strong> Pb <strong>in</strong> their<br />
<strong>shell</strong>s than s<strong>of</strong>t tissues relative to other snails.<br />
Populations from areas experienc<strong>in</strong>g <strong>in</strong>tense but<br />
relatively non-native Pb contam<strong>in</strong>ation (largely<br />
derived from automobile petroleum additives)<br />
had lower relative <strong>shell</strong> Pb levels. Thus, modification<br />
<strong>of</strong> Ca metabolism and <strong>shell</strong> <strong>deposition</strong><br />
may be a general adaptation <strong>in</strong> snail populations<br />
experienc<strong>in</strong>g prolonged exposure to <strong>lead</strong>.<br />
Population adaptation to stressors <strong>in</strong> the<br />
environment may <strong>in</strong>volve an <strong>in</strong>crease <strong>in</strong> some<br />
genetic characteristics (e.g., those contribut<strong>in</strong>g<br />
to tolerance) and a loss <strong>of</strong> others. Genetic<br />
variation has been related to growth and reproduction,<br />
and is essential to the long-term<br />
evolutionary potential <strong>of</strong> populations. Total<br />
genetic variation <strong>in</strong> populations stressed for<br />
long time periods may differ from populations<br />
subject to more recent stress. Allozyme analysis<br />
has been used to study population genetic<br />
processes <strong>in</strong> populations experienc<strong>in</strong>g metal<br />
stress. It provides a convenient method to<br />
identify genetic differences among <strong>in</strong>dividuals<br />
with<strong>in</strong> populations (Nevo, Beiles & Woo, 1981;<br />
Newman, Diamond, Mulvey, Dixon & Mart<strong>in</strong>son,<br />
1989) and to describe differentiation and<br />
evolutionary divergence among populations<br />
(Heagler, Newman, Mulvey & Dixon, 1992).<br />
Frati, Fanciulli & Posthuma (1992) report a<br />
relationship between allozyme frequencies for<br />
glutamate oxaloacetate transam<strong>in</strong>ase (GOT;<br />
also known as aspartate am<strong>in</strong>otransferase,<br />
AAT) and Cd pollution <strong>in</strong> the spr<strong>in</strong>gtail,<br />
Orchecella c<strong>in</strong>cta. No relationship was detected<br />
for allozymes <strong>of</strong> phosphoglucomutase or phosphoglucose<br />
isomerase <strong>in</strong> populations <strong>of</strong> O. bifasciata<br />
experienc<strong>in</strong>g a gradient <strong>of</strong> heavy metal<br />
pollution (Tranvik, Bengtssen & Rundgren,<br />
1993, cited <strong>in</strong> Posthuma & Van Straalen, 1993).<br />
Downloaded from<br />
http://mollus.oxfordjournals.org/<br />
by guest on July 15, 2013
214 M. MULVEY, M.G NEWMAN & A.N. BEEBY<br />
The snail-Pb system provides an ideal model<br />
to exam<strong>in</strong>e the adaptive responses <strong>of</strong> populations<br />
to environmental stressors. Snails will be<br />
exposed to Pb through soil and foods <strong>in</strong> contam<strong>in</strong>ated<br />
environments. Snails are relatively<br />
sedentary; a trait that contributes to local<br />
differentiation. Also, genetic differentiation <strong>in</strong><br />
H. <strong>aspersa</strong> populations has been reported on<br />
micro- (Selander & Kaufman, 1975) and<br />
macro-geographic scales (Madec, 1991a;<br />
1991b; Guiller, Madec & Daguzan, 1994).<br />
Selander & Ochman (1983) suggested that<br />
both micro- and macro-geographic population<br />
structure <strong>of</strong> H. <strong>aspersa</strong> <strong>in</strong>troduced <strong>in</strong>to the<br />
U.S. resulted from stochastic processes. Crook<br />
(1980) suggested that selection was act<strong>in</strong>g to<br />
determ<strong>in</strong>e allelic frequencies for the leuc<strong>in</strong>e<br />
am<strong>in</strong>opeptidase (LAP) locus <strong>in</strong> H. <strong>aspersa</strong><br />
populations <strong>in</strong> the U.K. Recently, Madec<br />
(1991a) reported low levels <strong>of</strong> heterozygosity<br />
<strong>in</strong> a colony <strong>of</strong> H. <strong>aspersa</strong> at Fort Bloque and<br />
attributed this to harsh ecological conditions.<br />
In the present report, we describe genetic<br />
and conchological characteristics for the snail<br />
populations exam<strong>in</strong>ed by Newman et al.<br />
(1994). S<strong>in</strong>ce these populations differed with<br />
respect to Pb <strong>deposition</strong> <strong>in</strong> the <strong>shell</strong>, we<br />
wanted to determ<strong>in</strong>e if there were also consistent<br />
genetic or conchological patterns relative<br />
to Pb contam<strong>in</strong>ation. Two patterns might be<br />
predicted for the population genetic data<br />
based on selection associated with exposure to<br />
heavy metal pollution. First, a decrease <strong>in</strong><br />
overall genetic variability might be expected if<br />
there were directional selection for more resistant<br />
genotypes. Second, differential selection<br />
might <strong>lead</strong> to differences <strong>in</strong> the distribution <strong>of</strong><br />
alleles <strong>in</strong> tolerant versus nontolerant locations.<br />
If differences <strong>in</strong> <strong>shell</strong> <strong>deposition</strong> between<br />
populations were associated with major genes,<br />
then allozyme loci might serve as 'markers' for<br />
adaptation through chromosomal l<strong>in</strong>kage.<br />
F<strong>in</strong>ally, we exam<strong>in</strong>ed <strong>shell</strong> morphology <strong>in</strong> snail<br />
populations from locations with a long history<br />
<strong>of</strong> Pb contam<strong>in</strong>ation and compared these to<br />
populations from locations with non-native or<br />
no Pb contam<strong>in</strong>ation to determ<strong>in</strong>e if <strong>shell</strong><br />
features, other than relative Pb <strong>deposition</strong>,<br />
differed for snails from these two habitat<br />
types.<br />
Sample locations<br />
MATERIALS AND METHODS<br />
Helix <strong>aspersa</strong> populations were collected from 33<br />
locations dur<strong>in</strong>g August and September 1990 (Table<br />
1, Fig. 1). Locations reflected a range <strong>of</strong> Pb contam<strong>in</strong>ation<br />
from very heavily contam<strong>in</strong>ated sites (e.g.,<br />
sites BI, below a highway <strong>in</strong>terchange <strong>in</strong> Birm<strong>in</strong>gham<br />
and HA, 3 km downw<strong>in</strong>d <strong>of</strong> Avonmouth<br />
smelter <strong>in</strong> Hallen) to locations with <strong>in</strong>significant levels<br />
<strong>of</strong> Pb (e.g., ET and LL, gardens <strong>in</strong> Ett<strong>in</strong>gton and<br />
Llanrhaedr, respectively). Additionally, populations<br />
were chosen that would reflect different histories <strong>of</strong><br />
contam<strong>in</strong>ation. Five populations were taken from<br />
areas where ratios <strong>of</strong> Pb with an isotopic signature<br />
characteristic <strong>of</strong> native Pb were high (BE, FB, HA,<br />
Ml, and SC). Several <strong>of</strong> these areas had been long<br />
exploited' for metal work<strong>in</strong>g. Newman el al. (1994)<br />
report that these populations displayed high Pb <strong>in</strong><br />
<strong>shell</strong>s relative to snails from other locations; for the<br />
present study, these populations will be referred to<br />
as 'native Pb'. The rema<strong>in</strong><strong>in</strong>g populations were <strong>in</strong><br />
relatively non-contam<strong>in</strong>ated locations or locations<br />
with non-native, heavy contam<strong>in</strong>ation associated<br />
with automotive sources. Pb isotopic ratios for these<br />
locations <strong>in</strong>dicated a relatively greater proportion <strong>of</strong><br />
non-native Pb. These populations had relatively low<br />
Pb levels <strong>in</strong> <strong>shell</strong>s (Newman et al., 1994) and will be<br />
referred to as 'non-native Pb'. Additional details <strong>of</strong><br />
sample locations are provided by Newman et al.<br />
(1994). Methods for atomic absorption analyses for<br />
Pb <strong>in</strong> soil and snails are described <strong>in</strong> Newman et al.<br />
(1994). Soil Ca levels were determ<strong>in</strong>ed us<strong>in</strong>g standard<br />
methods. Briefly, one g <strong>of</strong> soil was placed <strong>in</strong>to<br />
glass Kjedahl tubes and 10 mL <strong>of</strong> 50% (v/v) Analr<br />
grade nitric acidideionized water were added.<br />
Samples were then heated to 150 c C for 2 h, cooled,<br />
filtered through Whatman No. 1 filter paper, and<br />
brought to volume <strong>in</strong> 25 mL volumetric flasks.<br />
Quality assurance <strong>in</strong>cluded procedural blanks and<br />
standard materials.<br />
Snails<br />
Snails were placed <strong>in</strong> plastic conta<strong>in</strong>ers for 24 hours<br />
to allow clearance <strong>of</strong> the guL They were washed <strong>in</strong><br />
tap water, blotted dry, and frozen at -70 °C. The <strong>in</strong>itial<br />
freez<strong>in</strong>g enabled thawed s<strong>of</strong>t tissues to be easily<br />
removed <strong>in</strong>tact from the <strong>shell</strong>s. A small piece <strong>of</strong> foot<br />
tissue was removed for electrophoresis and the<br />
rema<strong>in</strong><strong>in</strong>g s<strong>of</strong>t tissues were used for determ<strong>in</strong>ation<br />
<strong>of</strong> Pb contam<strong>in</strong>ation (details <strong>in</strong> Newman et al. 1994).<br />
Prote<strong>in</strong> electrophoresis was used to genetically characterize<br />
populations and describe local differentiation.<br />
For electrophoretic analysis, foot tissue samples<br />
were ground <strong>in</strong> approximately equal volumes <strong>of</strong> cold<br />
gr<strong>in</strong>d<strong>in</strong>g solution (0.01 M Tris, 0.001 M EDTA, 0.05<br />
mM NADP, pH 7.0). Samples were centrifuged at<br />
10,000 rpm for 45 sec Hdmogenate fluid was<br />
absorbed onto filter paper wicks, blotted briefly, and<br />
<strong>in</strong>serted <strong>in</strong>to 12-5% (w/v) horizontal starch gels. Gels<br />
were sta<strong>in</strong>ed follow<strong>in</strong>g methods described by<br />
Selander et al. (1971) and Richardson, Baverstock &<br />
Adams (1986). Buffer and enzyme sta<strong>in</strong> comb<strong>in</strong>ations<br />
are shown <strong>in</strong> Table 2. For multilocus systems,<br />
isozymes were numbered <strong>in</strong> order <strong>of</strong> decreas<strong>in</strong>g<br />
anodal mobility. The most common allozyme was<br />
arbitrarily designated 3; faster migrat<strong>in</strong>g allozymes<br />
Downloaded from<br />
http://mollus.oxfordjournals.org/<br />
by guest on July 15, 2013
Table 1. Locations and designations <strong>of</strong> 33 samples <strong>of</strong> Helix asperse. Also shown are concentrations <strong>of</strong> Ca and Pb <strong>in</strong> soil samples and median concentrations<br />
<strong>of</strong> Pb <strong>in</strong> snail tissue. Mean <strong>shell</strong> measurements (HC •= collumellar height, AW - aperature width, Dmax » maximum diameter, Ws = dry weight<br />
<strong>of</strong> <strong>shell</strong>). Samples sizes for electrophoretic analysis, percent <strong>of</strong> loci polymorphic and mean heterozygosity for each <strong>of</strong> the populations are also given.<br />
Mean<br />
Heterozygosity<br />
Percent<br />
Polymorphic<br />
loci<br />
Mean<br />
Sample<br />
Size<br />
Ws<br />
Dmax<br />
AW<br />
HC<br />
Tissue<br />
Pb<br />
Soil Pb<br />
Soil Ca<br />
Label<br />
Population<br />
o<br />
m<br />
i<br />
o<br />
Z<br />
D<br />
n<br />
oz<br />
0.119<br />
0.143<br />
0.113<br />
0.114<br />
0.180<br />
52.9<br />
82.4<br />
76.5<br />
88.2<br />
64.7<br />
17.1 ±0.5<br />
54.1 ± 1.5<br />
66.0 ± 0.5<br />
78.0 ±1.9<br />
32.4 ±0.9<br />
1.35<br />
1 22<br />
1.44<br />
1.52<br />
0.67<br />
31.5<br />
30.3<br />
31.6<br />
30 8<br />
29.4<br />
19.6<br />
17.9<br />
19.0<br />
18.9<br />
17.8<br />
27.1<br />
27.6<br />
28.0<br />
28.3<br />
24.7<br />
3.8<br />
2.5<br />
150<br />
216<br />
7.8<br />
209<br />
337<br />
455<br />
462<br />
77<br />
2072<br />
1667<br />
2248<br />
35361<br />
676<br />
BE<br />
FB<br />
HA<br />
Ml<br />
SC<br />
o<br />
o<br />
Downloaded from<br />
http://mollus.oxfordjournals.org/ by guest on July 15, 2013<br />
2<br />
<strong>in</strong><br />
O<br />
o<br />
11<br />
0.116<br />
0.113<br />
0.180<br />
0.190<br />
0 164<br />
0.179<br />
0 133<br />
0 158<br />
0.200<br />
0.177<br />
0.100<br />
0.141<br />
0.116<br />
0 129<br />
0.163<br />
0.144<br />
1.138<br />
0.145<br />
0 163<br />
0.146<br />
0.032<br />
0.118<br />
0.157<br />
0.167<br />
0.138<br />
0.147<br />
0.115<br />
0 157<br />
64.7<br />
70.6<br />
70 6<br />
88.2<br />
82.4<br />
76.5<br />
47.1<br />
52.9<br />
82.4<br />
882<br />
88 2<br />
76 5<br />
88.2<br />
82.4<br />
76 5<br />
82.4<br />
64.7<br />
58.8<br />
70.6<br />
94.1<br />
23.5<br />
70.6<br />
82.4<br />
76.5<br />
64.7<br />
70.6<br />
82.4<br />
76 5<br />
28.3 ± 0.4<br />
66.8 ± 2.0<br />
34.8 ± 1.0<br />
42.6 ± 1 2<br />
55.3 ±1.9<br />
44.7 ± 1.0<br />
38.5 ±1.2<br />
22.1 ±0.5<br />
13.5 ±03<br />
68.2 ± 2 8<br />
54.6 ± 1.2<br />
24.7 ±07<br />
67.8 ± 1.1<br />
65 2 ±1.8<br />
37.4 ± 0.9<br />
55.2 ± 1.5<br />
43.8 ± 1.0<br />
44.4 ± 1.2<br />
24.6 ±0.4<br />
57.0 ±09<br />
15.9 ± 0.7<br />
31.8 ±0.6<br />
142.8 ±2.5<br />
32.6 ± 0.7<br />
26.6 ± 0.6<br />
77.9 ±34<br />
42 7 ± 0.6<br />
35.1 ± 1.2<br />
1.13<br />
1.56<br />
1.80<br />
1.20<br />
1.27<br />
1.24<br />
1.14<br />
1.65<br />
0.74<br />
1.13<br />
0.88<br />
1.01<br />
1.91<br />
0.84<br />
1.24<br />
1 55<br />
1 13<br />
1.70<br />
1.79<br />
1.67<br />
0.98<br />
083<br />
0.82<br />
1.16<br />
0.95<br />
0.86<br />
0 85<br />
1 19<br />
33.4<br />
30 9<br />
30.0<br />
29.4<br />
29.5<br />
29.4<br />
28.3<br />
33.1<br />
30.4<br />
29.8<br />
29.7<br />
27.2<br />
28.3<br />
28 3<br />
29.8<br />
30.6<br />
28 8<br />
30.6<br />
32.6<br />
28 5<br />
32.6<br />
26.9<br />
26.8<br />
29.1<br />
27.8<br />
27.6<br />
27.6<br />
28.8<br />
19.0<br />
19.4<br />
17.9<br />
18.0<br />
17.2<br />
17.4<br />
17.2<br />
18.9<br />
17.8<br />
18.6<br />
17.6<br />
17.2<br />
16.4<br />
16.8<br />
179<br />
18.4<br />
17.8<br />
18.0<br />
20.1<br />
168<br />
19.3<br />
16.4<br />
16.3<br />
16.8<br />
16.8<br />
16.7<br />
16.3<br />
17.1<br />
29.0<br />
29.4<br />
27.0<br />
27.4<br />
26.6<br />
25.9<br />
25.7<br />
30.0<br />
27 3<br />
28.5<br />
27.3<br />
26.0<br />
26.2<br />
26 0<br />
26 9<br />
27.0<br />
26.7<br />
26.6<br />
31.4<br />
25.7<br />
31.0<br />
24.2<br />
25.6<br />
24.4<br />
23.9<br />
24.6<br />
26.2<br />
26.0<br />
411.8<br />
1.6<br />
5.3<br />
8.5<br />
216 M. MULVEY, M.C. NEWMAN & A.N BEEBY<br />
Figure 1. Sampl<strong>in</strong>g locations for Helix aspena. Locations designated with bold letters had snail populations<br />
identified by Newman el al (1994) as hav<strong>in</strong>g a high <strong>shell</strong> ratio <strong>of</strong> Pb ('native Pb') and locations with standard<br />
letters had relatively lower Pb ratios <strong>in</strong> <strong>shell</strong>s ('non-native Pb'). See Table 1 for details for locations.<br />
were designated 1 or 2 and slower allozymes were<br />
designated 4, 5 and so on.<br />
Dimensions <strong>of</strong> all <strong>in</strong>tact <strong>shell</strong>s were determ<strong>in</strong>ed as<br />
described <strong>in</strong> Bleakney, Flem<strong>in</strong>g
GENETIC AND CONCHOLOGICAL COMPARISON OF SNAILS<br />
Table 2. Buffer and enzyme sta<strong>in</strong>s used to resolve isozymes <strong>in</strong> Helix <strong>aspersa</strong>.<br />
Buffer<br />
Am<strong>in</strong>e citrate, pH 6.0*<br />
Tris citrate, pH 8.0"<br />
Tris EDTA borate, pH 8.0*<br />
Poulik"<br />
Enzyme sta<strong>in</strong>s<br />
•Clayton StTntiak, 1972<br />
"Selander, Smith, Yang, Johnson & Gentry, 1971.<br />
variance <strong>in</strong>to the follow<strong>in</strong>g components: among<br />
snath at sampl<strong>in</strong>g locations, between locations<br />
with<strong>in</strong> the 'native Pb' and 'non-native Pb' groups<br />
and between groups with different Pb histories.<br />
A 3-way Mantel analysis for matrix correlation<br />
(Sraouse, Long & Solcal, 1986) was done us<strong>in</strong>g the<br />
follow<strong>in</strong>g distance matrices: genetic, geographic and<br />
Pb level. Standard genetic distance was determ<strong>in</strong>ed<br />
from allozyme data. Geographic distance was determ<strong>in</strong>ed<br />
as the l<strong>in</strong>ear distance between pairs <strong>of</strong> locations<br />
on an ord<strong>in</strong>ance survey map. A Pb distance<br />
matrix was generated by us<strong>in</strong>g the absolute difference<br />
between the mean tissue Pb concentrations<br />
(Newman el a/., 1994) for each pair <strong>of</strong> locations.<br />
ANOVA (SAS, 1987) was used to exam<strong>in</strong>e <strong>shell</strong><br />
features and to test for differences between 'native<br />
Pb' and 'non-native Pb' populations. Shell ratio was<br />
def<strong>in</strong>ed as the ratio <strong>of</strong> dry weight <strong>of</strong> the <strong>shell</strong> to collumella<br />
height, and <strong>shell</strong> robustness was def<strong>in</strong>ed as<br />
the ratio <strong>of</strong> aperture width to collumella height Levels<br />
<strong>of</strong> sod Pb and Ca were exam<strong>in</strong>ed as factors contribut<strong>in</strong>g<br />
to <strong>shell</strong> size. Data were checked for<br />
deviations from normality and none were found.<br />
RESULTS<br />
Populations <strong>of</strong> H. <strong>aspersa</strong> had considerable<br />
<strong>in</strong>tra- and <strong>in</strong>ter-population genetic diversity<br />
(Table 1). Populations had between 23.5 and<br />
882% <strong>of</strong> loci polymorphic and a range <strong>of</strong><br />
heterozygosities between 0.032 and 0.200.<br />
Allozyme frequencies for the 33 populations<br />
are given <strong>in</strong> Appendix 1. Fifty-seven tests for<br />
fit <strong>of</strong> data to random mat<strong>in</strong>g expectations were<br />
done; eight deviations occurred at P
218 M. MULVEY, M.C. NEWMAN & A.N. BEEBY<br />
Figure 2. Measurements made on <strong>in</strong>tact Helix<br />
<strong>aspersa</strong> <strong>shell</strong>s. Aperture depth (Ad), aperture width<br />
(Aw), maximum diameter (D,^,), columeUar height<br />
(He), and height <strong>of</strong> the <strong>shell</strong> (Hs) (Figure and<br />
measurements as <strong>in</strong> Bleakney et al., 1989).<br />
between populations. The UPTGMA phenogram<br />
based on genetic distance (Fig. 3) showed<br />
no patterns relative to Pb history, levels <strong>of</strong><br />
contam<strong>in</strong>ation nor geographical separation.<br />
Analysis <strong>of</strong> distance matrices (Mantel tests)<br />
<strong>in</strong>dicated no correlation between genetic, Pb,<br />
nor geographical distance (all P > 0.89). The<br />
relationships were: genetic vs. geographic, r 2 =<br />
0.189, genetic vs. Pb, r 2 = 0.110 and geographic<br />
vs. Pb,r 2 =-0.021.<br />
Shell measurements were obta<strong>in</strong>ed for 604<br />
<strong>in</strong>tact, mature snails; approximately 20 per<br />
population. There were correlations between<br />
<strong>shell</strong> measurements with<strong>in</strong> and between populations.<br />
For example, the correlation between<br />
D,^ and Ws was r = 0.19, P = 0.01. There was a<br />
strong positive relationship between soil calcium<br />
levels and dry weight <strong>of</strong> <strong>shell</strong> (P = 0.002).<br />
ANOVA results for <strong>shell</strong> measures are given<br />
<strong>in</strong> Table 3. Shell ratio (Wj/Hc) varied significantly<br />
among sites but there was no significant<br />
relation with Pb exposure history. However,<br />
<strong>shell</strong> robustness (D^Hc) was significantly different<br />
among sites and also between the<br />
'native Pb' and 'non-native Pb' snails. 'Native<br />
Pb' snails from the historical Pb locations had<br />
a higher ratio than did snails from other sites.<br />
DISCUSSION<br />
Snails from long-term, highly contam<strong>in</strong>ated<br />
habitats ('native Pb') and those from more<br />
recently or non-contam<strong>in</strong>ated habitats ('nonnative<br />
Pb') did not differ <strong>in</strong> overall levels <strong>of</strong><br />
allozyme variation nor were there any consistent<br />
differences <strong>in</strong> the occurrence <strong>of</strong> specific<br />
allozymes. Genetic diversity was high <strong>in</strong> UK<br />
H. <strong>aspersa</strong> and was similar to levels reported<br />
elsewhere (Selander & Kaufman, 1975;<br />
Bleakney et a/.1989; Madec, 1991b). Patterns<br />
<strong>of</strong> genetic variation for H. <strong>aspersa</strong> <strong>in</strong> UK were<br />
similar to those reported by Selander & Kaufman<br />
(1975) <strong>in</strong> a study <strong>of</strong> microgeographic<br />
population structure, and Madec (1991a, 1991b)<br />
and Guiller et al. (1994) who exam<strong>in</strong>ed macrogeographic<br />
differentiation. Here, populations<br />
were differentiated on a relatively small scale<br />
but there was no clear large-scale pattern nor<br />
any pattern consistent with duration <strong>of</strong> Pb<br />
exposure. Previous studies have found Nei<br />
genetic distances <strong>of</strong> 0.03 to 0.37 for H. <strong>aspersa</strong><br />
from France and Algeria (Madec, 1991b) and<br />
0.03 to 0.13 for U.K. and French populations<br />
(Bleakney et al., 1989). These distances are<br />
similar to those reported here for populations<br />
<strong>of</strong> comparable geographic distance.<br />
Although there is evidence <strong>of</strong> physiological<br />
adaptation among snail populations <strong>in</strong>habit<strong>in</strong>g<br />
locations with high levels <strong>of</strong> long term exposure<br />
to Pb, differential adaptation was not correlated<br />
with genetic patterns <strong>of</strong> allozymes. UK<br />
H. <strong>aspersa</strong> populations displayed genetic diversity<br />
with<strong>in</strong> and between populations; 14% <strong>of</strong><br />
the total genetic variance was attributable to<br />
differences between 'native Pb' and 'nonnative<br />
Pb' groups. However, it is unclear what<br />
factors contribute to the 14% s<strong>in</strong>ce there was<br />
Downloaded from<br />
http://mollus.oxfordjournals.org/<br />
by guest on July 15, 2013
GENETIC AND CONCHOLOGICAL COMPARISON OF SNAILS 219<br />
•+• -+•<br />
0.060 0.050 0.040 0.030 0.020 0.010 0.00<br />
Standard Distance<br />
Figure 3. UPGMA phenogram illustrat<strong>in</strong>g genetic relationships for snail populations. 'Native Pb' populations<br />
(identified <strong>in</strong> Newman et al., 1994) from long-time Pb contam<strong>in</strong>ated are <strong>in</strong>dicated with *. Bootstrap values<br />
were generated us<strong>in</strong>g DISPAN (Ota, 1993).<br />
Table 3. ANCOVA for <strong>shell</strong> characteristics for garden snails from "native" and "nonnative"<br />
Pb contam<strong>in</strong>ation sites. Pb refers to these two characteristics <strong>in</strong> the model and<br />
site refers to the 33 populations sampled. Covarlates were <strong>shell</strong> dry weight (dry wgt) or<br />
median soil calcium.<br />
A<br />
B<br />
C<br />
Mean'for<br />
Source <strong>of</strong> variation df "Native" "Non-native"<br />
Shell dry weight (g)<br />
Pb<br />
Soil calcium (mg/g)<br />
Ratio (dry wgt/Hc)<br />
Pb<br />
Site (Pb)<br />
Robustness [Dm^JHc)<br />
Pb<br />
Site (Pb)<br />
Dry wgt<br />
1<br />
1<br />
1<br />
31<br />
1<br />
31<br />
1<br />
0.21<br />
11.88<br />
1.11<br />
19.72<br />
no correlation with geographic distance nor Pb<br />
differences between sites.<br />
Genetic patterns were surpris<strong>in</strong>g because a<br />
correlation between geographic distance and<br />
22.60<br />
2.58<br />
0.17<br />
0.16<br />
0.002<br />
0.29<br />
0.0001<br />
0.0001<br />
0.0001<br />
0.68<br />
1.2J<br />
0.04'<br />
0.69<br />
1.21<br />
0.045<br />
0.66<br />
genetic distance were expected based on an<br />
isolation-by-distance model (Crow & Kimura,<br />
1970). Snails are not cont<strong>in</strong>uously distributed<br />
across the landscape and especially for widely<br />
Downloaded from<br />
http://mollus.oxfordjournals.org/<br />
by guest on July 15, 2013
220 M. MULVEY, M.C. NEWMAN & AJi. BEEBY<br />
distributed populations, gene flow should be<br />
limited. One factor contribut<strong>in</strong>g to the<br />
observed pattern might be dispersal <strong>of</strong> snails<br />
associated with human activities. H. <strong>aspersa</strong> a<br />
common <strong>in</strong> domestic and commercial gardens<br />
and might be transported with shipments <strong>of</strong><br />
plants and supplies. Lack <strong>of</strong> correlation<br />
between genetic distance and geographic distance<br />
may reflect unanticipated high levels <strong>of</strong><br />
gene flow among populations associated with<br />
human activities.<br />
Like Frati et al. (1992), who reported metal<br />
pollution and tolerance <strong>in</strong> the spr<strong>in</strong>gtail, O.<br />
c<strong>in</strong>cta, but did not f<strong>in</strong>d an effect on measures<br />
<strong>of</strong> overall genetic variability, we found no difference<br />
<strong>in</strong> overall genetic variation between<br />
'native Pb' and 'non-native Pb' populations <strong>of</strong><br />
snails. For O. c<strong>in</strong>cta, a correlation was found<br />
with frequency <strong>of</strong> allozymes <strong>of</strong> Got (Aat) and<br />
Cd contam<strong>in</strong>ation. The Got locus was polymorphic<br />
<strong>in</strong> the H. <strong>aspersa</strong> populations but no<br />
allozyme was associated with Pb exposure history.<br />
Lack <strong>of</strong> relationship with allozyme loci<br />
suggests that these enzymes are not important<br />
to tolerance per se or are not closely l<strong>in</strong>ked to<br />
loci responsible for tolerance and so do not<br />
serve as effective 'markers'.<br />
Newman et al. (1994) reported differences <strong>in</strong><br />
<strong>shell</strong> <strong>deposition</strong> <strong>of</strong> Pb for snails from the<br />
'native Pb' and 'non-native Pb' locations. Consistent<br />
with their f<strong>in</strong>d<strong>in</strong>gs, robustness <strong>of</strong> the<br />
<strong>shell</strong> (Dn^/Hc) was significantly different<br />
between these populations, <strong>in</strong> the present<br />
study. Adaptation to heavy metal stressors<br />
may <strong>in</strong>volve modification <strong>of</strong> exist<strong>in</strong>g metabolic<br />
pathways and sequester<strong>in</strong>g <strong>of</strong> toxic substances<br />
<strong>in</strong> <strong>shell</strong> or exoskeleton, as is <strong>of</strong>ten observed <strong>in</strong><br />
<strong>in</strong>vertebrates. Thus, H. <strong>aspersa</strong> adaptation to<br />
Pb contam<strong>in</strong>ation apparently <strong>in</strong>volves significant<br />
changes <strong>in</strong> <strong>shell</strong> characteristics but these<br />
do not correlate with genetic traits assessed<br />
with the allozymes exam<strong>in</strong>ed here.<br />
ACKNOWLEDGMENTS<br />
Travel for the collections was partially funded<br />
by the NATO Collaborative Research Grants<br />
program (CRG900469). Support for the<br />
research also came from contract<br />
DE/AC09/76SROO/819 between the U.S.<br />
Department <strong>of</strong> Energy and the University <strong>of</strong><br />
Georgia's Savannah River Ecology Laboratory.<br />
We thank M.M. Kelak and J.M.<br />
McCloskey for laboratory assistance. Carol<br />
Ercolano prepared the tables. James Novak<br />
provided comments on an earlier draft <strong>of</strong> the<br />
manuscript.<br />
REFERENCES<br />
AYALA, FJ., POWELL, J.R., TRACEY, M.L., MONRAO,<br />
CA. & PEREZ-SALAS, S. 1972. Enzyme variability<br />
<strong>in</strong> the Drosophila wtllistoni group. IV. Genie<br />
variation <strong>in</strong> natural populations <strong>of</strong> Drosophila<br />
willistoni Genetics, 70:113-139.<br />
BEEBY, A. & RICHMOND, L. 1987. Adaptation by an<br />
urban population <strong>of</strong> the snail Helix <strong>aspersa</strong> to a<br />
diet contam<strong>in</strong>ated with <strong>lead</strong> Environmental Pollution,<br />
46:73-82.<br />
BEEBY, A. & RICHMOND, L. 1988. Calcium<br />
metabolism <strong>in</strong> two populauons <strong>of</strong> the snail Helix<br />
<strong>aspersa</strong> on a high <strong>lead</strong> diet. Archives <strong>of</strong> Environmental<br />
Contam<strong>in</strong>ation and Toxicology, 17: 507-511.<br />
BEEBY, A. & RICHMOND, L. 1989. The <strong>shell</strong> as a site<br />
<strong>of</strong> <strong>lead</strong> <strong>deposition</strong> <strong>in</strong> Helix <strong>aspersa</strong>. Archives <strong>of</strong><br />
Environmental Contam<strong>in</strong>ation and Toxicology, 18:<br />
623-628.<br />
BLEAKNEY, MM. FLENHNG, CC & MARKS, RJ.<br />
1989. Geneuc and phenotypic variation <strong>in</strong><br />
allopatnc populations <strong>of</strong> Helix aspen (Mailer): A<br />
prelim<strong>in</strong>ary report In: BCPC Monograph, No. 41,<br />
Slugs and Snails <strong>in</strong> World Agriculture (I. Henderson,<br />
ed), 319-326. British Crop Protection<br />
Council, Thornton Heath.<br />
CLAYTON, J.W. & TRETIAK, D.W. 1972. Am<strong>in</strong>ecitrate<br />
buffers for pH control <strong>in</strong> starch gel electrophoresis.<br />
<strong>Journal</strong> <strong>of</strong> the Fisheries Research<br />
Board <strong>of</strong> Canada, 29:1160-1172.<br />
CROOK, SJ. 1980. Studies on the ecological genetics<br />
o/Helix <strong>aspersa</strong>. PhD. Thesis, University <strong>of</strong> Dundee.<br />
CROOK, SJ. 1980. Genetic studies <strong>of</strong> allozyme variation<br />
<strong>in</strong> leut<strong>in</strong>e am<strong>in</strong>opeptidase <strong>in</strong> the land snail<br />
Helix <strong>aspersa</strong> (MUller). <strong>Journal</strong> <strong>of</strong> Molluscan<br />
Studies, 48: 362-365.<br />
CROW, J.F. & KIMURA, M. 1970. An <strong>in</strong>troduction to<br />
population genetics theory. Harper & Row Publishers,<br />
New York.<br />
FRATI, F., FANCIULU, P.P. & POSTHUMA, L. 1992.<br />
Allozyme variation <strong>in</strong> reference and metalexposed<br />
natural populations <strong>of</strong> Orchaella c<strong>in</strong>cta<br />
(Insecta: CoUemboIa). Biochemical Systematics<br />
and Ecology, 20: 297-310.<br />
GUILLER, A., MADEC, L & DAGUZAN, J. 1994. Geographic<br />
patterns <strong>of</strong> genetic differentiation <strong>in</strong> the<br />
landsnail Helix <strong>aspersa</strong> MOUer (Gastropoda:<br />
Pulmonata). <strong>Journal</strong> <strong>of</strong> Molluscan Studies, 60.<br />
205-221.<br />
HEAGLER, M.G., NEWMAN, M.C, MULVEY, M. &<br />
DKON, P.M. 1993. Allozyme genotype <strong>in</strong><br />
mosquit<strong>of</strong>ish, Gambusia holbrooki, dur<strong>in</strong>g mercury<br />
exposure: temporal stability, concentration<br />
effects and field verification. Environmental Toxicology<br />
and Chemistry, 12:385-395.<br />
MADEC, L. 1991a. Enzymatic variation <strong>in</strong> natural<br />
populations <strong>of</strong> Helix <strong>aspersa</strong> Muller. Compte<br />
Rendu de I'Academie des Sciences, Paris 313 HI:<br />
339-344.<br />
Downloaded from<br />
http://mollus.oxfordjournals.org/<br />
by guest on July 15, 2013
GENETIC AND CONCHOLOGICAL COMPARISON OF SNAILS 221<br />
MADEC, L. 1991b. Genetic divergence <strong>in</strong> natural<br />
populations <strong>of</strong> the land snail Helix aspena Mailer,<br />
1774. <strong>Journal</strong> <strong>of</strong>Molluscan Studies, 57:483-487<br />
NEI, M. 1978 Estimation <strong>of</strong> average heterozygosity<br />
and genetic distance from a small number <strong>of</strong> <strong>in</strong>dividuals.<br />
Genetics, 89: 583-590.<br />
NEVO, E., PERL, T., BEILES, A & WOOL, D. 1981.<br />
Mercury selection <strong>of</strong> allozymes genotypes <strong>in</strong><br />
shrimps. Expenentia, 37.1152-1154.<br />
NEWMAN, M.C., DIAMOND, S.A., MULVEY, M,<br />
DIXON, PM. & MARTINSON, D 1989 AUozyme<br />
genotype and time to death <strong>of</strong> mosquit<strong>of</strong>ish, Gambusia<br />
aff<strong>in</strong>u (Baird and Girard), dur<strong>in</strong>g acute<br />
exposure: A comparison <strong>of</strong> arsenate and <strong>in</strong>organic<br />
mercury. Aquatic Toxicology, 15:141-156.<br />
NEWMAN, M.C, MULVEY, M., BEEBY, A., HURST,<br />
R.W. & RICHMOND, L. 1994. Snail (Helix <strong>aspersa</strong>)<br />
exposure history and possible adaptation to <strong>lead</strong><br />
as reflected <strong>in</strong> <strong>shell</strong> composition. Archives <strong>of</strong><br />
Environmental Contam<strong>in</strong>ation and Toxicology, 27.<br />
346-351<br />
OTA, T. 1993 DISPAN. Genetic distance and phylogenetic<br />
analysis Pennsylvania State University.<br />
University Park, PA.<br />
POSTHUMA, L. 1990. Genetic differentiation between<br />
populations <strong>of</strong> Orchesella cmcta (Collembola)<br />
from heavy metal contam<strong>in</strong>ated sites. <strong>Journal</strong> <strong>of</strong><br />
Applied Ecology, 27: 609-622.<br />
POSTHUMA, L. & VAN STRAALEN, N M. 1993. Heavy<br />
metal adaptation <strong>in</strong> terrestrial <strong>in</strong>vertebrates: a<br />
review <strong>of</strong> occurrences, genetics, physiology and<br />
ecological consequences. Comparative Biochemistry<br />
and Physiology, 106C: 11-38.<br />
RICHARDSON, B J., BAVERSTOCK, P.R. & ADAMS, M<br />
1986. AUozyme electrophoresis- a handbook for<br />
animal systematic and population studies. Academic<br />
Press. Orlando.<br />
RICHMOND, L. & BEEBY, A. 1993. A comparative<br />
study <strong>of</strong> <strong>lead</strong> uptake by three populations <strong>of</strong> the<br />
snail Helix <strong>aspersa</strong> MUller. Polish <strong>Journal</strong> <strong>of</strong><br />
Environmental Studies, 1.9-13.<br />
SAS INSTITUTE INC. 1987. SAS user's guuie: statistics<br />
SAS Institute Inc., Cary, NC<br />
SELANDER, R.K. & KAUFMAN, D.W. 1975. Genetic<br />
structure <strong>of</strong> populations <strong>of</strong> the brown snail (Helix<br />
<strong>aspersa</strong>). I. Microgeographic variation. Evolution,<br />
2*385-400<br />
SELANDER, R.K & OCHMAN, H. 1983. The genetic<br />
structure <strong>of</strong> population as illustrated by molluscs.<br />
Isozymes: Current Topics <strong>in</strong> Biological and Medical<br />
Research, 10: 93-123.<br />
SELANDER, R.K., SMITH, M.H., YANG, S.Y., JOHN-<br />
SON, W.E. & GENTRY, J.B. 1971 Biochemical<br />
polymorphism and systematic <strong>in</strong> the genus<br />
Peromyscus 1 Variation <strong>in</strong> the old-field mouse<br />
(Peromyscus polionotus) Studies <strong>in</strong> Genetics. W<br />
University <strong>of</strong> Texas Publications No. 7103. pp. 49-<br />
90<br />
SMOUSE, P.E., LONG, J.C & SOKAL, R R. 1986. Multiple<br />
regression and correlation extensions <strong>of</strong> the<br />
Mantel test <strong>of</strong> matrix correspondence. Systematic<br />
Zoology, 35- 627-632<br />
SWOFFORD, D L. & SELANDER, R.B. 1981 BIOSYS-<br />
1. A FORTRAN program for the comprehensive<br />
analysis <strong>of</strong> electrophoretic data <strong>in</strong> population<br />
genetics and systemaucs. <strong>Journal</strong> <strong>of</strong> Heredity, 72:<br />
281-283<br />
TRANVIK, L., BENGTSSEN, G. & RUNGREN, S. 1993.<br />
Relative abundance and resistance traits <strong>of</strong> two<br />
Collembolla species under metal stress. <strong>Journal</strong> <strong>of</strong><br />
Applied Ecology (In press).<br />
WRIGHT, S 1965 The <strong>in</strong>terpretation <strong>of</strong> population<br />
structure by F-statisUcs with special regard to<br />
systems <strong>of</strong> mat<strong>in</strong>g. Evolution, 9: 395-420.<br />
Downloaded from<br />
http://mollus.oxfordjournals.org/<br />
by guest on July 15, 2013
Appendix 1. Allozyme frequencies for 34 populations <strong>of</strong> Helix <strong>aspersa</strong>. Population abbreviations are given <strong>in</strong> Table 1. Deviation from Hardy-We<strong>in</strong>berg expectations:<br />
*, p < 0.05; •*, p < 0.01.<br />
BE BJ CA CN Cfl ET FB FR GS HA HS ID IF 1R KB LU Lt LE UC<br />
LL<br />
LW<br />
Ml<br />
NC<br />
NS<br />
RO<br />
SA<br />
SB<br />
SC<br />
SF<br />
SH<br />
SJ ST SU TO<br />
10 10 10 10 10 10 1 10 0 10<br />
1 10 0 1.0<br />
098<br />
1.0<br />
to 10 10<br />
1 10098 0 098 10<br />
10<br />
1 10 0 10 10 099 10<br />
0 02<br />
0 02<br />
0 01<br />
1.0<br />
1 0<br />
1 0<br />
10<br />
10<br />
10<br />
1.0<br />
1.0<br />
1.0<br />
0 14 0 02<br />
0 01 0 01 0 01<br />
002<br />
10 0 79 79 098 099 10 10 039 0 99 99 1 10 0 0.99 10 1.0 1.0 0.98 099 10 10 10 10098 098 10 10 1.0 10 10<br />
0 07 0 01<br />
0 01<br />
0 01<br />
0 01<br />
0.03<br />
007 008 0 11 006 0.18 0 01 002 0.19 003 0 16 0 08 0 13 0 05 0 04 0.19 0.28 0 20 0 17 0 07 001<br />
1.0 0 93 0 92 0 89 0 94 0 84 0 99 038 0 81 10 0 97 0.86 0 92 0 87 10 0 96 0.96 031 0 79 030 030 0 93 0 99<br />
Downloaded from<br />
http://mollus.oxfordjournals.org/ by guest on July 15, 2013<br />
002<br />
098<br />
1.0<br />
10<br />
0 02<br />
0.97<br />
0 01<br />
10<br />
0 01<br />
099<br />
099<br />
0.01<br />
039<br />
0 01<br />
10<br />
1 0<br />
10<br />
006<br />
0.95<br />
0.03<br />
034<br />
0 19<br />
031<br />
0.02<br />
038<br />
0.04<br />
096<br />
0.24<br />
0.78<br />
0.02<br />
098<br />
004<br />
1 0 036 098 099 10 096 0 97 10 10 096099 10 0 98 0 93 10 10 10 099 035 0 98 0 87 0 99 0.99<br />
0 10 0 02 0.01 0 04 0 03 0 04 0 01 0 02 0 07 0 01 0 18 0 02 0 13 0 01 0 01<br />
10<br />
1.0<br />
1.0<br />
036<br />
005<br />
039<br />
001<br />
0.96<br />
004<br />
10<br />
10<br />
10<br />
3 1.0<br />
4<br />
G8pd<br />
2<br />
3 10<br />
4<br />
6<br />
Gpl<br />
1<br />
2 an<br />
3 039<br />
Pgm 1<br />
2<br />
3 10<br />
4<br />
3 10 093 099 082 036 083 10 0 99 0.98 091 0 88 032 0 90 0 94 038 0 98 0 99 0 98 0 97 10 0 98 0.97 1.0 0 99 10 0 99 0 64 095 0 93 10 10 10 0 84<br />
4 0.07 0.01 0.18 0 15 0 17 0 01 0 04 0.09 0 02 0 18 010 0 06 0 02 0 02 0 01 0 02 0 03 0 02 0 03 0 01 0 01 0 36 0 05 0 07 0 18<br />
Mdhi<br />
2 0.18 011 003 0 17 0.05 0 07 0 18 0.18 0 07 0 07 0 02 0 08 0.16 0 03 0 12 0 10 0 04 004 0 06 002 0 11 0 02 0 13 0 09 0 03 0 08 0 05 001 0 10 0.03* 0 08<br />
3 0.38 0 41 031 0.17 0 79 0 24 0 34 0 62 036 0 86 038 0.54 0 53 0 06 0 58 0 43 0 71 0 67 0 63 0 93 0 66 0 72 0 74 0 51 0 94 0 42 0 44 0 47 0 63 0 62 0 34 0 51* 0 49<br />
4 0 44 048 006068 0 16 069 0480300 67 008 038 0 31 0 91 030 0 47 0 24 0 29 0 42 0 05 0 23 0 26 0 13 0 40 0 03 0 60 0 61 0 52 0.27 0 48 0 58 0 49 0 43<br />
6 0 01<br />
Mdh2<br />
1 0 01<br />
2 0 03 0 01 0 03 0 02 0 02 0 02 0 04 0 02 0 02 0 21 0 02<br />
3 10 1.0 1.0 1.0 10 0.97 10 1.0 10 0 99 1.0 1.0 0 96 0 98 038 038 10 10 098 10 10 10 10 098 10 10 098 1.0 10 10 0 78 098 10<br />
4 001<br />
Gpd<br />
2 005 002 0.06 036 002 0 04 0 09 001 0 02 011 0 17 0 02 0 02 0 04 0 01 001 001 0.01 001 001 0 04 0 03 0 03 0.03 0 02 0 01 001<br />
3 0 97 093 098 0 94 0 96 098 038 0 91 0.99 0 98 0 89 0.79 0 97 0.98 038 0 99 0 99 0 89 0 89 1.0 0 99 1.0 0 90 036 10 0 98 0.97 0 97 0 97 1.0 0 99 10 0 99<br />
4003 0040 01 0 02
5S<br />
38<br />
o<br />
as<br />
004 S3<br />
o g<br />
ss<br />
:5S3<br />
CM<br />
O<br />
.77<br />
23<br />
S8<br />
S3<br />
S ID<br />
O O o o<br />
o o o o<br />
O O OOO<br />
ts<br />
28<br />
3<br />
3<br />
S3<br />
O O<br />
OOO O O<br />
tn en<br />
*~ OOO<br />
32 S3<br />
-a<br />
r-tn csoon<br />
esj«- ^r^o<br />
.88<br />
12<br />
8£<br />
1.0<br />
too<br />
82 5523 S<br />
iss<br />
u<br />
C:s<br />
en ro«ras<br />
5 O CM ro<br />
o o o<br />
o<br />
82<br />
S3<br />
SSS<br />
£8<br />
SSS<br />
So =?: 5<br />
10 000<br />
It S8SS S3 S3:582 382<br />
i2 SSS o 28 5SS<br />
3S<br />
o o<br />
o o<br />
£3. 3S<br />
I
Downloaded from<br />
http://mollus.oxfordjournals.org/<br />
by guest on July 15, 2013


