Figures and Tables for 2012 Annnual Report
Figures and Tables for 2012 Annnual Report
Figures and Tables for 2012 Annnual Report

You also want an ePaper? Increase the reach of your titles
YUMPU automatically turns print PDFs into web optimized ePapers that Google loves.
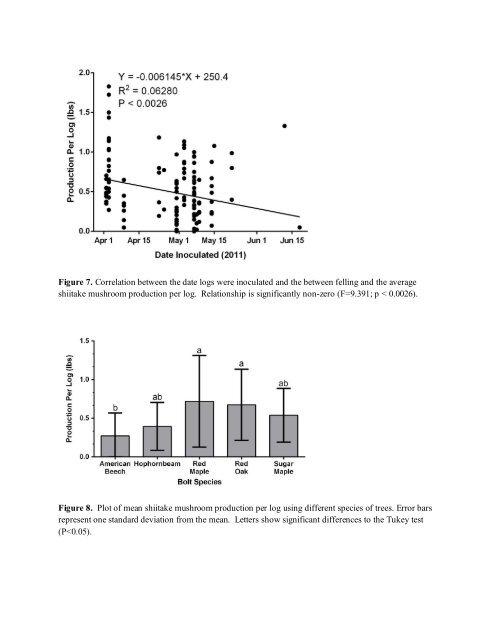
Figure 7. Correlation between the date logs were inoculated <strong>and</strong> the between felling <strong>and</strong> the average<br />
shiitake mushroom production per log. Relationship is significantly non-zero (F=9.391; p < 0.0026).<br />
Figure 8. Plot of mean shiitake mushroom production per log using different species of trees. Error bars<br />
represent one st<strong>and</strong>ard deviation from the mean. Letters show significant differences to the Tukey test<br />
(P