Figures and Tables for 2012 Annnual Report
Figures and Tables for 2012 Annnual Report
Figures and Tables for 2012 Annnual Report

Create successful ePaper yourself
Turn your PDF publications into a flip-book with our unique Google optimized e-Paper software.
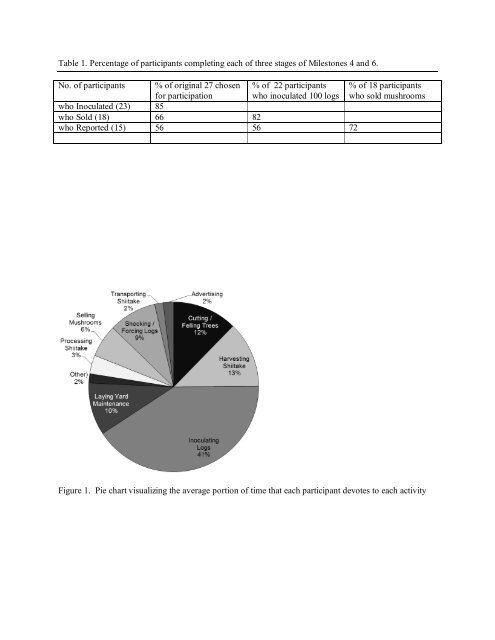
Table 1. Percentage of participants completing each of three stages of Milestones 4 <strong>and</strong> 6.<br />
No. of participants % of original 27 chosen % of 22 participants % of 18 participants<br />
<strong>for</strong> participation who inoculated 100 logs who sold mushrooms<br />
who Inoculated (23) 85<br />
who Sold (18) 66 82<br />
who <strong>Report</strong>ed (15) 56 56 72<br />
Figure 1. Pie chart visualizing the average portion of time that each participant devotes to each activity
Figure 2. Pie chart visualizing the proportion of labor completed by employees, volunteers, <strong>and</strong> owners.
Table 2. Inputs (labor <strong>and</strong> expenses), shiitake mushroom production, earnings <strong>and</strong> profit on a per bolt<br />
basis <strong>for</strong> 22 project participants.<br />
Participant No. of<br />
Bolts<br />
Total Hours<br />
per bolt 1<br />
Total Owner<br />
Hours per<br />
bolt 1<br />
Total<br />
Expenses per<br />
Bolt 1,2<br />
Annual<br />
Production<br />
per Bolt (lbs)<br />
Annual<br />
Earnings per<br />
Bolt<br />
Profit<br />
per<br />
Bolt**<br />
1 100 0.74 0.53 $1.28 - $0.79 ($0.49)<br />
2 100 1.10 0.50 $0.91 1.01 $11.94 $11.03<br />
3 100 1.88 1.72 $4.73 2.04 $19.61 $14.89<br />
4 132 1.36 0.99 $5.93 1.69 $7.33 $1.39<br />
5 140 0.61 0.05 $6.62 0.64 $7.01 $0.39<br />
6 100 2.00 0.02 $7.10 1.42 $14.73 $7.63<br />
7 100 0.62 0.58 $3.00 0.46 $5.60 $2.60<br />
8* 100 0.86 0.61 $1.88 - - -<br />
9 100 1.09 0.97 $6.37 0.39 $2.99 ($3.38)<br />
10* 100 0.73 0.67 $6.02 0.66 $4.84 ($1.18)<br />
11* 100 1.82 0.75 $4.47 - - -<br />
12 100 2.21 2.15 $3.91 0.92 $12.80 $8.89<br />
13 100 0.92 0.82 $10.73 0.49 $5.46 ($5.27)<br />
14* 100 0.63 0.59 $1.63 - - -<br />
15* 100 0.31 0.31 $29.87 0.23 - -<br />
16 3 100 0.30 0.30 $0.99 - $4.37 $3.38<br />
17 100 0.47 0.26 $4.57 0.44 $1.94 ($2.63)<br />
18 120 1.02 0.90 $5.20 1.57 $18.87 $13.67<br />
19 100 0.82 0.66 $2.91 1.30 $21.79 $18.88<br />
20* 100 0.91 0.82 $2.51 - - -<br />
21* 100 0.62 0.59 $10.49 - - -<br />
22* 100 0.57 0.57 $1.61 - - -<br />
Average 102.86 1.12 0.77 $4.74 1.06 $9.89 $5.15<br />
St<strong>and</strong>ard<br />
Deviation<br />
10.69 0.61 0.61 $2.83 0.67 $6.87 $7.47<br />
Totals*** 2312 2231 1574 $12,746.00 -- $14,609.00*<br />
* Participants did not submit harvest or sales data. Their incomplete data was not used in the calculations<br />
of average <strong>and</strong> total earnings or profit.<br />
** Numbers in parentheses denote losses.<br />
*** Sum of all the in<strong>for</strong>mation provided by participants. Not calculated on a per-bolt basis.<br />
1 Values were calculated excluding any labor or expenses incurred felling trees or inoculating logs in <strong>2012</strong>.<br />
2 Values includes both the expenses incurred on durable <strong>and</strong> non-durable goods as well as expenses on assocatied<br />
employee labor<br />
3 All logs fruited as a result of heavy rain
Figure 3. (A) Correlation between the mean number of hours each participant invested per bolt <strong>and</strong> the<br />
mean profit generated per bolt. The relationship is not significantly non-zero (p< 0.1386). (B)<br />
Correlation between the total expenses each participant invested per bolt <strong>and</strong> the mean profit generated<br />
per bolt. The relationship is not significantly non-zero (p< 0.1121).<br />
Figure 4. (A) Correlation between the mean number of hours each participant invested per bolt <strong>and</strong> the<br />
annual production of shiitake mushroom per bolt. The relationship is significantly non-zero (p< 0.0085).<br />
(B) Correlation between the total expenses each participant invested per bolt <strong>and</strong> the annual production of<br />
shiitake mushroom per bolt. The relationship is not significantly non-zero (p< 0.9877).
Figure 5. Correlation between time of year the logs were shocked <strong>and</strong> the average shiitake mushroom<br />
production per log. Relationship is significantly non-zero (F=17.42; p < 0.0001).<br />
Figure 6. Correlation between the time of year trees were felled <strong>and</strong> the average shiitake mushroom<br />
production per log. Relationship is not significantly non-zero (F=0.9090; p < 0.3421).
Figure 7. Correlation between the date logs were inoculated <strong>and</strong> the between felling <strong>and</strong> the average<br />
shiitake mushroom production per log. Relationship is significantly non-zero (F=9.391; p < 0.0026).<br />
Figure 8. Plot of mean shiitake mushroom production per log using different species of trees. Error bars<br />
represent one st<strong>and</strong>ard deviation from the mean. Letters show significant differences to the Tukey test<br />
(P
Figure 9. Effect of Sales Venue on sale price of fresh shiitake mushrooms.<br />
Figure 10. Proportion of sales of fresh shiitake mushroom among different venues.