solution
solution
solution

You also want an ePaper? Increase the reach of your titles
YUMPU automatically turns print PDFs into web optimized ePapers that Google loves.
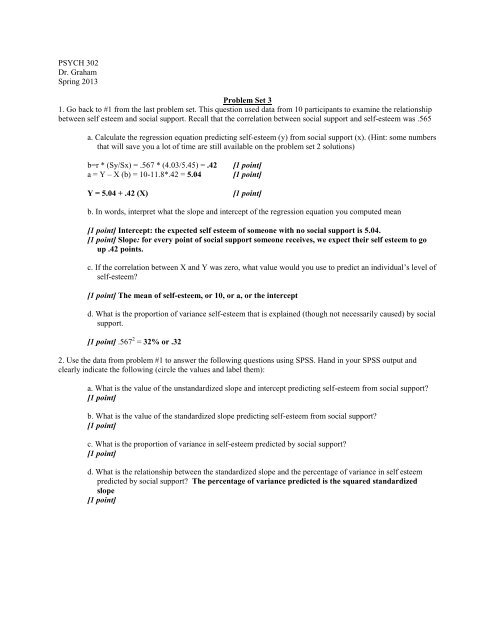
PSYCH 302<br />
Dr. Graham<br />
Spring 2013<br />
Problem Set 3<br />
1. Go back to #1 from the last problem set. This question used data from 10 participants to examine the relationship<br />
between self esteem and social support. Recall that the correlation between social support and self-esteem was .565<br />
a. Calculate the regression equation predicting self-esteem (y) from social support (x). (Hint: some numbers<br />
that will save you a lot of time are still available on the problem set 2 <strong>solution</strong>s)<br />
b=r * (Sy/Sx) = .567 * (4.03/5.45) = .42 [1 point]<br />
a = Y – X (b) = 10-11.8*.42 = 5.04 [1 point]<br />
Y = 5.04 + .42 (X) [1 point]<br />
b. In words, interpret what the slope and intercept of the regression equation you computed mean<br />
[1 point] Intercept: the expected self esteem of someone with no social support is 5.04.<br />
[1 point] Slope: for every point of social support someone receives, we expect their self esteem to go<br />
up .42 points.<br />
c. If the correlation between X and Y was zero, what value would you use to predict an individual’s level of<br />
self-esteem?<br />
[1 point] The mean of self-esteem, or 10, or a, or the intercept<br />
d. What is the proportion of variance self-esteem that is explained (though not necessarily caused) by social<br />
support.<br />
[1 point] .567 2 = 32% or .32<br />
2. Use the data from problem #1 to answer the following questions using SPSS. Hand in your SPSS output and<br />
clearly indicate the following (circle the values and label them):<br />
a. What is the value of the unstandardized slope and intercept predicting self-esteem from social support?<br />
[1 point]<br />
b. What is the value of the standardized slope predicting self-esteem from social support?<br />
[1 point]<br />
c. What is the proportion of variance in self-esteem predicted by social support?<br />
[1 point]<br />
d. What is the relationship between the standardized slope and the percentage of variance in self esteem<br />
predicted by social support? The percentage of variance predicted is the squared standardized<br />
slope<br />
[1 point]
Regression<br />
[DataSet1] U:\correlationSPSS.sav<br />
SelfEsteem<br />
SocialSupport<br />
Pearson Correlation<br />
Sig. (1-tailed)<br />
N<br />
Model<br />
1<br />
Descriptive Statistics<br />
Mean Std. Deviation N<br />
10.00 4.028 10<br />
12.00 5.416 10<br />
Correlations<br />
SelfEsteem<br />
SocialSupport<br />
SelfEsteem<br />
SocialSupport<br />
SelfEsteem<br />
SocialSupport<br />
Variables Entered/Removed b<br />
Social<br />
Support a Variables Variables<br />
Entered Removed Method<br />
. Enter<br />
a. All requested variables entered.<br />
b. Dependent Variable: SelfEsteem<br />
Model<br />
1<br />
Model Summary<br />
SelfEsteem SocialSupport<br />
1.000 .565<br />
.565 1.000<br />
. .044<br />
.044 .<br />
10 10<br />
10 10<br />
.565 a Adjusted Std. Error of<br />
R R Square R Square the Estim ate<br />
.320 .235 3.524<br />
a. Predictors: (Constant), SocialSupport<br />
Model<br />
1<br />
Regression<br />
Residual<br />
Total<br />
ANOVA b<br />
46.670 1 46.670 3.759 .089 a<br />
Sum of<br />
Squares df Mean Square F Sig.<br />
99.330 8 12.416<br />
146.000 9<br />
a. Predictors: (Constant), SocialSupport<br />
b. Dependent Variable: SelfEsteem<br />
Proportion of variance predicted
Model<br />
1<br />
[1 point]<br />
(Constant)<br />
SocialSupport<br />
Unstandardized<br />
Coefficients<br />
a. Dependent Variable: SelfEsteem<br />
3a.<br />
Coefficients a<br />
Standardized<br />
Coefficients<br />
B Std. Error Beta<br />
t Sig.<br />
4.955 2.831 1.750 .118<br />
.420 .217 .565 1.939 .089<br />
2d. The percentage of variance explained (R 2 ) is the squared standardized slope (β)<br />
[1 point] Correctly Running Analysis<br />
Regression<br />
[DataSet2] U:\myweb\PS3Data.sav<br />
pain<br />
severity<br />
eeg<br />
gsr<br />
epinephe<br />
physfit<br />
Unstandardized Intercept<br />
Unstandardized Slope<br />
Descriptive Statistics<br />
Mean Std. Deviation N<br />
50.00 10.000 330<br />
21.9605 19.10513 330<br />
25.7288 18.03886 330<br />
70.0933 15.87248 330<br />
11.7758 8.01128 330<br />
50.0001 9.99999 330<br />
Standardized Slope
Pearson Correlation<br />
Sig. (1-tailed)<br />
N<br />
Model<br />
1<br />
pain<br />
severity<br />
eeg<br />
gsr<br />
epinephe<br />
physfit<br />
pain<br />
severity<br />
eeg<br />
gsr<br />
epinephe<br />
physfit<br />
pain<br />
severity<br />
eeg<br />
gsr<br />
epinephe<br />
physfit<br />
Variables Entered/Removed b<br />
physfit,<br />
eeg, gsr,<br />
severity,<br />
epinephe a<br />
Variables<br />
Entered<br />
Variables<br />
Removed Method<br />
Correlations<br />
pain severity eeg gsr epinephe physfit<br />
1.000 .644 -.505 .360 .607 -.148<br />
. Enter<br />
a. All requested variables entered.<br />
b. Dependent Variable: pain<br />
Model<br />
1<br />
Model Summary<br />
.719 a Adjusted Std. Error of<br />
R R Square R Square the Estim ate<br />
.518 .510 6.999<br />
a.<br />
Predictors: (Constant), physfit, eeg, gsr, severity,<br />
epinephe<br />
.644 1.000 -.450 .460 .856 .110<br />
-.505 -.450 1.000 -.387 -.590 .037<br />
.360 .460 -.387 1.000 .441 .126<br />
.607 .856 -.590 .441 1.000 .214<br />
-.148 .110 .037 .126 .214 1.000<br />
. .000 .000 .000 .000 .004<br />
.000 . .000 .000 .000 .023<br />
.000 .000 . .000 .000 .251<br />
.000 .000 .000 . .000 .011<br />
.000 .000 .000 .000 . .000<br />
.004 .023 .251 .011 .000 .<br />
330 330 330 330 330 330<br />
330 330 330 330 330 330<br />
330 330 330 330 330 330<br />
330 330 330 330 330 330<br />
330 330 330 330 330 330<br />
330 330 330 330 330 330
Model<br />
1<br />
ANOVA b<br />
17028.965 5 3405.793 69.528 .000 a<br />
Sum of<br />
Squares df Mean Square F Sig.<br />
Regression<br />
Residual 15871.035 324 48.985<br />
Total 32900.000 329<br />
a. Predictors: (Constant), physfit, eeg, gsr, severity, epinephe<br />
b. Dependent Variable: pain<br />
Model<br />
1<br />
(Constant)<br />
severity<br />
eeg<br />
gsr<br />
epinephe<br />
physfit<br />
a.<br />
Dependent Variable: pain<br />
Unstandardized<br />
Coefficients<br />
Coefficients a<br />
Standardized<br />
Coefficients<br />
B Std. Error Beta<br />
t Sig.<br />
54.754 2.736 20.011 .000<br />
.222 .041 .425 5.412 .000<br />
-.108 .028 -.194 -3.818 .000<br />
.031 .028 .050 1.106 .270<br />
.195 .109 .156 1.783 .076<br />
-.227 .041 -.227 -5.499 .000
3b. SPI = 54.754 + .031 (GSR) - .108 (eeg) + .195 (Epinepherine) + .222 (Severity) - .227 (PFI)<br />
[1 point] Intercept<br />
[2.5 points] Each unstandardized slope with each predictor (1/2 point each)<br />
3c. 51.8% of the variance in SPI scores is accounted for by all of the independent variables considered<br />
together.<br />
[1 point]<br />
3d.<br />
[5 points, -1 per error]<br />
Table 1<br />
Summary of Multiple Regression Analysis for Variables Predicting Subjective Pain<br />
____________________________________<br />
Zero-order Beta-<br />
Predictor correlation weight<br />
GSR .360 .050<br />
EEG -.505 -.194<br />
Epinepherine .607 .156<br />
Burn Severity .644 .425<br />
Physical Fitness Index -.148 -.227<br />
Note. R 2 = .518. Dependent Variable = Subjective Pain Index. EEG = Electroencephalogram, GSR<br />
= Galvanic Skin Response.<br />
3e. Burn severity level is the best predictor of pain, in the context of the other variables.<br />
[1 point]<br />
3f. GSR is the worst predictor of pain, in the context of the other variables.<br />
[1 point]<br />
3g. Considered alone, Burn severity level is the best predictor of pain.<br />
[1 point]<br />
3h. Considered alone, Physical Fitness is the worst predictor of pain.<br />
[1 point]
3i. Physical fitness appears to be acting as a suppressor variable. The PFI directly contributes relatively<br />
little to the prediction of pain by itself, but gets a relatively large amount of credit in the context of the<br />
other variables. This suggests that considering physicial fitness makes the other measures better<br />
predictors of pain. The other predictors may be partly influenced by how physically fit an individual is;<br />
however, it is not this part of the other variables that predicts pain. The inclusion of PFI scores acts to<br />
suppress the noise (or error) in the other variables.<br />
[1 point] Identify correct suppressor<br />
[1 point] Explain appropriately<br />
3j. Without PFI, the other variables explain 47.3% of the variance in subjective pain. This suggests that<br />
the inclusion of PFI scores explains an additional 4.5% (.518 - .473) of the variance in subjective pain.<br />
[1 point]