Water Resources Management Plan - National Park Service
Water Resources Management Plan - National Park Service
Water Resources Management Plan - National Park Service

Create successful ePaper yourself
Turn your PDF publications into a flip-book with our unique Google optimized e-Paper software.
WATER RESOURCES MANAGEMENT PLAN<br />
CHATTAHOOCHEE RIVER<br />
NATIONAL RECREATION AREA<br />
GEORGIA<br />
June 2000<br />
Sam Kunkle<br />
Department of Earth <strong>Resources</strong><br />
Colorado State University<br />
and<br />
David Vana-Miller<br />
<strong>Water</strong> <strong>Resources</strong> Division<br />
<strong>National</strong> <strong>Park</strong> <strong>Service</strong><br />
in cooperation with the<br />
Chattahoochee River <strong>National</strong> Recreation Area<br />
ii
PREPARERS OF THE REPORT<br />
This report was prepared by Sam Kunkle, <strong>Water</strong>shed Scientist and Faculty Affiliate of the<br />
Department of Earth <strong>Resources</strong>, Colorado State University and by David Vana-Miller, <strong>Water</strong><br />
<strong>Resources</strong> <strong>Plan</strong>ning Program Team Leader, <strong>Water</strong> <strong>Resources</strong> Division of the <strong>National</strong> <strong>Park</strong><br />
<strong>Service</strong>, Denver. They worked in close cooperation with Ted <strong>Water</strong>s, Natural Resource<br />
Specialist at the Chattahoochee River <strong>National</strong> Recreation Area (CRNRA).<br />
The maps in ArcView were prepared by Kasey Hartley, Office of Technology Outreach <strong>Service</strong>s<br />
(OTOS), University of Georgia in cooperation with Joanna Arthur, seasonal Natural <strong>Resources</strong><br />
Intern at the CRNRA, and with technical advice from Steve Davis at OTOS. The senior author<br />
prepared other computer-based graphic maps and illustrations in the report.<br />
Gary Hendrix, environmental consultant in the Atlanta area, provided significant inputs for<br />
preparation of the report’s recommendations and project proposals. Paul O’Connor, Post-<br />
Graduate Assistant, Department of Earth <strong>Resources</strong>, Colorado State University, conducted some<br />
of the analyses used in summarizing the water quality data. Mark Flora and Don Weeks of the<br />
<strong>Plan</strong>ning and Evaluation Branch, <strong>Water</strong> <strong>Resources</strong> Division, NPS, and Adrienne Funk at CRNRA<br />
provided technical advice on the microbial projects and manuscript review. The project’s budget<br />
and contract coordination were by Gloria Krob, Department of Earth <strong>Resources</strong>, Colorado State<br />
University. The <strong>Water</strong> <strong>Resources</strong> Division, <strong>National</strong> <strong>Park</strong> <strong>Service</strong>, funded the development of<br />
this <strong>Water</strong> <strong>Resources</strong> <strong>Management</strong> <strong>Plan</strong>.<br />
ACKNOWLEDGMENTS<br />
Appreciation is extended to colleagues in the various organizations who generously provided<br />
materials, data, references, interviews, or ideas for this report. The complete list of contacts<br />
appears in Appendix B of the report.<br />
Special thanks are extended to those individuals who graciously provided data, maps, reports, or<br />
ideas, including: Sally Bethea and her colleagues at the Upper Chattahoochee Riverkeeper; John<br />
Biagi and his associates in the Georgia Department of Natural <strong>Resources</strong>; Bob Brice and his staff<br />
at Cobb County, especially Robert Bourne; Jimmy Bramblett and other colleagues with the<br />
Natural <strong>Resources</strong> Conservation <strong>Service</strong>; Joanne Brandt, Pat Taylor and other associates with the<br />
U.S. Army Corps of Engineers; Roy Burke, Kevin Farrell, and other staff at Georgia’s<br />
Environmental Protection Division; Bill Couch at the Georgia Fish Hatchery, Buford; Carol<br />
Couch and her associates at the U.S. Geological Survey’s Regional Office; Dan Hippe, Jake<br />
Peters, Betsy Frick, and other colleagues at the U.S. Geological Survey’s District Office; John<br />
Cunard at Forsyth County; Howard Marshall and other associates at the U.S. Environmental<br />
Protection Agency; Larry Neal, Elizabeth Booth and other staff at Law Environmental and<br />
Engineering <strong>Service</strong>s, Inc; Tom Simpson and other colleagues at CH2MHill; Pat Stevens and<br />
staff at the Atlanta Regional Commission; Dave Spencer at the Southeast Regional Office,<br />
<strong>National</strong> <strong>Park</strong> <strong>Service</strong>; Betsy Berns-Stark, Fulton County; and Wayne Woodall, Steve Cannon<br />
and other associates, Gwinnett County.<br />
iii
Preparers of the Report / ii<br />
Acknowledgments / ii<br />
List of Figures / v<br />
List of Tables / vi<br />
Executive Summary / viii<br />
TABLE OF CONTENTS<br />
1. Introduction / 1<br />
1.1. Introduction / 1<br />
1.2. The Chattahoochee River NRA / 5<br />
1.3. Objectives of a <strong>Water</strong> <strong>Resources</strong> <strong>Management</strong> <strong>Plan</strong> / 5<br />
2. A Geographic Overview of the Chattahoochee River <strong>National</strong> Recreation Area / 8<br />
2.1. Introduction / 8<br />
2.2. Topography and Landscapes Along the River / 8<br />
2.3. Climatic Conditions and Precipitation / 12<br />
2.4. Geology and Soils of the Area / 12<br />
2.5. Vegetative Patterns in the Area / 17<br />
2.6. Demography / 17<br />
3. Land and Resource Uses / 20<br />
3.1. Introduction / 20<br />
3.2. Land Ownership and Boundaries / 20<br />
3.3. Land Use in the CRNRA and Vicinity / 20<br />
3.4. Organizations, Expertise, and Opportunities for Cooperation / 25<br />
3.5. Some Relevant <strong>Water</strong> Resource Laws and Regulations / 27<br />
3.6. An Overview of the Issues of <strong>Water</strong> <strong>Resources</strong> / 35<br />
4. An Overview of the <strong>Water</strong> and Aquatic Biological <strong>Resources</strong> / 39<br />
4.1. Introduction / 39<br />
4.2. Surface Hydrology and Discharges / 39<br />
4.3. Hydrogeology / 43<br />
4.4. Synopsis of the <strong>Water</strong> Quality of the River and Tributaries / 49<br />
4.5. Aquatic Biology, Ecology, and Fisheries in the CRNRA / 71<br />
4.6. Floodplains, Wetlands, and Riparian Areas / 96<br />
5. River Flow Distribution, <strong>Water</strong> Use, and <strong>Water</strong> Allocations / 97<br />
5.1. Demands for <strong>Water</strong> Supplies / 97<br />
5.2. Tri-State Allocation and the Recreation Area / 101<br />
5.3. Role of Dams and Lake Lanier's Effect on the CRNRA / 105<br />
5.4. Issues Related to Recreational Demands / 110<br />
6. <strong>Water</strong>shed Development and <strong>Water</strong> Quality Impacts / 116<br />
6.1. Contamination, Pathogens, and Sewage Pollution / 116<br />
6.2. Chemicals and Pollution Concerns / 121<br />
6.3. Urbanization Impacts / 126<br />
7. Instream Sand and Gravel Mining / 132<br />
7.1. Overview /<br />
v
7.2. Effects of Instream Mining /<br />
7.3. Sand and Gravel Mining in the CRNRA /<br />
7.4. Regulations for Instream Mining /<br />
7.5. Need for Some Follow-Up /<br />
8. Bioassessments and Biological Integrity / 136<br />
8.1. Overview of Bioassessments /<br />
8.2. The Index of Biotic Integrity /<br />
8.3. Bioassessment in the CRNRA /<br />
9. Programs, Policies, and <strong>Plan</strong>ning for <strong>Water</strong>sheds / 145<br />
9.1. Introduction / 145<br />
9.2. <strong>Water</strong>shed Assessment and <strong>Plan</strong>ning / 145<br />
9.3. Monitoring Activities in the Area / 147<br />
9.4. Conservation Guides and Educational Materials / 150<br />
10. Discussions and Recommendations / 154<br />
10.1. Recommendations and Ideas / 154<br />
10.2. General Recommendations / 154<br />
10.3. Technical Assistance Requests / 155<br />
10.4 Public Health Related Recommendations / 156<br />
10.5. <strong>Water</strong> Quality Recommendations / 157<br />
11. Project Statements (proposals) / 160<br />
No. 1. Develop Pipeline GIS Information / 160<br />
No. 2. Design an Integrated River Monitoring Program / 162<br />
No. 3. Bacterial <strong>Water</strong> Quality Monitoring of Recreational <strong>Water</strong>s Within<br />
Chattahoochee River <strong>National</strong> Recreation Area / 164<br />
No. 4. Provide Visitors Current <strong>Water</strong> Pollution Information / 167<br />
No. 5. Conduct Recreation Flow Assessment / 168<br />
No. 6. Define the CRNRA Role / 170<br />
No. 7. Assessment of Biological Integrity of Tributary Streams of the Chattahoochee<br />
River <strong>National</strong> Recreation Area /<br />
12. Literature Cited / 172<br />
Appendices<br />
Appendix A Abstracts of Ongoing Projects / 185<br />
Appendix B. List of Organizations and Individuals in <strong>Water</strong> <strong>Resources</strong> / 189<br />
Appendix C. <strong>Water</strong> Quality Criteria and Standards / 194<br />
Appendix D. List of U.S. Geological Survey Gaging Stations / 200<br />
Appendix E. <strong>Water</strong> Quality Graphics for Gwinnett and DeKalb Intakes / 202<br />
Appendix F. Maps of Individual Units with Floodplains / 206<br />
vi
Figure Number<br />
LIST OF FIGURES<br />
Fig. 1.1.a. The Chattahoochee NRA and its location in Georgia / 2<br />
Fig. 1.1.b. <strong>Park</strong> units of the Chattahoochee NRA / 3<br />
Fig. 1.1.c. Example of a park unit in Larger Scale / 4<br />
Fig. 2.2.a. Schematic of the tributaries in the CRNRA / 10<br />
Fig. 2.2.b. The Chattahoochee River and tributaries in the CRNRA / 11<br />
Fig. 2.3.a. Chart of the monthly precipitation for the area / 13<br />
Fig. 2.3.b. Frequency of small storms in the area / 14<br />
Fig. 2.4.a. Geology around the Chattahoochee River NRA / 15<br />
Fig. 2.6.a. Population density in the Atlanta metropolitan area / 19<br />
Fig. 2.6.b. Population growth in the area / 18<br />
Fig. 3.2.a. Principal political boundaries around the CRNRA / 21<br />
Fig. 3.2.b. Cultural and recreational features; non-NPS recreation sites / 22<br />
Fig. 3.3.a. General land-use patterns in the area / 23<br />
Fig. 4.2.a. Typical daily flow below Buford Dam / 45<br />
Fig. 4.2.b. Surges along the river within the CRNRA / 46<br />
Fig. 4.2.c. Stream gaging stations in the CRNRA zone / 47<br />
Fig. 4.2.d. Flood frequencies and seasonal hydrograph / 48<br />
Fig. 4.4.a. BOD, fecal coliforms, and DO along the river, 1993-95 / 62<br />
Fig. 4.4.b. Sediment, turbidity, and temperature along the river, 1993-95 / 63<br />
Fig. 4.4.c. BOD, fecal coliforms, and DO along the river, 1986-95 / 64<br />
Fig. 4.4.d. Nutrients and specific conductance at water intakes, 1986-95 / 65<br />
Fig. 4.4.e. Nutrients at water intakes for the longer period, 1972-90 / 66<br />
Fig. 4.4.f. BOD, fecal coliforms, and DO at Cobb County intake, 1986-95 / 67<br />
Fig. 4.4.g. Nutrients at the Cobb County intake, 1986-95 / 68<br />
Fig. 4.4.h. BOD, fecal coliforms, and DO for the tributaries, 1993-95 / 69<br />
Fig. 4.4.i. Sediment, turbidity, and conductivity for the tributaries, 1993-95 / 70<br />
Fig. 4.5.a. Habitat classifications from studies of Nestler et al., 1984 / 79<br />
Fig. 5.1.a. <strong>Water</strong> treatment plants around the CRNRA / 100<br />
Fig. 5.3.a. <strong>Water</strong> temperature in the river below Buford Dam / 109<br />
Fig. 5.3.b. Dissolved oxygen in the river below Buford Dam / 109<br />
Fig. 6.1.a. Wastewater treatment plants around the CRNRA / 120<br />
Fig. 6.3.a. The effect of urbanization on streamflows and flooding / 128<br />
Fig. 8.a. The twelve IBI metrics and biotic integrity chart / 140<br />
vii
Appendix Figures<br />
App. E., Fig. E.a. BOD, fecal coliforms, and DO at the Gwinnett intake, 1986-94 / 202<br />
App. E., Fig. E.b. Nutrients at Gwinnett intake, 1986-94 / 203<br />
App. E., Fig. E.c. BOD, fecal coliforms, and DO at the DeKalb intake, 1986-94 / 204<br />
App. E., Fig. E.d. Nutrients at the DeKalb intake, 1986-94 / 205<br />
App. F., Fig. F.a through F.h. Floodplain lines for the individual park units / 206-214<br />
viii
LIST OF TABLES<br />
Tab. 2.3.a. Summary of precipitation and temperature / 13<br />
Tab. 2.6.a. Population densities in some watersheds of the CRNRA / 18<br />
Tab. 3.4.a. Abbreviations list of some of the organizations involved in water<br />
resources in the area / 26<br />
Tab. 3.5.a. The local "issuing authorities" and other agencies involved in the<br />
Georgia Erosion and Sedimentation Act / 33<br />
Tab. 3.6.a. An overview of the principal water resource issues affecting or<br />
relevant to the Chattahoochee River <strong>National</strong> Recreation Area / 36<br />
Tab. 4.2.a. Gaging stations / 41<br />
Tab. 4.2.b. Streamflow information on Big and Suwanee Creeks / 43<br />
Tab. 4.4.a. <strong>Water</strong> classifications and water quality standards / 52<br />
Tab. 4.4.b. General criteria for all waters / 52<br />
Tab. 4.4.c. Some streams in the area not supporting designated uses / 54<br />
Tab. 4.4.d. Some patterns of fecal coliforms along the river / 55<br />
Tab. 4.4.e. Maximum sediment levels seen / 58<br />
Tab. 4.4.f. Sediment and discharge relations /58<br />
Tab. 4.4.g. Nitrate/nitrite and phosphorus concentrations upstream/downstream / 60<br />
Tab. 4.5.a. Fishes of the Piedmont Province, in the CRNRA / 82<br />
Tab. 4.5.b. Fishes species collected along the river in the CRNRA / 85<br />
Tab. 4.5.c. Fish species generally found in the tributaries in the area / 87<br />
Tab. 4.5.d. Fish species found in several tributaries of the CRNRA / 88<br />
Tab. 4.5.e. Relative abundance of tributary fish species in three tributaries / 90<br />
Tab. 4.5.f. Aquatic invertebrate species numbers / 92<br />
Tab. 4.5.g. Macroinvertebrates in tributaries in the CRNRA / 93<br />
Tab. 4.5.h. Fish consumption guidelines / 95<br />
Tab. 5.1.a. Historic water supply demand at Atlanta, 1917-50 / 97<br />
Tab. 5.1.b. Permitted water supply withdrawals on the river / 98<br />
Tab. 5.2.a. "Optimum flows" for water-borne recreation / 103<br />
Tab. 5.3.a. The mainstem dams and reservoirs of the Recreation Area / 106<br />
Tab. 5.3.b. Key organizations in water quality monitoring at Lake Lanier / 107<br />
Tab. 5.4.a. Reasons people visit the CRNRA / 111<br />
Tab. 5.4.b. <strong>Water</strong>-borne recreation for the park units / 112<br />
Tab. 5.4.c. Description of types of water-borne/water-based recreation / 112<br />
Tab. 5.4.d. Recreational activities and their connection to water issues / 114<br />
Tab. 6.1.a. Permitted discharges for wastewater treatment plants / 116<br />
Tab. 6.1.b. Explanation of the fecal coliform standard / 119<br />
Tab. 6.2.a. Pesticide levels at Sope Creek, from USGS 1993-94 studies / 124<br />
ix
Tab. 7.3.a. Fish species in the river, from Martin and Hess, 1985 / 134<br />
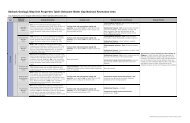
Tab. 8.2.a. Effects of environmental degradation on biotic assemblages / 139<br />
Tab. 8.2.b. Metrics in Karr's index of biotic integrity / 141<br />
Tab. 8.3.c. Comparison of IBI metrics and metric modifications / 142<br />
Tab. 8.3.d. Metrics for rapid bioassessment protocols / 143<br />
Tab. 8.3.e. IBI scores for streams in the CRNRA / 144<br />
Tab. 9.3.a. Some of the Adopt-A-Stream groups in the area / 150<br />
x
EXECUTIVE SUMMARY<br />
This <strong>Water</strong> <strong>Resources</strong> <strong>Management</strong> <strong>Plan</strong> reviews the water resources and principal water-related<br />
issues in the Chattahoochee River <strong>National</strong> Recreation Area (CRNRA), and proposes<br />
management actions to address those issues.<br />
The Chattahoochee River <strong>National</strong> Recreation Area: Chapter 1 describes the CRNRA that<br />
is located along a 48-mile reach of the Chattahoochee River from Buford Dam at Lake Lanier<br />
downstream to the northern edge of the City of Atlanta. The CRNRA's enabling legislation<br />
authorized 6800 acres of land, comprising 16 park sites along the river. The CRNRA provides<br />
about three-quarters of the green space in the greater Atlanta area, and provides outdoor<br />
recreation (hiking, fishing, picnicking, boating, nature study, and other outdoor activities) for<br />
over 3 million visitors a year.<br />
Geography, Vegetation, and Climate: Chapter 2 provides an overview of the geography in<br />
the CRNRA. A schematic figure and associated maps show the river as well as its tributaries,<br />
with information on tributary drainage areas and points of confluence. Annual precipitation data<br />
are summarized in tables and graphs, with seasonal rainfall distribution described. The area’s<br />
surficial geology is illustrated and descriptions are provided for the area’s major soil groups. The<br />
predominant vegetation for the area is summarized by common cover type and common tree<br />
species, as well as important exotic and protected plant species are listed.<br />
Demography: Chapter 2 also describes the growth of the Atlanta area and illustrates the<br />
population distribution and density in and around the CRNRA.<br />
Land Use and Ownership: Chapter 3 reviews landownership patterns and political boundaries,<br />
and provides a description of land uses in their areal extent. A color fold-out map illustrates land<br />
use and characterizes the development patterns of the area, with denser urban development in<br />
southern areas of the CRNRA, and the less dense development to the north. The entire area is<br />
significantly affected by urban sprawl. This chapter provides a list of organizations in CRNRA<br />
area that are active in the water resources field, highlighting the organizations that are potential or<br />
actual cooperators with the NPS on water-resource issues.<br />
Laws and Regulations: Chapter 3 provides a synopsis of Federal, State, and County laws and<br />
regulations that are relevant to water resources and to water pollution in the CRNRA.<br />
A Synopsis of the <strong>Water</strong> Resource Issues: Chapter 3 provides a summary of the issues or<br />
problems in the water resources field in the CRNRA, describing key issues, such as urbanization<br />
impacts, contamination, sand/gravel mining effects on fish, the influence of dams, the presence of<br />
toxic chemicals in urban runoff, and river discharge issues related to water-based recreation.<br />
River Flows, Gaging Stations, and Discharge Values: Chapter 4 presents an overview of<br />
water resources and the hydrology of the area, both presently and historically. The discharge<br />
patterns and volumes of the Chattahoochee River are described using hydrographs that show the<br />
maximum, mean, and minimum discharges for various points along the river. Buford Dam, at the<br />
upper end of the CRNRA, dramatically affects river flow within the <strong>National</strong> Recreation Area,<br />
and power surges from the dam are described. A flood frequency graph defines the potential<br />
flood sizes for the river. The requirement that Buford Dam provide a minimum of 750 cubic feet<br />
per second of water at the Atlanta water intake is also discussed.<br />
xi
Ground-<strong>Water</strong> Hydrology: A brief discussion of the hydrogeology (ground water) of the<br />
CRNRA area appears in Chapter 4.<br />
<strong>Water</strong> Quality and <strong>Water</strong> Quality Standards: Chapter 4 reviews the water quality of the<br />
river and its tributaries within the CRNRA reach. The history of pollution for the general area is<br />
discussed. Some useful sources of water quality data for the area are summarized, describing the<br />
types of data available. “Narrative water quality standards” are described, and criteria levels for<br />
the common water quality indicators are provided--including fecal coliforms, pH, dissolved<br />
oxygen, and temperature. This chapter shows which sections of the river and which tributaries do<br />
“not support” their designated uses (i.e., are too polluted to meet their intended use); some 20<br />
stream reaches as of 1998 within the CRNRA are “non-supporting.” Details are provided on<br />
fecal coliforms showing that many reaches of the river often fail to meet the fecal coliforms<br />
standard for recreational use of the water. Graphics also show the levels of turbidity, sediment,<br />
nitrogen, phosphorus, biochemical oxygen demand, and dissolved oxygen in the river and key<br />
tributaries.<br />
Aquatic Biology and Ecology: The aquatic biology and ecology of the CRNRA is discussed in<br />
Chapter 4. The fish species and their distributions are summarized from the various studies<br />
carried out within the CRNRA or its environs during recent decades. Some 39 species of fish<br />
occur in the Chattahoochee River within the Recreation Area, and 50 species of fish occur in the<br />
tributaries of the area. Rare, threatened, and endangered species are considered, noting that no<br />
federally-protected species are believed to occur within the CRNRA. Some exotic species are<br />
problematic, or could be—many eels and red shiners—are discussed.<br />
Trout Fishery: Chapter 4 also describes the important secondary trout, put-and-take fishery in<br />
the Chattahoochee River, made possible because of Buford Dam’s releases of colder waters.<br />
Information on fish consumption guidelines is presented, noting how trout, bass, and other<br />
species have consumption limitations because of the levels of mercury, chlordane, or PCBs in<br />
some river reaches within the CRNRA. Instream flow water modeling and flow levels are<br />
discussed from the perspective of optimal flows needed for fish, particularly trout.<br />
Floodplains: Chapter 4 briefly delineates and describes the floodplains for individual units of<br />
the CRNRA.<br />
<strong>Water</strong> Supplies and <strong>Water</strong> Demands: Chapter 5 summarizes the present demands for water<br />
supplies in the general area of the CRNRA with reference to historical and potential future<br />
demands. A map shows the location of the water treatment plant intakes in the area, and the<br />
volumes of demand are summarized for major intakes.<br />
<strong>Water</strong> Allocation for the River: Chapter 5 discusses the “tri-state water allocation” activity<br />
now underway, where a River Basin Compact Commission for the Apalachicola- Chattahoochee -<br />
Flint River Basin currently is developing a “water allocation formula” for the basin. This chapter<br />
summarizes the progress on an Environmental Impact Statement for this allocation that involves<br />
10 cooperating agencies. The allocation effort is important from the perspective of optimal flows<br />
for water-borne recreation as well as fish and other aquatic life.<br />
The Impact of Dams: The effects of dams and Lake Lanier on the river within the CRNRA,<br />
especially the influence of Buford Dam, at the upper edge of the CRNRA are discussed in<br />
Chapter 5. Besides the dams’ influence on river flows, Buford Dam has strong influences on<br />
water temperature and dissolved oxygen in the river.<br />
xii
<strong>Water</strong>-Based Recreation: Chapter 5 looks more closely at the question of recreational demands<br />
on the river, since the units of the CRNRA provide recreation for over 3 million visitors per year.<br />
The reasons that visitors come to the CRNRA are discussed including the recreational amenities<br />
or activities found at the individual units, i.e., rafting, swimming, fishing, or other water-based<br />
activities. The "optimal" flows for water-borne recreation are described.<br />
Urbanization’s Effects on <strong>Water</strong> Quality: Chapter 6 reviews the impacts of urbanization on<br />
water quality within the CRNRA, considering both waste treatment effects and other<br />
contamination. The issue of pathogens in water is discussed, which relates closely to<br />
urbanization. The fecal coliform problem is summarized; fecal coliforms occur at significantly<br />
elevated levels in many parts of the CRNRA, indicating the potential presence of pathogens. The<br />
possible pathogens are described. The problem of sewage spills or leaks is discussed, as well as<br />
the monitoring for sewage impacts as related to <strong>National</strong> Pollutant Discharge Elimination System<br />
permits.<br />
Urbanization’s Effect on Runoff: Chapter 6 considers urbanization’s impact on the<br />
characteristics of surface runoff and on the quality of ground water. It describes how urbanized<br />
runoff can raise levels of sediment, chemicals, bacteria, and water temperature. Runoff models<br />
that have been tested are discussed. Urbanization, especially septic tank use, also can impact<br />
ground-water quality, and the chapter describes how soils in the area are poorly suited for septic<br />
tank use, but used nonetheless.<br />
Other Urban Chemical Concerns: Pesticides and metals are discussed in Chapter 6 with some<br />
summaries or data provided from various studies that show certain pesticides are commonly<br />
found in streams of the area.<br />
Instream Mining for Sand and Gravel: Chapter 7 reviews the issue of sand and gravel<br />
mining in the river’s bed within the CRNRA, discussing possible negative impacts as well as<br />
potential benefits of the mining from the fisheries perspective. The question of permitting of this<br />
activity within the CRNRA is reviewed, noting the respective roles of the <strong>National</strong> <strong>Park</strong> <strong>Service</strong><br />
and the U.S. Army Corps of Engineers.<br />
Bioassessments and Biological Integrity: Chapter 8 provides a look at the topic of<br />
bioassessments within the Chattahoochee River NRA and reviews the concept of biological<br />
integrity in the evaluation of water quality degradation. Examples are given of multimetric<br />
indices of biological integrity that have been used in the CRNRA.<br />
Policy and <strong>Plan</strong>ning: Chapter 9 gives an overview of programs, policies, and planning in the<br />
general CRNRA area that influence watershed protection, water resource management, river<br />
stabilization, erosion control, and water pollution control. Major planning activities in the area<br />
are listed.<br />
Environmental Education in <strong>Water</strong> <strong>Resources</strong>: In addition, Chapter 9 reviews the topic of<br />
environmental education and conservation, and summarizes some activities underway, noting<br />
materials available on conservation. The section reviews monitoring activities taking place that<br />
are based on volunteer groups.<br />
xiii
Recommendations and Proposals: Chapter 10 recommends potential management actions for<br />
the CRNRA, and makes suggestions for some follow-up work to collect information or data.<br />
Project Statements are developed to address specific water-related issues.<br />
Information and Local Expertise: A relatively extensive list of references on all aspects of<br />
water resources in the CRNRA is provided, and a directory of water resource expertise and<br />
relevant organizations in water resource in the area is presented in the appendices.<br />
xiv
1. INTRODUCTION<br />
1.1 OVERVIEW<br />
The Chattahoochee River originates in the northern Georgia mountains, near the Tennessee<br />
border, and flows south into the Lake Lanier reservoir. From there, it passes through the suburbs<br />
north of Atlanta, through the city itself, then continues toward the Florida Gulf. The<br />
Chattahoochee River <strong>National</strong> Recreation Area (CRNRA), a major feature on the river, consists<br />
of a series of park units scattered along the 48-mile reach of river from Buford Dam at Lake<br />
Lanier to Peachtree Creek at the City of Atlanta’s northern edge (Figures 1.1.a and 1.1.b).<br />
The river provides about three-quarters of the water supply used by over 2.5 million residents of<br />
the greater Atlanta metro area, supplying the water essential for domestic, industrial, and business<br />
development (Atlanta Regional Commission, 1992c; 1998c).<br />
The river and its riparian environment comprise the major outdoor recreation attraction in the<br />
Atlanta metropolitan area, providing boating, rafting, canoeing, and nature appreciation, among<br />
other activities, for over 3 million visitors each year. Many of them use the park units of the<br />
Chattahoochee River <strong>National</strong> Recreation Area (CRNRA).<br />
As the Atlanta Regional Commission has pointed out, the Chattahoochee River is more than a<br />
water source, and stands out as a thread of nature running through a bustling, growing major<br />
metropolitan area, offering an irreplaceable asset that adds immensely to Atlanta’s quality of life.<br />
Without the river, Atlanta would not rank among the fastest growing of the prosperous areas in<br />
the United States today (Atlanta Regional Commission, 1992a; 1992b).<br />
In 1957, the U.S. Army Corps of Engineers constructed Buford Dam, creating 38,000-acre Lake<br />
Lanier, which is now a major recreational area at the northern tip of the CRNRA. About 7<br />
million recreationists visit the lake annually and over 10,000 homes are built around the lake's<br />
shore. Releases of water from Buford Dam, at the upper edge of the Recreation Area, have a<br />
marked influence on river flows within the CRNRA. The release of cool waters from Lake<br />
Lanier supports an important secondary trout fishery downstream in the park area.<br />
But intense development threatens the river and its tributaries. Rapid population growth is taking<br />
place along the river northward from Atlanta, up to Lake Lanier, with a brisk growth of housing,<br />
roads, and commercial development occurring in this corridor. Housing and other development is<br />
occurring actively around the lake's 540 miles of shoreline and within its watershed, raising<br />
questions of the eventual impacts on the lake and the river below. This construction and growth<br />
cause increased sediment loads, raise summer water temperatures, and lead to high coliform<br />
bacteria counts during storm runoff periods. Sewage treatment plants and old sewer pipes cannot<br />
keep pace with the development and overflows or leaks frequently occur, causing pollution.<br />
1
1.2 THE CHATTAHOOCHEE RIVER NATIONAL RECREATION<br />
AREA<br />
Chattahoochee River <strong>National</strong> Recreation Area was established in 1978 (PL 95-344) to protect<br />
the natural, scenic, recreation, historic, and other values of a 48-mile reach of the Chattahoochee<br />
River from Lake Lanier's dam on the north downstream to the northern edge of Atlanta at the<br />
mouth of Peachtree Creek (Figures 1.1.a and 1.1.b). The enabling legislation for the park<br />
authorized land acquisition of 6,300 acres of land at 16 park sites along this stretch of the river.<br />
In 1984 Public Law 98-568 was enacted, to increase the authorized boundary of the Recreation<br />
Area to 6,800 acres. The park now contains only about two-thirds of the area that the enabling<br />
legislation authorizes. Boundaries of the CRNRA units are shown in Figures 1.1.b and c (see<br />
Appendix F for remaining unit maps).<br />
The CRNRA stands out as a remnant of green space and as the main window into nature for<br />
millions of people in the busy Atlanta Metropolitan Area and for four major counties. The<br />
Recreation Area contains about three-quarters of the green space in the greater Atlanta area,<br />
which provides critically needed recreation area for over 3 million visitors per year for hiking,<br />
fishing, picnicking, boating, nature study, and other outdoor activities. This segment of the river<br />
is recognized as the most intensely used stream segment in Georgia (Atlanta Regional<br />
Commission, 1992a).<br />
The enabling legislation (PL 95-344, HR 8336, 1978) prescribes a prominent <strong>National</strong> <strong>Park</strong><br />
<strong>Service</strong> (NPS) role for managing natural resources and protecting the river. The NPS therefore<br />
has legal responsibility to: "protect the river and its bed from Buford Dam to Peachtree Creek (48<br />
miles)," noting that the "natural, scenic, recreation, historic and other values... should be<br />
preserved and protected...from developments and uses which would substantially impair or<br />
destroy them" (U.S. Congress, 1978). The 1984 law added that the the CRNRA was established:<br />
… for the purpose of facilitating Federal technical and other support to State and<br />
local governments to assist State and local efforts to protect the scenic,<br />
recreational, and natural values of a 2,000 foot wide corridor adjacent to each<br />
bank of the Chattahoochee River and its impoundments in the 48-mile segment<br />
referred to above (and) such corridor is hereby declared to be an area of national<br />
concern.<br />
An opportunity exists to strengthen the NPS role in managing the river, its environs, and the river<br />
corridor.<br />
The heavy population growth that is predicted no doubt will be accompanied by more pressure on<br />
the park's existing lands and river reaches and the strong public desire for more green space.<br />
Counties and cities in the area have fewer parks than they normally should have for their<br />
population (Sierer et al., 1980). The Trust for Public Land is attempting to increase parklands<br />
along the river, working in partnership with the NPS and others (Trust for Public Lands, 1997).<br />
Increased park areas plus more people using them in the future will call for a better understanding<br />
of the water resource issues and better planning for the protection of resources.<br />
6
1.3 OBJECTIVES OF A WATER RESOURCES MANAGEMENT<br />
PLAN<br />
The predominant importance of water resources in this "river park," the pressure of the water<br />
resource issues, the rapid population growth in the area, and the heavy visitation in the park all<br />
are solid reasons for developing a <strong>Water</strong> Resource <strong>Management</strong> <strong>Plan</strong> at this time. In addition, the<br />
plan would help define the role of natural resource leadership that the NPS logically should play<br />
in the Recreation Area and along the river.<br />
The rationale for preparing a WRMP was based on the following criteria:<br />
Social Importance<br />
The CRNRA comprises the major green space for the greater Atlanta area, which is a<br />
growing international center for business, high-tech industry, transportation, trade, and<br />
communications, with the population at over 3 million and expected to be over 4 million by<br />
the year 2010 (Hippe et al., 1997).<br />
Economic Importance<br />
The river provides about three-quarters of the drinking water for this prospering area, or<br />
about 300 million gallons per day (Atlanta Regional Commission, 1992a, 1998b; Hippe et<br />
al., 1997). River water is all the more critical since ground-water resources are scarce, given<br />
the inherent geology of the area. The headwaters of the Chattahoochee River comprise the<br />
smallest drainage basin in the country that is attempting to provide the bulk of the water<br />
supply for a major metropolitan area (Riverkeeper www Homepage, 1998). Sand and gravel<br />
mining economically is important for providing construction materials in the growing urban<br />
area. The trout fishery, water-based recreation, and green space of the CRNRA have a direct<br />
economic value, but more critically these amenities are economically invaluable in terms of<br />
providing quality-of-life for urbanites. For all of these reasons, the Atlanta area's<br />
attractiveness for economic development and its ultimate prosperity is coupled to the river<br />
and the affiliated parks.<br />
The Issues<br />
The river and its tributaries suffer from urbanization, industrialization, inadequate<br />
wastewater treatment, sewage overflows, and other impacts, provoking contamination,<br />
turbidity, flooding and other problems. These disruptions detract from the natural values of<br />
the river and the parklands. Proper resource management and protection are crucial, to<br />
overcome these problems. The sooner these issues are addressed, the more feasible it will be<br />
to identify solutions and protective measures, and the less irreversible the damage to natural<br />
resources will be (Collier et al, 1996; G. Hendrix, personal communication, 1999). The NPS<br />
role also could be better defined as regards these issues.<br />
The Timing<br />
At this time, over a dozen federal and local agencies are working on an Interstate <strong>Water</strong><br />
Compact for the Apalachicola-Chattahoochee-Flint Basins, to determine water allocations.<br />
This effort will have legal, operational, biological, and technical consequences for the<br />
7
CRNRA. The State of Georgia has recently prepared an overview report about the basin, the<br />
Chattahoochee River Basin <strong>Management</strong> <strong>Plan</strong> (Environmental Protection Division, 1998).<br />
Therefore, this is an apt time to conduct the park's own water planning effort and to define<br />
the NPS’s role in water resources management in the area.<br />
As Part of Overall <strong>Plan</strong>ning<br />
As described above, the park has potential for additional growth. <strong>Water</strong> resource knowledge is a<br />
necessary component of information needed for setting overall goals and planning for the park’s<br />
future.<br />
Objectives of this <strong>Water</strong> <strong>Resources</strong> <strong>Management</strong> <strong>Plan</strong><br />
The principal objectives of this <strong>Water</strong> Resource <strong>Management</strong> <strong>Plan</strong> are to:<br />
• Generally describe the watersheds and tributaries within the park area.<br />
• Describe the main water and watershed issues of the park, and discuss the significance of<br />
these issues from the park perspective.<br />
• Provide an overview of the principal water resource data available or routinely collected in<br />
the park area, describing any monitoring, gauging, studies, and other water resource<br />
observations.<br />
• List the primary data and information needs for water resources, watersheds, and related<br />
issues from the park's perspective.<br />
• Summarize the key literature available on water resources for the park area.<br />
• Provide suggestions to help define the park's role and objectives in river management.<br />
• Describe and quantify the water supply demands on the river and its tributaries (present and<br />
projected) within the park area. Describe the water quality and flows of the area.<br />
• Discuss how the Tri-State water allocation efforts now underway do and will affect the park<br />
legally and operationally.<br />
• Provide a list of water-resource recommendations for the park in terms of: (i) possible<br />
management actions; (ii) desirable guideline development; (iii) possible cooperative<br />
programs; (iv) ideas for public education and relations, and (v) other suggestions for<br />
addressing issues.<br />
• Elaborate some of these recommendations into proposals, which the park may use to seek<br />
NPS funding or to attract interest in cooperative projects.<br />
• Summarize the hydrological expertise in the area around the CRNRA. Develop an annotated<br />
directory of the water resource expertise most relevant to the park found within the various<br />
agencies, institutes, organizations, and university faculties of the area, noting activities in<br />
monitoring, research, political action, education, or other water-related activities within the<br />
park area, the river corridor, and its headwaters.<br />
8
2. A GEOGRAPHIC OVERVIEW OF THE CHATTAHOOCHEE<br />
RIVERNATIONAL RECREATION AREA<br />
2.1. INTRODUCTION<br />
This section provides an overview of the topography, climate, geology, vegetation, and soils of<br />
the Chattahoochee River <strong>National</strong> Recreation Area, along the river, and in the headwaters of the<br />
tributaries which feed into the area.<br />
The Chattahoochee River originates in the mountains of North Georgia and flows almost to the<br />
Gulf of Mexico before combining with the Flint River to form the Apalachicola River. As<br />
indicated in Figure 1.1.a, the Chattahoochee River originates in the Blue Ridge Province, near the<br />
northern edge of Georgia, in an area dominated by rugged mountains and ridges as high as 3,500<br />
feet in elevation. However, nearly all of the upper half of the Chattahoochee River Basin falls<br />
within the Piedmont Province, which begins at approximately 1,700 feet (some 15-20 miles<br />
upstream from Lake Lanier) and continues downstream to the Fall Line, where the river flows<br />
into the Coastal Plain Province, en route to the sea (Couch et al, 1996). The Chattahoochee River<br />
<strong>National</strong> Recreation Area therefore falls within the Piedmont Province. The Upper<br />
Chattahoochee River Basin from its headwaters down to Peachtree Creek, at the north edge of<br />
Atlanta, comprises Hydrologic Unit Code (HUC) Number 03130001, with the Buford Dam to<br />
Peachtree Creek portion referred to as "Area B" of this HUC. In other words, the CRNRA's reach<br />
is basically synonymous with this Area B (EPD, 1998a).<br />
Even though total rainfall is ample at about 51 inches per year (discussed in Section 2.3), the<br />
natural features of the area restrict the available water resources. The area is underlain with<br />
crystalline rock, and ground-water storage is very limited; therefore, wells are not adequate for<br />
supplying water to municipalities. While the Chattahoochee River is large, it tributaries are<br />
mostly too small to serve as water supplies (Stevens, 1989; ).<br />
2.2. TOPOGRAPHY AND LANDSCAPES ALONG THE RIVER<br />
The Chattahoochee River <strong>National</strong> Recreation Area (CRNRA) lies in an upland area having<br />
moderately strong relief, with elevations ranging from about 700 to 1,000 feet. The general<br />
drainage area is underlain by deeply weathered crystalline rock. Within the CRNRA, the river<br />
passes through the Brevard Fault Zone, which is a highly fractured zone of one-half to two miles<br />
wide. Inside the fault zone area, the river flows through gorges, by rock outcroppings and over<br />
river shoals, creating the area of high scenic value known as the Palisades (ARC, 1992a and b).<br />
The Chattahoochee River <strong>National</strong> Recreation Area, from Buford Dam at Lake Lanier to the<br />
confluence with Peachtree Creek at Atlanta, is 48 miles long and the watershed covers an area of<br />
416 square miles (Figure 1.1.a).<br />
The watershed, including the tributaries, covers parts of five counties; Cobb, DeKalb, Fulton,<br />
Forsyth and Gwinnett. The watershed areas are:<br />
• 31.3 percent in Fulton County (129.1 square miles);<br />
• 25.3 percent in Gwinnett County (104.3 sq mi);<br />
• 22 percent in Forsyth County (90.6 sq mi.);<br />
• 20 percent in Cobb County (82.5 sq mi); and<br />
• 1 percent in DeKaIb County (5.9 sq mi).<br />
9
Twelve incorporated cities fall at least partially within the watershed, including Alpharetta,<br />
Atlanta, Berkeley Lake, Buford, Duluth, Marietta, Norcross, Rest Haven, Roswell, Smyrna, Sugar<br />
Hill and Suwanee (Atlanta Regional Commission, 1992b).<br />
Sixteen tributaries with basins greater than three square miles enter the river within the CRNRA,<br />
from Buford Dam to Peachtree Creek, as summarized in Figure 2.2.a, which lists sites where a<br />
continuous flow record has been gathered for a year or more at some point. Important flow<br />
records are found for: Suwanee Creek –since 1984; Johns Creek –since 1995; Big Creek at<br />
Alpharetta –since 1960; and Sope Creek –since 1984.<br />
The locations and sizes of the tributaries, by name, are shown in the maps of Figures 2.2.a and b.<br />
Big Creek is by far the largest of the 16 tributaries, at 103 square miles, while Suwanee Creek<br />
with 51.2 square miles and Sope Creek at 35.4 square miles are second and third. The remaining<br />
13 tributaries are less than 20 square miles in size, and many are only a few square miles in size.<br />
2.3. CLIMATIC CONDITIONS AND PRECIPITATION<br />
Climate in the CRNRA area is influenced by the mountainous terrain to the north of Lake Lanier,<br />
and by the Gulf of Mexico, to the south. During winter, the mountains inhibit the flow of polar<br />
air from the north and help maintain moderate winter temperatures. During summer, these same<br />
mountains serve as a barrier to the moisture-laden winds coming in from the Gulf, producing<br />
summer storms and the relatively high summer rainfall (Faye et al., 1980).<br />
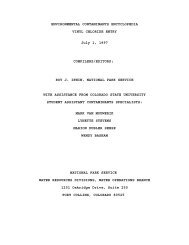
As shown in Figure 2.3.a and Table 2.3, the average annual precipitation for the Atlanta area is<br />
about 51 inches per year. The precipitation depths are greater on going further north, and Lake<br />
Lanier receives approximately 3-4 inches more precipitation per year than Atlanta (according to<br />
U.S. Geological Survey isohyet maps for the area). As seen in Table 2.3, precipitation in the area<br />
occurs predominantly as rain. Snowfall is only about 2 inches annually<br />
Dry periods occur mainly during the late summer and early autumn; whereas, thunderstorms in<br />
July make that month the second wettest. The average monthly rainfall in the area ranges from as<br />
little as 3 inches in October to over 5 inches in March and July (Figure 2.3.a).<br />
The highest annual rainfall occurred in 1948, with 71.5 inches, and the driest year came in 1954,<br />
with 31.8 inches. The record 24-hour rainfall of 7.36 inches occurred in 1886. Rainfall in excess<br />
of 10 inches per month can occur occasionally in any month (Stevens, 1993; Law, 1996).<br />
In the mountains at the northern edge of the Chattahoochee River Basin, runoff is up to about half<br />
the total precipitation, which is important for providing water into Lake Lanier. The runoff is<br />
greatest in the mountains. However, the percentage of evapotranspiration increases on going<br />
from north to south in the Chattahoochee Basin, ranging from 32 to 42 inches of water per year<br />
(EPD, 1998a).<br />
2.4. GEOLOGY AND SOILS OF THE AREA<br />
The Piedmont province consists mainly of ancient sedimentary rocks, with intrusions of igneous<br />
rocks --all subject to repeated stress. Rocks have been fractured, faulted, and folded. The<br />
consolidated rocks include metamorphosed sedimentary rocks and crystalline igneous rocks<br />
(Cederstrom et al, 1979).<br />
10
Inches of<br />
Precipitation<br />
8<br />
6<br />
4<br />
2<br />
0<br />
Jan<br />
Feb<br />
Atlanta's Monthly Precipitation<br />
March<br />
April<br />
May<br />
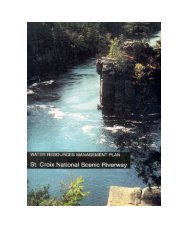
Figure 2.3.a. Graph of monthly precipitation normal values (1961 to 1990) in inches for<br />
Atlanta (data from the <strong>National</strong> Oceanic and Atmospheric Administration).<br />
Annual normal precipitation is approximately 50.77 inches (also shown in<br />
Table 2.3.a).<br />
Table 2.3.a. Climatological normal values (1961 to 1990) for Atlanta (Information<br />
from<br />
<strong>National</strong> Oceanic and Atmospheric Administration home page, June,<br />
1999).<br />
_________________________________________________________________<br />
____<br />
MinTemp(F) MaxTemp(F) AvgTemp(F) AvgPrcp(in)<br />
AvgSnow(in)<br />
Jan 31.5 50.4 41.0 4.75 0.9<br />
Feb 34.5 55.1 44.8 4.81 0.6<br />
Mar 42.4 64.2 53.3 5.77 0.4<br />
Apr 50.1 72.7 61.4 4.26 0.0<br />
May 58.6 79.6 69.1 4.29 0.0<br />
Jun 66.2 85.7 76.0 3.56 0.0<br />
Jul 69.5 87.9 78.7 5.01 0.0<br />
Aug 69.0 87.0 78.0 3.66 0.0<br />
Sep 63.5 81.7 72.6 3.42 0.0<br />
Oct 51.8 72.7 62.3 3.05 0.0<br />
Nov 42.8 63.4 53.1 3.86 0.1<br />
Dec 35.0 54.0 44.5 4.33 0.2<br />
Ann 51.2 71.2 61.2 50.77 2.3<br />
15<br />
June<br />
July<br />
Month<br />
Aug<br />
Sept<br />
Oct<br />
Nov<br />
Dec
Numbers of Storms per Year<br />
60<br />
50<br />
40<br />
30<br />
20<br />
10<br />
0<br />
0.00-0.19<br />
0.20-0.39<br />
0.40-0.59<br />
0.60-0.79<br />
0.80-0.99<br />
1.00-1.19<br />
1.20-1.39<br />
1.40-1.59<br />
Dominance of Small Storms<br />
1.60-1.79<br />
1.80-1.99<br />
2.00-2.19<br />
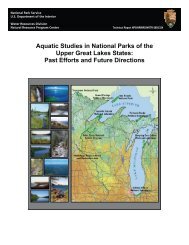
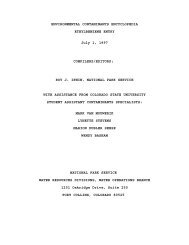
Figure 2.3.b. Dominance of small storms in the around the CRNRA (from Nichols,<br />
1997). Storm size categories based on precipitation in inches.<br />
16<br />
2.20-2.39<br />
2.40-2.59<br />
2.60-2.79<br />
2.80-2.99<br />
3.00-3.19<br />
3.20-3.39<br />
Storm Size Categories<br />
3.40-3.59<br />
3.60-3.79<br />
3.80-3.99<br />
4.00-4.19<br />
4.20-4.39<br />
4.40-4.59<br />
4.60-4.79<br />
4.80-4.99<br />
5.00-5.19<br />
5.20-5.39
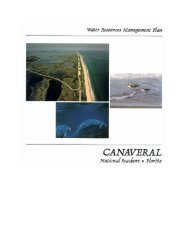
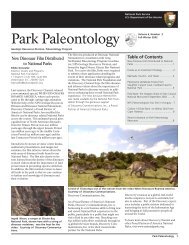
As shown in Figure 2.4.a, rocks in the CRNRA zone are primarily schist, granite, and gneiss.<br />
The Brevard Fault Zone or lineament --a fractured zone of one-half to two miles wide-- follows<br />
along the river, and much of the Recreation Area falls into this fractured zone (Norman, 1970;<br />
Faye et al, 1980). Much of the rock structure in the CRNRA and surroundings is undifferentiated<br />
metamorphic rocks. Soils in the area are derived from the disintegration of underlying rocks and<br />
range in texture from gravelly sandy loam to clay loam.<br />
The Natural <strong>Resources</strong> Conservation <strong>Service</strong> (reports in this bibliography mostly under Soil<br />
Conservation <strong>Service</strong>, SCS) has prepared soil surveys for the counties in the area, which are:<br />
Cobb County (1973, with a 1996 update); Forsyth County (1960); Fulton County (1958); and<br />
Gwinnett County (1967). Obviously, most of these reports are quite old at this point and were<br />
developed under far less urbanized conditions.<br />
1. Forsyth County:<br />
In Forsyth County, along the river, the soils are mostly Congaree fine sandy loam (Ce) or<br />
Buncombe loamy fine sand (Ba) on , with the latter most often closest to the river. The<br />
Congaree Series are deep, nearly level, well-drained, productive soils on flood plains,<br />
generally washed in from uplands. The series supports sweetgum, elm, willow, alder, water<br />
oak, yellow-poplar, loblolly pine, hickory, gum, and beech trees. The Buncombe Series are<br />
sandier, streamside soils, and they support oak, sweetgum, yellow-poplar, beech, loblolly<br />
pine, hickory, poplar, sycamore, and willow. The extent of these soils is shown in the maps<br />
of the Soil Conservation <strong>Service</strong> report (SCS, 1960).<br />
2. Gwinnett County:<br />
Across the river in Gwinnett County, soils are basically the same, but referred to as the<br />
Chewacia-Congaree-Wehadkee association along the floodplain and the Wickham-Altavista-<br />
Red Bay association on stream terraces. The Buncombe and Congaree Series appears along<br />
the river, as described in the preceding paragraph. The nearby upland soils are described in<br />
the SCS surveys as well (SCS, 1967).<br />
3. Cobb County:<br />
Cobb County’s 1996 update on its 1973 survey provides some recent information ( NRCS,<br />
1996). Soils along the river, Willeo Creek, Sope Creek, and Rottenwood Creek most often<br />
are in the Cartecay-Toccoa association, which are somewhat poorly-drained soils along<br />
floodplains. In natural areas, these soils support sweetgum, red maple, yellow-poplar,<br />
willows, alders, sycamore, blackgum, ash, and water oak. Upland soils on hillside areas are<br />
described, for example, the Gwinnett Series, which occupies large areas on ridgetops and<br />
side slopes throughout the county, on 2-25 percent slopes.<br />
4. Fulton County:<br />
Fulton County’s 1958 soil survey is the oldest of the group, so has limited value given the<br />
age of the information (SCS, 1958). The soil series in Fulton are basically the same as<br />
described above for neighboring counties.<br />
The Natural <strong>Resources</strong> Conservation <strong>Service</strong> office for Cobb/Fulton Counties plans to digitize<br />
’93 and ’98 aerial photographs, to prepare layers on soils, roads, streams, and elevations (personal<br />
communications, NRCS, 1998).<br />
17
Forsyth<br />
Count y<br />
Fulton<br />
County<br />
18<br />
X Buford Dam<br />
Gwinnett<br />
Count y<br />
Figure 2.4.a. Geologic map of the Atlanta region (from Norman, 1970).
From a park management perspective, the most valuable aspect of the SCS (NRCS) soil survey<br />
reports are the interpretations on soil capabilities and their uses. However, at this time only Cobb<br />
County has an updated report with urban-relevant interpretations (NRCS, 1996). In addition to<br />
basic soil physical information and engineering aspects, useful advice, information, or data for<br />
park management also are provided on:<br />
• Erodibility: Factors for use in the Universal Soil Loss Equation, for<br />
predicting yields of suspended sediment from land surfaces (for example if<br />
construction takes place, how high an erosion potential is present).<br />
• Recreation: A particular soil's potential for camp, picnic, playground,<br />
and trail use (for example, trafficability, ability to drain).<br />
• Wildlife: Soils’ potential for maintaining wildlife habitat of various types<br />
(mainly type of vegetation that will grow).<br />
• Wastes: Potential of soils for use as septic tank absorption fields or for<br />
sanitary landfills (a concern with major subdivisions having septic tanks as<br />
the disposal means).<br />
• <strong>Water</strong>: Ratings for infiltration and runoff potential, evaluations on<br />
flooding probability, and potential for high water tables.<br />
2.5. VEGETATIVE PATTERNS IN THE AREA<br />
The Chattahoochee River corridor lies in the Piedmont area, but contains some overlap of<br />
Appalachian and Coastal Plain species.<br />
The predominant regional forest cover is oak/pine. However, due to logging, grazing, farming,<br />
and other repeated human uses, the landscape and vegetative cover in the river corridor is a mixed<br />
patchwork of fields, forest stands, and planted trees. Both residential and commercial<br />
development have brought in a variety of exotic species.<br />
Some of the common forest species in the CRNRA includes:<br />
• Sweetgum (Liquidambar styraciflua), sycamore (Platanus occidentalis), blackgum<br />
(Nyssa sylvatica), ash (Fraxinus spp), water oak (Quercus nigra), white oak (Q. alba),<br />
black oak (Q. velutina), and red oak (Q. rubra);<br />
• Red maple (Acer rubrum), yellow-poplar (Liriodendron tulipifera) , elm (Ulmus spp),<br />
hickory (Carya ovata) , willows (Salix spp.), alders (Alnus spp.), and dogwood (Cornus<br />
florida);<br />
• Loblolly (Pinus taeda), Viginia pine (P. virginiana), and shortleaf pine (P. echinata).<br />
Exotic species include kudzu (Pueraria thunberigiana), Japanese honeysuckle (Lonicera<br />
japonica), mimosa (Mimosa spp), princess tree (Tibouchinca spp), periwindle (Vinca spp),<br />
English ivy (Hedera helix), privet (Ligustrum spp), in addition to many exotic landscaping trees.<br />
Chestnut blight and the pine bark beetle have affected the vegetation (CRNRA, 1989)<br />
Listed as Georgia protected species that occur in the vicinity of the CRNRA are: yellow lady’s<br />
slipper (Cyrpipedium calceolus var. pubescens); pink lady’s slipper (Cyrpipedium acaule); bay<br />
star-vine (Schisandra glabra); false hellebore (Veratrum woodii); lobed barren-strawberry<br />
(Waldsteinia lobata); and goldenseal (Hydrastic canadensis) (CRNRA, 1989).<br />
19
2.6. DEMOGRAPHY<br />
Population growth and urbanization in the area around the Chattahoochee River <strong>National</strong><br />
Recreation Area is exceptionally rapid, and the demands on the Recreation Area can be expected<br />
to increase accordingly.<br />
The Atlanta metropolitan statistical area is one of the most rapidly growing urban areas in the<br />
United States, now ranking twelfth in population among the country’s metropolitan areas. The<br />
Atlanta Business Chronicle noted that “the fastest-growing counties in the state –in some cases, in<br />
the entire nation –from 1997 to 1998 were on the metro (Atlanta) area’s outer rim.” (Atlanta<br />
Business Chronicle, online, March 22, 1999). The population in the 10-county Atlanta region<br />
passed the 3 million mark in 1997, and the population of this region has increased from about<br />
71,000 to 105,000 annually during the 1990s. This 1990 growth is an increase over the average<br />
annual increase of about 62,000 during the 1980s (ARC, 1998d; Hippe et al., 1997).<br />
Gwinnett, Cobb, and Fulton Counties have accounted for about 60 percent of the Atlanta area’s<br />
growth since 1990. The 1970 to 1997 population for the Atlanta Region was:<br />
YEAR POPULATION YEAR POPULATION<br />
1970 1,500,823 1990 2,557,800<br />
1980 1,896,182 1996 2,954,400<br />
1985 2,187,300 1997 3,033,400<br />
(ARC, 1998d)<br />
The urban population density and growth patterns for the CRNRA and vicinity are shown in<br />
Figure 2.6.a. The rapid growth is expected to continue, as shown in the projections in Figure<br />
2.6.b.<br />
Population density varies within watersheds. In general, population is less dense to the north and<br />
more dense in urban areas to the south, as illustrated in the Table 2.6.a summary from DeVivo et<br />
al., 1997, where watersheds were categorized as "urbanizing" or already "urban."<br />
Table 2.6.a Population density in some watersheds of the Recreation Area.<br />
<strong>Water</strong>shed 1990 population density<br />
people / square kilometer<br />
Big Creek at State Route 29 96 (urbanizing)<br />
Suwanee Creek 151 ( “ )<br />
Big Creek near Roswell 218 ( “ )<br />
Suwanee Cr, Woodward Mill Road 254 ( “ )<br />
Willeo Creek 605 (urban)<br />
Sope Creek 800 ( “ )<br />
Rottenwood Creek 1,050 ( “ )<br />
(Note: the figures may be divided by 0.3861 to attain people per square mile values)<br />
20
Population (000's)<br />
5,000<br />
4,000<br />
3,000<br />
2,000<br />
1,000<br />
0<br />
Figure 2.6.b. The population growth data and future estimations for the Atlanta Metropolitan<br />
Statistical Area (from Hippe et al., 1997).<br />
3. LAND AND RESOURCE USES<br />
3.1 INTRODUCTION<br />
Atlanta Area Population Data and Estimates<br />
1900 1930 1960 1990 2000 2010<br />
Year<br />
This section reviews the general patterns of landownership in the CRNRA and its surroundings,<br />
describes the complexity of the political boundaries in the area, and reviews the principal<br />
stakeholders involved in land-use planning, environmental protection, and natural resource<br />
management.<br />
3.2 LANDOWNERSHIP AND POLITICAL BOUNDARIES<br />
Political boundaries and land uses within the CRNRA and vicinity are complex, with many<br />
counties, agencies, towns, and other entities taking part in land and resource management<br />
(Figures 3.2.a and b).<br />
Local governments in Georgia consist of counties and incorporated municipalities, which have<br />
constitutional responsibility for land management and for water quality protection. The role of<br />
local governments includes zoning enforcement, stormwater ordinance control, water and<br />
wastewater planning, and wellhead protection. Many local governments also operate water<br />
supply or wastewater facilities (EPD, 1997). The U.S. Army Corps of Engineers operates the<br />
Buford Dam and manages Lake Lanier, at the upper end of the Recreation Area. The Corps plays<br />
a key role in the CRNRA through its control of river flows.<br />
The CRNRA straddles parts of four counties–Cobb, Forsyth, Fulton, and Gwinnett, with tributary<br />
headwaters in a fifth–Dekalb. <strong>Park</strong> units abut the cities of Atlanta, Duluth, and Roswell, and are<br />
not far from Alpharetta, Buford, and Cumming. The park falls in an area where both the State of<br />
Georgia and the Atlanta Regional Commission play active roles in natural resource management,<br />
environmental protection, and planning. In addition, environmental organizations, such as<br />
Riverkeeper, exert a growing influence on the resource management practiced by the political<br />
entities.<br />
23
3.3 LAND USE IN THE CRNRA AND VICINITY<br />
Land use in the CRNRA and vicinity is mixed and complex, and the area is mainly characterized<br />
by rapid population growth and urban sprawl. The principal type of development is single-family<br />
housing. Urbanization has converted about half of the land in the CRNRA vicinity from<br />
agricultural or forested land uses into residential, commercial, industrial, or other more intensive<br />
uses, as shown in the land-use map of Figure 3.3.a. High-density office, commercial, and<br />
residential development has followed I-75, I-285, and GA-400, and other major corridors,<br />
especially along routes needed by Atlanta-bound commuters. The rapid urban growth includes<br />
high rise buildings, industrial sites, large-scale subdivisions, and highway expansion (ARC,<br />
1992a and b).<br />
The southern end of the CRNRA is the most developed. Eastern Cobb County has attracted high-<br />
density development because of the interstate system. Rottenwood and Sope creeks in this area<br />
suffer from development impacts, and Rottenwood Creek has been referred to as “one of the most<br />
threatened streams in Cobb County” because of contamination and siltation. <strong>Park</strong> units in the<br />
southern end of the CRNRA stand out as islands of green in an urban setting (ARC, 1992b).<br />
Many watersheds in Fulton County are developed and dense development around Roswell and<br />
Alpharetta has a distinct impact on water quality in Big Creek, the largest tributary in the<br />
Recreation Area. Gwinnett County is about one-third developed, but development is increasing,<br />
causing measurable impacts on Suwanee Creek (ARC, 1998 a and b).<br />
The northern end of the CRNRA still contains some open fields and forests, and Forsyth County<br />
is still fairly rural, but changing rapidly. Significant residential, commercial and light industrial<br />
development is occurring along Highway 400. About a third of the county is developed.<br />
Urbanization is sprawling northward, as commuters seek the relatively cheaper housing, or seek<br />
to live near Lake Lanier. Single-family housing comprises the bulk of the development. New<br />
housing brings in road construction, new sewer lines, and other infrastructures, all which affect<br />
the Chattahoochee River and/or the headwaters of Big Creek.<br />
<strong>Water</strong>shed protection and conservation measures are essential for protecting river water quality<br />
and the riparian environment. The Atlanta Regional Commission (ARC) therefore has declared<br />
that the protection of the Chattahoochee River watershed is their "major environmental concern,"<br />
and has suggested that a watershed management plan be completed. ARC promotes stream<br />
protection, building set-backs, and other practices to protect watersheds. The enforcement of<br />
these regulations is a challenge. ARC's “Vision 2020” planning for the environment states the<br />
following objective:<br />
“… Implement a strategy for watershed protection that guarantees a clean, adequate water<br />
supply that makes streams swimmable again… (including) protection of stream and<br />
river corridors, reduction of erosion and sediment, preservation of stream buffers, and<br />
improvements in storm water and sewer systems” (ARC, 1996).<br />
24
Protection of the river corridor is provided through the Metropolitan River Protection Act<br />
(MRPA). The Act is a state law passed in 1973 that created a 2,000-foot Corridor on each side of<br />
the Chattahoochee River and its impoundments. Since its passage, the Act's jurisdiction and<br />
the Chattahoochee River Corridor have extended from Buford Dam and Peachtree Creek (the<br />
jurisdiction was extended further downstream in 1998). The Act requires ARC to adopt a <strong>Plan</strong> to<br />
protect the Corridor and to review all development activity in the Corridor for consistency with<br />
the <strong>Plan</strong>. ARC reviews all development applications in its Region and makes findings as to their<br />
consistency with the <strong>Plan</strong>. The local governments then approve the finding. In Forsyth County,<br />
which is outside the Atlanta Region, the <strong>Plan</strong> is implemented by the Georgia Mountain Regional<br />
Development Center in Gainesville, Georgia. Since 1984, the Act has required the local<br />
governments in the watershed of the corridor to adopt tributary buffer ordinances for tributaries<br />
outside the 2,000-foot corridor. These ARC and other regulations and ordinances are detailed in<br />
Section 3.5.<br />
Protection of tributary headwaters is a special problem in the CRNRA, since the park’s tributary<br />
watersheds extend far beyond the 2,000-foot river protective buffer, making headwater watershed<br />
protection more difficult. In 1995 the Georgia EPD established a conservation program, River<br />
Care 2000, which has the objective to acquire river-corridor lands for protection and to keep<br />
development out of flood-prone areas.<br />
3.4 ORGANIZATIONS, EXPERTISE, AND OPPORTUNITIES FOR<br />
COOPERATION<br />
The CRNRA is fortunate in terms of accessibility to water resource expertise. Both the U.S.<br />
Geological Survey and U.S. Environmental Protection Agency have major offices and<br />
laboratories in the Atlanta area, with hydrologists and related specialists, as does the State of<br />
Georgia. The counties also have some technically solid staff, and generally are expanding and<br />
strengthening their expertise. A number of private organizations and conservation groups play<br />
roles of increasing importance including, for example, volunteer monitoring programs. Since<br />
Atlanta is a major southeast hub, some major consulting firms, such as CH2MHill, Law Inc., etc<br />
have cadres with excellent water expertise. The Atlanta Regional Commission is the regional<br />
planning agency for the 10-county metropolitan area. ARC interacts with various groups and<br />
agencies, and utilizes consulting firm expertise.<br />
The counties and municipalities play the hands-on role in watershed protection, erosion control,<br />
and stormwater runoff management. For example, Gwinnett County is promoting an<br />
environmentally progressive set of goals, and providing increasing attention to water quality and<br />
watershed protection under its <strong>Plan</strong>ning and Development and Transportation departments. The<br />
county is adopting a number of innovations to tackle pollution, waste management, and related<br />
issues. The actions include some progressive water reclamation efforts, an active Adopt-A-<br />
Stream program, and an increase in certified soil/erosion control inspectors. A new geographic<br />
information system (GIS) is being developed for natural resource inventory and monitoring.<br />
Many training opportunities qualify staff in erosion control, monitoring, and other topics.<br />
Table 3.4.a highlights some opportunities for cooperation with organizations in the area, by<br />
providing a thumbnail list of the organizations especially active in watershed and water resource<br />
activities or projects within the vicinity of the CRNRA. The table gives a few key words on each<br />
29
organization’s activities or opportunities for cooperation. More details on individual names and<br />
addresses appear in Appendix B.<br />
Table 3.4.a. Abbreviated list of some of the organizations that are players in water resource<br />
and watershed activities in the Upper Chattahoochee River Basin. Comments are<br />
provided from the perspective of potential opportunities for cooperation. A more<br />
detailed list of names, addresses, and other organizations appears in Appendix B.<br />
Abbreviations: GA = Georgia; GIS = geographic information system; info =<br />
information; WQ = water quality.<br />
Organization Activities Most<br />
Relevant to<br />
CRNRA<br />
Special Opportunities for the CRNRA<br />
Perspective Cooperation and Highlights on Key<br />
Activities from<br />
Adopt-A-Stream Pollution monitoring Gwinnett County is particularly active (with Upper<br />
Chat. Riverkeeper). The opportunity for CRNRA<br />
to cooperate is excellent.<br />
Alpharetta, Town Pollution and<br />
erosion training<br />
Atlanta Regional<br />
Commission<br />
GIS, mapping, and<br />
planning<br />
CH2MHill Recreation and<br />
water quality work<br />
Cobb County Monitoring and<br />
watershed protection<br />
Environmental<br />
Protection Agency<br />
(U.S.)<br />
Non-point source<br />
research<br />
Has opportunity for “park volunteers” or staff to<br />
benefit from active training programs at their<br />
Environmental Ed. Center (could link to Adopt-A-<br />
Stream also). Interest in NPS cooperation.<br />
Provides basic land and resource data in GIS<br />
format (the park has used). Prescribes basic<br />
watershed protection guidelines for the CRNRA<br />
vicinity.<br />
Are specialists in modeling recreation flows.<br />
Have served counties in the area on water quality<br />
and watershed work. Has contract with NPS on<br />
visitor use.<br />
Manages sewer pipes traversing park units.<br />
CRNRA recognizes need to develop a better<br />
process for coordinating and controlling<br />
spill/overflow problems with all counties.<br />
Has specialized personnel working in non-point<br />
source pollution in the CRNRA vicinity. Also,<br />
wetlands specialist has worked in the CRNRA,<br />
assisting with delineation.<br />
30
Forsyth County Monitoring,<br />
stormwater mgmt,<br />
and septic tank<br />
permitting<br />
Fulton County Monitoring and<br />
stormwater<br />
management<br />
GA, Office of<br />
Technology<br />
Outreach <strong>Service</strong>s<br />
GA, Dept of<br />
Natural <strong>Resources</strong><br />
(Game, Fisheries)<br />
GA,<br />
Environmental<br />
Protection Division<br />
GA, Univ. of,<br />
Institute of Ecology<br />
GIS work and map<br />
preparation<br />
Fisheries and<br />
biological activities<br />
and research<br />
WQ monitoring,<br />
stormwater<br />
modeling<br />
Reporting on water<br />
quality and<br />
hydrology for the<br />
area<br />
Gwinnett County Monitoring, GIS<br />
work, stormwater<br />
and sewer<br />
permitting<br />
Law Engineering<br />
and Environ.<br />
<strong>Service</strong>s, Inc.<br />
Natural <strong>Resources</strong><br />
Conservation<br />
<strong>Service</strong><br />
(Upper<br />
Chattahoochee)<br />
Riverkeeper<br />
Seabrook, Chas.<br />
Atlanta<br />
Constitution<br />
Stormwater and<br />
other modeling<br />
At county level:<br />
erosion control<br />
State office: GIS<br />
work and mapping<br />
Monitoring, citizen<br />
action, planning,<br />
environmental<br />
education<br />
Information<br />
dissemination on<br />
river pollution<br />
Has large areas with septic tanks, some affecting<br />
CRNRA. Collects WQ monitoring data for Lake<br />
Lanier. Working on Big Creek study with<br />
Alpharetta (valuable information for CRNRA).<br />
Collects basic WQ and GIS information on river<br />
and main tributaries. Involved in Big Creek Study<br />
with ARC. Adopt-A-Stream work underway.<br />
Cooperates with Alpharetta on training. Has sewer<br />
pipes traversing CRNRA.<br />
(at University of Georgia). Has basic data on land<br />
use, topography, resources, etc in GIS format<br />
useful to CRNRA. Works with GA Clearinghouse<br />
for GIS data (at GA Tech).<br />
Has specialists on fisheries sometimes working in<br />
the CRNRA area (park has much contact, also with<br />
fish hatchery, Buford). Many opportunities for<br />
further fish investigations.<br />
Issues basic information/advice for CRNRA area<br />
on stormwater models, WQ monitoring, spills, etc.<br />
CRNRA has cooperative agreement. Conducts<br />
periodic workshops on WQ and watersheds in the<br />
CRNRA vicinity or Athens.<br />
Has new GIS system and very active Adopt-A-<br />
Stream program. Conducts training on WQ and<br />
watershed protection. Has sewer pipes traversing<br />
park. Offers special opportunities where CRNRA<br />
could cooperate.<br />
Is one of the companies active in WQ and<br />
stormwater modeling in the CRNRA vicinity (NPS<br />
has cooperated, e.g., stormwater modeling).<br />
Operates county offices with emphasis on erosion<br />
control (linked to county & conservation districts).<br />
Has data on erosion and sediment.<br />
CRNRA’s existing Riverkeeper cooperation is<br />
good, but could be enhanced by cooperation<br />
opportunities in Adopt-A-Stream, training, and<br />
focused studies on land-use impacts.<br />
Presents opportunity to encourage more public<br />
interest in pollution, river programs, etc, as<br />
cooperative projects develop at CRNRA.<br />
31
U.S. Corps of<br />
Engineers<br />
U.S. Geological<br />
Survey<br />
Coordination of tristate<br />
allocation<br />
<strong>Water</strong> research and<br />
interpretation (both<br />
Regional Office and<br />
District Office<br />
nearby)<br />
Coordinates inter-agency, tri-state efforts.<br />
Opportunities to and seek more contribution from<br />
Corps to the CRNRA.<br />
CRNRA cooperation encourages USGS research in<br />
the area. Could expand into hands-on cooperative<br />
projects with a NPS technical role as well (once<br />
CRNRA can add a water resource person to the<br />
staff).<br />
3.5 SOME RELEVANT WATER RESOURCE LAWS AND<br />
REGULATIONS<br />
Some of the water resource laws most relevant to the CRNRA are summarized briefly in this<br />
section. For further details, key Federal laws relating to water, water resources, and wetlands are<br />
summarized and accessible online at web pages for the U.S. Environmental Protection Agency<br />
(www.epa.gov) and the U.S. Fish and Wildlife <strong>Service</strong> (www.fws.gov). State water quality<br />
control rules are summarized in “Rules and regulation for water quality control, Chapter 391-3-<br />
6,” of the Georgia Department of Natural <strong>Resources</strong>, EPD, revised May 22, 1997 (EPD, 1997),<br />
and in the “Official code of Georgia, annotated, Vol. 10, of 1996, by the Office of Legislative<br />
Counsel (OLC, 1996).<br />
<strong>Water</strong> laws at the State and local level often are patterned after Federal laws, or serve in response<br />
to federal directives dealing with water pollution, wetlands, or streamflow. For example, the<br />
Federal Clean <strong>Water</strong> Act is the prime federal legislation; its various sub-sections cover water<br />
pollution, wetlands, stream dredging, waste disposal, and related topics, as described below. The<br />
state has enacted legislation that addresses parts of the Clean <strong>Water</strong> Act.<br />
The protection of stream water quality is a large challenge in an area with rapid development.<br />
Local, site-specific ordinances and permitting procedures are essential for controlling erosion and<br />
sedimentation at building sites and other areas of land disturbance. This sub-section summarizes<br />
some of the key regulations and related concepts relevant to the topic of watershed protection and<br />
for protection against stream sedimentation.<br />
An Overview of Some Federal Laws and Regulations Relevant to <strong>Water</strong> at the<br />
CRNRA<br />
• <strong>National</strong> Environmental Policy Act (NEPA) of 1969 and 1977: NEPA requires the<br />
Federal government to consider every significant impact a proposed action may have on the<br />
environment, including streams and wetlands. Section 201 also requires the President each<br />
year to send to Congress an Environmental Quality Report containing the status and condition<br />
of the major natural, man-made, or altered environment, including wetlands. Federal agencies<br />
must prepare environmental impact statements on major Federal actions that could<br />
significantly affect the quality of the environment (, July 1999).<br />
32
• Fish and Wildlife Coordination Act: The Fish and Wildlife Coordination Act requires<br />
consultation with the USFWS and the fish and wildlife agency of a state when potential<br />
impacts of any Federal water resource development project could occur. Consultation is to be<br />
undertaken for the purpose of preventing loss of and damage to wildlife resources.<br />
• The Clean <strong>Water</strong> Act (CWA): The Clean <strong>Water</strong> Act (CWA) (originally the Federal <strong>Water</strong><br />
Pollution Control Act) (P.L. 95-217) was enacted to… “restore and maintain the chemical,<br />
physical, and biological integrity of the Nation’s waters,” and to protect fish, wildlife, and<br />
recreational waters. The act is designed so that the administration and enforcement of most<br />
aspects of act are delegated to the states, albeit with federal review. Georgia administers the<br />
water pollution programs for controlling water quality, and to allow instream flows that<br />
protect aquatic life (Shelton & Fox, 1994; Decaire, 1997).<br />
• Section 303(d) (for TMDL): This section of the CWA establishes the total maximum<br />
daily load (TMDL) for streams. The US Environmental Protection Agency (under<br />
CWA) requires that the State identify stream segments where water quality standards are<br />
not met following the application of technology based controls, and to establish TMDLs<br />
for the segments, for USEPA review. A draft 2000 list of stream segments was placed<br />
on public notice on 28 February 2000. That list has been used for supporting/nonsupporting<br />
discussion in this plan (EPD, 2000). EPD has noted that, "The<br />
Chattahoochee River … will be the focus of monitoring in the year 2000… (and )…<br />
TMDLs will be developed." (EPD, 1997).<br />
• Section 305(b) (for reports on streams): This section of the CWA requires that each<br />
State prepare and submit to US Environmental Protection Agency a biennial report,<br />
describing the water quality conditions of lakes and streams. The report also lists any<br />
pollution problems occurring on certain stream reaches. Streams are then classified as<br />
supporting, not supporting, or only partially supporting their designated uses (for fishing,<br />
recreation, or drinking, etc) (EPD, 1998). [Table 4.4.c of this plan draws on the 305(b)<br />
information for the CRNRA, and lists "non-supporting" stretches of streams].<br />
• Section 313 (applies to NPS): Section 313 of the Clean <strong>Water</strong> Act requires the<br />
<strong>National</strong> <strong>Park</strong> <strong>Service</strong> to …”comply with all Federal, State, interstate, and local<br />
requirements… (regarding) water pollution in the same manner and to the same extent as<br />
any non-government entity…” (Shelton & Fox, 1994).<br />
• Section 319 (for non-point sources): This key section of the CWA requires states to<br />
develop controls over non-point source pollution, such as erosion, although stormwater<br />
runoff from construction and other activities on the land fall under the <strong>National</strong> Pollutant<br />
Discharge Elimination System program (Section 402) (Shelton & Fox, 1994).<br />
• Section 402 (permits for wastes and for stormwater): This section of the CWA<br />
defines the <strong>National</strong> Pollutant Discharge Elimination System (NPDES), which requires<br />
industrial and municipal dischargers to meet stringent effluent standards for pollutants<br />
(Shelton & Fox, 1994). Within Section 402 of the CWA, new U.S. Environmental<br />
Protection Agency rules from 1990 also require storm water sewer systems to apply for<br />
NPDES permits, designating counties or municipalities as responsible for the permitting<br />
33
and enforcement processes (ARC, 1992b). Under the CWA, a city or county could be<br />
fined up to $25,000 per day per violation when a sewer problem occurs (River Chat,<br />
winter 1998).<br />
• Section 404 (dredging, wetlands, etc): This section of the CWA controls the<br />
discharge of dredged or fill materials into waters of the United States including riverine<br />
systems and wetlands. The Act includes other impacts to riverine systems, such as<br />
piping, filling, relocating and culverting that the Corps authorizes as well as sand and<br />
gravel mining. The U.S. Army Corps of Engineers issues permits for any project that<br />
entails dredging and filling (with EPD veto power). In the case of sand and gravel<br />
mining on the river, the Corps permit should confirm that the discharge of dredged or fill<br />
material into surface waters and wetlands is in compliance with Section 404 of the<br />
(federal) Clean <strong>Water</strong> Act (P.L. 95-217) (DeCaire, 1997). The Corps must notify the NPS<br />
of an intent to issue a permit within the CRNRA reach of the river, and seek NPS<br />
comments regarding any potential impacts (CRNRA, 1989). [See other discussion on this<br />
point in Chapter 7 of this report].<br />
• Safe Drinking <strong>Water</strong> Act of 1974: (PL 93-523) as amended by: "The Safe Drinking<br />
<strong>Water</strong> Act Amendments of 1986; the <strong>National</strong> Primary Drinking <strong>Water</strong> Regulations, 40 CFR<br />
141: the <strong>National</strong> Interim Primary Drinking <strong>Water</strong> Regulations Implementation, 40 CFR 142<br />
; and the <strong>National</strong> Secondary Drinking <strong>Water</strong> Regulations, 40 CFR 143. This is the primary<br />
Federal legislation protecting drinking water supplied by public water systems (those serving<br />
more than 25 people). The U.S. Environmental Protection Agency is lead agency and is<br />
mandated to set standards for drinking water. USEPA establishes national standards of which<br />
the states are responsible for enforcing. The act provides for the establishment of primary<br />
regulations for the protection of the public health and secondary regulations relating to the<br />
taste, odor, and appearance of drinking water. Primary drinking water regulations, by<br />
definition, include either a maximum contaminant level (MCL) or, when a MCL is not<br />
economically or technologically feasible, a prescribed treatment technique that would prevent<br />
adverse health effects to humans. An MCL is the permissible level of a contaminant in water<br />
that is delivered to any user of a public water system. Primary and secondary drinking water<br />
regulations are stated in 40 CFR 141 and 143, respectively. As amended in 1986, the U.S.<br />
Environmental Protection Agency is required to set maximum contaminant levels for 83<br />
contaminants deemed harmful to humans (with specific deadlines). It also has authority over<br />
groundwater. <strong>Water</strong> agencies are required to monitor water to ensure it meets standards"<br />
(from > www.usbr.gov/laws > July, 1999).<br />
• The NPS Administrative Reform Act of 1996: This act amends the <strong>Park</strong> System<br />
Resource Protection Act (P.L. 101-337, 1990) to permit the NPS to recover costs from harm<br />
caused by oil or hazardous material spills. The intention is to have a mechanism whereby<br />
NPS is not stuck with the costs of spill response and restoration. The costs are compensatory,<br />
not punitive. “Damages” can include the costs of restoration or the lost values of a “park<br />
system resource” pending its restoration (“park system resource” means any living or nonliving<br />
resource within the park’s boundary). Recoveries received for damage claims can be<br />
used to restore resources that were the subject of a spill or other action, and may also be used<br />
to monitor and study such resources (Office of the Solicitor, 1997).<br />
34
• Executive Order 11990: Executive Order 11990, "Protection of Wetlands," directs all<br />
Federal agencies to avoid destruction or modification of wetlands whenever there is a<br />
practicable alternative. EO 11990 instructs each Federal agency to avoid undertaking or<br />
aiding new construction in wetlands unless the head of the agency finds there is no<br />
practicable alternative to construction in the wetland and the proposed construction<br />
incorporates all possible measures to limit harm to the wetland (< www.gsa.gov/pbs > July,<br />
1999).<br />
• Executive Order 11987, Exotic Organisms: Signed May 24, 1977, this Executive Order<br />
requires Federal agencies, to the extent permitted by law, to restrict the introduction of exotic<br />
species into the natural ecosystems on lands and waters owned or leased by the United States;<br />
encourage States, local governments, and private citizens to prevent the introduction of exotic<br />
species into natural ecosystems of the U.S.; restrict the importation and introduction of exotic<br />
species into any natural U.S. ecosystems as a result of activities they undertake, fund, or<br />
authorize; and restrict the use of Federal funds, programs, or authorities to export native<br />
species for introduction into ecosystems outside the U.S. where they do not occur naturally<br />
(< www.fws.gov/laws >, July, 1999).<br />
• Executive Order 11988, Floodplain <strong>Management</strong>: The purpose of this Executive Order,<br />
signed May 24, 1977, is to prevent Federal agencies from contributing to the "adverse<br />
impacts associated with the occupancy and modification of floodplains" and the "direct or<br />
indirect support of floodplain development." In the course of fulfilling their respective<br />
authorities, Federal agencies "shall take action to reduce the risk of flood loss, to minimize<br />
the impact of floods on human safety, health and welfare, and to restore and preserve the<br />
natural and beneficial values served by floodplains." Before proposing, conducting,<br />
supporting or allowing an action in a floodplain, each agency is to determine if planned<br />
activities will affect the floodplain and evaluate the potential effects of the intended actions<br />
on its functions. Agencies shall avoid siting development in a floodplain "to avoid adverse<br />
effects and incompatible development in the floodplains." (< www.fws.gov/laws > July<br />
1999).<br />
• Federal Reserve <strong>Water</strong> Rights: The federal government can claim a reservation of<br />
instream flows as necessary to further the purpose for which it set aside its lands. Decaire<br />
(1997) argued that, in principle, the NPS could exercise its reserved water rights to attain<br />
instream flow levels that adequately protect aquatic habitats on NPS lands reserved for<br />
environmental and recreational purposes. She notes the various cases where a court has held<br />
that Congress intended that a reasonable amount of water be available to support the<br />
particular intention of a park (DeCaire, 1997). Analysis would be needed to evaluate how<br />
these principles relate to the CRNRA’s particular pattern of mixed landownership.<br />
An Overview of Some of the State, County, and Metropolitan Laws and<br />
Regulations Relevant to <strong>Water</strong> at the CRNRA<br />
• Georgia Erosion and Sedimentation Act: This Act (OCGA 12-7-1 et seq.) became state<br />
law in 1975. It requires a permit for certain land-disturbing activities, providing a mechanism<br />
to control erosion from clearing, dredging, grading, excavating, filling and other surface<br />
disruptions. The law relates especially to subdivision and commercial development and to<br />
35
oad building, in the Recreation Area and vicinity. The Act provides that “the governing<br />
authority of each county and each municipality shall adopt a comprehensive ordinance<br />
establishing the procedures governing land-disturbing activities which are conducted within<br />
their boundaries” (EPD, 1996a). County and city governments therefore are the “issuing<br />
authorities,” and issue the permits, inspect for compliance, and enforce as needed. Towns<br />
may also enact ordinances. Failure to maintain BMPs is a violation of the land-disturbing<br />
permit. The state has traditionally used the visual standard, that turbidity should cause no<br />
"substantial visual contrast." Code Section 12-5-30 specifies numbers, that turbidity<br />
readings in receiving waters should not be increased by more than 25 NTUs (nephelometric<br />
turbidity units) for non-trout waters or 10 NTUs for trout waters. Land disturbances also<br />
must be 100 feet or more from a trout stream’s bank (25 feet for non-trout streams) to avoid<br />
erosion and turbidity, unless a variance is granted from EPD (EPD, 1995a). For example,<br />
Roswell prohibits development within 100 ft of Big Creek and 50 ft on tributaries to Big<br />
Creek, and keeps a vegetative buffer, to reduce the high sediment problems that have<br />
occurred (River Chat, summer 1997).<br />
• Georgia’s <strong>Water</strong> Quality Control Act (WQCA): (OCGA s12-5-20 et seq.) gives<br />
authority to the Environmental Protection Division to issue permits for withdrawal, diversion,<br />
or impoundment of surface waters. EPD establishes standards for water quality, including<br />
consideration of fish, wildlife, and recreation. The Division must develop river basin<br />
management plans that also consider fish, wildlife, and recreation in the goals of the plans.<br />
This act also authorizes EPD to adopt water quality standards including two narrative water<br />
quality standards for turbidity.<br />
• Georgia’s Wetland Law: (OCGA s12-5-286 et seq.) protects wetlands, requiring a permit<br />
for any alterations. The COE may require wetland mitigation activities in association with<br />
permitting, including creation, restoration, and protection of wetlands (EPD, 1998). Section<br />
404 restricts construction activities near any wetland, defining buffers, acceptable materials,<br />
and many details on protection of the area, especially against sediment. The Section also<br />
defines restrictions on boat ramps, for size, materials, and excavation limits (Gwinnett<br />
County, 1997b).<br />
• Georgia <strong>Plan</strong>ning (review) Act: The Georgia <strong>Plan</strong>ning Act of 1989 authorized the<br />
Department of Community Affairs to establish procedures to review large projects (>400<br />
houses, for example), which are called "Developments of Regional Impact." These are<br />
projects that can affect the environment beyond the project itself. Such project must be<br />
reviewed to determine if they are or are not "in the best interest of the State." (Higdon, 1996).<br />
• Georgia River Basin <strong>Plan</strong>ning Enabling Legislation: (OCGA 12-5-520) of 1992<br />
assigned EPD the responsibility to develop river basin management plans (RBMP), which<br />
includes the Chattahoochee Basin. The plan provides a mechanism to assess river basin<br />
conditions, identify water and watershed issues, involve the public, and seek solutions on<br />
issues. EPD plans to update the RBMPs on a periodic basis (EPD, 1997b).<br />
• Georgia's "Reasonable Use Doctrine": A “reasonable use doctrine” applies to surface<br />
water rights in the state. Under the reasonable use doctrine, private ownership of water does<br />
not exist. Rather, the owner’s right consists of the right to a “reasonable use” of the water as<br />
it passes along. The user should not “work a material injury” to other riparian proprietors. A<br />
36
iparian user should also consider “public welfare,” including consideration of natural flows.<br />
Obviously the definitions are inherently vague, and competing demands for water will<br />
continue to challenge how “reasonable use” is defined (Pendergrast, 1997). Riparian property<br />
values include instream flow needed to protect reasonable uses, which may include fishing,<br />
recreation, aesthetic enjoyment, and effects on adjoining land (DeCaire, 1997).<br />
• The Georgia Surface <strong>Water</strong> Withdrawal Act: (OCGA 12-5-31) establishes a permit<br />
system, administered by EPD, for the withdrawal of water. Some of the criteria considered<br />
when a permit is issued include: (i) number of persons to use the water; (ii) necessity of the<br />
use; (iii) nature/size of the affected water source; and (iv) the overall economic<br />
consequences; etc. (Pendergrast, 1997).<br />
• The State <strong>Water</strong> Supply Act: This Act (OCGA s12-5-470) gives the Department of<br />
Natural <strong>Resources</strong> the power to manage water projects and facilities …for the public good<br />
and the general welfare… including promulgation of standards that protect watersheds and<br />
wetlands (Decaire, 1997). Exceptions: A major exception or loophole exists in the<br />
permitting process for water withdrawal, namely, that no permit is needed for a withdrawal of<br />
surface waters of less than 100,000 gallons per day on the average (equivalent to about 125<br />
houses using 800 gpd each) (code 12-5-31). Also, turf watering and some other “farming”<br />
activities require no permit (OLC, 1996; Decaire, 1997).<br />
• Metropolitan River Protection Act (MRPA): The MRPA (Code 12-5-440 et seq.) was<br />
passed first in 1973, and later amended. The Act's purpose basically is to protect water<br />
quality, control erosion/sedimentation, control development adjacent to streams, prevent<br />
activities that lead to flooding, and to provide comprehensive planning for the Chattahoochee<br />
River stream corridor. The Act established a ‘river protection corridor’ within 2,000 feet of<br />
both banks of the Chattahoochee River from Buford Dam to the southern borders of Douglas<br />
and Fulton counties and directed the Atlanta Regional Commission to develop a<br />
Chattahoochee Corridor <strong>Plan</strong>.<br />
The local authorities for the Erosion and Sedimentation Act implementation in the area are listed<br />
in Table 3.5.a.<br />
Table 3.5.a. The local “issuing authorities” and other agencies involved in the Georgia<br />
Erosion and Sedimentation Act (EPD, 1996). [The issuing authorities adopt<br />
an appropriate ordinance, establish procedures, issue permits, monitor<br />
compliance, identify problems, and provide education on the topic]. These<br />
agencies also interact with the Soil and <strong>Water</strong> Conservation District for the<br />
county.<br />
County or Issuing Permits Compliance<br />
Municipality Authority<br />
Cobb County Cobb Cty Development Control Development<br />
Control<br />
Forsyth County Forsyth Cty Co. Engineer Co. Engineer<br />
Cumming City City Engineer City Engineer<br />
37
Fulton County Fulton Cty Pub. Works Co. Engineer<br />
Alpharetta City <strong>Plan</strong>. & Comm.<br />
<strong>Plan</strong>. & Comm.<br />
Development<br />
Development<br />
Roswell City City Engineer City Engineer<br />
Gwinnett Cty Gwinnett Cty Co. Engineer Co. Engineer<br />
Buford City Bldg Inspector Bldg Inspector<br />
Duluth City City Engineer City Engineer<br />
Norcross City Development Director Development<br />
Director<br />
Suwanee City Bldg. Inspector Bldg Inspector<br />
Some Definitions and Concepts Related to the Laws and Regulations in and<br />
Around the CRNRA<br />
• MRPA Guidelines: MRPA and the Corridor <strong>Plan</strong> include guidelines for limits on land<br />
disturbance and impervious surfaces; a 50-ft natural buffer on both sides of the river; a 150-ft<br />
building setback; a 35-ft buffer on tributaries; and controls on floodplain development and the<br />
extent of impervious surfaces. Under the Act, ARC conducts the reviews and issues findings.<br />
Local governments approve of reviews based on these findings. The locals are responsible<br />
for implementation and enforcement of the Act and monitoring of development after reviews<br />
are completed (ARC, 1987).<br />
• <strong>Water</strong> Use Classification and WQ Standards: Under the Georgia <strong>Water</strong> Quality Control<br />
Act, EPD establishes water use classifications and water quality standards. Streams are<br />
classified as fishing, recreation, drinking water, wild river, scenic, or coastal fishing. The<br />
river from Buford Dam to Atlanta is classified as drinking water and recreation, with<br />
tributaries as fishing (as discussed in Chapter 5.2 and in Table 5.2.b). The river is classified<br />
as a trout stream as well (EPD, 1998a).<br />
• Spills: Code 12-5-30.1, on “Major Spills,” specifies that a waste treatment facility must<br />
provide notice of a major spill within 24 hours and provide for independent monitoring of<br />
waters affected by the spill (at the treatment facility’s expense) for at least a year after the<br />
spill (OLC, 1996). In spring, 1998, the EPD announced a new “zero tolerance policy” of<br />
pollution and informed all permittees along the river within the CRNRA and vicinity.<br />
Penalties: The Official Code of Georgia describes penalties for pollution (OLC, 1996.<br />
Intentional or negligent spills of sewage or other wastes resulting in pollution makes the party<br />
responsible liable for the costs, expenses, and any injuries caused by the spills (according to<br />
code 12-5-51). Civil penalties up to $50,000 per day (in repeat cases $100,000/day) is<br />
possible (12-5-52), and in special cases a felony charge with fines for an organization of up to<br />
$1 million (code 12-5-53).<br />
• Variances and Exemptions: Certain activities are exempt from the Erosion and<br />
Sedimentation Act, including: surface mining, agriculture, forestry, and most single home<br />
construction jobs. The law also provides for standards, including a turbidity standard, and<br />
gives guidelines for buffer strips and for best management practices (BMPs) (EPD, 1996,<br />
1995; ARC, 1992).<br />
38
• Suspensions: Code Section 12-7-13 allows EPD to suspend any land-disturbing activity<br />
when evidence shows that the activity presents substantial danger to the environment (EPD,<br />
1995). Civil penalties and $2,500 per day fines can apply in cases where the erosion control<br />
rules are deliberately violated (EPD, 1995a).<br />
• Best <strong>Management</strong> Practices (BMP): Gwinnett County Soil Erosion and Sediment<br />
Control Ordinance defines BMPs as “a collection of structural and vegetative practices…<br />
(which) …will provide effective erosion and sedimentation control for all rainfall events up<br />
to and including a 25-year, 24-hour rainfall event.” (Gwinnett County, 1997a).<br />
• Construction Permits: There are two different construction permits: 1) one for NPDES<br />
under Georgia <strong>Water</strong> Quality Control Act; and, 2) another for land disturbance under<br />
Georgian Erosion and Sedmentation Act. The “Georgia NPDES General Permit for Storm<br />
<strong>Water</strong> Discharges Associated with Construction Activity” requires implementation of best<br />
management practices (BMPs) to minimize erosion, and the permit also requires<br />
development of a “Storm <strong>Water</strong> Pollution Prevention <strong>Plan</strong> (SWP3). [The permit is not in<br />
effect because of legal challenges since 1977.]Each county or municipality adopts<br />
ordinances governing land-disturbing activities conducted within their respective boundaries<br />
and issues permits.<br />
• Stormwater <strong>Plan</strong>s: The State EPD developed a stormwater permitting process, which was<br />
initiated in 1994 to 1995. Permits are issued to “large stormwater systems” (>250,000<br />
population), “medium” (100 to 250,000), as well as to smaller activities. Cobb, Fulton, and<br />
Gwinnett Counties and incorporated cities in the area apply for a “large system” NPDES<br />
permit for stormwater discharges. Counties require Stormwater <strong>Management</strong> <strong>Plan</strong>s, issue<br />
permits, or may grant variances (Forsyth County, 1998).<br />
• Role of the Soil and <strong>Water</strong> Conservation Districts: The Georgia Soil and <strong>Water</strong><br />
Conservation Commission (GSWCC) is the lead agency for agricultural non-point source<br />
pollution prevention. GSWCC provides guidance to the Soil and <strong>Water</strong> Conservation<br />
Districts and also provides oversight for the Georgia Erosion and Sedimentation Act. The<br />
SWCDs promote the adoption of best management practices.<br />
• Use of the 7Q10: The Georgia Surface <strong>Water</strong> Withdrawal Act does not address protection<br />
of “natural stream values” (i.e., for fish, recreation, aesthetics, wetlands, etc) as such. The<br />
present policy of the EPD is to maintain minimum flows below a reservoir at above the 10year<br />
drought condition, “7Q10.” [7Q10 = the lowest average stream flow expected to occur<br />
over 7 consecutive days once every 10 years). The Wildlife Resource Division of the<br />
Department of Natural <strong>Resources</strong> (Pendergrast, 1997) has proposed a higher minimum<br />
instream flow. EPD is giving consideration to raising the minimum flow (EPD, 1998a).<br />
3.6 AN OVERVIEW OF THE WATER RESOURCE ISSUES<br />
This section provides an overview of the main existing and potential issues in water resources in<br />
the CRNRA and nearby.<br />
39
The river and its tributaries suffer increasingly from urbanization, industrialization, inadequate<br />
wastewater treatment, sewage overflows, and other impacts that provoke contamination, turbidity,<br />
flooding, erosion, and other problems. These disruptions detract from the natural values of the<br />
river and the parklands. The sooner these issues are addressed, the more feasible it will be to<br />
identify solutions and protective measures, and the less irreversible the damage to natural<br />
resources will be (Hippe et al., 1997; Collier et al., 1996; Hendrix, 1992).<br />
The CRNRA’s role in water resources is basically park management; therefore, interaction with<br />
water resource agencies and technical organizations will continue to be the park’s main<br />
mechanism for addressing the technical aspects of water resources.<br />
The Georgia Environmental Protection Division (EPD) conducted a public meeting in 1993 to<br />
obtain public participation in identifying important water resource issues on the river, from<br />
Buford Dam to West Point Lake. This area includes the CRNRA (West Point Lake is<br />
approximately 60 miles downstream from the lower end of the CRNRA). Agencies participating<br />
at the meeting included the U.S. Environmental Protection Agency, the U.S. Geological Survey,<br />
the Army Corps of Engineers, the Georgia Environmental Protection Division, and<br />
municipalities, among others. Law Engineering and Environmental <strong>Service</strong>s, Inc moderated the<br />
meeting, assembling a comprehensive list of the water resource issues discussed. The emphasis<br />
of the meeting was on development of hydrologic models, but issues were summarized as well<br />
(Neal, 1994).<br />
An overview of the principal issues and problems in water resources relevant to the CRNRA<br />
appears in Table 3.6.a, including inputs from the EPD 1993 meeting mentioned above.<br />
Table 3.6.a. An overview of the principal water resource issues affecting or relevant to the<br />
Chattahoochee River <strong>National</strong> Recreation Area, with added comments from the<br />
park management perspective.<br />
WATER RESOURCE<br />
NOTES FROM THE PERSPECTIVE OF<br />
ISSUES<br />
THE NATIONAL RECREATION AREA<br />
1. Nutrient, Animal Waste,<br />
Chemical, and Landfill<br />
Issues<br />
Chemicals can affect fish PCBs and other chemicals contaminate fish flesh. Note that the<br />
Environmental Protection Division's fish consumption guidelines are<br />
available (discussed later in this report).<br />
Landfills can potentially Several landfills are in use. Monitoring of impacts from these areas is<br />
pollute the river<br />
Nutrients and animal wastes<br />
pollute streams<br />
Chemicals flowing into<br />
streams can harm aquatic<br />
ecosystems<br />
2. Sewer, Septic Tank, and<br />
Wastewater Release Issues<br />
Sewage overflows<br />
contaminate the river during<br />
storms<br />
desirable.<br />
Lawn fertilizers and domestic animal wastes run off into streams, and<br />
can cause eutrophication or contribute fecal coliforms to water (a hazard<br />
for fish and for water-contact recreation).<br />
Runoff in the area can include pesticides, metals, PCBs, detergents, and<br />
other chemical pollutants (all affecting the natural resource)<br />
Sewer lines overflow periodically during storms, releasing raw sewage,<br />
contaminating the river, streambank areas, and park units, exposing<br />
people to pathogens.<br />
Septic tanks can leak and Major subdivisions in some clayey soil areas rely on septic tanks, which<br />
40
elease pathogens or<br />
nutrients<br />
Lake Lanier could become<br />
more polluted<br />
Dams affect fishery<br />
resources*<br />
Wastewater releases may not<br />
be adequately treated;<br />
pathogens and chemicals can<br />
contaminate*<br />
3. <strong>Water</strong> Allocation and<br />
<strong>Water</strong> Supply Issues<br />
<strong>Water</strong> demands will continue<br />
to withdraw more river water<br />
Decision on tri-state water<br />
allocation formula (AL, FL,<br />
& GA) unresolved in 1999<br />
Large dams have major<br />
effect on the river flow,<br />
causing surges and posing<br />
danger*<br />
How well will the tri-state<br />
water allocation work?<br />
How well can CRNRA meet<br />
recreational water demands?<br />
What are the demands?<br />
Good model information also<br />
is needed on major<br />
tributaries (not just the<br />
river)*<br />
4. Sediment, Erosion, and<br />
Land-Use Issues<br />
Urbanization dumps<br />
sediment into streams*<br />
Sand and gravel mining<br />
along the river can cause<br />
disturbances<br />
Loss of riparian zones can<br />
affect water quality*<br />
can fail and potentially release pathogens, or can pollute ground water<br />
with nitrates or other chemicals.<br />
Housing and sewage disposal with septic tanks is increasing rapidly<br />
around Lake Lanier, and recreation on the lake is growing. Will this<br />
growth lead to changes in water quality that affect the river in the<br />
CRNRA?<br />
Dam releases from the lake’s hypolimnion lowers oxygen, changes<br />
temperature, releases metals, etc into the river, affecting the aquatic<br />
ecosystem and fisheries in the CRNRA.<br />
Within in CRNRA, many permits exist for <strong>National</strong> Pollutant Discharge<br />
Elimination System releases of treated wastewater (both municipal and<br />
industrial). An issue is how best to monitor these releases, to control<br />
pollution (what role can the park play in the monitoring?).<br />
<strong>Water</strong> consumption will increase in the park area, due to growth of<br />
population and industrialization. This could affect future river flows<br />
and water quality, affecting recreation.<br />
Decision on the water allocation can have major implications for<br />
recreation flows and for fisheries in the CRNRA reach of the river.<br />
Buford Dam largely determines the river’s flow patterns. How best to<br />
deal with the surges, to protect CRNRA users? Surges can affect<br />
streambank erosion and river channel stability.<br />
Once decisions are made on the tri-state water allocation, how well will<br />
the flows serve CRNRA's needs? What further study or monitoring will<br />
be needed? How will the formula decided upon be verified?<br />
Boating, floating, angling, swimming, nature enjoyment, etc attract<br />
millions of park users. Problems include the need to warn users about<br />
surges, contamination, and sewage spill areas. What monitoring and<br />
warning system is needed for all these concerns? What are the visitors’<br />
demands and needs? (information is limited and old at this time; some<br />
modeling underway, related to the tri-state effort).<br />
Some tributaries inside CRNRA (e.g., Big and Suwanee Creeks) are<br />
important in terms of flows and sediment loading in the park units.<br />
Housing, road, and commercial construction cause erosion and<br />
sedimentation problems, affecting stream ecosystems, recreational<br />
values, and water intakes.<br />
This mining can impact the aquatic habitat. Information on these<br />
impacts is limited and dated (about 1984).<br />
Development that reduces riparian zone protection can increase water<br />
temperature, decrease water quality in a stream, affecting aquatic<br />
ecosystems and impacting fish.<br />
41
Sediment cleaning can affect<br />
wetlands*<br />
5. Regulation and<br />
Monitoring Aspects<br />
Laws on watershed impacts<br />
and pollution are not always<br />
effective<br />
Permitting processes lack a<br />
definitive NPS role<br />
Some relevant watershed<br />
assessments and planning<br />
lack NPS involvement<br />
6. NPS Staffing and<br />
Volunteer Issues<br />
NPS needs better role in the<br />
volunteer monitoring efforts<br />
CRNRA --a “river park” -has<br />
had no staffing in water<br />
resources per se, so played<br />
only a very limited role in<br />
water issues on the river. A<br />
new post is to be filled in late<br />
1999.<br />
Cleaning of accumulated sediment in Morgan Falls Dam reservoir can<br />
disturb wetlands developed there.<br />
Laws on waste, spills, contamination, erosion, sediment, etc are complex<br />
and varied, involving state, county, federal, and other stakeholders.<br />
CRNRA’s role for influencing enforcement needs clarification and more<br />
testing.<br />
Ordinances and permit systems of the counties, towns, state, etc are not<br />
always effective. What role can NPS play to improve this situation<br />
where directly relevant to park units?<br />
Counties work with the state and consulting firms on watershed<br />
assessments. How can the NPS/CRNRA be better involved?<br />
Adopt-A-Stream and other volunteer efforts are active on several fronts<br />
(e.g., Gwinnett Cty, Riverkeeper). How can CRNRA play more of a role<br />
in these efforts and bring more focus to parklands?<br />
CRNRA has had only one general natural resource person on staff, plus<br />
temporary seasonals or interns, all stretched thin. Yet the park’s key<br />
resource is the river, and water resources. A position dedicated mainly<br />
to water resources would provide critical expertise needed to develop<br />
cooperative monitoring programs, lead volunteer efforts, prepare water<br />
proposals, liaison with EPD, USGS, etc, assemble basic reports, and<br />
build important databases in the park and with others.<br />
* Certain items in the table marked with asterisk (*) came primarily from notes of the 1993 EPD meeting coordinated<br />
by Law, Inc (Neal, 1994), described above. Some of the concepts were drawn from the list in EPD (1998a). Most<br />
comments came from the senior author.<br />
To further interpret the effects of the impacts or concerns above, the EPD (1998a) summarized<br />
the following general "effects":<br />
STRESSOR OR<br />
PROCESS<br />
CAN HAVE NEGATIVE EFFECT ON<br />
Metals Fish (can be toxic to fish, bad to consume)<br />
Fecal coliforms <strong>Water</strong> supplies; water recreation are degraded<br />
Higher temperatures Aquatic life (it lowers oxygen and increases toxicity)<br />
Lower oxygen Aquatic life and fish (will decrease biological diversity)<br />
Erosion/sedimentation Aquatic life; water supplies (requires more treatment);<br />
siltation<br />
Nutrients Aquatic life; water supplies (also eutrophication possible)<br />
Pavement runoff (oils, etc) Consumable fish affected; water supplies polluted<br />
Organics Consumable fish affected; water supplies polluted<br />
42
4. AN OVERVIEW OF WATER AND AQUATIC BIOLOGICAL<br />
RESOURCES<br />
4.1 INTRODUCTION<br />
This chapter provides an overview of the river and its flow characteristics, describing floods,<br />
droughts, and average discharges for the river and some of the tributaries. Discussions on river<br />
flow as related to fisheries, water supply, and recreation appear in Sections 4.5, 5.1, and 5.4,<br />
respectively.<br />
The greater Chattahoochee River Basin, from the northern edge of Georgia to its mouth, drains an<br />
area of 8,770 square miles over some 430 miles of river, and has an average discharge of 11,500<br />
cubic feet per second for the whole basin (Couch, 1993). The CRNRA portion of the<br />
Chattahoochee River covers river mile 348.3 at the Buford Dam down to about river mile 300.5,<br />
where Peachtree Creek enters the river (where mile zero is the mouth of the Chattahoochee<br />
River). The river drains about 416 square miles along this CRNRA reach.<br />
4.2 SURFACE HYDROLOGY<br />
Discharge Characteristics<br />
River discharge in the CRNRA fluctuates greatly, primarily due to two factors:<br />
• the release of water from Buford Dam, which causes distinct surges; and,<br />
• the normal rainfall within the CRNRA environs, and upstream.<br />
Buford Dam stands at the upstream boundary of the <strong>National</strong> Recreation Area (river mile 348.3),<br />
producing hydroelectric power by water releases from 38,542-acre Lake Lanier. The cycle of<br />
dam releases follows a fairly routine weekly schedule, with: (1) five weekdays of short periods of<br />
power generation followed by (2) two weekend days with little or no generation. Power usually is<br />
generated for several hours each weekday and infrequently on weekends.<br />
Superimposed on these daily and weekly cycles of river flow is an annual pattern of river flow,<br />
caused by Buford Dam's flood control as well as the normal seasonal patterns of precipitation<br />
(EPD, 1997b).<br />
River Surge Patterns<br />
On a typical, or fair-weather week day, Buford Dam controls the river flow pattern, producing the<br />
artificially-shaped, hydrograph surges or humps seen in the example of Figure 4.2.a (upper part)<br />
and Figure 4.2.b. On average days, the river discharges below the Buford Dam range from less<br />
than 700 (sometimes less than 500 cfs) up to more than 5,000 cubic feet per second (cfs). For<br />
example, during 1988 to 1997, the daily Buford Dam releases ranged from a minimum of 330 cfs<br />
up to about 10,000 cfs (Figure 4.2.a, lower graph). Note that the surges are most distinct<br />
upstream within the CRNRA and become less distinct in the downstream direction. Large storms<br />
mask the surges when runoff comes in from the tributaries within the Recreation Area's 48-mile<br />
reach.<br />
43
The surges appear to have a detrimental effect on the Chattahoochee River in the 20 miles below<br />
Buford Dam. Year by year the stretch of river above Highway 20 seems to be wider – tall dirt<br />
banks are exposed and tree fall is evident (pers. comm., F. Stephens, Gwinnett County, 2000).<br />
Many tributaries in this area are becoming gorges as they approach the main stem, apparently<br />
suffering from a backwater effect caused by the rapid rise and fall of the surges.<br />
During the periods of electricity generation and rising flows, signs, sirens, and other warnings<br />
alert fishermen and recreationists to the rapid stage rises, but only in the first two miles below the<br />
dam. Note that on weekends, the pattern normally changes. For example, the 26th and 2nd in<br />
Figure 4.2.a are Saturdays.<br />
Morgan Falls Dam<br />
A run-of-river dam -- the Morgan Falls Dam -- is found within the CRNRA at mile 312.6 on the<br />
river. This small dam backs up about 580 acres of water along the river, known as Bull Sluice<br />
Lake (Figure 2.2.b). The reservoir, dating from 1903, now has extensive sediment deposits,<br />
which reduces the dam's storage and ability to affect river flow.<br />
The "Key Flow" of 750 cfs<br />
The flow of 750 cfs is salient in all discussions of the river, since the operation of Buford Dam (in<br />
conjunction with Morgan Falls Dam) is required to produce this minimum flow downstream of<br />
the City of Atlanta's water intake at River Mile 299.6 (U.S. Army Corps of Engineers, 1998b).<br />
Other that the 750-cfs minimum, the dam managers “have the liberty to release water as needed<br />
to meet power demands” (Collier et al., 1996). However, demands for adequate recreational<br />
flows and other water needs continue to erode this "liberty," as discussed later in this report. Of<br />
course, the tributaries coming in between Buford Dam and Atlanta contribute to the necessary<br />
750-cfs minimum flow, especially during storm periods, and the Buford and Morgan Falls Dam<br />
operators can adjust their releases accordingly. Further discussion on effects of dams appears in<br />
Section 5.3, on the role of dams.<br />
Gaging Stations and Data in the CRNRA<br />
The U.S. Geological Survey operates a number of stream gages within the <strong>National</strong> Recreation<br />
Area's stretch of the Chattahoochee Basin. Figure 4.2.c. shows the gaging stations along the river<br />
and on some of the tributaries where a good database exists, or for stations that are still operating<br />
(; Law, 1994).<br />
Real Time or Historic Flows<br />
Details on all U.S. Geological Survey gaging stations and available data are found at<br />
under "Upper Chattahoochee River Basin." River discharge values are<br />
available online providing flows within about six hours of the present time under the "real time"<br />
category. Under the “historic” category, one can view and download summaries of past peak<br />
flows or average daily discharges either in tabular or graphic formats (tabular formats may be<br />
viewed in a spreadsheet). The main Chattahoochee River stations of interest to the CRNRA are<br />
those with recent data, especially long-term, and that are still in operation. In addition to the main<br />
stem, some tributaries have gages. The gaging stations of more interest are summarized in Table<br />
4.2.a. A complete list of stations along the river and for key tributaries within the CRNRA<br />
appears in Appendix D.<br />
44
Table 4.2.a. U.S. Geological Survey gaging stations with recent or longer records or stations<br />
still active within the CRNRA reach of the river (from<br />
< http://wwwga.usgs.gov >).<br />
Buford Dam<br />
(#02334430; 1971-<br />
97) RM 348.3<br />
Johnson Ferry<br />
Road (#02335830;<br />
1996-97)<br />
RM 310.5<br />
Suwanee Creek at US<br />
Rt 23 (#02334885;<br />
1984-1997)<br />
Sope Creek near<br />
Marietta (#02335870;<br />
1984-1997)<br />
River Average Flows<br />
Chattahoochee River Gage Sites<br />
Norcross (#02335000;<br />
1902-46; 1956-1997)<br />
RM 330.8<br />
Atlanta (just below the<br />
CRNRA) (#02336000;<br />
1928-31; 1936-1998)<br />
RM 300.5<br />
Tributary Gage Sites<br />
Crooked Creek near<br />
Norcross (#02335347;<br />
1987-97 --peak flows only)<br />
Rottenwood Creek<br />
(#02335915; 1963-77 --peak<br />
flows only)<br />
45<br />
Eves Road, by Roswell<br />
(#02335450; 1976-1996)<br />
RM 320.6<br />
(Station numbers and years of<br />
records shown in brackets. RM<br />
= river mile)<br />
Big Creek near<br />
Alpharetta (#02335700;<br />
1960-1997)<br />
(Station numbers and years<br />
of records shown in brackets)<br />
The river’s discharge follows yearly and seasonal patterns, as would be expected. These patterns<br />
are depicted in the graphs of Figures 4.2.a and d. As seen in Figure 4.2.a, drier years (e.g., 1988)<br />
have distinctly lower than average streamflows; whereas, wetter years (e.g., early 1993) produce<br />
numerous high flows two to three times higher than those of the dry years. Higher periods of<br />
flow follow seasonal patterns as well, for example, during the summer storm period (July being<br />
the wettest month -- Table 2.3). Dry spells and lower flows are likely in the autumn (Table 2.3).<br />
Long-term flow records are available within the CRNRA for the gaging sites shown in Table<br />
4.2.a and in Appendix D. For example, the Norcross gaging station has over 85 years of record<br />
(USGS Gaging Station # 02335000; RM 330.8). Over these 85 years (1903-46 and 1957-97), the<br />
average discharge at the Norcross station has been 2,289 cfs.<br />
The decade 1988 to 1997 is the most recent decade of record available online from the U.S.<br />
Geological Survey for the Buford Dam site, and during this last decade the flow at Buford Dam<br />
had a mean discharge of 2139 cfs and a median discharge of 1420 cfs. As shown in Figure 4.2.a,<br />
the daily variation of the dam releases is extreme, hence the mean and median values per se have<br />
limited meaning (< http://wwwga.usgs.gov > June, 1999).<br />
The outlet sluice at Buford Dam has a maximum capacity of 11,600 cfs, at an elevation of 1,085.<br />
However, if the capacity of the three turbines is added, the dam can release up to 22,600 cfs,<br />
without the emergency spillway (U.S. Army Corps of Engineers, 1998b).
River Peak Flows<br />
Prior to completion of the Buford Dam in 1957, major winter and early-spring floods were a<br />
common problem, and large floods of over 30,000 cfs occurred once or twice during most<br />
decades (Cherry et al., 1980; Collier et al., 1996). Extreme floods occurred at Atlanta in<br />
December, 1919 (peak of 63,000 cfs) and in January, 1946 (peak of 59,000 cfs). The latter would<br />
have been about 53,000 cfs at the upper end of the CRNRA (, June<br />
1999). Since the dam’s construction, flood peaks have been controlled, as shown graphically in<br />
the peaks of Figure 4.2.a (lower graph).<br />
Flood levels are seen in the frequency data of Figure 4.2.d (top), which shows flood frequency<br />
curves at Buford Dam and downstream points in the CRNRA. The Johnson Ferry Road Gaging<br />
Station (USGS #02335830; river mile 310.5) is the most downstream gage inside the Recreation<br />
Area. Annual peak discharges at this site during 1972 to 1997 ranged from 12,900 cfs (1974) to<br />
22,400 (1982), with a median peak discharge of 15,600 cfs (< http://wwwga.usgs.gov > June,<br />
1999).<br />
Closer to the middle of the Recreation Area, the Eves Road Gaging Station (USGS #02335450)<br />
has records from 1977-97, with a median peak annual discharge for the period of 10,600 cfs (<<br />
http://wwwga.usgs.gov > June, 1999).<br />
Peak discharges released from Buford Dam (at the upper end of the CRNRA) are much lower<br />
than those downstream near Atlanta. During the period 1971 to 1997, peak annual discharges<br />
coming from Buford Dam ranged from 8760 cfs (1973) to 12,100 cfs (1993), with a median peak<br />
annual discharge of 10,300 cfs (< http://wwwga.usgs.gov > June, 1999).<br />
During significant storm periods, runoff from within the CRNRA reach helps shape the river<br />
hydrograph, and the diurnal “hydrograph surges” of the dam releases are masked.<br />
The larger-scale map of Figure 1.1.c plus the companion maps of Appendix F show the 100-year<br />
floodplain lines for the individual park units (based on Federal Emergency <strong>Management</strong> Agency<br />
data). These maps are available at CRNRA in ArcView format; digital data on 500-year<br />
floodplains also are available.<br />
Low Flows and Droughts<br />
Drought years occur periodically (Figure 4.2.a lower part), and during dry times the river has<br />
difficulty meeting the municipal and other demands for water. With increased development and<br />
the associated growth in water demands, the area will become increasingly sensitive to droughts.<br />
Low flows present many serious problems, including: less recreational opportunities, degradation<br />
in water quality (e.g., higher temperature, lower oxygen), impacts on aquatic life, and a reduction<br />
in municipal and industrial water supplies. The problem of drought is a key factor in the ongoing<br />
question of water allocation among the states of Georgia, Florida, and Alabama. This tri-state<br />
allocation issue is discussed in Section 5.2.<br />
Much of the 1980s decade was drier than normal. For example, during 1980 to 1981 only 71<br />
percent of the normal rain fell at Atlanta, causing reductions in hydropower production and<br />
placing limits on water recreation and water use by cities (U.S. Army Corps of Engineers,<br />
1998b). Droughts hit hard again in 1986 and 1988 --which may be seen in the graph of Figure<br />
46
4.2.a (bottom). A low flow record was set on September 2, 1957, when the Chatthoochee River<br />
at Paces Ferry Bridge was flowing at only 296 cubic feet per second (Cherry et al., 1980).<br />
Minimum flows in the river passing through the CRNRA are artificially controlled by dam<br />
releases, since the Buford Dam must operate to maintain a minimum flow of 750 cfs for the<br />
intake of the City of Atlanta.<br />
Tributary Flows<br />
As Figures 2.2.a and b show, several of the tributaries within the CRNRA have large drainage<br />
areas and produce significant flows. The two largest tributaries (where streamflow data are<br />
available) are Big Creek and Suwanee Creek. The flow characteristics for these two largest<br />
tributaries are statistically summarized in Table 4.2.b.<br />
Table 4.2.b. An overview of the flow characteristics for the two largest tributaries in the<br />
CRNRA.<br />
Flow Characteristics Big Creek<br />
Suwanee Creek<br />
by Alpharetta<br />
at US Rt 23<br />
Gaging Station number<br />
(USGS)<br />
#02335700 #02334885<br />
<strong>Water</strong> years of the data used in<br />
this table<br />
1985-97 1985-97<br />
Drainage, sq miles, at the gage 72 sq mi 46.8 sq mi<br />
Daily mean Q (discharge) in<br />
cfs<br />
108 cfs 67 cfs<br />
Daily median Q, cfs 66 cfs 42 cfs<br />
Minimum daily mean Q, cfs 1.7 cfs 1 cfs<br />
Maximum daily mean Q, cfs 3,870 cfs 2,790 cfs<br />
5 highest peak flows in the 2,410 ('87); 5,820 ('90); 3,970 2,150 ('86); 3,760 ('90); 2,540<br />
period in cfs (with year)<br />
during period 85-97<br />
('93); 3,140 ('96); 2,760 ('97) ('92); 2,650 ('95); 4,350 ('95)<br />
Observations (n) in these data 4,748 4,747<br />
<strong>Water</strong> years available online<br />
for this station<br />
1960-1997 1984-1997<br />
4.3 HYDROGEOLOGY<br />
Aquifers in this area of the Piedmont Physiographic Province lie in the crystalline rocks that<br />
begin in the northern part of the Chattahoochee Basin and extend down to the Fall Line, at<br />
Columbus, GA. These rocks range in age from pre-Cambrian to the Triassic. These<br />
metamorphic and igneous crystalline rocks are overlain in places by pockets of regolith<br />
(weathered, unconsolidated rock debris). These shallow regolith pockets only go to about 100<br />
feet thick, mainly in draws or valleys (Couch et al., 1996). The Brevard fault zone --a major one<br />
in the area-- passes through the approximate center of the CRNRA, traversing in a NE-SW<br />
direction, approximately along the western edge of Gwinnett County. This Brevard lineament<br />
extends from near Montgomery, Alabama up to about Mount Airy, NC, and dates back 200<br />
47
million years (U.S. Army Corps of Engineers, 1987a). Numerous small faults also exist in the<br />
area (Cressler et al., 1983, p 14).<br />
According to ground-water studies in the area, good well yields are available where aquifers have<br />
localized increases in permeability in association with certain structural and stratigraphic features,<br />
e.g., in contact zones between different rocks, fault zones, fracture areas, folds, and other<br />
geologic areas of transition. For example, limited data indicate that wells may be more<br />
productive in the Brevard Zone (Cressler et al., 1983). Likewise, near the northern edge of the<br />
CRNRA, the City of Cumming’s well furnishes about 150 gallons per minute (gpm) in a contact<br />
zone where quartzite rocks abut schist. These contact zones are common in Forsyth County area,<br />
but become infrequent further south by Atlanta (Cressler et al., 1983).<br />
Ground water and wells also occur in small openings of the mantle rock and in the regolith<br />
mentioned above. The surficial mantle rock or regolith can absorb precipitation and feed water<br />
slowly into the joints, faults, and contact zones of the underlying bedrock (Carter and Herrick,<br />
1951; Couch et al., 1996). The yields of wells in regolith areas are commonly less than 50 gpm<br />
(Couch et al., 1996). Dug wells in the Atlanta area yield 2 to 5 gpm, and the average yield of<br />
better-drilled wells for municipal or industrial use is about 40 gpm. The average depth of drilled<br />
wells is from 200 to 500 feet, since water-bearing fractures of any importance in the Atlanta area<br />
are usually less than 250 feet in depth (Carter and Herrick, 1951; Chapman and Peck, 1997).<br />
<strong>Water</strong> tables in the area, as seen in the water levels in wells, rise and fall in response to the<br />
replenishment of the ground water. The main fluctuation is seasonal, but minor changes may<br />
occur in days, or even hours --rather than months. <strong>Water</strong>-table levels therefore fluctuate<br />
depending on climatic conditions, pumping, and the season. The water table in the area is<br />
generally highest during April and May, after the winter rains. It is lowest in October and<br />
November, because of the low rainfall of late summer and early autumn, and during hot weather,<br />
when most rain either evaporates or is consumed by vegetation (Carter and Herrick, 1951).<br />
4.4. A SYNOPSIS OF WATER QUALITY IN THE CRNRA<br />
This sub-section draws on available information to:<br />
• provide a synopsis of the water quality in the streams of the CRNRA and nearby;<br />
and,<br />
• review some spatial or temporal trends of water quality in the streams.<br />
Note that additional aspects of water pollution also are presented in Sections 6.1, 6.2, and 6.3.<br />
Historical Perspective on <strong>Water</strong> Quality and Pollution<br />
Some significant water pollution concerns exist in the CRNRA and surroundings today; however,<br />
today’s water pollution issues pale in comparison to those of a few decades ago. The Georgia<br />
EPD described Sope Creek in the 1960s as a “nuisance and health hazard,” and signs posted in<br />
1966 by Cobb County warned people to "not recreate" in the stream (EPD, 1982c). This sewage<br />
problem is basically resolved, but urbanization still impacts Sope Creek, with streambank erosion<br />
and siltation as major issues (Bourne, 1998). Suwanee Creek was at least as polluted in the<br />
1960s, and the creek was totally devoid of oxygen near Buford, accompanied by high coliform<br />
counts (PHS, 1962).<br />
48
In the 1960s, Rottenwood Creek was so contaminated that signs near the stream warned people of<br />
the "severely sewage-polluted waters." Detergent foam was a common sight at the time (EPD,<br />
1982b). Besides the health hazards, the aquatic biology of these streams was degraded; sludge<br />
worms (Tubifex spp) and other organisms that can tolerate de-oxygenated, turbid, warmer<br />
conditions dominated the biological community. By the late 1960s, the public insisted on action<br />
and during the 1970s and 1980s, the counties installed new wastewater treatment facilities and<br />
promoted more watershed protection. The streams’ water quality, aesthetics, and stream biology<br />
then began to improve, and a diversity of organisms started to return. At Rottenwood Creek, the<br />
wastewater discharges have been removed; however, sewer breaks and non-point contamination<br />
sources still degrade the stream (Bourne, 1998).<br />
Prior to the early 1970’s, fecal coliform concentrations in the river below Atlanta (at State Rd 92)<br />
were at extreme levels, frequently well over 100,000 per 100 ml--compared to the 200 per 100 ml<br />
standard (30-day geometric mean) set for recreation waters (EPD, 1998a).<br />
Overview of the Pollutants and Indicators<br />
<strong>Water</strong> quality parameters can detect pollution, land-use impacts, road development, failure of<br />
pollution enforcement, and many other actions taking place in a watershed. For example, stream<br />
sediment concentrations and turbidity levels directly reflect the erosion associated with<br />
subdivision development. Fecal coliforms, chlorides, and nitrates in a stream can indicate that<br />
sewer pipe or septic tank overflows are affecting the stream.<br />
The Georgia Environmental Protection Division provides a brief "Summary of Concerns" table<br />
for the CRNRA reach of the river (Buford Dam to Peachtree Creek) in its Chattahoochee River<br />
Basin <strong>Management</strong> <strong>Plan</strong> (EPD, 1998a). The plan noted the following concerns.<br />
• Metals: Some streams are high in lead, copper, zinc, or cadmium in areas of urban runoff.<br />
• Fecal Coliforms: These bacteria are high in many streams, due to urban runoff, sewer<br />
overflows, septic system seeps, and other non-point sources. Fecal coliforms can enter<br />
streams from sewer leaks in fair-weather flows, and can be flushed by surface runoff during<br />
storm periods. The fecal coliform bacteria also are derived from domestic animals, including<br />
pets.<br />
• <strong>Water</strong> Temperature: Urban runoff, the loss of riparian trees, and wastewater discharges all<br />
can affect water temperature. The higher temperatures reduce the oxygen saturation point -since<br />
warmer water holds less oxygen, producing a secondary effect on a stream's aquatic<br />
biology.<br />
• Dissolved Oxygen: Buford Dam releases water from the lake's bottom levels at times,<br />
which causes low dissolved oxygen in the river below.<br />
49
Discharge, cfs<br />
Day<br />
Year<br />
Figure 4.2.a. [Above]: Typical daily variation in discharge below Buford Dam, showing an<br />
example of the pattern of dam-caused surges. [Below]: Historical streamflow daily<br />
values for the Chattahoochee River near Norcross, located at about the middle of<br />
the Recreation Area.<br />
51<br />
(The 26 th = a Saturday)
Figure 4.2.b. Examples of surges in the river stage below Buford Dam at the Norcross and<br />
Atlanta gaging stations. At Atlanta the surges have basically disappeared, and the<br />
flow levels are a function of local storms, the releases from Morgan Falls Dam, and<br />
other factors.<br />
53<br />
(A river site near the<br />
middle of the<br />
Recreation Area)<br />
(A river site below the<br />
lower end of the<br />
Recreation Area)
Figure 4.2.d. Flood frequency levels (above) for a 2-year up to a 500-year storm at the upper end<br />
of the CRNRA (Buford Dam), for two points within the Recreation Area (Norcross<br />
and Roswell), and for a point near Atlanta (Vinings). Example of river discharge<br />
patterns, showing a late-summer storm season followed by a drier autumn (below).<br />
Information from the U.S. Corps of Engineers (above) and the U.S. Geological<br />
Survey (below).<br />
56
• Erosion/Sedimentation: Urban runoff, road construction, and other development often<br />
produce high sediment and turbidity levels in streams in the CRNRA.<br />
• Chemical Accumulation: Mercury, PCBs, and chlordane are found in area fish.<br />
Mikalsen (1989) provided an overview of the water quality setting in urban areas of Georgia, and<br />
noted some additional concerns, as follows:<br />
• Nutrients: Nutrients (e.g., nitrates, phosphates) and organic loads flush in from fertilized<br />
lawns, domestic animal waste sources, and exposed soils at construction sites or roads.<br />
• Nutrients plus Heat: The combination of higher nutrients and warmer waters washing into<br />
streams favors aquatic species that are tolerant of low oxygen, thereby decreasing aquatic<br />
species diversity. The “clean water species” such as mayflies and stoneflies, then become<br />
scarce or absent.<br />
• Pavement plus Chemical Effects: Runoff from pavement and traffic areas can raise the<br />
levels of calcium, heavy metals, and petrochemical compounds in streams.<br />
• Organics: Exotic chemicals, including pesticides and herbicides, wash into urban streams.<br />
The State EPD concluded, “urban runoff is the most commonly assessed cause of water pollution<br />
in the (CRNRA) area” (EPD, 1998a).<br />
Some Sources of Information on <strong>Water</strong> Quality<br />
Having some water quality data is basic for confronting pollution issues. Fortunately for the<br />
CRNRA, water quality information is available for the area. The following bullets list principal<br />
sources of information in the area.<br />
• EPD Information: The Georgia Environmental Protection Division (EPD) collects<br />
routine water quality baseline and trend data, to document conditions, study impacts,<br />
observe trends, support enforcement, establish wasteload allocations, verify<br />
compliance, document problems, and develop "total maximum daily load" (TMDL)<br />
levels (EPD, 1998a). The EPD also enters some data into the U.S. Environmental<br />
Protection Agency’s STORET data bank. The EPD develops water quality indices<br />
and standards, and produces biennial reports on the water quality of streams in their<br />
305(b) reports to the U.S. Environmental Protection Agency. Within the CRNRA,<br />
six trend monitoring station were sampled in 1990 to 1995. A number of tributaries<br />
also were sampled for metals (Pb, Cu, Zn, and Cd) and for fecal coliforms (EPD,<br />
1998).<br />
• Atlanta Regional Commission Information: The Atlanta Regional Commission<br />
collects and disseminates information on water supplies and watershed management,<br />
and sponsors studies and other activities to assemble information on water resources.<br />
ARC’s water-related activities and resources can be found at: ><br />
http://www.atlantaregional.com >.<br />
• U.S. Geological Survey Data: The U.S. Geological Survey carried out a <strong>National</strong><br />
<strong>Water</strong> Quality Assessment Program (NAWQA) in parts of the CRNRA in the mid-<br />
57
90s. Information was gathered on fish, water quality, and pesticides in a few<br />
streams of the Recreation Area (Between March 1993 and April 1994, the USGS<br />
conducted a special study on pesticides in Sope Creek (EPD, 1998a). The USGS<br />
maintains other basic information in their databases for the area, and they cooperate<br />
with the CRNRA in providing information. The USGS has a new microbial<br />
monitoring project underway, in cooperation with the CRNRA. Fresh data are<br />
accessible at: < http://ga.water.usgs.gov >.<br />
• County Information: The counties play a growing role in monitoring water<br />
quality and aquatic biology via programs established under State/Federal funding<br />
that are intended to help ensure compliance with the <strong>National</strong> Pollution Discharge<br />
Elimination System (NPDES). Some county monitoring programs began over a<br />
decade ago. Some specialized studies assemble existing water quality into plans or<br />
analyses for the counties<br />
• Information from Private Organizations: Volunteers working within private<br />
organizations collect water quality data under the umbrella of the State’s Adopt-A-<br />
Stream program and under other programs. Private conservation groups may use<br />
water quality or NPDES data to observe or identify polluters. The Upper<br />
Chattahoochee Riverkeeper also displays data from its effort on its web site at: <<br />
http://www.streamdata.org >.<br />
• Municipal Information: Some municipalities also collect water quality data for<br />
their needs (e.g., Alpharetta, mainly on Big Creek, is especially active).<br />
• <strong>National</strong> <strong>Park</strong> <strong>Service</strong>: The NPS’s <strong>Water</strong> <strong>Resources</strong> Division has plans to retrieve<br />
STORET data for the area and summarize it for the park (in the near future).<br />
• Private Firm Information: Consulting firms serve the State, counties, ARC, or<br />
others to carry out water quality investigations and model testing.<br />
<strong>Water</strong> Quality Classifications and Standards<br />
Georgia’s water use classifications and standards were first established by the Georgia <strong>Water</strong><br />
Quality Control Board in 1966 and applied to interstate waters by the EPD in 1972 (Appendix C).<br />
Table 4.4.a summarizes the main water use classifications and water quality standards for certain<br />
uses.<br />
Table 4.4.a. <strong>Water</strong>-use classifications and water quality standards for certain uses (EPD,<br />
1998a). Also note Table 6.1.b’s explanation of the fecal coliform standard.<br />
Use<br />
Classification 3<br />
Drinking <strong>Water</strong><br />
requiring<br />
treatment<br />
Fecal Coliform Bacteria 1<br />
30-Day<br />
Geometric<br />
Mean 4<br />
(MPN/100 ml)<br />
1,000 (Nov-<br />
April)<br />
200 (May-<br />
Maximum<br />
(MPN/<br />
100 ml)<br />
4,000 (Nov-<br />
April)<br />
Dissolved Oxygen<br />
(see note below 2 )<br />
Daily Min<br />
Average (mg/l)<br />
(mg/l)<br />
58<br />
pH<br />
Std.<br />
Units<br />
5.0 4.0 6.0-<br />
8.5<br />
Temperature<br />
(see note below 2 )<br />
Maximum Maximum<br />
Rise<br />
(F) (F)<br />
5 90
October)<br />
Recreation 200 (Freshwater) — 5.0 4.0 6.0-<br />
Fishing 1,000 (Nov-<br />
April)<br />
200 (May-<br />
October)<br />
4,000 (Nov-<br />
April)<br />
59<br />
8.5<br />
5.0 4.0 6.0-<br />
8.5<br />
5 90<br />
5 90<br />
1. For all uses, the standard, if water quality and sanitary studies show fecal coliform levels from non-<br />
human sources occasionally exceed 200 MPN/100 ml, is as follows: 300 in lakes and reservoirs<br />
and 500 in free-flowing freshwater streams.<br />
2. Note: Trout streams should have an average of 6.0 mg/l and a minimum of 5.0 mg/l dissolved<br />
oxygen. Secondary trout streams (as at CRNRA) should not have more than a 2-degree F<br />
temperature change.<br />
3. Scenic Rivers should have “no alteration of natural water quality.”<br />
4. Geometric means for a site should be based on at least four samples over 30 days at intervals not less<br />
than 24 hours. The geometric mean is “the nth root of their product” (e.g., the geometric mean of<br />
2 and 18 is the square root of 36). However, Table 6.1.b describes why a geometric mean is not<br />
always applicable.<br />
Narrative water quality standards listed in Table 4.4.b also are important in the CRNRA stretch of<br />
the river.<br />
These visual criteria are exceeded periodically in the CRNRA stretch of the river or tributaries,<br />
for example, when runoff from new construction sites causes excessive turbidity or when sewers<br />
leak raw sewage and pathogens to streams and onto surfaces in the park units<br />
Table 4.4.b. General criteria for all waters (from EPD, 1998a).<br />
General criteria for all waters. The following criteria are deemed to be necessary and<br />
applicable to all waters of the State:<br />
• All waters shall be free from materials associated with municipal or domestic<br />
sewage, industrial waste or any other waste which will settle to form sludge<br />
deposits that become putrescent, unsightly or otherwise objectionable.<br />
• All waters shall be free from oil, scum and floating debris associated with<br />
municipal or domestic sewage, industrial waste or other discharges in amounts<br />
sufficient to be unsightly or to interfere with legitimate water uses.<br />
• All waters shall be free from material related to municipal, industrial or other<br />
discharges that produce turbidity, color, odor or other objectionable conditions that<br />
interfere with legitimate water uses.<br />
• All waters shall be free from toxic, corrosive, acidic and caustic substances<br />
discharged from municipalities, industries or other sources, such as nonpoint<br />
sources, in amounts, concentrations or combinations which are harmful to humans,<br />
animals or aquatic life.<br />
• All waters shall be free from turbidity that results in a substantial visual<br />
contrast in a water body due to man-made activity. The upstream appearance<br />
of a body of water shall be observed at a point immediately upstream of a<br />
turbidity-causing man-made activity. The upstream appearance shall be<br />
compared to a point that is located sufficiently downstream from the activity
so as to provide an appropriate mixing zone. For land disturbing activities,<br />
proper design, installation and maintenance of best management practices and<br />
compliance with issued permits shall constitute compliance with this<br />
Paragraph.<br />
Detailed water quality standards for toxic substances are provided by the State in Georgia Rules<br />
and Regulations for <strong>Water</strong> Quality Control, Chapter 391-3-6-.03, <strong>Water</strong> Use Classifications and<br />
<strong>Water</strong> Quality Standards. The following groups of constituents are included in these standards<br />
(details are given in Appendix C):<br />
• Metals and other inorganics: including arsenic, cadmium, chromium, copper, cyanide,<br />
lead, nickel, silver, and zinc;<br />
• The 94 constituents listed by the U.S. Environmental Protection Agency as “toxic priority<br />
pollutants.” These are largely organics, for example, chlordane, the PCBs, phenol, vinyl<br />
chloride, etc;<br />
• Pesticides and herbicides, such as 2,4,5-T, dieldrin, endrin, lindane, etc; and,<br />
• Since the toxicity of many constituents also is a function of hardness of the water, for<br />
many substances standards are given for different levels of hardness.<br />
Primary drinking water regulations are presented in Appendix C.<br />
Patterns of <strong>Water</strong> Quality at the CRNRA<br />
The State’s Environmental Protection Division (EPD) submits a report to the U.S. Environmental<br />
Protection Agency every 2 years, entitled <strong>Water</strong> Quality in Georgia --often referred to as the<br />
“Georgia 305(b) Report,” since it responds to this section of the Clean <strong>Water</strong> Act (EPD, 1998b).<br />
This 305(b) report provides lists of waters which do not "support" or only "partially support" their<br />
designated uses of fishing, recreation, drinking, or other uses (EPD, 2000).<br />
Table 4.4.c abstracts information from recent EPD "305(b)" reports, to summarize the river<br />
reaches and streams in the CRNRA not supporting their designated uses or only partially<br />
supporting their designated uses. <strong>Water</strong> pollution problems are found in many reaches of the<br />
river and most tributaries. The waters of the Chattahoochee River Basin, within the area of the<br />
CRNRA, are classified by the State as suitable for “drinking water, recreation, and fishing”<br />
(EPD, 1998a).<br />
Table 4.4.c. Streams within the CRNRA "not supporting" their designated uses (N) or "only<br />
partially supporting" their designated uses (P), according to recent reports by the<br />
State’s Environmental Protection Division (EPD).<br />
Location Use<br />
Classification<br />
Chat. River, below Buford Recreation &<br />
Dam to Hwy 20<br />
drinking water<br />
Chat. River Hwy 20 to I- Recreation &<br />
285<br />
drinking water<br />
Chat. River I-285 to Recreation &<br />
Peachtree Creek<br />
drinking water<br />
Criterion<br />
Violated<br />
Notes & Comments Refs *<br />
DO, FCG (3 miles) Dam releases causing low 96-7 (N);<br />
DO, with biological impacts 00 (N)<br />
FC, FCG (39 miles) Urban runoff effects:fish<br />
consumption guideline due to PCB<br />
00 (P)<br />
FC, FCG (6 miles) Urban runoff effects 96-7 (N);<br />
00 (N)<br />
60
Ball Mill Creek<br />
Fishing FC (3 miles) Urban runoff effects 96-7 (N);<br />
Fulton/DeKalb Counties<br />
00 (N)<br />
Big Creek<br />
Fishing & drinking FC (5 miles) Urban runoff effects 96-7 (P)<br />
Fulton County<br />
water<br />
Crooked Creek, Gwinnett Fishing FC (2 miles) Urban runoff effects 96-7 (N);<br />
County<br />
00 (N)<br />
James Creek,<br />
Fishing FC (2 miles) Non-point runoff. 96-7 (N)<br />
Forsyth County<br />
<strong>Water</strong>shed protection needed.<br />
Johns Creek,<br />
Fishing FC (4 miles) Urban runoff effects 96-7 (N);<br />
Fulton County<br />
00 (N)<br />
Level Creek,<br />
Fishing FC ( 5 miles) Urban runoff effects 96-7 (N);<br />
Gwinnett County<br />
00 (N)<br />
Long Island Creek Fishing FC (5 miles) Urban runoff effects 96-7 (N)’<br />
Fulton County<br />
00 (N)<br />
March Creek<br />
Fishing FC (4 miles) Urban runoff effects 96-7 (N);<br />
Fulton County<br />
00 (N)<br />
Hog Waller Creek (into Big<br />
Creek, Roswell)<br />
Fishing FC (4 miles) Urban runoff effects 00 (P)<br />
Richland Creek<br />
Fishing FC (5 miles) Urban runoff effects 96-7 (N);<br />
Gwinnett County<br />
00 (N)<br />
Rottenwood Creek Fishing FC, Pb (9 miles) Urban runoff effects 96-7 (N);<br />
Cobb County<br />
00 (N)<br />
Sope Creek<br />
Fishing FC, Pb (11 miles) Urban runoff effects 96-7 (N);<br />
Cobb County<br />
00 (N)<br />
Sope Creek, a tributary to,<br />
Cobb County<br />
Fishing Cd, Cu, Pb (1 mile) Urban runoff effects 00 (P)<br />
Suwanee Creek<br />
Fishing FC (4 miles) Non-point and urban 96-7 (N);<br />
Gwinnett County<br />
runoff<br />
00 (N)<br />
Willeo Creek<br />
Fishing FC, Pb (5 miles) Urban runoff effects 96-7 (N);<br />
Cobb/Fulton Counties<br />
00 (N)<br />
* References are: “96-7” = EPD, 1998b: “00” = EPD, 2000; N = not supporting designated uses; P = partially<br />
supporting designated uses; FC = fecal coliforms; DO = dissolved oxygen; FCG = fish consumption guidelines.<br />
An Overview of Some Common Indicators<br />
Certain water quality constituents work well as indicators of pollution. For example, turbidity<br />
can spot the impacts of erosion by development; coliforms can detect sewage. This sub-section<br />
highlights some of these common indicators and describes what they reveal in the CRNRA.<br />
Fecal Coliforms in the CRNRA<br />
An elevated fecal coliform (FC) bacteria count is one of the most commonly listed causes of<br />
"non-support" of designated uses (exceeding the water quality standards) in the Atlanta area<br />
(EPD, 1998). Actually, Escherichia coli and enterococci are the preferred fecal indicators for<br />
recreational freshwaters, and viewed as superior to fecal coliforms and fecal streptococci as<br />
predictors of swimming-associated gastroenteritis. However, fecal coliforms are still used in<br />
Georgia (and elsewhere) to monitor recreational waters, and most bacterial data within the<br />
CRNRA are for fecal coliform counts (USGS, 1999). Human wastes can be a source of all these<br />
enteric bacteria or bacterial groups; therefore, high fecal coliform counts are a cause for concern<br />
and an indication of possible fecal contamination.<br />
Highest FC Levels Are found in the Downstream Direction<br />
The fecal coliform (FC) counts in the river within the CRNRA generally are acceptable for<br />
fishing, but most often only marginally acceptable or unacceptable for recreation (i.e.,<br />
61
swimming). Urban runoff, treatment plant malfunctions and sewer overflows can produce<br />
occasional spikes of very high FC values. Some examples of FC counts along the river during<br />
1995 are listed in Table 4.4.d-part 1. The table shows that the water flowing in from Buford Dam<br />
meets the 200 fecal coliform per 100 ml water recreation standard (30-day geometric mean) on a<br />
steady basis. However, as one progresses downstream, the percentage of samples showing a<br />
desirable ‘less than 200 MPN (most probable number) of FC/100 ml’ declines. In summary, the<br />
water is acceptable essentially 100 percent of the time at the dam; however, in the lower quarter<br />
of the CRNRA water was in violation of the standard 100 percent of the time.<br />
Note that the Table 4.4.d. FC values for the river can be compared to those of Table 4.4.c, which<br />
indicates the river segments and the tributaries that "did not support recreation," because of<br />
elevated FC levels.<br />
Table 4.4.d-part 1. Patterns of fecal coliform counts along the river in the CRNRA (from<br />
EPD, 1995b).<br />
Station on the River Period & No. of<br />
Samples<br />
Pattern of FC counts seen (MPN per 100 ml)<br />
Buford Dam May-Oct, 1995 “100 %”<br />
(CR0015)<br />
(28 samples with 5 of 5 sample series meet the 200 MPN/100 ml (30-day<br />
5-sample series<br />
for the geometric<br />
mean)<br />
geometric mean) recreation standard; 1 sample at 2,000.<br />
McGinnis Ferry Rd May-Oct, 1995 “83%”<br />
(CR0100)<br />
(32 samples with 5 of the 6 sample series under the 200 FC/100 ml (30-day<br />
6 sample series geometric mean) recreation standard; 4 samples at 200-1000; 2<br />
for geometric<br />
mean)<br />
at over 1000.<br />
Medlock Bridge Rd May-Oct, 1995 “50%"<br />
(CR0130)<br />
(28 samples with 3 of the 6 sample series meet the 200 FC/100 ml (30-day<br />
6 sample series) geometric mean) recreation standard; 7 samples at 200-1000; 3<br />
samples over 1000 (1 sample was 14,000).<br />
Holcomb Bridge Rd May-Oct, 1995 “33%”<br />
(CR0160)<br />
(28 samples with 2 of the 6 sample series meet the 200 FC/100 ml (30-day<br />
6 sample series) geometric mean) recreation standard; 5 samples at 200-1000; 4<br />
samples over 1000.<br />
Eves Road<br />
May-Oct 1995 “33%”<br />
(CR0210)<br />
(24 samples with 2 of the 6 sample series meet the 200 FC/100 ml (30-day<br />
6 sample series) geometric mean) recreation standard; 12 samples at 200-1000; 3<br />
samples over 1000 (1 at 54,000).<br />
Morgan Falls Dam May-Oct 1995 “0%”<br />
(CR0320)<br />
(28 samples with 0 of the 6 sample series meet the 200 FC/100 ml (30-day<br />
6 sample series) geometric mean) recreation standard; 12 samples at 200-1000; 8<br />
samples over 1000.<br />
Paces Ferry Rd May-Oct 1995 “0%”<br />
(CR0400)<br />
(29 samples with 0 of the 6 sample series meet the 200 FC/100 ml (30-day<br />
6 sample series)) geometric mean) recreation standard; 5 samples over 1000.<br />
Distinctly higher fecal coliform values in the downstream direction on the river also are seen in<br />
Figure 4.4.a for 1993 to 1995 data. The same downstream direction increase is illustrated in<br />
Figure 4.4.c, which compares a decade of data between the Gwinnett County water intake site and<br />
the Cobb County intake --the latter being further downstream. The data in these two figures<br />
62
agree with the data of Table 4.4.d (part 1); fecal coliforms are higher in the lower end of the river<br />
within the CRNRA.<br />
The USGS and NPS collected microbial data at a few points in the CRNRA in 1999. These<br />
recent fecal coliform readings (in Table 4.4.d-part 2) were at different sites on the river from<br />
Table 4.4.d-part 1. Nonetheless, the data show a similar trend to the 1995 observations of Table<br />
4.4.d-part 1.<br />
Table 4.4.d-part 2. Patterns of fecal coliform counts at some points along the river in the<br />
CRNRA (from: > http://ga.water.usgs.gov/projects/chatm > November,<br />
1999).<br />
Station on the<br />
River<br />
Settles Bridge<br />
(between Level &<br />
James Creeks)<br />
(RM 343.6)<br />
Johnson Ferry Rd<br />
(RM 310.5)<br />
Atlanta<br />
(RM 303.0)<br />
Period & No. of<br />
Samples<br />
May-Oct, 1999<br />
(32 samples with<br />
8, 4-sample<br />
series for<br />
geometric mean)<br />
May-Oct, 1999<br />
(32 samples with<br />
8, 4-sample<br />
series)<br />
May-Oct, 1999<br />
(32 samples with<br />
8, 4-sample<br />
series)<br />
Fecal Coliform Time Trend<br />
Pattern of FC counts seen in 1999<br />
(FC per 100 ml)<br />
“100%”<br />
8 of the 8 sample series) meet the 200 FC/100 ml (30-day<br />
geometric mean) recreation standard at this upstream site. Only<br />
1 sample is > 1000 FC/100 ml.<br />
“63%”<br />
5 of the 8 sample series meet the 200 FC/100 ml (30-day<br />
geometric mean) recreation standard; 3 samples are > 1000; 2<br />
samples are greater than or equal to 10,000.<br />
“38%”<br />
Only 3 of the 8 sample series meet the 200 FC/100 ml (30-day<br />
geometric mean) recreation standard at this downstream site; 6<br />
samples are > 1000; 2 samples are > 10,000.<br />
Review of the fecal coliform data for 1986 to 1995 in Figure 4.4.f and in Figures E.a and E.c<br />
(Appendix E) shows large variation from year to year, where certain years have distinctly higher<br />
FC mean and medians. However, no distinct trend upward or downward is seen over the 1986 to<br />
1995 period.<br />
Fecal Coliforms in the Tributaries<br />
As shown in the recent State EPD data in Table 4.4.c, every tributary in the CRNRA has some<br />
elevated fecal coliform levels; therefore, basically all tributaries fail to support their intended uses<br />
at times. Raised FC levels also are illustrated in the EPD tributary data of Figure 4.4.h.<br />
Some Ongoing Fecal Coliform Research in the CRNRA<br />
In 1999, the U.S. Geological Survey began research on fecal coliforms and related substances and<br />
microbes in the Atlanta area, including the CRNRA. This 2-year project is investigating the<br />
existence, severity, and extent of microbial contamination in the river and eight major tributaries<br />
within the CRNRA. The study is providing a watershed-based assessment that could provide a<br />
focus for future coordinated monitoring and protection efforts within the CRNRA. The research<br />
also is testing methods to help determine the correlation between indicator-bacteria levels and the<br />
63
waterborne pathogens that pose human-health risks to water recreationists. Sampling of<br />
"chemical sewage tracers" along with the bacteria will enable better definitions of point and<br />
nonpoint sources of microbial contamination in the area (USGS, 1999). An abstract of this work<br />
is given in Appendix A. In FY2000, a microbial source tracking project will be added on to the<br />
aforementioned project. This joint U.S. Geological Survey and NPS project will cooperate with a<br />
contract lab to use genetic analysis of ribosomal fingerprints (ribotyping) to match E. coli in<br />
water samples to E. coli strains from fecal samples in the watershed (See Appendix A).<br />
Suspended Sediment and Turbidity<br />
Elevated turbidity and sediment levels in streams during storms are common throughout the<br />
CRNRA. This problem comes mainly from the impact of construction and development, where<br />
soils and riparian zones are disturbed. Sediment and turbidity (turbidity is the visual indicator of<br />
suspended sediment in water) alter habitat, harm aquatic life, and impair recreational and drinking<br />
water quality. Sediment particles also can carry nutrients, pesticides, metals, and other chemicals<br />
into streams (EPD, 1998a).<br />
The U.S. Geological Survey observed maximum sediment levels in Atlanta-area streams, mainly<br />
in the 1960s-70s. Their findings are summarized in Table 4.4.e (Perlman, 1985). Sediment<br />
concentrations are directly related to runoff, since extra runoff velocity provides the energy to<br />
erode soil particles and to transport sediment. Therefore, these studies compared peak runoff and<br />
sediment values.<br />
Table 4.4.e. U.S. Geological Survey recorded maximum discharge and sediment levels<br />
found in Atlanta-area streams for a 20-year period (after Perlman, 1985).<br />
Site Max Discharge Max Sediment<br />
cfs<br />
mg/L<br />
Chattahoochee River at Buford(1961-76) 1,700 195<br />
Big Creek at Alpharetta (1975-76)<br />
Chattahoochee River at Atlanta (1957-78)<br />
S. Fork Peachtree Creek near Atlanta<br />
(1976-77)<br />
64<br />
2,620<br />
17,600<br />
2,380<br />
881<br />
2,610<br />
2,900<br />
The less disturbed areas in the river, near Lake Lanier (the upper row in Table 4.4.e) showed<br />
lower maximum sediment yields than the more disturbed sites further downstream. The Peachtree<br />
Creek site, just below the CRNRA, had the highest sediment for its discharge, presumably<br />
reflecting the heavy development impacts of the time in that watershed.<br />
Faye et al. (1980) also quantified the sediment/discharge relationship in the river. For the<br />
Chattahoochee River at Atlanta, their data showed the general relationship between sediment and<br />
discharge to be logarithmic, as shown in the Table 4.4.f.
The 1993 to 1995 sediment/turbidity data (Figure 4.4.b) agree with the data in Table 4.4.e,<br />
namely, that river sediment and turbidity levels generally increase in the downstream direction<br />
within the CRNRA.<br />
Sediment and turbidity data for the tributaries appear in Figure 4.4.i. Comparing the tributary bar<br />
graphs of Figure 4.4.i to the river data of Figure 4.4.b confirms that most tributaries have<br />
sediment/turbidity values higher than most sites in the river. This is logical, given that tributaries<br />
typically are closer to erosion sources and also lack the greater dilution factor of the river.<br />
Table 4.4.f. Sediment/discharge relationship (approximate values based only on graphs) in<br />
the Chattahoochee River at Atlanta (from Faye et al., 1980).<br />
Dissolved Oxygen<br />
Discharge, cfs Suspended Sediment, mg/l<br />
1,000<br />
70<br />
5,000 600<br />
8,000 1000<br />
(based on late spring to summer data, 1976, n = 28).<br />
Dissolved oxygen (DO) is critical for aquatic life. The State standards for minimum oxygen<br />
levels are shown in Table 4.4.a.<br />
Problems with oxygen depletion in the river or tributaries of the CRNRA are associated with: (1)<br />
oxygen-demanding wastes from point and non-point pollutant sources, and (2) the release of<br />
water from the Buford Dam (where oxygen-depleted bottom water is released at times).<br />
Historically, the greatest threat to maintaining DO levels has been the impact of organic wastes<br />
from wastewater treatment plants; however, treatment plant upgrades over recent decades have<br />
been reducing this threat (EPD, 1998a).<br />
Unlike fecal coliform levels, the dissolved oxygen (DO) concentrations along the river generally<br />
are good or very good, with DO levels generally well above the minimum 6.0 ml/L DO daily<br />
average desired for trout waters (Table 4.4.a). The river site just below Buford Dam has lower<br />
DO levels, reflecting the effects of the dam. DO concentrations over the 1986 to 1995 period<br />
were good at all three, river water-intake sites and along the river, as shown in Figures 4.4.a and<br />
c. Dissolved oxygen levels stayed at >80 percent saturation generally, without much annual<br />
variation, as displayed in Figures 4.4.g and in Figures E.a and E.c (Appendix E).<br />
The effect of upgrading sewage treatment plants in the last two decades is seen in the<br />
improvement of the dissolved oxygen (DO) levels in the river:<br />
• In the late 60s-early 70s, dissolved oxygen concentrations in the river below Atlanta<br />
were most commonly around 4 to 5 mg/l, and readings of zero were not unusual.<br />
• Improvements in DO became significant by the mid 70s, and have continued.<br />
65
• During the 90s, the DO levels below Atlanta have usually been 8 to 9 mg/l or more,<br />
and rarely below 7.5 mg/l -- with basically no zero occurrences (EPD, 1998a).<br />
Dissolved oxygen in the tributaries also is very good, as shown in the 1993 to 1995 data in the bar<br />
graphs of Figure 4.4.h, and compared to the desired standard of 4.0 mg/L DO. [These findings<br />
were consistent with other suburban sites that the USGS studied, as part of its <strong>National</strong> <strong>Water</strong><br />
Quality Assessment (NAWQA)]. Seasonal depletion of dissolved oxygen below Buford Dam<br />
continues to be a problem in the late summer and fall, which comes in conjunction with raised<br />
levels of manganese and iron as well. This point is discussed further in Section 5.3.<br />
Nutrients in the River<br />
Urban development significantly affects nutrient concentrations in the Chattahoochee River<br />
basin. Stream nutrients in the CRNRA can come from wastewater treatment facilities as well as<br />
from urban runoff. Fertilizer inputs in the Atlanta area come primarily from applications to<br />
lawns, golf courses, and parks in the residential and commercial areas (Peters et al., 1997; Frick,<br />
et al., 1996).<br />
Levels of nitrate in the waters of the river are relatively low, and far below the 10 mg/L<br />
recommended for drinking water (WHO, 1984). Levels of phosphorus are not a health concern;<br />
however, even small amounts of phosphorus can encourage eutrophication and algal blooms. The<br />
nutrient which is in the shortest supply relative to plant demands is usually phosphorus; therefore,<br />
control of nutrient loading to reduce eutrophication focuses on phosphorus control (EPD, 1998a).<br />
Decay of dead algae can deplete oxygen from the water and kill fish. Nitrogen is a concern when<br />
it is in the ammonium (NH4+) form, which can be toxic to aquatic life. Phosphorus is a concern<br />
from the perspective of causing algal blooms, scum, fish impacts and other eutrophication<br />
problems (EPD, 1998a).<br />
Within the CRNRA reach of the river, nitrate/nitrite as well as phosphorus concentrations<br />
increase slightly in the downstream direction, presumably as urban runoff and population density<br />
increase (Table 4.4.g; Figure 4.4.e).<br />
Total phosphorus loads (and to a lesser extent ammonium nitrogen) have generally decreased<br />
along the main stem of the river in the metro area during the 1990s. These reductions are<br />
probably because of improvements in several wastewater treatment facilities in the late 1980s and<br />
due to the initiation of a statewide phosphate detergent ban in 1990. (Peters et al., 1997; Frick et<br />
al., 1996). Figure 4.4.d. compares the upstream (Gwinnett), middle (DeKalb), and downstream<br />
(Cobb) sampling sites for nutrient levels. The decline in ammonia levels over recent decades is<br />
evident in Figure 4.4.d.<br />
The lower ammonium but higher nitrate concentrations (Figure 4.4.g) are probably due to: (1)<br />
increased runoff from developed areas that have fertilizer use; and (2) the conversion of<br />
ammonium to nitrate at newer, better treatment plants (EPD, 1998a; Peters et al., 1997;<br />
Wangsness et al., 1994).<br />
In summary, Frick et al. (1996) point out that the conversion from larger ammonium loads to<br />
larger nitrate loads in the Chattahoochee shows the effectiveness of major improvements in<br />
wastewater treatment in the 1980s. Reducing ammonium loads reduces the threat of toxicity to<br />
fish. The conversion also helps decrease the potential for eutrophication, since nitrate is more<br />
readily denitrified (and released into the atmosphere as gas) than ammonium (Frick et al., 1996).<br />
However, increased urban runoff contributions, as development increases, can increase<br />
66
nitrite/nitrate loading into streams, which affect aquatic biology (EPD, 1998a; DeVivo et al.,<br />
1997).<br />
Table 4.4.g. Nitrate+nitrite and total phosphorus observations in the Chattahoochee River of<br />
the CRNRA (from EPD, 1995b).<br />
Site (May-Oct, 1995) Nitrate + Nitrite<br />
(n = 35)<br />
Buford Dam Tailwater min = .22; max = .50;<br />
(upper end of CRNRA)<br />
(most samples 0.3-0.4 range)<br />
Paces Ferry Road min = .34; max = .63;<br />
(lower end of CRNRA)<br />
(most samples 0.4-0.6 range)<br />
Tributary Nutrients<br />
67<br />
Total Phosphorus<br />
(n = 35)<br />
min = < .02; max = .06;<br />
(median = .02)<br />
min = < .02; max = 0.25;<br />
(median = .03)<br />
Over 60 percent of nutrients flowed into CRNRA tributary streams during storm flows, according<br />
to nutrient studies by the USGS during 1992 to 1995. In urban watersheds, which includes most<br />
of the lower end of the CRNRA, more than 80 percent of runoff and nutrient yields occurred<br />
during storm flows (Frick et al., 1998).<br />
USGS <strong>National</strong> <strong>Water</strong> Quality Assessment (NAWQA) studies in the Chattahoochee Basin in<br />
1995 included measurements in the Big Creek basin, where total phosphorus ranged from 0.08 to<br />
0.51 mg/L--which is generally higher than the river concentrations. Big Creek may yield more<br />
phosphorus than some of the other tributaries in the CRNRA (Long et al., 1996). Nitrate<br />
generally was the principal nitrogen form observed in Big Creek. The <strong>Water</strong> <strong>Resources</strong> Division<br />
of the <strong>National</strong> <strong>Park</strong> <strong>Service</strong> funded these NAWQA studies, in part.<br />
At Suwanee Creek, the USGS collected samples 3 miles upstream of the mouth during May and<br />
July of 1995 under baseflow (dry) conditions. Nitrate concentrations in the two samples were<br />
0.05 to 0.43 mg/L, and phosphorus was only 0.02 and 0.01 mg/l. These data suggest little pointsource<br />
inputs (Long et al., 1996). [Note, a point-source input raises nutrient levels during<br />
baseflow, since dilution is less; conversely, a non-point source input contributes nutrients by land<br />
flushing during storm runoff]. These Suwanee Creek nutrient data are no higher than the values<br />
shown for the river, above.<br />
Additional, more intensive data on tributaries are collected by some of the counties. For example,<br />
Cobb County collects samples on Rottenwood, Sope, and Willeo Creeks. This report<br />
recommends follow-up work by the CRNRA to look further into these county data.<br />
Biochemical Oxygen Demand<br />
Biochemical oxygen demands in the rivers and tributaries are generally low (mostly < 1.0 mg/L),<br />
as shown in Figures 4.4.a, c, and f for the river and 4.4.h for the tributaries. These BOD levels<br />
indicate low organic loads in the streams. [Note that the high dissolved oxygen levels (discussed<br />
above) also indicate a low organic demand for oxygen.]
Other Data<br />
Specific conductance is a sensitive indicator of dissolved inorganic substances in water, and<br />
therefore tends to relate to the level of nutrients in the river (Figure 4.4.d). Specific conductance<br />
values tend to be higher in the tributaries (Figure 4.4.i) than in the river (Figure 4.4.d), which<br />
probably reflects the impact of fertilizers and other dissolved materials affecting the tributaries.<br />
The river, with large volumes from Lake Lanier, dilutes the tributary inflows.<br />
<strong>Water</strong> Quality Parameters in other Chapters<br />
Metals and pesticides are discussed in Section 6.2. Pathogens in water are reviewed in Section<br />
6.1.<br />
4.5 AQUATIC BIOLOGY, ECOLOGY, AND FISHERIES<br />
Fish in the CRNRA<br />
Couch et al. (1996) compiled a comprehensive list of the fish species that occur in the<br />
Appalachicola-Chattahoochee-Flint River basin. This diverse fish fauna includes 122 species<br />
representing 23 families. A subset of 80 species (63 native and 17 non-native) representing 15<br />
families occurs within the Piedmont Province of the Chattahoochee River basin (Table 4.5.a).<br />
The largest number of species (n = 23) in the Piedmont is in the minnow family (Cyprinidae),<br />
followed by the sunfish family (n = 16; Centrarchidae).<br />
Swift et al. (1986), using the geologic history of the Southeast and evidence of repeated<br />
phylogenetic patterns, summarized the zoogeographical history of the fish fauna in the<br />
Chattahoochee River basin. High sea levels in the Tertiary caused the formation of five distinct<br />
rivers in the Southeast: Chattahoochee; Black Warrior; Coosa; Altamaha; and Savannah. At this<br />
time, the upper Chattahoochee River basin probably connected to the Tallapoosa River basin,<br />
which likely connected to the Tennessee River basin. During Oligocene glaciation, lower sea<br />
levels allowed the ‘capture’ of the upper Chattahoochee River basin by the middle Chattahoochee<br />
River basin. In the mid- to late Pleistocene, the Savannah River captured the uppermost<br />
Chattahoochee River and its tributaries. Several species were transferred between basins,<br />
including the highscale shiner, a Chattahoochee River basin endemic.<br />
Because of this past interconnectivity with drainage basins to both the east and west, the<br />
Chattahoochee River Basin is a geographical faunal break for many species. Several species<br />
(green sunfish and spotted bass) are found in basins to the west, but are not native to the<br />
Chattahoochee River basin (Swift et al., 1986; Table 4.5.a). The basin is also the western range<br />
boundary for other species (e.g., redbreast sunfish).<br />
Fish in the Main Stem of the Chattahoochee River with the CRNRA<br />
Three studies conducted over the last 22 years (Gilbert and Reinert, 1978; Hess, 1980; Mauldin<br />
and McCollum, 1992) allow the characterization of the main stem fish assemblage in terms of<br />
species occurrence and relative abundance. With the intent to document water quality changes on<br />
68
fishes, Gilbert and Reinert (1978) sampled fish biweekly from August to December 1977 at four<br />
stations between Buford Dam to Suwanee Creek. Twenty-six species representing nine families<br />
were collected (Table 4.5.b). The most diverse family was the sunfishes, represented by 10<br />
species followed by five species of catfish. Sunfishes were also relatively abundant throughout<br />
the study reach (Table 4.5.b); however, they were uncommon in the river channel, being<br />
concentrated near stream mouths. Gilbert and Reinert characterized this fish assemblage as rather<br />
depauperate for a major southeastern river. Noteworthy was the absence of a variety of minnows.<br />
Most southeastern rivers support several species of minnows; only the carp was collected in this<br />
study.<br />
Hess (1980) conducted quarterly sampling at eight sites from Buford Dam to Peachtree Creek.<br />
The eight sites were equally apportioned to two reaches: Buford Dam to Morgan Falls Dam and<br />
Morgan Falls Dam to Peachtree Creek. Hess collected at total of 36 species in 10 families – 24<br />
species in the Buford Dam to Morgan Falls reach and 31 species in the Morgan Falls to Peachtree<br />
Creek reach (Table 4.5.b). The number and standing crop of fish was much greater below<br />
Morgan Falls than above. Nongame fish species dominated the river populations below Morgan<br />
Falls, while trout and yellow perch were dominant above.<br />
The difference in species richness between reaches is a result of the addition of 12 species and the<br />
loss of five species below Morgan Falls Dam (Table 4.5.b). As a group, the additional species,<br />
primarily suckers and catfishes, are characterized as cool or warm-water and their presence<br />
coincides with the downstream increases in temperature as coldwater releases from Buford Dam<br />
warm. Noteworthy as a species loss was the brook trout. Given the warmer temperatures below<br />
Morgan Falls Dam, it is not surprising that this species was not collected. Confounding a<br />
discussion of species additions and losses is that Morgan Falls Dam acts as a barrier to fish<br />
dispersal.<br />
It is of interest to compare the results from the Buford Dam to Suwanee Creek study of Gilbert<br />
and Reinert (1978) with the Buford Dam to Morgan Falls reach of Hess (1980). The difference in<br />
the total number of species collected was minimal (24 vs. 26; Table 4.5.b); however, Gilbert and<br />
Reinert collected more species from fewer sites and they covered less river miles. The number of<br />
shared species was 22 and the total combined species richness was 30. Species not in common<br />
between studies could be attributable to differences in sampling protocols, migrations of species<br />
in and out of tributaries, or responses of species to a variable environment.<br />
Mauldin and McCollum (1992) concentrated their sampling on the main stem downstream of<br />
Atlanta; however, one of their sampling sites was on the Chattahoochee River just above<br />
Peachtree Creek and, thus, is representative of the southern portion of the CRNRA. The<br />
following is a composite list of the 15 species (including percent relative abundance),<br />
representing seven families, collected over two seasons (summer and fall at this site):<br />
Herring Suckers Sunfishes<br />
gizzard shad (5%) quillback (1%) redbreast sunfish (3%)<br />
Pike white sucker (11%) warmouth (1%)<br />
chain pickerel (1%) Catfishes redear sunfish (6%)<br />
Minnows white catfish (1%) bluegill (25%)<br />
carp (37%) yellow bullhead (1%) largemouth bass (3%)<br />
golden shiner (1%) Perches black crappie (2%)<br />
yellow perch (3%)<br />
69
mg/L BOD-5<br />
Figure 4.4.a. BOD, fecal coliform, and dissolved oxygen values at sites along the<br />
Fecal Coliforms,<br />
MPN/100ml<br />
Dissolved Oxygen,<br />
Mg/L<br />
0.6<br />
0.5<br />
0.4<br />
0.3<br />
0.2<br />
0.1<br />
0<br />
10<br />
8<br />
6<br />
4<br />
2<br />
0<br />
Buford<br />
Dam<br />
Tailwater<br />
1600<br />
1400<br />
1200<br />
1000<br />
800<br />
600<br />
400<br />
200<br />
0<br />
Buford<br />
Dam<br />
Tailwater<br />
State<br />
Road 20<br />
Fecal Coliforms at River Sites<br />
(from EPD data of 1993-95)<br />
McGinnis<br />
Ferry<br />
Road<br />
Medlock<br />
Bridge<br />
Road<br />
Chattahoochee River from Buford Dam at the upstream end of the CRNRA<br />
Buford<br />
Dam<br />
Tailwater<br />
State<br />
Road 20<br />
State<br />
Road 20<br />
McGinnis<br />
Ferry<br />
Road<br />
McGinnis<br />
Ferry<br />
Road<br />
BOD at River Sites<br />
(from EPD data of 1993-95)<br />
Medlock<br />
Bridge<br />
Road<br />
to Paces Ferry Road at the downstream end of the CRNRA. Graphs are<br />
based on 1993 to 1995 data from the Georgia Environmental Protection<br />
Division, supplied by the U.S. Geological Survey.<br />
70<br />
Holcomb<br />
Bridge<br />
Road<br />
Eves<br />
Road<br />
4081<br />
Powers<br />
Ferry<br />
Road<br />
River Sites (river flow = left to right)<br />
Dissolved Oxygen at River Sites<br />
(from EPD data of 1993-95)<br />
Medlock<br />
Bridge<br />
Road<br />
Holcomb<br />
Bridge<br />
Road<br />
Holcomb<br />
Bridge<br />
Road<br />
Eves<br />
Road<br />
Eves<br />
Road<br />
Powers<br />
Ferry<br />
Road<br />
River Sites (river flow = left to right)<br />
Powers<br />
Ferry<br />
Road<br />
Paces<br />
Ferry<br />
Road<br />
Paces<br />
Ferry<br />
Road<br />
Paces<br />
Ferry<br />
Road<br />
River Sites (river flow = left to right)<br />
Mean<br />
Mean<br />
Median<br />
Mean<br />
Median
Suspended<br />
Sediment, Mg/L<br />
30<br />
20<br />
10<br />
0<br />
Buford<br />
Dam<br />
Tailwater<br />
State<br />
Road 20<br />
Suspended Sediment at River Sites<br />
(from EPD data of 1993-95)<br />
McGinnis<br />
Ferry<br />
Road<br />
Medlock<br />
Bridge<br />
Road<br />
Figure 4.4.b. Suspended sediment, turbidity, and water temperature values at sites<br />
Turbidity in NTUs<br />
25<br />
20<br />
15<br />
10<br />
5<br />
0<br />
Temperatue, Degrees<br />
Centigrade<br />
20<br />
15<br />
10<br />
5<br />
0<br />
Buford<br />
Dam<br />
Tailwater<br />
along the Chattahoochee River from Buford Dam at the upstream end of<br />
Buford<br />
Dam<br />
Tailwater<br />
State<br />
Road 20<br />
State<br />
Road 20<br />
McGinnis<br />
Ferry<br />
Road<br />
the CRNRA to Paces Ferry Road at the downstream end of the CRNRA. The<br />
graphs are based on 1993 to 1995 data from the Georgia Environmental<br />
Protection Division, supplied by the U.S. Geological Survey.<br />
71<br />
Holcomb<br />
Bridge<br />
Road<br />
Eves<br />
Road<br />
Powers<br />
Ferry<br />
Road<br />
Paces<br />
Ferry<br />
Road<br />
River Sites (river flow = left to right)<br />
Turbidity at River Sites<br />
(from EPD data of 1993-95)<br />
Medlock<br />
Bridge<br />
Road<br />
Holcomb<br />
Bridge<br />
Road<br />
Eves<br />
Road<br />
Powers<br />
Ferry<br />
Road<br />
Paces<br />
Ferry<br />
Road<br />
River Sites (river flow = left to right)<br />
<strong>Water</strong> Temperature at River Sites<br />
(from EPD data of 1993-95)<br />
McGinnis<br />
Ferry<br />
Road<br />
Medlock<br />
Bridge<br />
Road<br />
Holcomb<br />
Bridge<br />
Road<br />
Eves<br />
Road<br />
Powers<br />
Ferry<br />
Road<br />
River Sites (river flow = left to right)<br />
Paces<br />
Ferry<br />
Road<br />
Mean<br />
Median<br />
Mean<br />
Median<br />
Mean<br />
Median
County <strong>Water</strong> Intake<br />
County <strong>Water</strong> Intake<br />
County <strong>Water</strong> Intak<br />
Gwinnett<br />
DeKalb<br />
Cobb<br />
Gwinnett<br />
DeKalb<br />
Cobb<br />
Gwinnett<br />
DeKalb<br />
Cobb<br />
BOD: Upstream to Downstream<br />
Com parison on the River for 1986-95<br />
0.65 0.7 0.75 0.8 0.85 0.9<br />
Mg/L BOD-5<br />
Fecal Coliform Cou n ts: Upstream to Down stream<br />
Com parison on the River for 1986-95<br />
Figure 4.4.c. Upstream to downstream comparison of some nutrients at the<br />
Gwinnett, DeKalb, and Cobb counties’ water supply intakes on the<br />
Chattahoochee River with the CRNRA (information from 1986 to<br />
1995 data from the Atlanta Regional Commission, supplied by the<br />
U.S. Geological Survey.<br />
72<br />
Mean<br />
Median<br />
0 200 400 600 800 1000<br />
Fecal Coliform s, MPN/100 m l<br />
Dissolved Oxygen: Upstream to Downstream<br />
Com parison on the River for 1986-95<br />
Mean<br />
Median<br />
70 75 80 85 90 95<br />
P ercen t Sa tu ra tio n<br />
Mean<br />
Median<br />
3,547
Mg/L Concentrat<br />
County <strong>Water</strong> Intake<br />
0.5<br />
0.45<br />
0.4<br />
0.35<br />
0.3<br />
0.25<br />
0.2<br />
0.15<br />
0.1<br />
0.05<br />
0<br />
Gwinnett<br />
DeKalb<br />
Cobb<br />
Nutrients: Upstream to Downstream Comparison<br />
(at three county water intakes during 1986-95)<br />
Median Mean Median Mean Median Mean<br />
NH 4-N (total) NO 2+NO 3-N (total) P (total)<br />
Specific Conductance: Upstream to Downstream Comparison<br />
(at three county water intakes during 1986-95)<br />
0 10 20 30 40 50 60<br />
Conductance in Micromhos/cm<br />
Figure 4.4.d. Upstream to downstream comparison of three nutrients (top) and specific<br />
electrical conductance (bottom) at the Gwinnett, DeKalb, and Cobb<br />
counties’ water supply intakes on the Chattahoochee River within the<br />
CRNRA (information from 1986 to 1995 data from the Atlanta Regional<br />
Commission, provided by the U.S. Geological Survey).<br />
73<br />
Gwin n ett<br />
DeKalb<br />
Cobb<br />
Mean<br />
Median
Milligrams/Liter N<br />
Milligrams/Liter N<br />
Milligrams/Liter as P<br />
0.15<br />
0.05<br />
1.5<br />
0.2<br />
0.1<br />
1<br />
0.5<br />
0<br />
0.25<br />
0.2<br />
0.15<br />
0.1<br />
0.05<br />
0<br />
0<br />
Dissolved Ammonia Concentration as N<br />
Gwinnett DeKalb Cobb Roswell<br />
Intake Stations: Three on the River Plus Roswell on Big Creek<br />
Dissolved Nitrate Concentration as N<br />
Gwinnett DeKalb Cobb Roswell<br />
Intake Stations: Three on the River Plus Roswell on Big Creek<br />
To t a l Ph o p h o ru s a s P<br />
Gwinnett DeKalb Cobb Roswell<br />
Intake Stations: Three on the River Plus Roswell on Big Creek<br />
Figure 4.4.e. Ranges of nutrient concentrations at three water intake sites on the<br />
Chattahoochee River and one on Big Creek, 1972 to 1990 (data from Frick<br />
et al., 1996).<br />
74<br />
LEGEND<br />
95%<br />
75%<br />
median<br />
25%<br />
10%
Mg/L BO<br />
Fecal Coliforms MPN/1<br />
Percent saturat<br />
1 . 2<br />
1<br />
0 . 8<br />
0 . 6<br />
0 . 4<br />
0 . 2<br />
0<br />
12000<br />
10000<br />
8000<br />
6000<br />
4000<br />
2000<br />
100<br />
90<br />
80<br />
70<br />
60<br />
50<br />
0<br />
B O D in th e R ive r a t th e<br />
C o b b C o u n t y W a te r I n ta k e<br />
1 9 8 6 1 9 8 7 1 9 8 8 1 9 8 9 1 9 9 0 1 9 9 1 1 9 9 2 1 9 9 3 1 9 9 4 1 9 9 5<br />
Fecal coliforms in the River at<br />
Cobb County <strong>Water</strong> Intake<br />
1986 1987 1988 1989 1990 1991 1992 1993 1994 1995<br />
Yea r<br />
Dissolved Oxygen in th e River at th e<br />
Cobb County <strong>Water</strong> Intake<br />
1986 1987 1988 1989 1990 1991 1992 1993 1994 1995<br />
Ye a r<br />
Figure 4.4.f. <strong>Water</strong> quality (1986 to 1995) at the Cobb County water intake showing<br />
BOD-5, fecal coliform and dissolved oxygen mean annual values. The<br />
median number of samples per year was 13 (based on Atlanta Regional<br />
Commission data as supplied from the U.S. Geological Survey).<br />
75<br />
Yea r<br />
22,863
Mg/L Total Phosphor<br />
Mg/l NH 4 -N<br />
0.16<br />
0.14<br />
0.12<br />
0.1<br />
0.08<br />
0.06<br />
0.04<br />
0.02<br />
0.2<br />
0.18<br />
0.16<br />
0.14<br />
0.12<br />
0.1<br />
0.08<br />
0.06<br />
0.04<br />
0.02<br />
0<br />
Mg/l NO 2 +NO 3<br />
0<br />
0.6<br />
0.5<br />
0.4<br />
0.3<br />
0.2<br />
0.1<br />
0<br />
To ta l N H 4 -N in th e R ive r a t th e<br />
Cobb County <strong>Water</strong> Intake<br />
1986 1987 1988 1989 1990 1991 1992 1993 1994 1995<br />
Ye ar<br />
To ta l P h o s p h o ru s in th e R ive r a t th e<br />
Co b b Co u n ty W a te r In ta k e<br />
1986 1987 1988 1989 1990 1991 1992 1993 1994 1995<br />
Ye ar<br />
To tal NO 2 + N O 3 -N in the River at the<br />
Cobb County <strong>Water</strong> Intake<br />
1986 1987 1988 1989 1990 1991 1992 1993 1994 1995<br />
Ye ar<br />
Figure 4.4.g. <strong>Water</strong> quality (1986 to 1995) at the Cobb County water intake on the<br />
Chattahoochee River showing NH4-N, total NO2+NO3-N, and total<br />
phosphorus annual mean values. The median number of samples per<br />
year was 13 (based on Atlanta Regional Commission data as supplied<br />
by the U.S. Geological Survey).<br />
76
Mg/L BOD5<br />
Fecal Coliform (MPN/100 ml)<br />
Mg/L of DO<br />
2<br />
1.5<br />
1<br />
0.5<br />
0<br />
Haw<br />
18000<br />
16000<br />
14000<br />
12000<br />
10000<br />
8000<br />
6000<br />
4000<br />
2000<br />
0<br />
12<br />
10<br />
8<br />
6<br />
4<br />
2<br />
0<br />
Haw<br />
Richland<br />
Richland<br />
Richland<br />
James<br />
James<br />
James<br />
Level<br />
BOD Levels in Tributaries within the CRNRA<br />
(from EPD data of 1993-95)<br />
Suwanee<br />
Johns<br />
Crooked<br />
Figure 4.4.h. BOD, fecal coliform, and dissolved oxygen levels in tributaries within<br />
the CRNRA (information from 1993 to 1995 data from the Georgia<br />
Environmental Protection Division as supplied by the U.S. Geological<br />
Survey). Most sites had about 25 to 30 samples.<br />
Ball Mill<br />
Tributary<br />
77<br />
Big<br />
Willeo<br />
March<br />
Sope<br />
Dissolved Oxygen Levels in Tributaries within<br />
the CRNRA (from EPD data of 1993-95)<br />
Level<br />
Suwanee<br />
Johns<br />
Crooked<br />
Ball Mill<br />
Tributary<br />
Big<br />
Willeo<br />
March<br />
Sope<br />
Long Island<br />
Fecal Coliform Concentrations in<br />
Tr ib u tar ies w ith in th e CRNRA ( fr o m EPD d ata o f 1 9 9 3 -9 5 )<br />
Level<br />
Suwanee<br />
Johns<br />
Crooked<br />
Big<br />
Tributary<br />
Willeo<br />
March<br />
Sope<br />
Long Island<br />
Long Island<br />
Rottenwood<br />
Rottenwood<br />
Rottenwood<br />
mean<br />
median<br />
Mean<br />
Median<br />
Mean<br />
Median
Sediment Concentration (mg/L)<br />
Turbidity Units<br />
(NTUs)<br />
Conductivity in umhos/cm<br />
70<br />
60<br />
50<br />
40<br />
30<br />
20<br />
10<br />
0<br />
100<br />
80<br />
60<br />
40<br />
20<br />
0<br />
50<br />
40<br />
30<br />
20<br />
10<br />
0<br />
Haw<br />
Haw<br />
Suspended Sediment Concentrations in<br />
Tributaries within the CRNRA (from EPD data of 1993-95)<br />
Haw<br />
Richland<br />
Richland<br />
Richland<br />
James<br />
James<br />
James<br />
Level<br />
Suwanee<br />
Johns<br />
Crooked<br />
Figure 4.4.i. Suspended sediment, turbidity, and conductivity levels in tributaries within<br />
the CRNRA (based on 1993 to 1995 data from the Georgia Environmental<br />
Protection Division as provided by the U.S. Geological Survey). Most sites<br />
had about 25 to 30 samples.<br />
Ball Mill<br />
Tributary<br />
78<br />
Big<br />
Willeo<br />
March<br />
Sope<br />
Turbidity Levels in Tributaries<br />
within the CRNRA (from EPD data of 1993-95)<br />
Level<br />
Level<br />
Suwanee<br />
Johns<br />
Crooked<br />
Ball Mill<br />
Tributary<br />
Big<br />
Willeo<br />
Conductivity in Tributaries within<br />
the CRNRA (from EPD data of 1993-95)<br />
Suwanee<br />
Johns<br />
Crooked<br />
Ball Mill<br />
Tributary<br />
Big<br />
Willeo<br />
March<br />
March<br />
Sope<br />
Sope<br />
Long Island<br />
Long Island<br />
Long Island<br />
Rottenwood<br />
Rottenwood<br />
Rottenwood<br />
Mean<br />
Median<br />
Mean<br />
Median<br />
mean<br />
median
Bluegill, carp and white sucker dominated the samples at this location. Redbreast sunfish, rather<br />
than bluegill are typically the dominant (numerically) sunfish in Georgia’s warmwater streams<br />
(Mauldin and McCollum, 1992). The bluegill is a habitat generalist, an opportunistic feeder, and<br />
highly fecund (relative to the redbreast sunfish) -- characteristics that would favor its<br />
establishment in disturbed habitat. Carp and white sucker are both non-native species and also<br />
habitat generalists. As with other situations across the U.S., non-native species dominate in<br />
disturbed habitat. In particular, both carp and white sucker appear tolerant of organic and<br />
inorganic pollutants, organic enrichment, and low dissolved oxygen. Mauldin and McCollum<br />
considered this fish assemblage to be atypical of Georgia’s warmwater streams. Undoubtedly,<br />
the reduced ambient water temperatures caused by the coldwater discharges from Buford Dam<br />
are a primary reason; warmwater species, especially game species, increased in numbers farther<br />
downstream of Atlanta where the temperature effects are reduced or eliminated.<br />
The last downstream location sampled by Hess (1980) is roughly the same location as sampled by<br />
Mauldin and McCollum (1992), essentially just above Peachtree Creek. Whereas Mauldin and<br />
McCollum collected 15 species, Hess collected 22 species at this location. This substantial<br />
difference in the species richness is probably a result of sampling protocols, namely Hess’s<br />
sampling effort was over twice that of Mauldin and McCollum covering several years versus two<br />
seasons of the same year.<br />
Combing the studies of Gilbert and Reinert (1978), Hess (1980), and Mauldin and McCollum<br />
(1992), the total number of species known to occur in that portion of the Chattahoochee River<br />
within the CRNRA is 39 (Table 4.5.b).<br />
Fish Habitat and River Discharges<br />
The impacts of flow alteration on river biota and their communities have been well-documented<br />
(Cushman, 1985; Ward and Stanford, 1985; Petts, 1984; Calow and Petts, 1992). Within<br />
regulated rivers, it is the consensus of the scientific community that the lack of hydrological<br />
variation, through reduced habitat diversity and patchiness, is the prime factor in reductions in<br />
species diversity (Poff and Ward, 1989; Sparks, 1995; Standford et al., 1996). The perpetuation<br />
of native aquatic biodiversity and ecosystem integrity depends on maintaining or restoring some<br />
semblance of natural flow variability (Richter et al., 1997).<br />
In an unaltered river of the Northeast, Bain et al. (1988) noticed that an abundant and diverse<br />
assemblage of small fish species and size classes were restricted to microhabitats characterized as<br />
relatively shallow in depth, slow in current velocity, and concentrated along stream margins in<br />
riffles and pools. These shoreline habitats harbored over 90 percent of all fish and most of the<br />
species in the river. They developed a fish community-habitat model that reflected the simple<br />
pattern between the fish community in an unaltered river and the available instream habitat. This<br />
model conflicted with the traditional view of streams as a linear (vertical) sequence of riffle and<br />
pool habitats by emphasizing a shoreline-midstream orientation (horizontal).<br />
The model was then applied to a highly flow-regulated Northeast river that was heavily<br />
developed for hydropower production (Bain and Travnichek, 1996). The normally abundant and<br />
diverse shoreline fish assemblage was reduced in river reaches with highly regulated flows and<br />
absent at sites with the greatest extent of flow fluctuations. Fish species and size classes that used<br />
either a broad range of habitat, or a microhabitat that was concentrated in midstream areas were<br />
found in elevated densities as a group and peaked in abundance at the most flow regulated sites.<br />
These findings suggested that frequent and high flow variability imposed functional habitat<br />
homogeneity. The reduction and elimination of the shoreline fishes under fluctuating habitat<br />
79
conditions indicated that this assemblage was not able to effectively persist in its particular<br />
microhabitat even though it physically existed at all stream discharges. Without the functional<br />
availability of shallow, slow, shoreline habitats the river environment became one general type of<br />
usable habitat that was dominated by a few habitat generalists and those species specializing on<br />
channel habitats.<br />
Bain and Boltz (1989) extended the results of Bain et al. (1988) to develop a hypothesis of how<br />
regulated flow from hydroelectric dams would change fish communities in large rivers. The<br />
‘regulated flow impact hypothesis’ of Bain and Boltz states that fluctuating flows change the<br />
densities and species composition of fish differently in shoreline and midstream habitats, and the<br />
extent of the change depends on the severity of flow regime alteration and distance downstream<br />
of the dams. Based on this hypothesis, several predictions were postulated, including: fluctuating<br />
river flows reduce the diversity and abundance of fish in shoreline habitats; fluctuating river<br />
flows have little effect on the abundance of midstream fish; the species composition of midstream<br />
fish is dominated by habitat generalists; and fish species composition and abundance show a<br />
gradient as the effects of flow regulation diminish downstream. Bain and Boltz (1989) tested<br />
these predictions in the Tallapoosa River of the Southeast, a river with regulated flow from<br />
hydroelectric dams. These predictions and others were confirmed. It appears that the most<br />
sensitive measure of regulated flow effects is the response of the fluvial specialist component of<br />
fish assemblages in shoreline habitats. This fish habitat unit has been repeatedly found to be the<br />
most sensitive to flow alterations (Bain and Boltz, 1989). Although confounded by temperature<br />
reductions via the hypolimnetic release from Lake Lanier, it appears that the Chattahoochee River<br />
fish community below Buford Dam has responded similarly.<br />
Fish in the Tributaries of the <strong>National</strong> Recreation Area<br />
Couch et al. (1995), using museum records of historic surveys, identified a total of 50 species of<br />
fish (42 native plus 8 non-native) known to inhabit the tributaries of the metropolitan Atlanta area<br />
(Table 4.5.c). The majority of these surveys was conducted before urbanization; therefore, the<br />
records demonstrate the fish species that were present when these tributary basins were relatively<br />
‘unimpaired.’ The fish species listed in Table 4.5.c represent the ‘potential’ for tributaries in the<br />
CRNRA. In other words, for the fish community, this collection of species demonstrates one<br />
aspect of biological integrity -- a balanced, integrated, adaptive biological system having the full<br />
range of elements (genes, species, and assemblages) expected in the natural habitat of a region<br />
(Karr, 1996).<br />
Similar to the Chattahoochee River proper, three studies over the last 22 years (Hess et al. 1981;<br />
Couch et al., 1995; DeVivo, 1996) have defined the ‘baseline’ condition for several tributaries in<br />
the CRNRA. Hess et al. collected fishes in 1978 from 15 locations on tributaries of the<br />
Chattahoochee River northeast of Atlanta, including eight streams of the <strong>National</strong> Recreation<br />
Area. A total of 27 fish species were collected in these eight tributaries ranging from three species<br />
at Crooked Creek to 13 at Dick Creek (Table 4.5.d). Commonly encountered species included<br />
three minnows, three sunfishes, one sucker and one darter (Table 4.5.d). Of particular note, Hess<br />
et al. discovered an isolated population of the shoal bass in the lower Big Creek gorge area.<br />
Because of the rarity of this species, Hess et al. recommended that this population remain<br />
unexploited.<br />
Couch et al. (1995) and DeVivo (1996) sampled Chattahoochee River tributaries as part of the<br />
U.S. Geological Survey’s NAWQA program. Couch et al. sampled nine streams in the fall of<br />
1993 and DeVivo sampled these same streams plus an additional 16 tributaries from summer<br />
1993 to fall 1994. However, these studies sampled only three tributaries of CRNRA: Sope,<br />
80
Rottenwood, and Willeo creeks. A total of 25 fish species (plus three sunfish hybrids) was<br />
collected from these tributaries (Table 4.5.e). The fish community ranged from 16 species in<br />
Rottenwood Creek to 18 species in Sope Creek. Sunfish species (combinations of bluegill, green<br />
and redbreast sunfishes) dominated the fish assemblages followed by various combinations of<br />
minnows, suckers, and darters (yellowfin shiner, red shiner, bluehead chub, Alabama hog sucker,<br />
and blackbanded darter) (Table 4.5.e).<br />
Combining the three studies, a total of 35 fish species was collected from 69 percent of the<br />
tributaries of the <strong>National</strong> Recreation Area. That this number is less than the ‘potential’ 50<br />
species listed by Couch et al. (1995) is not surprising when one considers the amount of<br />
urbanization that these tributary watersheds have undergone. From the standpoint of community<br />
structure, the apparent ‘loss’ of 15 species is a crude measure of the loss of biological integrity for<br />
these tributary systems.<br />
Fisheries<br />
Construction of Buford Dam and the formation of Lake Lanier substantially changed the physical<br />
and chemical characteristics of the downstream river. Because cold water is drawn through the<br />
turbines from about 68 feet below the surface of the reservoir (hypolimnetic release), the water in<br />
the tailrace is cold year round (Gilbert and Reinert, 1978).<br />
The coldwater regime allowed the formation of a secondary trout fishery (i.e., sustained via<br />
regular stocking) in the river for approximately 50 miles below the dam (essentially Buford Dam<br />
to Peachtree Creek). This section of the Chattahoochee River is one of the southernmost trout<br />
fisheries in the nation (Hess 1980). Harvestable-size brook, brown and rainbow trout have been<br />
stocked since 1957 (Gilbert and Reinert, 1978), and the area has been managed as a trout fishery<br />
since 1960 (Hess 1980). The Georgia Game and Fish Division now stocks about 100,000 brown<br />
trout plus 150,000 rainbow trout in the river each year (pers. com., Georgia Department of Game<br />
and Fish, 1999). Presently, the upper portion (Buford Dam to Roswell Road) is managed as a<br />
year-round, put-and-take trout fishery by stocking 9-inch brown and rainbow trout. The lower<br />
portion (Morgan Falls Dam to Peachtree Creek) is managed as a put-grow-and-take trout fishery<br />
with annual stockings of 3-inch brown and 6-inch rainbow trout (Biagi and Brown, 1997. Native<br />
warmwater fish do not maintain a significant fishery in this section because of the altered thermal<br />
regime (Ingols, 1962; Biagi and Brown, 1997).<br />
Martin (1985a) noted that no natural reproduction occurs in the 50-mile section below Buford<br />
Dam. However, anecdotal evidence suggests that some natural reproduction is occurring.<br />
Georgia DNR is planning a study to quantify successful reproduction in reaches where spawning<br />
activity was observed. If trout are successfully reproducing, the Chattahoochee River within the<br />
CRNRA could become classified as a primary trout fishery. This classification would affect how<br />
the State (and NPS) would manage the resource.<br />
The tailwater is characterized by extensive water level fluctuations (3.9 to 11.1 m) and bed<br />
scouring caused by power generation, low water turbidities, and dampened seasonal variation of<br />
water temperatures. <strong>Water</strong> temperatures from Buford Dam to Morgan Falls Dam range from 9 o C<br />
to 19 o C with an average of 13 o C (Hess, 1980; Martin, 1985a). The river below Buford Dam<br />
experiences an oxygen deficit in late summer and early fall; however, re-aeration is reasonably<br />
rapid due to the steep gradient (Hess, 1980). [Note that the temperature and oxygen effects of<br />
Buford Dam are illustrated in Figures 5.3.a and 5.3.b].<br />
81
Below Morgan Falls Dam, temperatures in the Chattahoochee River reach as high as 27.5 o C<br />
(Biagi and Brown, 1997). Warmwater episodes (greater than or equal to 23 o C) are generally of<br />
short duration (associated with high runoff events) and their effects on the fishery are unknown.<br />
Research has shown that temperatures above 23 o C are particularly detrimental to trout fisheries<br />
(Elliott, 1975a,b,c).<br />
Regulations for secondary trout waters allow a maximum temperature elevation of 1.1 o C above<br />
ambient. The language of the regulations for secondary trout waters is ambiguous about whether<br />
it applies to the trout stream as a whole or if it applies to each individual permitted discharge<br />
(Biagi and Brown, 1997). The latter interpretation could theoretically allow cumulative<br />
temperature increases that exceed desirable stream limits, thereby, significantly reducing or<br />
eliminating summertime trout habitat in many streams. This ambiguous temperature standard for<br />
secondary trout streams is problematic because many non-point sources resulting from current<br />
development trends along the Chattahoochee River corridor are not addressed. Defining sound<br />
protective standards for large multiple use streams like the Chattahoochee River tailwater is<br />
critical so that potential impacts can be anticipated and avoided through appropriate regulatory<br />
means (Biagi and Brown, 1997).<br />
Both the upper and lower sections below Buford Dam provide a valuable fishery resource to<br />
metropolitan Atlanta, and as Atlanta’s population has increased, so has the fishing pressure<br />
exerted on these resources. Demand on both sections has been monitored by occasional creel<br />
surveys over the last 20 years. The most recent creel survey on the upper section was in 1983<br />
(Martin, 1985b). Recommendations from that creel survey indicated that the river needed to be<br />
surveyed every 5 years to assess any changes in the catch rate of stocked trout.<br />
The most recent data available for trout growth in the upper section is 8.1 mm (0.32 inch)/month<br />
for catchable rainbows and 4.9 mm (0.19 inch)/month for catchable browns (Hess, 1980); these<br />
growth rates were lower than in other tailwater studies at that time. Martin (1985b) and Hess<br />
(1980) reported catch rates of approximately 0.4 fish/hr, which approached catch rates in other<br />
tailwater studies at that time. The number of catchable trout stocked into the upper section has<br />
increased from 129,662 (13 percent of Georgia’s catchable trout) during 1983 (Martin, 1985b) to<br />
354,915 (28 percent of Georgia’s catchable trout) in 1997 (John Biagi, 1998, pers. com., Georgia<br />
Game and Fish Department). Seasonal return rates of stocked trout in 1983 were determined to<br />
be at or near 100 percent (Martin 1985b). Exploitation was not measured after the change in<br />
regulations in 1996 (from seasonal to year round fishery), but rates were assumed to be high,<br />
justifying the large increase in stocking. Given the length of time since the last creel survey, the<br />
1996 change in regulations, and the 100 + percent increase in stocking rates, there is a need to reexamine<br />
angler exploitation rates.<br />
The selectivity of trout food types varies with season and river location (Hess, 1980; Gilbert and<br />
Reinert, 1979). Trout near Buford Dam opportunistically feed on threadfin shad and yellow<br />
perch that pass through the dam from December until April (when the reservoir is unstratified).<br />
Farther downstream, particularly in the shoal areas, trout feed on benthic macroinvertebrates<br />
during the same period. Terrestrial invertebrates are the preferred food type from June through<br />
August. Beginning in September, a shift occurs from terrestrial invertebrates to benthic<br />
macroinvertebrates, the preferred food item in winter.<br />
Trout feeding habits in this regulated river differ from those observed in non-regulated streams.<br />
On an annual basis the majority of fish food is allochthonous in origin, i.e. the food comes from<br />
outside the system. Aquatic macroinvertebrates represent a relatively small percentage of the<br />
total food base. The aquatic macroinvertebrate communities, the primary source of food in most<br />
82
unregulated systems, are limited by several factors downstream of Buford Dam. These include<br />
reduced thermal maxima, seasonally low dissolved oxygen levels, scarcity of allochthonous<br />
material inputs, shifting sand substrate, and fluctuating water levels and velocities at variable time<br />
scales (Nestler et al., 1984).<br />
Nestler et al. (1984) related the potential for differences in the quality of trout habitat to flow<br />
conditions (discharge) in the Chattahoochee River between Buford Dam and Peachtree Creek.<br />
They used an instream flow technique, PHABSIM (PHysical HABitat SIMulation), that is based<br />
on the observation that most species of fish prefer certain combinations of depth, velocity, and<br />
cover and tend to avoid other combinations of these parameters. If the relative value of different<br />
depths and velocities for each species are known (called suitability criteria) and the hydraulic<br />
conditions within the channel can be described for different discharges, then it becomes possible<br />
to determine the quality of the habitat for each species of fish.<br />
The general results for trout of all life-stages were remarkably similar. In all cases, habitat for<br />
each species peaked at a discharge under 2,000 cfs and then declined to a minimum at the highest<br />
simulated discharge of 12,000 cfs. The four life-stages investigated could be placed into two<br />
groups. The habitat-discharge relationships for adult rainbow trout and adult brown trout were<br />
generally similar -- both peaked at 1,500 cfs and then declined to a minimum at 12,000 cfs. For<br />
the second group, brook trout and juvenile brown trout, the habitat-discharge relationships peaked<br />
at or under 1,000 cfs and declined to a minimum at 12,000 cfs. In general, the amount of habitat<br />
available for adult brook trout was apparently less than that available for either adult brown or<br />
rainbow trout.<br />
However, the habitat value of different reaches within the study area differed significantly. The<br />
largest area of habitat for all trout species and life-stages was found below Morgan Falls Dam,<br />
primarily because of the steep stream gradient and numerous shoals that occur in this reach.<br />
Shoals are where the river is wide (up to 680 feet), relatively shallow (can be easily waded at low<br />
flow except for an occasional deep channel), stream gradient is steep (12.5 ft/mi), and the<br />
substrate is predominately bedrock. The reach from Morgan Falls Dam to Peachtree Creek<br />
provides the most valuable habitat because it is composed of the highest percentage of shoals<br />
(nearly 40 percent). In addition, the habitat requirements of aquatic macroinvertebrates are<br />
similar to the habitat requirements of trout; thus, shoal areas are also important trout food<br />
production areas. In addition, Nestler et al. (1984) identified two other habitat classifications that<br />
exist between Buford Dam and Peachtree Creek, illustrated in Figure 4.5.a:<br />
Runs – where the river is moderately wide (up to 300 feet wide), can be waded with<br />
difficulty at low flow, stream gradient is moderate (2 ft/mi), the substrate is composed of<br />
shifting sand and the banks are composed of a silt and sand mixture; and<br />
Pools – where the river is narrow (up to 200 ft), deep (cannot be waded at low flow),<br />
stream gradient is low and the substrate is composed of silt.<br />
Under current operating conditions, trout habitat at any point within the river reach between<br />
Buford Dam and Peachtree Creek varies between optimum and near-optimum at the lower flow<br />
(550 to 1050 cfs, depending upon location in the river) to a minimum at the higher discharges<br />
(near 10,000 cfs depending upon discharge from Buford Dam and local inflows). Also, habitat<br />
can vary from maximum to a minimum several times in a 24-hour period. Thus, fish habitat may<br />
be optimal for much of the day and minimal for several hours.<br />
83
Figure 4.5.a. Shoal, run, and pool habitat types in the Chattahoochee River, Buford Dam and<br />
Peachtree Creek (after Nestler et al., 1984).<br />
84
Invertebrates<br />
Couch et al. (1996) summarized information on aquatic invertebrates as follows:<br />
With the exception of perhaps mollusc (Heard, 1977) and crayfish species<br />
(Hobbs, 1942; 1981), knowledge of the number and distribution of aquaticinvertebrate<br />
species that inhabit the ACF River basin is limited. Perhaps the<br />
largest diversity of macrofaunal-aquatic organisms occurs among the insects.<br />
However, information on the occurrence of aquatic insect species is limited to<br />
checklists relevant only to selected taxa and only in portions of the ACF River<br />
basin.<br />
Hobbs (1942; 1981) lists 30 species of crayfish that occur in the ACF River<br />
basin. Fifteen of those species occur in the Appalachicola River basin and 20<br />
occur in the Chattahoochee or Flint River basins. Six species are endemic to the<br />
Chattahoochee River basin and another six species are endemic to the Flint River<br />
basin.<br />
The southeastern United States has more freshwater mussel species than any<br />
other region of the world (Burch, 1973). Of the western Florida river drainages,<br />
the Appalachicola River basin had the largest number of species of freshwater<br />
gastropods and biavalves, the most endemic species, and the greatest proportion<br />
of endemics to the total mollusc fauna (Johnson, 1972). Historically, as many as<br />
45 unionid mussel species have been collected in the ACF River basin.<br />
However, nearly all species of unionids appear to be extirpated from the main stem of the<br />
Chattahoochee River (Williams and Box, 1993). It remains to be seen whether mussel species<br />
have found appropriate refugia in the lower portions of tributaries.<br />
Invertebrates in the Chattahoochee River within the CRNRA<br />
The Georgia <strong>Water</strong> Quality Control Board (1971) conducted a fairly comprehensive (for that<br />
time) look at the aquatic macroinvertebrates of the Chattahoochee River and its tributaries.<br />
Stations that were coincident with the CRNRA of today included five main stem sites (RM 337.8<br />
to RM 301.3) and four tributary sites (Suwanee, Crooked, Big, and Sope Creeks). The aquatic<br />
macroinvertebrate community was sampled both qualitatively (microhabitat samples) and<br />
quantitatively (time-based colonization of limestone-filled baskets in combination with Petersen<br />
dredge).<br />
Some areas of the Chattahoochee River were nearly barren of bottom organisms. Low taxa<br />
richness (identification to genus) and low densities were characteristic of the river in what is now<br />
the CRNRA (Table 4.5.f). The following data suggested that macroinvertebrate densities were<br />
correlated with the downstream gradient in river temperature from Buford Dam:<br />
85
LOCATION AND<br />
MEAN TEMPERATURE<br />
(DEGREES CELSIUS)<br />
86<br />
MEAN NO. OF<br />
INDIVIDUALS PER BASKET<br />
Gwinnett Co. <strong>Water</strong> Intake (RM 337.8) (9.1) 57*<br />
Dekalb Co. <strong>Water</strong> Intake (10.4) 33<br />
Cobb Co. <strong>Water</strong> Intake (12.1) 59<br />
Atlanta <strong>Water</strong> Intake (RM 301.3) (13.5) 92<br />
* This figure was unusually high due to the presence of a large number of small, cold-adapted caddisfly<br />
(Ephemeroptera) larvae.<br />
The number of types of aquatic macroinvertebrates in the Chattahoochee River was far less than<br />
in the tributaries (Table 4.5.f) and the river upstream of Lake Lanier. The study concluded that<br />
these conditions were caused by the release of nutrient-deficient cold water in intermittent power<br />
waves from Buford Dam.<br />
Currently, there is a study to examine the possibility of using benthic macroinvertebrates to<br />
monitor the long-term water quality of the Chattahoochee River within the CRNRA (pers. comm.,<br />
J. Fenstermacher, CRNRA, 2000). A local flyfishing guide is collected the data,<br />
macroinvertebrate identification is by a retired entomologist, and data analysis will be by the<br />
State. General methodology includes: (1) Hester-Dendy sampling (once each season; (2) water<br />
quality parameters taken at time of Hester-Dendy harvest; (3) Surber samples taken at low flow at<br />
a minimum of six sites in the CRNRA; and, (4) identification of invertebrates to the genus level<br />
and calculation of various bioassessment indexes.<br />
Invertebrates in the Tributaries within the <strong>National</strong> Recreation Area<br />
Information on aquatic macroinvertebrates in the tributaries of the <strong>National</strong> Recreation Area is<br />
limited primarily to a few, dated studies by the Georgia Environmental Protection Division (e.g.,<br />
EPD, 1966; 1973), Georgia <strong>Water</strong> Quality Control Board (1971; see Table 6), and Georgia Game<br />
and Fish Division (Hess et al., 1981). Ongoing watershed characterization studies by Gwinnett<br />
County (CH2MHill, 1998a) covering Crooked, Level, Richland, and Suwanee Creeks will add<br />
greatly to the scarcity of information.<br />
The State Environmental Protection Division (1966) qualitatively sampled aquatic<br />
macroinvertebrates (debris picking) from seven stations on Sope Creek. The number of taxa<br />
(identifications primarily to genus) collected ranged from only two to 12. A follow-up study in<br />
1973 (Environmental Protection Division, 1973) found conditions more degraded than in 1966<br />
based on macroinvertebrate sampling.<br />
Hess et al. (1981) collected aquatic invertebrates in the fall of 1978 from 15 stations on 12<br />
tributaries of the middle Chattahoochee River including the following streams within the<br />
CRNRA: Richland, James, Dick, Level, Suwanee, Johns, Crooked and Big creeks. The number<br />
of taxa collected ranged from three at Crooked Creek to 10 at Richland Creek (Table 4.5.g).<br />
Similarly, diversity values (Cairn’s Sequential Comparison Index – higher values mean healthier<br />
systems) ranged from 2.4 at Crooked Creek to 7.9 at Richland Creek. Diversity values for the<br />
stations on small, headwater streams (Richland, Crooked, and Dick ceeks) were higher than for<br />
similarly sized streams in other nearby Piedmont basins.
Amphibians and Reptiles<br />
Few amphibians and reptiles are found in lotic habitats of larger Piedmont streams and rivers.<br />
However, in very small springs and seeps, some amphibians (particularly salamanders) may be<br />
very abundant. It is likely that fish predation limits the distribution of many of these species in<br />
larger streams and rivers.<br />
Amphibians and reptiles tend to be associated with the terrestrial-aquatic interface in streams and<br />
rivers. Consequently, backwater and floodplain pools in Piedmont streams and rivers constitute<br />
an important habitat for these organisms (particularly turtles). The confluence of a large river and<br />
a small tributary stream can also be a particularly rich habitat for frogs, turtles, salamanders, and<br />
snakes.<br />
Rare, Threatened and Endangered Species<br />
No federally protected aquatic species occur within or near the boundaries of the CRNRA;<br />
however, two state-listed species, the highscale shiner and bluestripe shiner, are endemic to the<br />
tributary systems of the Chattahoochee River basin (Tables 4.5.a and 4.5.c). In the case of the<br />
bluestripe shiner, recent surveys of Chattahoochee River tributaries (Couch et al., 1995; DeVivo,<br />
1996) failed to collect this species, although only a limited number of CRNRA tributaries were<br />
sampled.<br />
The highscale shiner is state threatened primarily because little is known about its distribution and<br />
habitat preferences (DeVivo, 1996). For example, because of this species presence in the<br />
Savannah River Basin, it is problematic whether this species is truly endemic to the<br />
Chattahoochee River basin. DeVivo collected this species in a geographically widespread area of<br />
the Chattahoochee River basin. Although not collected in tributaries of CRNRA, of interest is the<br />
collection of this species above Lake Lanier. DeVivo mentioned that unverified data of<br />
subsequent U.S. Geological Survey – NAWQA samples of metropolitan Atlanta tributaries found<br />
the highscale shiner. It is unknown if this suspected occurrence of the highscale shiner withstood<br />
scrutiny. To date, no USGS – NAWQA publications describe this species’ presence in<br />
metropolitan Atlanta.<br />
The grayfin redhorse and the greater jumprock are also endemic species to the Chattahoochee<br />
River basin. Recent surveys (Couch et al., 1995; DeVivo, 1996) have not collected the latter<br />
species in the CRNRA. However, both Gilbert and Reinert (1978) and Hess (1980) collected the<br />
grayfin redhorse in the main stem of the Chattahoochee River within its boundaries. In particular,<br />
Hess (1980) noted that the grayfin redhorse was common between Buford and Morgan Falls dams<br />
and abundant below Morgan Falls Dam.<br />
Problematic, Non-Native Species<br />
In 1991, personnel of the Chattahoochee Nature Center in Roswell, GA noticed the presence of an<br />
eel-like fish in the pond and stream complex of its facility (pers. comm., CRNRA staff, 1999). It<br />
was not until 1996 that this species was identified as the Asian rice eel (Monopterus albus;<br />
Synbranchidae; family native to Central and South American, Africa and Southeast Asia). This was<br />
probably an aquarium release and the species is suspected to have spread to other parts of the<br />
Chattahoochee River system because the ponds are connected to the river. Based on sampling in<br />
1996 the nature center population had apparently eliminated local native sunfish species (U.S.<br />
Geological Survey, 1998b). The Georgia population has shown some cold tolerance, as evidenced<br />
87
y having survived air temperatures below freezing and ice cover over their pond habitat (U.S.<br />
Geological Survey, 1998a). The CRNRA is currently funding a cooperative study with the<br />
University of Georgia to determine the extent of range expansion outside the nature center, as well<br />
as initiate life history research.<br />
The swamp eel is a large (3 feet or more), nocturnal predator that spends the day hiding in thick<br />
aquatic vegetation or in small burrows and crevices along the water’s edge (U.S. Geological<br />
Survey, 1998b). It is tolerant of hypoxic conditions and is capable of breathing air as a principal<br />
form of respiration. Both attributes allow for survival under limiting conditions or colonization of<br />
new habitat. In many populations, all young are hatched as females; after spending part of their life<br />
as females, the eels transform into large males.<br />
The red shiner, an opportunistic, habitat generalist native to watersheds in the south and central<br />
plains west of the Mississippi River, first appeared in fish collections from the Chattahoochee River<br />
basin in 1978 (DeVivo, (1995). Since its introduction, probably via bait-bucket transfer, it has<br />
become the dominant or co-dominant species (up to 77 percent of individuals and 12.5 percent of<br />
species), usually at the expense of native species in the degraded, tributary streams of metropolitan<br />
Atlanta (DeVivo, 1995 and 1996; DeVivo et al., 1997). As a result of diminishing populations via<br />
hybridization following the introduction of the red shiner, the bluestripe shiner is currently a statelisted<br />
species.<br />
Table 4.5.a. Fishes of the Piedmont Province of the Chattahoochee<br />
River basin (modified from Couch et al., 1996).<br />
Common and Scientific Names<br />
PETROMYZONTIDAE<br />
Southern brook lamprey (Icthyomyzon gagei) 4,5<br />
CLUPEIDAE<br />
Alabama shad (Alosa ababamae) 1,3,4<br />
Skipjack herring (Alosa chrysochloris) 1,3,4,5<br />
Gizzard shad (Dorosina cepedianum) 1,3,4,5,7<br />
Threadfin shad (Dorosoma petenense) 1,3,4,5,7<br />
SALMONIDAE<br />
Brook trout (Salvelinus fontinalis) 1,2,4<br />
Brown trout (Salmo trutta) b,1,2,4<br />
Rainbow trout (Oncorhynchus mykiss) b,1,2,4<br />
CYPRINIDAE<br />
Bluefin stoneroller (Campostoma paauciradii) 1,4,5,6,7<br />
Goldfish (Carassius aauratus) b,1,4,5<br />
Bluestripe shiner (Cyprinella callitaneia) a,1,4,5,6<br />
Red shiner (Cyprinella lutrensis) b,7<br />
Blacktail shiner (Cyprinella venusta) 1,3,4,5,6,7<br />
Common carp (Cyprinus carpio) b,1,4,5,7<br />
Silverjaw minnow (Ericymba buccata) 1,4,5,6,7<br />
Clear chub (Hybopsis winchelli) 1,3,5,7<br />
Bandfin shiner (Luxilus zonistius) 1,3,4,5,6,7<br />
CYPRINIDAE<br />
Blacktip shiner (Lythrurus atrapiculus) 1,3,7<br />
88
Bluehead chub (Nocomis leptocephalus) 3,4,5,7<br />
Golden shiner (Notemigonus crysoleucas) 1,3,4,5,7<br />
Rough shiner (Notropis baileyi) b,1,3,4,5,7<br />
Dusky shiner (Notropis cummingsae) 1,4,5<br />
Spottail shiner (Notropis hudsonius) 1,3,4,5,7<br />
Highscale shiner (Notropis hypsilepis) 1,3,4,5,6,7<br />
Longnose shiner (Notropis longirostris) 1,4,5,7<br />
Yellowfin shiner (Notropis lutipinnis) 1,4,6,7<br />
Coastal shiner (Notropis petersoni) 6<br />
Weed shiner (Notropis texanus 1,3,4,5,7<br />
Coosa shiner (Notropis xaenocephalus 1,4,6<br />
Fathead minnow (Pimephales promelas) 7<br />
Creek chub (Semotilus atromaculatus) 1,3,4,5,6,7<br />
Dixie chub (Semotilus thoreauianus) 8<br />
CATASTOMIDAE<br />
Quillback (Carpiodes cyprinus) 9<br />
White sucker (Catostomus commersoni) b,7<br />
Creek chubsucker (Erimyzon oblongus) 1,3,4,5,7<br />
Alabama hogsucker (Hypentelium etowanum) 1,4,5,6,7<br />
Spotted sucker (Minytrema melanops) 1,3,4,5,6,7<br />
Grayfin redhorse (Moxostoma sp.cf. poecilurum) a,1,3,4,5,6,7<br />
Greater jumprock (Scartomyzon lachneri) a,1,3,4,5,6,7<br />
Striped jumprock (Scartomyzon rupiscartes) 1,4,6,7<br />
ICTALURIDAE<br />
Snail bullhead (Ameiurus brunneus) 1,3,4,5,7<br />
Flat bullhead (Ameiurus platycephalus) b,7<br />
Black bullhead (Ameiurus melas) b,7<br />
Yellow bullhead (Ameiurus natalis) 1,3,4,5,7<br />
Brown bullhead ( nebulosus) 1,3,4,5,6,7<br />
Channel catfish (Ictalurus punctatus) 1,3,4,5,6,7<br />
Tadpole madtom (Noturus gyrinus) 1,3,4,5,6,7<br />
Speckled madtom (Noturus leptacanthus) 1,3,4,5,6,7<br />
Flathead catfish (Pylodictis olivaris) b,3,4,6<br />
ESOCIDAE<br />
Redfin pickerel (Esox americanus) 1,3,4,5<br />
Chain pickerel (Esox niger) 1,3,4,5,7<br />
APHREDODERIDAE<br />
Pirate perch (Aphredoderus sayanus) 1,3,4,5<br />
FUNDULIDAE<br />
Blackspotted topminnow (Fundulus olivaceus) 1,3,4,5,6<br />
Southern studfish (Fundulus stellifer) 1,3,4,6,7<br />
POECILIIDAE<br />
Mosquitofish (Gambusia sp.cf. affinis) 1,3,4,5,7<br />
COTTIDAE<br />
Mottled sculpin (Cottus bairdi) 1,3,4,6,7<br />
Banded sculpin (Cottus carolinae) 1,3,4,6<br />
MORONIDAE<br />
White bass (Morone chrysops) b,1,3,4,5<br />
Striped bass (Morone saxatilis) 1,3,4<br />
Sunshine bass (Morone chrysops X saxatilis) 3<br />
89
CENTRARCHIDAE<br />
Shadow bass (Ambloplites ariommus) 1,3,4<br />
Flier (Centrarchus macropterus) 1,3,4,5<br />
Redbreast sunfish (Lepomis auritus) 1,3,4,5,7<br />
Green sunfish (Lepomis cyanellus) b,1,3,4,5,7<br />
Warmouth (Lepomis gulosus) 1,3,4,5,7<br />
Bluegill (Lepomis macrochirus) 1,3,4,5,7<br />
Longear sunfish (Lepomis megalotis) 1,3,4,5<br />
Redear sunfish (Lepomis microlophus) 1,3,4,5,7<br />
Spotted sunfish intergrade (Lepomis mineatus X L.<br />
punctatus) 1,3,4,5,7<br />
Redeye bass (Micropterus coosae) 1,3,4,5,6,7<br />
Shoal bass (Micropterus sp. cf. coosae) 1,3,4<br />
Smallmouth bass (Micropterus dolomieu) b,1,3,4,5<br />
Spotted bass (Micropterus punctatus) b,1,3,4,5,6,7<br />
Largemouth bass (Micropterus salmoides) 1,3,4,5,7<br />
White crappie (Pomoxis annularis) 1,3,4<br />
Black crappie (Pomoxis nigromaculatus) 1,3,4,5,7<br />
PERCIDAE<br />
Gulf darter (Etheostoma swaini) 1,3,4,5,7<br />
Yellow perch (Perca flavescens) b,1,3,4,5,7<br />
Blackbanded darter (Percina nigrofasciata) 1,3,4,5,7<br />
Sauger (Stizostedion canadense) b,1,3,4<br />
Walleye (Stizostedion vitreum) b,1,3,4<br />
SOLEIDAE<br />
Hogchoker (Trinectes maculatus) 6<br />
1 From Yerger (1977).<br />
2 From Edmiston and Tuck (1987).<br />
3 From Barkuloo and others (1987).<br />
4 From Dalhberg and Scott (1971).<br />
5 From Gilbert (1969).<br />
6 From Satterfield (1961).<br />
7 From DeVivo (1996).<br />
8 DeVivo (1996) showed this species present in the Piedmont Province. Couch et al. (1996) listed this species for<br />
Piedmont, but did not tie its presence to a reference source.<br />
9 Mauldin and McCollum (1992).<br />
a Endemic species<br />
b Non-native species<br />
90
Table 4.5.b. Fish species collected from the Chattahoochee River by Gilbert and Reinert (1978) between Buford Dam and Suwanee Creek and<br />
by Hess (1980) between Buford Dam and the mouth of Peachtree Creek. A = abundant, C = common, R = rare.<br />
Species Buford Dam to Morgan Falls<br />
Dam (Hess, 1980)<br />
Lampreys<br />
southern brook lamprey<br />
Bowfins<br />
Bowfin<br />
Herring<br />
gizzard shad<br />
Trout<br />
rainbow trout<br />
brown trout<br />
brook trout<br />
Pike<br />
chain pickerel<br />
Minnows<br />
carp<br />
silverjaw minnow<br />
bluehead chub<br />
golden shiner<br />
Suckers<br />
quillback<br />
white sucker<br />
creek chubsucker<br />
Alabama hogsucker<br />
. unidentified buffalo (Ictiobus sp.)<br />
spotted sucker<br />
greater jumprock<br />
greyfin redhorse<br />
A<br />
A<br />
A<br />
R<br />
C<br />
R<br />
R<br />
R<br />
R<br />
R<br />
R<br />
C<br />
91<br />
OCCURRENCE<br />
Morgan Falls Dam to<br />
Peachtree Creek (Hess, 1980)<br />
C<br />
A<br />
A<br />
A<br />
R<br />
A<br />
R<br />
A<br />
C<br />
R<br />
C<br />
R<br />
R<br />
R<br />
A<br />
Buford Dam to Suwanee<br />
Creek (Gilbert and Reinert,<br />
1978)<br />
R<br />
A<br />
A<br />
A<br />
C<br />
C<br />
R 1<br />
R<br />
R
Freshwater catfishes<br />
snail bullhead<br />
black bullhead<br />
yellow bullhead<br />
brown bullhead<br />
channel catfish<br />
white catfish<br />
Sunfishes<br />
redbreast sunfish<br />
green sunfish<br />
warmouth<br />
bluegill<br />
redear sunfish<br />
spotted bass<br />
largemouth bass<br />
shoal bass<br />
black crappie<br />
white crappie<br />
Perches<br />
yellow perch<br />
blackbanded darter<br />
Sculpins<br />
banded sculpin<br />
unidentified sculpin (Cottus sp. cf. bairdi)<br />
R<br />
R<br />
R<br />
C<br />
R<br />
A<br />
R<br />
R<br />
C<br />
C<br />
A<br />
R<br />
R<br />
R<br />
R<br />
Total Number of Species by Reach 24 31 26<br />
Total Number of Species – Buford Dam to<br />
39<br />
Peachtree Creek<br />
1<br />
Identified by Gilbert and Reinert (1978) as H. nigricans, northern hogsucker. This is probably a misidentification, since only H. etowanum is known from the Chattahoochee River in the Piedmont<br />
Province (Couch et al., 1996).<br />
92<br />
R<br />
C<br />
R<br />
A<br />
A<br />
C<br />
A<br />
R<br />
R<br />
C<br />
R<br />
A<br />
A<br />
R<br />
R<br />
R<br />
C<br />
R<br />
R<br />
R<br />
A<br />
C<br />
C<br />
R<br />
R<br />
C<br />
R<br />
C<br />
R<br />
A
Table 4.5.c. Fish species (by common name) inhabiting tributaries to the Chattahoochee River in the metropolitan Atlanta area. Compiled from<br />
museum records maintained by the University of Georgia Museum of Natural History (modified from Couch et al., 1995).<br />
Lampreys<br />
southern brook lamprey<br />
Pike<br />
redfin pickerel<br />
chain pickerel<br />
Minnows<br />
golden shiner<br />
creek chub<br />
dixie chub<br />
bluehead chub<br />
bluefin stoneroller<br />
bandfin shiner<br />
blacktail shiner<br />
red shiner<br />
bluestripe shiner<br />
yellowfin shiner<br />
longnose shiner<br />
highscale shiner<br />
clear chub<br />
silverjaw minnow<br />
Suckers<br />
white sucker<br />
spotted sucker<br />
Alabama hog sucker<br />
grayfin redhorse<br />
striped jumprock<br />
greater jumprock<br />
Catfishes<br />
channel catfish<br />
yellow bullhead<br />
black bullhead<br />
brown bullhead<br />
snail bullhead<br />
flat bullhead<br />
tadpole madtom<br />
speckled madtom<br />
black madtom<br />
Topminnows<br />
southern studfish<br />
93<br />
Sculpins<br />
banded sculpin<br />
mottled sculpin<br />
Basses and Sunfishes<br />
black crappie<br />
shadow bass<br />
largemouth bass<br />
spotted bass<br />
redeye bass<br />
shoal bass<br />
smallmouth bass<br />
warmouth<br />
green sunfish<br />
bluegill<br />
redear sunfish<br />
redbreast sunfish<br />
Perches and Darters<br />
yellow perch<br />
blackbanded darter
Table 4.5.d. List of fish species collected in tributaries of the Chattahoochee River <strong>National</strong> Recreation Area in fall 1978 (modified from Hess<br />
et al., 1981). Big and Suwanee creeks had multiple sampling stations. Species listed represent only those stations within CRNRA<br />
boundaries. "X" represents species presence and "*" denotes common species.<br />
CREEK<br />
Species Richland Crooked Dick<br />
Level<br />
Johns<br />
James<br />
Creek<br />
Creek<br />
Creek<br />
Creek<br />
Creek<br />
Creek<br />
southern brook lamprey X<br />
rainbow trout X<br />
chain pickerel<br />
stoneroller* X X X X<br />
bluehead chub* X X X X X X<br />
golden shiner X<br />
longnose shiner X<br />
yellowfin shiner* X X X X X X<br />
bandfin shiner X X X X<br />
creek chub X X X<br />
Alabama hogsucker* X X X X X X<br />
spotted sucker<br />
striped jumprock X<br />
snail bullhead<br />
94<br />
Suwanee<br />
Creek<br />
Big<br />
Creek<br />
X
table continues<br />
Species Richland<br />
Creek<br />
Crooked<br />
Creek<br />
Dick<br />
Creek<br />
yellow bullhead X<br />
tadpole madtom X<br />
southern studfish X<br />
mosquitofish X<br />
95<br />
Level<br />
Creek<br />
CREEK<br />
redbreast sunfish* X X X X<br />
green sunfish* X X X<br />
warmouth<br />
bluegill* X X X<br />
shoal bass X<br />
largemouth bass X X<br />
black crappie X<br />
blackbanded darter* X X X X<br />
sculpin sp. X X<br />
Total Number of Fish<br />
Species<br />
7<br />
3<br />
13<br />
6<br />
Johns<br />
Creek<br />
8<br />
James<br />
Creek<br />
10<br />
Suwanee<br />
Creek<br />
5<br />
Big<br />
Creek<br />
8
Table 4.5.e. Relative abundance of tributary fish species collected by Couch et al. (1995) and<br />
DeVivo (1996) in three streams of the CRNRA.<br />
PERCENT RELATIVE ABUNDANCE<br />
COMMON NAME<br />
SOPE ROTTENWOOD WILLEO<br />
CREEK 1 CREEK 2 CREEK 2<br />
bluefin stoneroller 4
southern studfish
Table 4.5.f. Summary of aquatic macroinvertebrate collections from Chattahoochee River Basin Study (modified from Georgia <strong>Water</strong> Quality<br />
Control Board, 1971). Abbreviations are: Intol. = intolerant; Tol. = tolerant; N/A = not applicable.<br />
Stream<br />
Chattahoochee River<br />
Suwannee Creek<br />
River Mile a<br />
337.8<br />
NUMBER OF SPECIES<br />
Intol.<br />
0<br />
Partially<br />
Intol.<br />
4<br />
Tol.<br />
1<br />
98<br />
Total<br />
5<br />
Biological<br />
N/A<br />
Assessment of<br />
<strong>Water</strong> Quality<br />
337.7 – 2.4 1 22 1 24 Moderately polluted, organic, color<br />
Chattahoochee River 325.2 4 5 0 9 N/A<br />
Crooked Creek<br />
Moderately polluted, organic<br />
Big Creek 324.8 – 0.5 3 19 2 24 Moderately polluted, non-lethal, inorganic<br />
317. – 3-2.2 2 9 0 11<br />
Chattahoochee River<br />
Sope Creek<br />
310.4 7 11 1 19 N/A<br />
Rottenwood Creek 308.5 – 1.2 0 13 4 17 Polluted, organic<br />
304.5 – 1.1 0 7 4 11 Polluted, organic<br />
Chattahoochee River 301.3 4 5 2 11 N/A<br />
a Number to left of dash is river mile of confluence; number to right of dash is location of tributary in miles upstream from confluence.
Table 4.5.g. List of macroinvertebrate taxa collected by kick net at various stations on tributaries to the middle Chattahoochee River (modified<br />
from Hess et al., 1981). Collections were made at multiple stations on Big and Suwanee creeks; only those stations within<br />
CRNRA boundaries are included here. "X" denotes presence.<br />
Taxa<br />
Ephemeroptera<br />
Isonychia<br />
Baetis<br />
Stenonema<br />
Paraleptophlebia<br />
Baetisca<br />
Hexagenia<br />
Plecoptera<br />
Isoperla<br />
Acroneuria<br />
Peltoperla<br />
Trichoptera<br />
Chimarra<br />
Cheumatopsyche<br />
Hydropsyche<br />
99<br />
CREEK<br />
Richland Crooked Dick Level Johns James Suwanee Big<br />
X<br />
X<br />
X<br />
X<br />
X<br />
X<br />
X<br />
Hemiptera<br />
Veliidae<br />
table continues X<br />
X<br />
X<br />
X<br />
X<br />
X<br />
X<br />
X<br />
X<br />
X<br />
X<br />
X<br />
X<br />
X<br />
X<br />
X<br />
X<br />
X<br />
X<br />
X<br />
X<br />
X<br />
X<br />
X<br />
X<br />
X<br />
X<br />
X<br />
X<br />
X
Odonata<br />
Argua<br />
Boyeria<br />
Progomphus<br />
Taxa<br />
100<br />
CREEK<br />
Richland Crooked Dick Level Johns James Suwanee Big<br />
Megaloptera<br />
Nigronia<br />
Coleoptera<br />
Hydrobius<br />
Donacia X<br />
Diptera<br />
Tipula<br />
Hexatoma<br />
Simuliidae<br />
Chironomidae a<br />
Tabanus<br />
X<br />
X<br />
X<br />
Isopoda<br />
Lirceus X<br />
Decapoda<br />
Procambarus X X X<br />
Gastropoda<br />
X<br />
Pelecypoda<br />
X<br />
Total Number of Different Taxa<br />
10 3 9 5 5 8 6 6<br />
DI+ b<br />
7.9 2.4 7.3 4.0 3.9 7.0 4.4 5.0<br />
a Chironomidae genera include Brillia, Cricotopus, and Polypedilum.<br />
b DI+ = Cairn’s Sequential comparison index.<br />
X<br />
X<br />
X<br />
X<br />
X<br />
X
Fish Contaminants and Fish Consumption Guidelines<br />
Unfortunately, some fish from certain areas of the state contain substances that prohibit the safe<br />
consumption of the fish in unlimited quantities. The Georgia Department of Natural <strong>Resources</strong><br />
collects and analyzes fish, including testing of fish tissue samples for some 43 constituents,<br />
including many metals, pesticides, herbicides, PCBs, and organic substances. Of the 43<br />
constituents, only PCBs and mercury have been found in fish at concentrations which create a<br />
fish consumption problem (EPD, 2000). Of approximately 1.2 million tons of polychlorinated<br />
biphenyls (PCBs) produced through 1980, an estimated 35 percent remains available in some<br />
compartment of the environment (Buell and Couch, 1995).<br />
Guidelines for eating fish from this reach of the Chattahoochee River basin appear in Table 4.5.h.<br />
This guidance is based on U.S. Environmental Protection Agency guidelines and combines<br />
historical fish tissue data with data from the 1995 fish tissue collection. The guides are revised<br />
each year if new data collected warrant a change.<br />
Table 4.5.h. Guidelines from the 2000 Georgia Sport Fishing Regulations and 2000 Guidelines<br />
for Eating Fish from Georgia <strong>Water</strong>s booklet (GADNR, 2000).<br />
Chattahoochee River Buford Dam to Morgan Falls Dam<br />
Species Recommendation Chemicals<br />
Brown Trout No Restrictions<br />
Rainbow Trout 1 meal per week Mercury<br />
Carp No Restrictions<br />
Spotted Sucker No Restrictions<br />
Largemouth Bass 1 meal per week Mercury<br />
Chattahoochee River - Morgan Falls Dam to Peachtree Cr<br />
Largemouth Bass No Restrictions<br />
Jumprock Sucker No Restrictions<br />
Brown Trout No Restrictions<br />
Carp 1 meal per month PCBs<br />
Reinert (1992) notes that scientists can detect contaminants in aquatic environments better, so we<br />
are better aware of the problems. He notes that although some of the more infamous contaminants<br />
such as DDT, PCBs, and mercury are still present, their concentrations do tend to be declining<br />
slowly in many places (Reinert, 1992).<br />
4.6 FLOODPLAINS, WETLANDS, AND RIPARIAN AREAS<br />
Floodplains and wetlands along the main river and its tributaries are small, given the basic<br />
geologic characteristics of the area, which do not provide broad flood zones. Nonetheless, the<br />
101
small floodplains play a vital role, to provide important bird/wildlife habitat, produce insects<br />
needed by fish, preserve native vegetation, maintain some wetlands for amphibians, and provide<br />
buffer zones for stream shading. These also functions protect water quality, moderate flooding,<br />
and therefore are essential for protecting water resources and the natural environment.<br />
In 1998, the CRNRA contracted for delineation of various layers of information for developing a<br />
geographical information system for the park, including the floodplains. Federal Emergency<br />
<strong>Management</strong> Agency’s (FEMA) data were used. This delineation was employed in the<br />
preparation of the maps of Figure 4.2.d and in the set of Appendix F maps of individual units.<br />
In the 1970s, the U.S. Army Corps of Engineers prepared reports on floodplains along the river<br />
and some major tributaries of the CRNRA (U.S. Army Corps of Engineers, 1973; 1974; 1978;<br />
and 1981). A key report is one on the floodplain from Buford Dam to Whitesburg that provides<br />
17 maps of the 100-year floodplain along the Chattahoochee River for the CRNRA reach of river.<br />
A 1974 report on Rottenwood Creek provides the same information for that stream.<br />
Wetlands include bogs, marshes, swamps, and associated ponded areas. The U.S. Fish and<br />
Wildlife <strong>Service</strong>, Georgia Department of Natural <strong>Resources</strong>, counties, and the Natural <strong>Resources</strong><br />
Conservation <strong>Service</strong> have various maps of wetlands, although frequently the scale of mapping is<br />
small. For this reason, the CRNRA will want to prepare some larger-scale maps of the main<br />
wetlands that occur within the CRNRA.<br />
5. RIVER FLOW DISTRIBUTION, WATER USE, AND WATER<br />
ALLOCATION<br />
5.1 DEMANDS FOR WATER SUPPLIES<br />
The Chattahoochee is the smallest river basin in the U.S. serving as the primary source of<br />
drinking water for a large metropolitan area. The Lake Lanier and Chattahoochee River system<br />
are the only large sources of water adequate to supply the Atlanta metropolitan area. The Atlanta<br />
area withdraws over 70 percent of its water supply from the Chattahoochee River and about 10<br />
percent directly from the Lake (Stevens, 1989). About 99 percent of the municipal and industrial<br />
water needs in the Chattahoochee River Basin come from surface waters. The crystalline aquifers<br />
in the area store and yield little water; therefore, ground water is not an important source of water<br />
supply (EPD, 1998a).<br />
By the 1960s it was evident that water supplies were not plentiful in the metropolitan area, and in<br />
1972 the Metropolitan Atlanta <strong>Water</strong> <strong>Resources</strong> <strong>Management</strong> Study (MAWRMS) developed a<br />
long-range plan for water supply management. Of special concern was the sporadic pattern of<br />
releases from Buford Dam. Large surges of water flow from the dam during electrical power<br />
generation on weekdays, while much less water is released on weekends -- when water supply<br />
demands are high. Also, when flow comes in surges, it is difficult to use for water supplies. The<br />
MAWRMS therefore focused on how to best manage these variable flows for water supply<br />
(Stevens, 1989). Recommendations were made that Buford Dam releases be managed to<br />
"enhance water supply availability." Therefore, in 1988, the U.S. Army Corps of Engineers<br />
“reallocated” 20 percent more of Lake Lanier’s water from hydropower production to water<br />
supply, to make more water available for water supply needs (ARC, 1998a).<br />
102
Atlanta's water supply projects started over a century ago. The city first installed a water<br />
treatment plant on the river in 1893, when it became evident that wells could not meet the<br />
growing demand for water. By the early 1900s, the demand grew rapidly, as summarized in the<br />
figures for the Atlanta <strong>Water</strong>works in Table 5.1.a.<br />
Table 5.1.a. Historic water demands at the intake of the Atlanta <strong>Water</strong>works (Carter and<br />
Herrick, 1951).<br />
YEAR MILLION<br />
GALLONS/DAY*<br />
1917 19<br />
1920 23<br />
1930 32<br />
1940 38<br />
1950 56<br />
* average daily pumpage<br />
As the metropolitan area's population grew, new water treatment plants were installed. The main<br />
plants along the river within the Chattahoochee River <strong>National</strong> Recreation Area are shown in<br />
Figure 5.1.a. and listed in Table 5.1.b. These plants supply water to Gwinnett, Fulton, DeKalb,<br />
and Cobb Counties, and to the City of Atlanta. A plant on Big Creek supplies water for Roswell.<br />
Table 5.1.b. Principal water treatment plants within the Chattahoochee River <strong>National</strong><br />
Recreation Area and amounts permitted on a monthly average (Atlanta Regional<br />
Commission 1998a,b). MGD = million gallons per day.<br />
Treatment <strong>Plan</strong>t Permitted Amount (MGD)<br />
Gwinnett County (Lake Lanier) 150<br />
Gwinnett County (Chatt. River) 0.3<br />
Buford (Lake Lanier) 2<br />
DeKalb County (Chatt. River) 140<br />
Roswell (on Big Creek) 1.2<br />
Cobb County (Chatt. River) 87<br />
Atlanta-Fulton <strong>Plan</strong>t 90<br />
Atlanta (intake above Peachtree Creek) 136.5 (Hemphill)<br />
64.9 (Chatt. <strong>Plan</strong>t)<br />
= 671.9 MGD<br />
Drinking water demands will increase as the population grows, especially in the subdivision<br />
communities in Gwinnett, Forsyth, Cobb, Hall, and Douglas counties. The projected combined<br />
municipal and industrial water demands on the greater Chattahoochee River basin are:<br />
• 446 MGD (million gallons per day) in the year 2000;<br />
• 480 MGD in the year 2010;<br />
• 493 MGD in the year 2020;<br />
• 494 MGD in the year 2030 (EPD, 1998a).<br />
103
Much of the demand for water is for residential use, and by the year 2050 the residential demand<br />
for water is projected to increase to 44 percent of the water demand in the Chattahoochee basin,<br />
with much of this demand in the Atlanta area (EPD, 1998a). Most water is not "consumed," since<br />
about 82 to 85 percent is returned to the river as treated wastewater (EPD, 1998a).<br />
The 1977 Surface <strong>Water</strong> Amendments to the Georgia <strong>Water</strong> Quality Control Act of 1964 require<br />
all "non-agricultural" users of more than 100,000 gallons per day on a monthly average (from<br />
surface water) to obtain a permit from the EPD for their withdrawal (EPD, 1998a). About a<br />
dozen such permitees draw water from the river and its tributaries in the CRNRA reach, including<br />
golf clubs, athletic clubs, and some small industries. Most of these non-municipal permits are for<br />
relatively small amounts (for example, the Cherokee Town and Country Club takes up to 0.72<br />
MGD from Bull Sluice Lake). Only two of these non-municipal permitees use over a million<br />
gallons per day in the general CRNRA vicinity, namely:<br />
Facility<br />
Fuji Development USA, Ltd<br />
(on Big Creek)<br />
Riverfarm Enterprises, Inc<br />
(on Johns Creek)<br />
24 hr Max (MGD)<br />
104<br />
Mo. Avg<br />
County<br />
2.0<br />
(MGD)<br />
1.0 Fulton<br />
1.15 0.5 Fulton<br />
The complete list of water use permits along the river is available from the state Environmental<br />
Protection Division in their River Basin <strong>Management</strong> <strong>Plan</strong> (EPD, 1998a). Other detailed water<br />
supply information is available in ARC reports (ARC, 1998a,b). Appendix C provides a list of the<br />
primary drinking water quality standards.<br />
Many of the metropolitan area counties have adopted water conservation techniques, including<br />
ordinances for low-flow household plumbing in new construction, limits on outside watering<br />
during the summer, progressive water rates to reduce use, and conservation education (EPD,<br />
1998a).<br />
5.2 TRI-STATE WATER ALLOCATION AND THE CRNRA<br />
Introduction<br />
The severe droughts in northern Georgia during 1981, 1986, and 1988 focused public attention<br />
and concern about water shortages and made water a hot political topic. In 1990 the State of<br />
Alabama filed suit to prevent the Corps of Engineers from reallocating water for increased water<br />
supplies for metropolitan Atlanta; Florida later joined the suit as well. The three states and the<br />
Corps of Engineers then signed an agreement, which initiated a Comprehensive Study (or
105
ACT/ACF Study), launched in 1991. The parties involved cooperatively developed or placed<br />
under contract, a number of detailed scopes of work to generate the majority of the information in<br />
the study (EPD, 1998a; Word, 1993).<br />
The Comprehensive Study’s goals were to project water demands through 2050; estimate the<br />
water availability to meet the demands; and develop management options to meet the demands<br />
(EPD, 1996). In spring, 1997 the three states approved separate Interstate Compacts, which<br />
established the legal and functional basis for future management of the Apalachicola-<br />
Chattahoochee-Flint (ACF) as well as the Alabama-Coosa-Tallapoosa (ACT) (EPD, 1998a).<br />
Goals and Procedures<br />
The Apalachicola-Chattahoochee-Flint (ACF) River Basin Compact Commission is developing a<br />
<strong>Water</strong> Allocation Formula for the ACF River Basin, to provide an equitable sharing of water<br />
within the basin among the States of Alabama, Florida, and Georgia. [Allocation formula is<br />
defined as the methodology by which the Commission determines an equitable apportionment of<br />
surface waters” (GA General Assembly, 1992)]. The Compact specifies that the States must<br />
reach a consensus on a water allocation formula, "by the end of 1998" (now extended) (Corps of<br />
Engineers, 1998a). Once a formula is selected, decisions must be made on how reservoirs will be<br />
regulated to provide the required flows. Buford Dam will play a significant role in how the<br />
Chattahoochee River flow patterns and water volumes are to be allocated and controlled. The<br />
dam management dictated by the eventual allocation formula will obviously directly affect the<br />
river within the <strong>National</strong> Recreation Area.<br />
Environmental Impact Statement<br />
An Environmental Impact Statement (EIS) is being prepared as well, which is coordinated by the<br />
Corps of Engineers and involves 10 cooperating agencies, including the NPS. The final draft of<br />
the EIS was reviewed in early 1999. The EIS will significantly influence the decision<br />
on the allocation formula by the ACF Compact Commissioners. The EIS considers a range of<br />
flow conditions --low, moderate, or high-- and presents an Evaluation Framework. The<br />
framework covers the range of flow conditions, including the condition which an eventual<br />
allocation formula will define (Corps of Engineers, 1998b). The EIS also considers the effects of<br />
an eventual allocation formula on the river reach within the CRNRA, particularly on the topics of<br />
water-based recreation, fishing, and water quality.<br />
A number of actions for the ACF allocation project and EIS have been underway in 1999,<br />
including:<br />
• the finalizing of the EIS for the project;<br />
• the first round of decisions on the water allocation formula;<br />
• the reviews of the formula by the States and the Federal Commissioner, with<br />
concurrence on the formula, and implementation of the water supply reallocations-with<br />
volumes projected to the year 2020 (Corps of Engineers, 1998a, b).<br />
[According to Corps of Engineers as of summer 1999, the EIS schedule is extended by<br />
about a year, with the Final EIS to be published in the spring of 2000, to allow a<br />
decision by the Federal Commissioner sometime later in 2000].<br />
106
As Riverkeeper has pointed out, there will be a critical need to follow up once the allocation is<br />
determined, with a process known as Adaptive <strong>Management</strong>. This process asserts that it is<br />
necessary to predict, mitigate, implement, monitor, and adapt our environmental decisions. A<br />
post-formula monitoring plan, and data collection would provide a field validation (or<br />
invalidation) of the allocation formula, to see if mitigation strategies, management actions, or<br />
course corrections are needed. Funds will be needed for this work. The USGS is seeking funding<br />
to devise such a monitoring plan (River Chat, summer 1998).<br />
Optimal Flows for Recreation<br />
The NPS needs to understand the relationships between river flows, water quality, and<br />
opportunities for river-based recreation. Fishing, swimming, and floating are the main broad<br />
categories of recreational activities, which includes a wide range of pursuits, including canoeing,<br />
kayaking, rafting, wading, rowing, streamside relaxing, streamside hiking, etc. Each activity has<br />
its particular demands for such features as water depths, bottom conditions, or streamside<br />
character. CRNRA wants to be able to predict how changes in flow regimes will affect<br />
recreation, so that park managers can predict changes in the quality, safety, or abundance of<br />
recreational experiences under various flow regimes.<br />
The Physical Habitat Simulation System (PHABSIM) model, developed by the U.S. Fish and<br />
Wildlife <strong>Service</strong>, is one of the tools used to perform the instream flow studies for fish and for<br />
water surface recreation. The PHABSIM model was originally based on the concept that fish<br />
prefer certain combinations of water depth, velocity, and cover. The model has been extended<br />
evaluate river-borne recreational activities with depth and velocity. For example, a canoeist needs<br />
a minimum depth and velocity, but excessive depths and velocities are hazardous. Suitability<br />
Criteria define the appropriate hydraulic conditions (Corps of Engineers, 1998b).<br />
PHABSIM analyses are typically presented in terms of Weighted Useable Area (WUA), defined<br />
as the surface area of river (square feet) which is available for either a target fish species or<br />
recreational activity. The Corps’ evaluations for optimum flows in the river within the<br />
Recreation Area are based on their work in 1984 to 1985, which is shown in Table 5.2.<br />
Table 5.2a. Generalization of the “optimal flows” as defined by Corps of Engineers in<br />
1985 for recreational activities in the Chattahoochee River from Buford<br />
Dam to Peachtree Creek (Corps of Engineers, 1998b) based on the work<br />
of Nestler et al. (1984).<br />
ACTIVITY OPTIMAL FLOW<br />
cubic feet per second<br />
Novice preferred rafting 1,250-1,750<br />
Novice rafting 3,500-5,000<br />
Wading 1,500<br />
Novice canoeing 1,500-2,000<br />
Mid-level canoeing Maximum 7,000<br />
Wade fishing At or below 750<br />
Tube fishing At or below 1,000<br />
Low-power boat fishing 2,500-5,000<br />
Non-power boat fishing 1,500<br />
107
The Corps’ HEC-5 and related water quality models were used to predict the flows and simulate<br />
the conditions that would exist in the rivers and reservoirs of the basin under alternatives<br />
evaluated. HEC-5 accounts for surface water at various locations in a river basin over a period of<br />
time, and simulates conditions and evaluates the potential impacts of alternative ways to manage<br />
reservoirs. HEC-5 looks at: (i) municipal and other demands; (ii) dam power generation; (iii)<br />
questions of minimum flows for wastes or for navigation (Corps of Engineers, 1998b; McMahon<br />
& Stevens, 1995). The related HEC-5Q model simulates stream flow and water quality, so<br />
changes in streamflows and in wastewater discharges can be assessed.<br />
Some NPS Concerns, Questions, and Needs<br />
In early 1999, several <strong>National</strong> <strong>Park</strong> <strong>Service</strong> water and natural resource specialists in the SE<br />
Regional Office, the CRNRA, and the <strong>Water</strong> <strong>Resources</strong> Division, reviewed the September, 1998<br />
draft environmental impact statement (DEIS) for the water allocation for the ACF basin. They<br />
raised concerns and questions about the DEIS, which are condensed and paraphrased below.<br />
Poor Attention to the CRNRA: The most serious concern about the DEIS perhaps is a<br />
philosophical one, well stated by one of the reviewers:<br />
“…the EIS does a poor job of presenting the importance of the CRNRA to the regional<br />
economy and recreational opportunities. The CRNRA is a congressionally-mandated<br />
park with very specific requirements for management and protection… As written now,<br />
it is difficult for a reader –without local knowledge of the park-- to know if the park<br />
exists and may be potentially impacted by the implementation of the allocation<br />
formula” (Hansen, 1999).<br />
Inadequacy of the River Recreational Data and Studies: Concern is raised that the DEIS relies<br />
almost entirely on one study, i.e., the work of Nessler et al. (1984). Their actual data were from<br />
1977 to 1982, meaning that two-decade old data have been used to analyze the CRNRA, where<br />
the population has grown about 50 percent since those old data were collected. As one NPS<br />
reviewer notes, “it is incomprehensible that the NPS (should have) … only an antiquated<br />
snapshot in time on which to base management decisions (about river recreation)” (Spencer,<br />
1999).<br />
Another reviewer points out that for older sports (e.g., canoeing), the old data may still be<br />
applicable, but that for more recently popular sports (e.g., kayaking), new data may be important<br />
(Tilmant, 1999). In short, the existing data are inadequate to evaluate impacts on the CRNRA.<br />
Some Possible PHABSIM Limitations: As some reviewers noted, the PHABSIM model has<br />
limitations, since the “weighted useable area” (WUA) is only a measure of resource potential, not<br />
of actual user demand for an activity at a given level of river flow. Therefore, it is argued, the<br />
amount of WUA per se may have little effect on recreational use (Spencer, 1999). Another NPS<br />
person points out that the use of WUA would be limited, but may not be a point of concern if<br />
CRNRA can live with the river flow values shown in Table 5.9 (which are not WUA, but river<br />
discharges) (Tilmant, 1999).<br />
Specific Flow Concerns: One NPS reader notes that some inaccuracies exist in the optimal flows<br />
in the Nesler study (summarized in Table 5.2). The levels presented as “acceptable” for certain<br />
activities are not always precise enough, and that an error of a few hundred cubic feet per second<br />
of flow can be the difference between acceptable and risky, in some instances. The table data<br />
also do not distinguish different reaches of the river adequately (Spencer, 1999). It also is pointed<br />
108
out that some particular table flow values seem to be in error (Tilmant, 1999). In summary, the<br />
study was not exact enough to cover the variety of river reaches and conditions.<br />
The NPS Regional Office and the Recreation Area have strongly recommended that a study of<br />
current recreational use at CRNRA be conducted, and the results incorporated into a revised EIS.<br />
The NPS is cooperating with the Corps of Engineers in late 1999 to gather more information on<br />
"recreation flow preferences of river recreationists. An abstract of this study is shown in<br />
Appendix A. No doubt additional work will still be needed on the physical flow aspects of<br />
recreation flows.<br />
<strong>Water</strong> Supply Demands vs Variability: The Corps seems to place prime emphasis on meeting<br />
water supply demands, with little consideration on the variability of streamflow. The spatial and<br />
temporal variability also determines whether or not a river flow is similar to natural conditions.<br />
Riverine biodiversity relates to streamflow variability. The DEIS indicates that the Chattahoochee<br />
River is managed for trout fisheries. However, the CRNRA needs to clarity if the park goal also is<br />
to maintain a “natural” aquatic community, or only to support a secondary trout fishery (Tilmant,<br />
1999; Hansen, 1999).<br />
5.3 IMPACTS OF DAMS AND LAKE LANIER ON THE CRNRA<br />
The Dams and Lakes of the <strong>National</strong> Recreation Area and Vicinity<br />
Buford Dam and its impoundment, Lake Lanier, mark the upper end of the <strong>National</strong> Recreation<br />
Area. The Corps of Engineers has operated Buford Dam and managed Lake Lanier since 1957.<br />
The dam, at RM 348.3 from the Chattahoochee’s mouth, provides power generation, recreation,<br />
flood control, water supply, and boating. At the top of the flood control pool elevation, the lake<br />
contains 47,182 acres of surface and 2,554,000 acre-feet of storage, with 637,000 acre-feet<br />
reserved for flood control (Corps of Engineers, 1998). Some other details are shown in Table<br />
5.3.a.<br />
The dam was planned, designed, and constructed in the 1950s, emphasizing flood control,<br />
hydropower, navigation, and water supply/quality flows for the metropolitan Atlanta area.<br />
However, in 1989, the Corps recommended a “reallocation” of water storage in the lake from<br />
hydropower use to water supply use (McMahon and Stevens, 1995). In recent decades, recreation<br />
has assumed a much greater importance at the lake as well as downstream along the river in the<br />
CRNRA.<br />
Buford Dam and releases from the lake normally dominate the flows in the river within the<br />
CRNRA. The maximum discharge rate from Buford Dam during peak power generation is about<br />
8,400 cfs (EPD, 1998a). Each period of hydroelectric power generation moves water downstream<br />
in the form of a surge or pulse, as is shown in Figures 4.2.a and b, and discussed in Section 4.2.<br />
The reservoir is large enough to hold back floods of all return intervals up to 500 years, without<br />
activating the emergency spillway. The peak discharge is 12,000 cfs for all floods having return<br />
intervals between 10 and 500 years (Corps of Engineers, 1998b).<br />
The much smaller and older Morgan Falls Dam also lies within the CRNRA, 36 miles below<br />
Buford Dam (Figure 2.2.b). It serves to re-regulate Buford releases and helps in maintaining the<br />
required flow of 750 cfs for the Atlanta area. The impounded water, known as Bull Sluice Lake,<br />
contains only about 580 acres in area, with officially 2,250 acre-feet of total storage (Corps of<br />
109
Engineers, 1998b). However, the lake is significantly loaded with sediment, making the actual<br />
storage less.<br />
In the 1980s, a “re-regulation” dam was proposed and considered, but not built, at a location 6.3<br />
miles below Buford Dam. The location was analyzed, and initial designs were developed for the<br />
dam and dam site. The re-regulation dam’s purpose would be to catch water released from<br />
Buford Dam during peak power production, then release the water slowly to provide for an<br />
increased water supply for Atlanta (in other words, the surges going past could be caught and<br />
released between surges) (Corps of Engineers, 1987). Concerns, however, were raised about the<br />
potential effects of the re-regulation dam on water quality, particularly since the dam could raise<br />
water temperatures at critical times in the summer, according to the models. Metal concentrations<br />
also could be increased at times, while dissolved oxygen levels might be lowered (Zimmerman<br />
and Dortch, 1988). From a water quality and aquatic biology perspective, the re-regulation dam<br />
therefore would likely be disadvantageous.<br />
Table 5.3.a. Mainstem dams and reservoirs within the CRNRA, (modified from Corps<br />
of Engineers, 1999b; Couch et al., 1996).<br />
DAM/LAKE OWNER/<br />
DATE<br />
COMPLETED<br />
Buford/<br />
Lake Lanier<br />
Morgan Falls/<br />
Bull Sluice<br />
Lake<br />
Corps/<br />
1957<br />
Ga Power/<br />
1903<br />
MAIN<br />
USES*<br />
FC,N,<br />
P,R,<br />
WS,<br />
FW<br />
RIVER MILE/<br />
LAKE<br />
ELEVATION<br />
mi. 348.3/<br />
1,071 ft<br />
P,WQ mi. 312.6/<br />
866 ft<br />
110<br />
DRAINAGE<br />
AREA<br />
(SQ MI)<br />
SURFACE<br />
AREA*<br />
(ACRES)<br />
TOTAL<br />
RESERVOIR<br />
STORAGE<br />
(ACRE-FT)<br />
1,040 38,024 1,917,000<br />
1,340 580 2,250<br />
*Main uses: FC = flood control; N = navigation; P = power; R = recreation; WS = water supply; WQ =<br />
water quality; FW = fish and wildlife.<br />
<strong>Water</strong> Quality at Lake Lanier<br />
<strong>Water</strong> levels or water quality within Lake Lanier itself are not a CRNRA concern per se.<br />
However, the quantity, quality, and pattern of the water released by the dam greatly affect the<br />
CRNRA. The water quality of the lake, as well as the dam operation therefore are highly<br />
important to the CRNRA and to those municipalities depending on the river for their water<br />
supply.<br />
Over the years, recreation on Lake Lanier has grown rapidly, to about 7 million visitors annually.<br />
The lake has 76 recreational areas, 49 parks, and 10 marinas managed by the Corps of Engineers,<br />
plus areas leased to county, city, and private entities (Corps of Engineers, 1997). Recreation<br />
therefore has become a major priority for managing the lake. More people come to visit the lake<br />
than any other federally managed reservoir in the country. Over 12,000 homes surround the<br />
reservoir, and 20,000 boats are parked at 6,700 docks. An estimated $422 million was spent<br />
recreating at the lake in 1990, while less than 1 percent of that amount is earned annually by<br />
hydropower generation (Collier et al., 1996).
The high numbers of boats, septic tanks, and other potential pollution sources on and near Lake<br />
Lanier pose a clear potential for water pollution. The myriad sources of pollution around or on<br />
Lake Lanier include:<br />
• Land-application systems for waste disposal by the poultry production industry<br />
(some major poultry producers operate with limited open land for waste disposal);<br />
• Wastewater treatment for several towns (some concern also over metals from these<br />
as well);<br />
• Industrial sites;<br />
• Cattle raising, dairy farming, and other agricultural non-point sources;<br />
• Land and streambank erosion, with nutrients and metals attached to sediment;<br />
• Lake shoreline erosion;<br />
• Urban runoff from some sites; suburban runoff (pesticides and fertilizers);<br />
• Inadequately designed or malfunctioning septic tanks and landfills;<br />
• Beach, boat marina, and auto repair shops;<br />
• Boats on the lake with potential sewage leaks or dumps;<br />
• Boat fuel impacts (many boats have 2-cycle engines which pollute water and are<br />
toxic to food webs and can taint fish and water (Hatcher, 1992; River Chat, 1997;<br />
Brouckaert et al., 1997).<br />
Lake Lanier only partially supports its designated use of recreation, because of elevated levels of<br />
mercury and lead in some parts of the lake. Presumably the lake’s bottom sediments have<br />
accumulations of metals from historic pollution (EPD, 1998a).<br />
A number of organizations participate in water quality monitoring and conservation at or around<br />
the lake, with the principal ones listed in Table 5.3.b. <strong>Water</strong> quality standards were adopted for<br />
Lake Lanier in January, 2000.<br />
Table 5.3.b. Some organizations participating in water quality monitoring and conservation at<br />
or around Lake Lanier. (Corps of Engineers, 1987 and 1997; Topper, 1992;<br />
Hatcher, 1992).<br />
ORGANIZATION(S) ROLE(S)<br />
State Environmental<br />
Protection Division (EPD)<br />
Issues permits for <strong>National</strong> Pollutant Discharge Elimination System<br />
(NPDES), to authorize discharges from wastewater treatment<br />
facilities<br />
County environmental Issue permits for septic tanks and other underground discharges of<br />
health offices + Corps wastewater (keep septic tanks above 1085’ MSL)<br />
Corps, supporting EPD Controls boats for removal of sewage at marine pump-out stations<br />
Corps, supporting EPD Monitors fecal coliforms; swimming beach monitoring<br />
State EPD Conducts lake and stream monitoring on and around lake for<br />
University of Georgia;<br />
other colleges<br />
common chemical and physical parameters<br />
Have carried out EPD contracts for monitoring<br />
Have conducted research<br />
111
Dam Effects on <strong>Water</strong>s in the CRNRA<br />
Lake Lanier undergoes thermal stratification during the summer, with warm surface waters<br />
overlying colder bottom waters. The stratification limits the mixing between these two thermal<br />
layers. Oxidation processes occur in the cold bottom waters, and as a result, the oxygen<br />
concentration becomes more reduced and under-saturated as stratification progresses.<br />
Therefore, low DO concentrations occur in the bottom water at certain seasons. Power generation<br />
at the dam then withdraws cold water from the lower depths, which results in low DO in the river<br />
below the dam. During the usual fall, lake “turnover” (when the stratification is broken), the lake<br />
becomes mixed. The Buford Dam releases strongly affect the temperatures in the river in the<br />
upper end of the CRNRA, with:<br />
• a cooling effect on river temperatures during March to September; and,<br />
• a warming effect during the months of December and January (EPD, 1998b).<br />
These colder temperatures support the coldwater, secondary trout fishery in the stretch below the<br />
dam. Figure 5.3.a shows the water temperatures and the fluctuations in temperatures that occur<br />
when power is generated.<br />
At Paces Ferry, which is at the lower edge of the Recreation Area, the temperature effects of<br />
Buford Dam have dissipated, and the temperatures more closely resemble a natural pattern (EPD,<br />
1998b).<br />
The Buford Dam also strongly influences the dissolved oxygen (DO) levels in the river in the<br />
upper reaches of the Recreation Area. Figure 5.3.b illustrates how the DO levels decrease over<br />
the warm months as thermal stratification depletes DO in deeper levels of the lake, and water is<br />
released in the tailwater. This process affects DO levels in the Chattahoochee mainstem for about<br />
20 miles downstream, to about river mile 328. By the time the water leaves Bull Sluice Lake, at<br />
about RM 312, the DO level in the mainstem has returned to typical levels for a river (Burke et<br />
al., 1997).<br />
In addition to the temperature and DO impacts, the Buford Dam tailwater also contains elevated<br />
levels of iron and manganese at times. Since the lake is known to contain metals attached to<br />
sediment, the bottom waters of the lake presumably are in contact with these metals. The metals<br />
are a concern from the viewpoint of fisheries, aquatic biology, and fish consumption<br />
(consumption limits are given in Table 4.5.h, and metals are discussed in Section 6.2).<br />
5.4. ISSUES RELATED TO RECREATIONAL DEMANDS<br />
Overview<br />
The CRNRA provides access to nature for millions of people in the Atlanta area, who fish, canoe,<br />
kayak, bicycle, bird-watch, picnic, jog, swim, socialize, or simply enjoy the out-of-doors in the<br />
16 units of the <strong>National</strong> Recreation Area. Unfortunately, the “deficiency of open space” is as<br />
much as 27,000 acres for the eight-county Atlanta metropolitan area, according to one estimate in<br />
1989 (CRNRA, 1989); presumably in 1999, the open-space shortfall is even greater. Demands<br />
for recreation grow with the population, and park visitation has increased accordingly:<br />
• 1985, 1.5 million; 1990, 1.7 million; and presently about 3 million per year and<br />
growing (CRNRA, 1999).<br />
112
Degrees C<br />
Figure 5.3.a. <strong>Water</strong> temperatures in tailwater releases from the Buford Dam (from Burke et al.,<br />
1997).<br />
DO Mg/L<br />
July 1 Sept 24<br />
July 1<br />
Figure 5.3.b. Dissolved oxygen levels in the river decrease as water is released from deeper lake<br />
levels by Buford Dam during the late summer-fall period (from Burke et al., 1997).<br />
113<br />
Sept 24
The CRNRA provides picnic sites, parking, nature trails, jogging trails, open spaces, river access<br />
points of various types, wading sites, and other facilities. A park concessionaire continues to<br />
provide rafting, canoeing, kayaking, and related rentals at the Johnson Ferry and Powers Island<br />
units, and provides shuttle service for the public, thus minimizing parking and traffic problems<br />
(CRNRA, 1995 and pers. com., 1999).<br />
Heavy recreational demands pose challenges for NPS, including how to:<br />
• assure river water quality that is uncontaminated for visitors;<br />
• keep stream banks and access points safe for river floaters and boaters;<br />
• provide suitable warnings about rapid river flow changes below Buford Dam;<br />
• protect against sewage spills or accidents that pose health risks to visitors; keep<br />
visitors informed of these incidents;<br />
• monitor the river for basic information (e.g., floods, sewage spills) and to alert<br />
visitors; and<br />
• reduce streambank erosion to a minimum.<br />
Reasons for <strong>Park</strong> Visitation<br />
A Clemson University study in 1994 investigated the main reasons why people visit the CRNRA,<br />
and Table 5.4.a summarizes these main reasons. Typically a visitor had several goals for coming<br />
to the park, but “view scenery” was the most frequent response, among others. The survey<br />
shows a strong public interest in preserving the environment along the river and in nature<br />
appreciation.<br />
Table 5.4.a (part 1). Reasons in 1994 which interviewees cited for visiting the<br />
CRNRA, ranked by "order of importance" to the interviewees<br />
(Hammitt et al., 1994). [Note that an interviewee typically gave<br />
more than one reasons for visiting; therefore, several activities<br />
are normally important to a visitor].<br />
Order Activity Order Activity<br />
1. View scenery 10. Ride bike<br />
2. Walk or jog trails 11. See cultural site<br />
3. See wildlife, flowers 12. Play games<br />
4. Birdwatch 13. Fish<br />
5. Show friends park 14. See history<br />
6. Study nature 15. See visitor center<br />
7. Take children out 16. Swim<br />
8. Picnic 17. Ride in car<br />
9. Float river 18. Attend festival<br />
The study also yields some insights from a water resource perspective. The respondents<br />
“strongly agreed” that nature is important. Therefore, the river is not just a site for swimming,<br />
floating, or fishing, but also perceived as a “natural area.” This shows the public’s appreciation<br />
of habitat and riparian area protection and implies their appreciation for pollution control or other<br />
actions to protect the natural environment.<br />
114
A similar recreation study (with somewhat different questions) was completed at the CRNRA in<br />
1998 (Littlejohn, 1998). The results are similar to those of 1994, as shown in Table 5.4.a (part 2).<br />
Table 5.4.a (part 2). Reasons in 1998 which interviewees cited for visiting the CRNRA,<br />
ranked by order of importance to the interviewees (Littlejohn, 1998)<br />
[Note that an interviewee typically gave more than one reason for<br />
visiting; therefore, percentages cannot be added].<br />
Order Activity Order Activity<br />
1. Walk/hike (53%) 7. Picnic (10%)<br />
2. Exercise (52%) 8. Fish (6%)<br />
3. View scenery (39%) 9. Do water sports<br />
(4%)<br />
4. View wildlife (24%) 10. Do group sports<br />
(2%)<br />
5. Exercise pets (20%) 11. Other (7%)<br />
6. Bicycle (10%)<br />
Amenities and <strong>Service</strong>s by Unit<br />
The principal recreational amenities or activities of the park units are summarized in Table 5.4.b.<br />
Table 5.4.b. Main recreational activities or amenities at the park units within the CRNRA<br />
(where "X" is a common activity or amenity).<br />
Unit Raft Swim Canoe Kayak Ramp<br />
Access<br />
115<br />
Boats<br />
w/<br />
motors<br />
Fishing<br />
Other<br />
Bowmans Island X X (1) X<br />
McGinnis Ferry X<br />
Suwanee Creek X<br />
Abbotts Bridge X X X X X<br />
Medlock Bridge X X X X X<br />
Jones Bridge X X X X X X<br />
Holcomb Bridge X X X<br />
Island Ford X X X X<br />
Vickery Creek X X<br />
Gold Branch X wildlife(2)<br />
Johnson Ferry X (rent) X(rent) (rent)X X X<br />
Cochran Shoals X X X birding(2)<br />
Powers Island X (rent) X(rent) (rent)X X "step-down" ramp X<br />
Palisades X X<br />
Notes: (1) = Corps of Engineers' ramp; (2) may occur in any unit, but common at these;<br />
"(rent)" = rental facilities available at these sites
Optimal Recreational Flows<br />
A key study by Nesler et al. in the 1980s categorized the water-based recreation activities in<br />
terms of their river discharge needs. These activities are given in Table 5.4.c.<br />
Table 5.4.c. Summary of water-based recreation (Nestler et al., 1984).<br />
Activity Notes*<br />
Canoeing and Novice canoeists prefer smaller depths and velocities;<br />
kayaking<br />
experienced persons can tolerate > 4’ depths<br />
Rafting Includes novice (flows < 1500 cfs generally) to mid-level<br />
rafting (they desire higher flows). In areas concessionaires rent<br />
rafts, provides shuttle. This is more “social rafting,” not whitewater<br />
rafting.**<br />
Raft-landing Rafters like to have space to land and socialize, on shoals,<br />
sandbars, or banks (lower flows desired by this group, to have<br />
landings, but can go to 2000 cfs in some places).<br />
Relaxing or Banks and rocks used for socializing, sunbathing, nature<br />
Hanging out appreciation, etc.<br />
Wade-fishing and Lower discharges preferred. These two are similar in their<br />
tube-fishing requirements (prefer discharges < 1000 cfs, best at below 750).<br />
Can be in shoal areas.<br />
Non-power boat Lower discharges preferred. May be canoes or small boats near<br />
fishing<br />
boat ramps (can tolerate > 1000 cfs; best at ~ 1500).<br />
Low-power boat<br />
fishing<br />
Can tolerate more discharge than the non-power group.<br />
Bank fishing May be associated with wade fishing.<br />
<strong>Water</strong> contact Shoal areas of depths about 1.5 - 3' or some runs during lower<br />
wading<br />
flows needed for the most part.<br />
Swimming May tie to various activities above.<br />
*Note also that discharge values were summarized in Table 5.2.<br />
**over 15,000 rafts/summer rented (Hammitt and Bixler, 1985)<br />
Use of PHABSIM<br />
Levels of river flow and fluctuations in flow are critical from a recreational perspective. In the<br />
1980s, the Fish and Wildlife <strong>Service</strong> and Corps of Engineers assessed the relation of flow<br />
conditions on the river to recreational activities (Nestler et al., 1984). The investigators used the<br />
Physical Habitat Simulation Model (PHABSIM), which simulates water depth and velocity for<br />
reaches and makes it possible to relate flow to recreation potential. The Corps used this 1980s<br />
data as its key reference in its Recent DEIS for the Chattahoochee River for the tri-state allocation<br />
effort (Shelby et al., 1992; Nestler et al., 1984).<br />
The information in Table 5.4.c. is drawn from the Nestler et al. study. Nestler et al. present data<br />
for wading, angling, canoeing, and rafting, using the PHABSIM analyses to define the<br />
relationships between river flow levels and recreation activities. [Note: The PHABSIM and<br />
Nestler study limitations are discussed in Section 5.2 on water allocation).<br />
116
The CRNRA clearly needs fresh data on:<br />
• models for water-based recreation/streamflow relations;<br />
• the economics of river-based recreation;<br />
• the future demands of river-based recreation.<br />
At this time, only 15+ year old observations and research are available for interpreting<br />
flow/recreation relations at the CRNRA. Essentially no information exists on the economics of<br />
river-based recreation in the area (the Corps and others have basically only considered lakes in<br />
recreational analyses). Future demands on river recreation have not been adequately studied, so<br />
good planning is difficult. Section 5.2 discusses a study planned for late summer 1999 on<br />
"recreational flow preferences," and an abstract of that study appears in Appendix A.<br />
Recreation's Concerns over Pollution<br />
The water-based recreational activities relate directly to water resource issues, such pollution.<br />
Table 5.4.d. summarizes these relationships and dependencies.<br />
Table 5.4.d. Recreation activity categories as they relate to key water resource issues in the<br />
CRNRA. The importance of the relationship is listed as highly or moderately<br />
important (high, mod). This table is modified from portions of two tables in the<br />
Resource Protection Study for the Recreation Area (CRNRA, 1982). The x axis<br />
items are the activities, and the y axis items are water issues, as explained briefly<br />
at the bottom of the table.<br />
<strong>Water</strong> quality<br />
problems<br />
River channel<br />
impacts<br />
River flow<br />
conditions<br />
River bank<br />
problems<br />
Tributaries’<br />
impacts<br />
Ground water<br />
effects<br />
Floating<br />
(rafts,<br />
canoes, etc)<br />
Fishing<br />
(bank,<br />
wade)<br />
117<br />
<strong>Water</strong><br />
Contact<br />
Social,<br />
Relaxing<br />
Nature<br />
Appreciation<br />
high high high high mod<br />
high high mod high high<br />
high high high mod mod<br />
mod high mod mod mod<br />
high high high mod high<br />
high mod high mod mod<br />
Explanations of y axis above:<br />
• <strong>Water</strong> quality: pollution problems, such as elevated fecal coliforms; streams that do not “support”<br />
recreation.
• River channel: erosion, channel changes, with changes in pools, bars, shape (dam releases, the effects<br />
of urban runoff could change river channels).<br />
• River flow: discharge levels and fluctuations (mainly a function of Buford Dam).<br />
• Riverbanks: sloughing, erosion, trees falling in (urbanization impacts could cause this).<br />
• Tributaries: contributions of sediment and pollutants (urbanization effects)<br />
• Ground water: possible pollutants from septic tanks.<br />
Pathogen Concern<br />
<strong>Water</strong> contamination is a special concern for water recreation. As the Atlanta Regional<br />
Commission points out, heavy recreational use in the CRNRA makes it imperative to maintain<br />
the waters at “fishable and swimmable” levels. ARC emphasizes the need for better water<br />
structural and land use controls to decrease bacteria and other pathogens in runoff (ARC, 1992b).<br />
High levels of fecal coliforms are a common occurrence in urban areas of the Southeast. In<br />
places coliform levels are often dozens or hundreds of times over the limits that health authorities<br />
deem safe. Recreationists who contact polluted water or who handle polluted fish can contract<br />
ailments. Viruses, protozoa, and bacteria cause a variety of water-borne diseases, such as<br />
gastroenteritis, hepatitis, respiratory illness, salmonellosis, E. coli infections, giardiasis, skin<br />
rashes, “pink eye,” and various ear, nose, and throat problems.<br />
A better technique is needed to evaluate the sources and seriousness of the fecal coliforms found<br />
in the CRNRA streams. The CRNRA and U.S. Geological Survey currently are conducting a<br />
cooperative project to investigate the severity of microbial contamination in the waters of the<br />
CRNRA and to seek better methods for differentiating human contamination from other impacts,<br />
using both bacterial and chemical indicators (USGS, 1999). An abstract of this investigation<br />
appears in Appendix A.<br />
6. WATERSHED DEVELOPMENT AND IMPACTS<br />
6.1 CONTAMINATION, PATHOGENS, AND SEWAGE POLLUTANTS<br />
Introduction<br />
Contaminants, pathogens, and urban pollutants in the streams of the CRNRA can flow in from<br />
sewage leaks, sewer system overflows, or in water that has bypassed treatment facilities.<br />
However, many of the same pollutants can come from urban surface runoff, that is, non-point<br />
source pollution from lawns, shopping centers, roads, and other surfaces. Septic system seepage<br />
can sometimes occur. A few headwaters have some livestock pollutants.<br />
As noted by Johnson (1995), “Urban (non-point) runoff almost always exceeds public health<br />
standards for water contact recreation…” Common contaminants in the urban runoff includes<br />
sediment, nutrients, pathogens, metals, herbicides, pesticides, and warmed water.<br />
Sewage Treatment Facilities and Pipelines<br />
Several sewage treatment facilities are found within the CRNRA reach of the Chattahoochee<br />
River. The principal facilities are shown in Figure 6.1.a, and Table 6.1.a. provides some<br />
information on the volumes of wastewater permitted at the facilities. In addition, the City of<br />
118
Sugar Hill applies treated effluent to the land in Gwinnett County, at the Sugar Hill Golf Club<br />
that abuts the Bowmans Island Unit of the CRNRA.<br />
Table 6.1.a. Major municipal wastewater treatment plant discharges having permitted<br />
monthly average flows greater than 1 MGD in the CRNRA portion of the<br />
Chattahoochee River basin (taken from EPD, 1998a). (see also Figure 6.1.a).<br />
NPDES Permit # Facility County Receiving<br />
Stream<br />
MGD*<br />
GA0024333<br />
Fulton Co, Big Cr WPCP River<br />
Mile 315.11<br />
Fulton Chatt. River 24.0<br />
GA0030686<br />
Fulton Co, Johns Cr WPCP River<br />
Mile 324.0<br />
Fulton Chatt. River 7.0<br />
GA0023167<br />
Buford Southside WPCP<br />
(Buford municipal)<br />
Gwinnett Suwanee Cr 2.0<br />
GA0026433<br />
Below plants are at<br />
southern edge of the<br />
CRNRA<br />
Gwinnett Co (Crooked Cr WPCP)<br />
River Mile 325.15<br />
Gwinnett Crooked Cr 16.0<br />
GA0026140<br />
Cobb Co, Sutton WPCP River<br />
Mile 300.45<br />
Cobb Chatt. River 40.0<br />
GA0021482<br />
Atlanta, Clayton WPCP River<br />
Mile 300.40<br />
Fulton Chatt. River 100.0<br />
* The permitted monthly average in million gallons per day (MGD). WPCP = water pollution control<br />
plant. NPDES = <strong>National</strong> Pollutant Discharge Elimination System<br />
<strong>Water</strong> quality at the lower sites in the CRNRA part of the river has improved some over the past<br />
decade in terms of dissolved oxygen and organic loads, presumably due to improvements in<br />
wastewater treatment facilities. However, fecal coliform concentrations continue to be high,<br />
making many streams "non supporting" of their intended uses (see Table 4.4.c).<br />
In addition to these studies in Section 4.4, the State Environmental Protection Division analyzed<br />
STORET water quality data from 1988 to 1994 to review levels of fecal coliform (FC) bacteria in<br />
streams of the metro Atlanta area (Harkins, 1995). The results are summarized below:<br />
• Twenty-one percent of the samples at the DeKalb intake (just downstream<br />
from the CRNRA's Jones Bridge Unit) exceeded the water contact limit of<br />
400 FC/100 ml (standard for one-time samples) (see Table 6.1.b. The area<br />
is a popular water recreation site;<br />
• Big Creek, which enters the river in the Roswell area by the Vickery Creek<br />
Unit, exceeded a fecal coliform count of 2,000 for “raw drinking water”<br />
about 25 percent of the time, 68 percent of the samples exceeded the 400<br />
FC/100 ml standard;<br />
• At the Cobb water intake (further downstream near the park's Johnson<br />
Ferry Unit), 27 percent of the samples exceeded the water contact limit for<br />
recreation (400 FC/100 ml);<br />
119
• At the lower end of the CRNRA (near I-285), fecal coliforms exceeded the<br />
contact standard (400 FC/100 ml) in some segments more than 40 percent<br />
of the time. Below the lower end of the CRNRA, by the Atlanta water<br />
intake, 45 percent of the samples exceeded the water contact limit for<br />
recreation (400 FC/100 ml);<br />
• For a comparison, the worst water quality in the metro area was found in<br />
the Peachtree Creek basin, just off the lower end of the CRNRA, where<br />
over 84 percent of samples exceeded the water contact limit (400 FC/100<br />
ml). (High levels there reportedly came from frequent sanitary sewer<br />
overflows).<br />
Spills, Leaks, and the Contamination<br />
Overflows from sanitary sewers have caused problems in several units of the CRNRA, and some<br />
existing sewer pipelines are inadequate to handle new loads imposed by recent development. In<br />
some cases, illegal hookups have added sewage loads to pipelines beyond what the counties<br />
would expect (pers. com., Cobb County, June 1998). Sanitary sewers transport raw sewage to<br />
treatment plants. The sewer lines generally run parallel to the river in the floodplain, passing<br />
through most of the park units.<br />
Pipe leaks and manhole overflows have also been a serious concern. Sewage system capacities<br />
are exceeded. Additionally, stormwater can enter pipe breaks and cause overflows.<br />
Environmental Protection Division records show that for 1 year from April 1999 about 26 million<br />
gallons of raw or partially treated sewage has spilled into the Chattahoochee River or its 17<br />
tributaries as they flow throught the CRNRA. That averages about 71,000 gallons per day for<br />
that year.<br />
Pathogens<br />
As described above, many streams in the CRNRA suffer from fecal contamination. Health<br />
experts in the Atlanta area have warned recreationists about the risks of the pathogens in<br />
Chattahoochee River water. In some counties, creeks are posted to warn of health hazards, and<br />
people are advised to stay out of these streams.<br />
Swimming in polluted water can cause illness, since raw sewage carries various pathogens of<br />
concern. The waterborne pathogens include disease-causing bacteria, viruses, and protozoans,<br />
which are transmitted by consumption of untreated or inadequately treated water. For example,<br />
the protozoans Giardia and Cryptosporidium are of health concern and can even be lifethreatening<br />
for the very young, very old, or individuals with low immunity (Hippe et al., 1997).<br />
Fecal coliforms indicate the presence of potentially serious pathogens, which can include:<br />
• Intestinal bacteria, including Salmonella, Shigella, E. coli, Vibrio cholerae, and<br />
Campylobacter fetus, that may cause severe gastroenteritis;<br />
• Bacteria that may cause eye, ear, nose, and throat infections such as Klebsiella,<br />
Flavobacterium, Serratia, and Pseudomonas;<br />
• Enteric viruses that may cause rashes, fever, gastroenteritis, myocarditiis,<br />
meningitis, respiratory disease, and hepatitis; and<br />
120
• Protozoa, such as Giardia, Cryptosporidium, and Entamoeba species, that may<br />
cause gastroenteritis or dysentery (WHO, 1984; Hippe, et al., 1997).<br />
Monitoring of the NPDES<br />
Section 402 of the Federal Clean <strong>Water</strong> Act, administered by the State EPD, prohibits the<br />
discharge of any pollutants into navigable waters of the United States unless the discharger has a<br />
<strong>National</strong> Pollutant Discharge Elimination System permit (NPDES). The NPDES-permitted<br />
treatment plants are listed in Table 6.1.a. In the greater Atlanta Region, there are about 57<br />
municipal NPDES permits, with about 45 industrial permits and eight land application system<br />
permits (Stevens, 1993), including the major ones in the CRNRA shown in Table 6.1.a plus<br />
smaller permits. The EPD has identified 160 facilities with permits in the Upper Chattahoochee<br />
Basin (http://www.chattahoochee.org). The Upper Chattahoochee Riverkeeper has succeeded in<br />
some legal determinations regarding Atlanta sewage impacts forcing important cleanup efforts.<br />
Urban stormwater runoff also requires NPDES permitting, and permitted municipal separate<br />
storm sewer systems (EPD, 1998a) in the CRNRA vicinity include:<br />
• Chamblee • Doraville • Roswell<br />
• Alpharetta • Sugar Hill • Suwanee<br />
• Norcross • Duluth • Buford<br />
• Cobb County • Fulton County<br />
Self Monitoring Information Available<br />
NPDES requires monthly self-monitoring and a discharge monitoring report (DMR), available to<br />
the public, to show the amount and concentration of the pollutants discharged by the holder of an<br />
NPDES permit. Reports are received by EPD, reviewed, and appropriate enforcement action is<br />
taken.<br />
The Upper Chattahoochee Riverkeeper has established a “Permit Monitoring Program” to review<br />
permitees' discharge monitoring reports and identify any significant point-source pollution<br />
problems. The Upper Chattahoochee Riverkeeper has used this program to highlight more<br />
chronic pollution problems and to identify sites where legal action is needed. They also have<br />
initiated citizen or class action suits against a number of chronic violators. (Upper Chattahoochee<br />
Riverkeeper, 1996). In addition, Riverkeeper has stream monitoring efforts underway in<br />
conjunction with the Adopt-A-Stream program of the State.<br />
6.2 CHEMICAL POLLUTION CONCERNS<br />
Introduction<br />
Contaminants in urban runoff include sediment, nutrients, pathogens, warmed water, and toxic<br />
chemicals, including metals, herbicides, pesticides, and other chemicals (Johnson, 1995). This<br />
section reviews the latter group, the chemicals.<br />
Chemicals found in urban runoff include common nutrients and metals as well as complex<br />
organic substances, such as the polycyclic aromatic hydrocarbons (PAHs) and polychlorinated<br />
biphenyls (PCBs) a group of about 10,000 compounds, and may come from vehicles, furnaces,<br />
121
122
wood preservatives, and incinerators. Some PAHs are carcinogenic or can impact fish. Another<br />
major chemical group, the PCBs, contains over 200 persistent compounds, and may come from<br />
landfills, spills, old transformers, old fluorescent lights, coolants, and lubricants (Johnson, 1995).<br />
Appendix C shows the “Georgia Instream <strong>Water</strong> Quality Standards for All <strong>Water</strong>s: Toxic<br />
Substances,” and lists a number of PAHs, PCBs, metals, and other substances. Many of these are<br />
“toxic priority pollutants.”<br />
Table 6.1.b. Explanation of fecal coliform standards and interpretations.<br />
A note on fecal coliform statistics:<br />
The 200 MPN/100 ml standard for fecal coliforms for recreation waters (discussed<br />
above and in Section 4.4 of this report) is adjusted to 400 by the EPD for evaluation of<br />
recreation waters and their classification as to "supporting" or not (as shown in Table<br />
4.4.c). The EPD notes out that "Georgia water quality standards establish a fecal<br />
coliform criteria of a geometric mean (four samples collected over a 30-day period) of<br />
200 MPN/100 ml for all waters in Georgia during the recreational season of May-<br />
October. This is the year-round standard for waters with the water-use classification<br />
of recreation. Although the standard is based on a geometric mean, most of the data<br />
for Georgia and other states is based on once per month sampling, as resources are<br />
not available to conduct sampling and analysis four times per month. Thus, … the<br />
USEPA recommends the use of a review criterion of 400 MPN/100 ml to evaluate<br />
once per month sample results." "For waters with the … classification of recreation,<br />
this (400 MPN/100 ml) criterion was used to evaluate data for the entire year. For<br />
waters classified as drinking water, fishing, or coastal fishing, the maximum Georgia<br />
standard for fecal coliform bacteria is 4000 MPN/100 ml (November-April). <strong>Water</strong>s<br />
were deemed not supporting uses when 25 percent of the samples had fecal coliform<br />
bacteria densities greater than the review criteria of 400 or 4000 MPN/100 ml or<br />
partially supporting with 11 to 25 percent of the samples were in excess of the review<br />
criteria."(EPD, 1998b). In general Georgia has moved to a 30-day geometric mean<br />
monitoring program.<br />
Metals in Streams and in Runoff<br />
After fecal coliforms, metals were the second most common pollutant of concern in Georgia<br />
EPD’s 1994 to 1995 water quality assessments for the Chattahoochee drainage. However, based<br />
on the draft 2000 list of impaired streams (EPD, 2000), metals are now less of a concern. Be that<br />
as it may, metals accumulate in the food chain and can harm fish, humans, or aquatic ecosystems.<br />
Metals can come from wastewater and industrial sources, such as old batteries, metal products,<br />
industrial discharges, or smokestack emissions. Metals can attach to the sediment in runoff from<br />
nonpoint sources. Concentrations of mercury, cadmium, copper, and lead are generally higher in<br />
the stream sediments in runoff from suburban and urban watersheds than in the runoff from<br />
forested and agricultural lands (Hippe et al., 1997).<br />
Metals in the bottom water and sediments of Lake Lanier are flushed downstream into the<br />
CRNRA in the dam releases, and at times high iron and manganese levels are found in tailwater<br />
releases from Buford Dam, especially during December to February. Higher metal<br />
concentrations impact the productivity and health of an aquatic system (EPD, 1998a).<br />
123
For five metals that are of concern in the area, the upper limit concentrations in water should be<br />
as follows:<br />
• For cadmium, less than 1.1 µg/liter;<br />
• For copper, less than 12 µg/liter;<br />
• For zinc, less than 110 µg/liter;<br />
• For lead, less than 3.2 µg/liter;<br />
• For mercury, less than 0.012 µg/liter.<br />
(Values for the first four are at 100 to 199 mg/L hardness; values at other<br />
hardnesses appear in Appendix C).<br />
Also see Table 4.4.c., which lists the streams in the CRNRA and vicinity not supporting their<br />
intended use because of pollution.<br />
Metals in Lake Lanier<br />
Lake Lanier and its environs have exhibited elevated metal levels, as shown below.<br />
Lake Lanier or its Environs Metals Problem<br />
The Chattahoochee River draining into Lake<br />
Lanier<br />
124<br />
Elevated levels of zinc, copper, and lead,<br />
from industrial sources. The metals could<br />
migrate to Lake Lanier (EPD, 1998a).<br />
Lake Lanier (classified for recreation) The lake only partially supports its<br />
designated use because of elevated levels of<br />
mercury and lead in some parts of the lake<br />
(EPD, 1998a).<br />
Lake Lanier bottom sediments The lake’s bottom sediments contain<br />
accumulations of metals from historic<br />
pollution.<br />
Pesticides and Herbicides in the Area<br />
Many pesticides are detected in the streams of the Metropolitan Atlanta Area, including streams<br />
within the CRNRA. Although pesticide concentrations are generally below existing drinkingwater<br />
standards, insecticide concentrations often exceed existing criteria for the protection of<br />
aquatic life (Hippe et al., 1997). This section provides a brief overview of these chemicals, as<br />
observed within the CRNRA.<br />
Most herbicides are used for weed control on suburb lawns, for vegetation control along roads<br />
and other sites, or in commercial areas. Homeowners mainly apply the herbicide glyphosate,<br />
sulfometuron, benefin, bensulide, acifluorfen, 2,4-D, 2,4-DP, and dicamba for weed control.<br />
Homeowners used Atrazine until 1993, when it was restricted. Herbicides most commonly used<br />
by the lawn-care industry have been combinations of dicamba, 2,4-D, mecoprop (MCPP), and<br />
2,4-DP (Stell et al., 1995).<br />
The lawn acreage in counties in or near the CRNRA section of the river that is treated with<br />
pesticides is as follows (Stell et al., 1995):
• Cobb County 20,300 acres treated;<br />
• Forsyth County 2,620 acres treated;<br />
• Fulton County 30,900 acres treated;<br />
• Gwinnett County 6,080 acres treated;<br />
• Total for these counties: about 60,000 acres (over 90 square miles).<br />
(About 80% treated by homeowners; the rest by lawn-care companies)<br />
Insecticides are used to control insects on golf courses, lawns, gardens, and in buildings. The<br />
organophosphate insecticides in current use (such as diazinon and chlorpyrifos) have largely<br />
replaced the organochlorine insecticides (Stell et al., 1995).<br />
The pesticides are applied at specific stages of a crop's growth cycle (preplant, pre-emergent, or<br />
post-emergent applications); therefore, these chemicals appear in streams in different seasons,<br />
depending on their season of use. Many insecticides are highest in water samples in the spring.<br />
For example, pendimethalin and 2,4-D (used on turf) were highest in March-April. Atrazine and<br />
simazine were at higher concentrations in December and February, which is presumably a<br />
function of their use patterns.<br />
Although the manufacture and use of many organochlorine compounds (e.g., DDT) were<br />
discontinued during the 1970s to 1980s, these compounds are persistent and bioaccumulate, and,<br />
therefore are still detectable. Organochlorine insecticides can be carcinogenic, mutagenic,<br />
teratogenic and/or onconenic (Buell and Couch, 1995).<br />
Sope Creek Pesticide Study<br />
The U.S. Geological Survey studied the water quality of Sope Creek watershed within the<br />
CRNRA (Hippe et al., 1994). Sope Creek is an urbanized watershed, with about 83 percent<br />
urban, 12 percent forested, and five percent agricultural land use. A total of 18 herbicides and<br />
seven insecticides were detected in Sope Creek. Table 6.2.a shows the 10 most commonly<br />
detected pesticides in the study.<br />
Simazine (used on turf) was the pesticide detected in highest levels; however, its concentrations<br />
mostly fell below the drinking water standard (Hippe et al., 1994; Hippe et al., 1997). Simazine,<br />
atrazine, and diazinon had the highest median concentrations relative to drinking-water standards<br />
and guidelines. Maximum concentrations of most insecticides detected, and median<br />
concentrations of chlorpyrifos and diazinon exceeded guidelines for protection of aquatic life.<br />
Diazinon (used on turf and ornaments) showed Sope Creek concentrations above the aquatic<br />
guideline over half the time (Hippe et al., 1997).<br />
Big Creek Pesticide Study<br />
Trace concentrations of seven herbicides and three insecticides were detected in Big Creek within<br />
the CRNRA during 1994 1995 (Frick, 1997). This included the turf pesticides simazine and<br />
atrazine, as discussed above for Sope Creek. The concentrations of these pesticides in Big Creek<br />
were well below existing standards and guidelines for drinking water, but concentrations of the<br />
insecticides approached or even exceeded some existing guidelines for protecting aquatic life<br />
(Long et al., 1996).<br />
125
Table 6.2.a. Pesticides in water samples from Sope Creek watershed, March, 1993 to April<br />
1994 for substances that were found in 20 percent or more of the water samples<br />
(from Hippe et al., 1994). The three most commonly detected substances are in<br />
bold.<br />
Analyte % Samples<br />
where detectable<br />
Median conc.<br />
µg/L<br />
126<br />
Max conc.<br />
µg/L<br />
Protect Aquatic<br />
Life**<br />
µg/L<br />
--- herbicides --- ---<br />
Atrazine 95 .031 0.38 2<br />
MCPA (1) 23
6.3 URBANIZATION IMPACTS<br />
Urban and Suburban Runoff<br />
One of the most common sources of pollution in rapidly growing suburbs is diffuse runoff from<br />
urban, industrial, and residential land uses, jointly referred to as “urban runoff” (EPD, 1998a).<br />
Land clearing, construction, paving, lawn and golf course maintenance, and various industrial<br />
activities can pollute streams in urban and suburban areas. Impervious surfaces and deforested<br />
areas increase greatly the peaks of storm runoff (Baer and Paul, 1995). When streets, structures,<br />
and paving replace woods and fields, the natural layers of undisturbed soil, vegetation, and plant<br />
material that slow and filter runoff are lost. Fast-moving runoff erodes construction sites and<br />
other bare soils. The runoff then transports pollutant and sediment loads to the streams, resulting<br />
in sedimentation, streambank erosion, and water quality degradation (Stevens, 1993).<br />
A higher volume of runoff can increase the total load of contaminants carried into a stream, and<br />
greater volumes of contaminants can accumulate and degrade stream aquatic habitats (Baer and<br />
Paul, 1995). In the greater Chattahoochee River basin, stormwater contributes over 80 percent of<br />
the dissolved substances, dissolved organic carbon, and metals, and about 65 percent of the<br />
phosphorus and nitrogen loads (Law, 1996).<br />
Stormwater Runoff<br />
Stormwater may flow directly into streams as diffuse, non-point, urban runoff on the land surface,<br />
or it may be collected and concentrated in a storm sewer system. Storm sewers are now subject<br />
to <strong>National</strong> Pollutant Discharge Elimination System (NPDES) control. The Georgia EPD has<br />
developed a permitting procedure requiring governments within the Atlanta metropolitan area to<br />
obtain a permit for the discharge of sewer system stormwater (EPD, 1998a). The Atlanta<br />
Regional Commission plays a key role in assisting local governments to develop procedures for<br />
permit application and stormwater management (Stevens, 1993).<br />
The Georgia EPD points out that the water quality of non-point, urban pollution from the land is<br />
generally similar to that within the NPDES-permitted stormwater discharges. Separate<br />
stormwater systems are typically found in developed areas that have high imperviousness and<br />
sanitary sewer systems. Non-point urban pollution consists of a large proportion of runoff from<br />
lawns, gardens, or sometimes leaky septic tank areas. These are all sources of nutrient loads<br />
(EPD, 1998a).<br />
Some of the pollutant loads in urban runoff are:<br />
• Increased sediment that covers the habitat of indigenous aquatic species, makes<br />
recreation areas turbid, increases water treatment costs, and helps transport metals<br />
into the stream environment;<br />
• Increased water temperatures that may harm aquatic organisms and lower the<br />
potential amount of dissolved oxygen;<br />
• Raised biochemical and chemical oxygen demands that may lower dissolved oxygen<br />
levels;<br />
• Loads of nutrients that may produce algal blooms, thereby reducing dissolved<br />
oxygen;<br />
• Higher fecal coliform levels that directly affect water contact recreation; and<br />
• Toxic materials such as pesticides (Mikalsen, 1989; Law, 1994).<br />
127
Impervious Surfaces and Runoff<br />
More impervious surfaces will increase surface runoff during storms. Hard surfaces can include<br />
roads, rooftops, parking lots, driveways, and sidewalks. Impervious coverage and stream health<br />
can be grouped in three categories:<br />
• with a watershed at < 10 percent impervious, stream and wetland health are<br />
essentially “protected;”<br />
• at a 10 to < 30 percent impervious watershed, the stream/wetlands will be<br />
“impacted” unless mitigated (more pollution, less aquatic species diversity, etc);<br />
• Figure 6.3.a<br />
• at impervious coverage of > 30 percent these impacts become “severe”, degradation<br />
will occur without mitigation; and “degradation is almost unavoidable” (Nichols,<br />
1997).<br />
The Georgia EPD has set a guideline to limit the impervious surface densities to 25 percent or<br />
less over a watershed--plus buffer strips along streams (see also Section 9.4; EPD, 1998a).<br />
The graphs of Figure 6.3.a come from a U.S. Geological Survey model which was tested in the<br />
Atlanta metropolitan area. The graphs demonstrate the dramatic effect of imperviousness on<br />
runoff and show that a “partially urbanized” watershed can yield about 2 to 4 times as much<br />
runoff as a undeveloped, natural watershed (Golden, 1977).<br />
Storm Observations in the Area<br />
The EPD (1982) investigated land disturbance effects by observing sediment levels in storm<br />
runoff in Richland, James, Suwanee, and Long Island creeks. The four creeks increased from less<br />
than 10 mg/L of suspended sediment during dry weather to concentrations over 100 mg/L (and at<br />
times greater than 1,000 mg/L) during storm runoff. All of the streams contributed large<br />
sediment loads to the Chattahoochee River during the rain events. The sediment came<br />
predominantly from new roads, pipe construction, and construction site erosion in these basins<br />
(EPD, 1982).<br />
Sediment and Turbidity in Runoff<br />
A 1995 Big Creek watershed program, coordinated by the Upper Chattahoochee Riverkeeper,<br />
observed sediment and turbidity during storms in northern Fulton and Forsyth counties<br />
(Groszmann, 1997). Twenty-four turbidity samples in six rain events exceeded 1,000 NTU<br />
(nephleometric turbidity units), three samples exceeded 3,000 NTU, and some samples were over<br />
5,000 NTU. The recommended 25 NTU stream standard for turbidity was exceeded over 41<br />
percent of the time during storms. Turbidity and total suspended sediment values had a<br />
correlation close to a 1:1 slope of the logarithmic plot of the two constituents, so turbidity<br />
approximated sediment values. Groszmann (1997) concluded that<br />
prevailing methods and practices of erosion and sedimentation control are not effectively<br />
protecting aquatic systems in Big Creek, and that further investigation of sediment<br />
sources is obviously needed.<br />
128
The University of Georgia conducted a similar study of stormwater runoff in the Sope Creek<br />
Basin (Baer and Paul, 1995). The Sope Creek Basin consists mainly of suburban housing (67.6<br />
percent) and commercial developments (7.15 percent). A control watershed, primarily forested,<br />
was used for comparison. The investigators observed that turbidity, dissolved solids, and<br />
suspended sediment loads in Sope Creek all increased greatly with discharge. The dissolved and<br />
suspended solids were significantly higher than in the control stream (however, turbidity<br />
differences were minor -- unlike the Big Creek study mentioned above). The source of sediment<br />
was apparently road building, construction, and streambank erosion (Baer and Paul, 1995).<br />
Bourne (1998) notes that bank erosion along Sope Creek also is severe at places where vegetation<br />
has been cleared such as at the Indian Hills Golf Course.<br />
Research has shown that a 1:1 relationship between turbidity and sediment is not typical for<br />
streams in general, and that the sediment-turbidity relationship must be developed for individual<br />
watersheds. Kunkle and Comer (1971) found that the sediment-turbidity relationship was likely a<br />
function of the geologic materials and soils producing the sediment. Certain sediments will<br />
produce more reflectance in a turbidimeter. In the Piedmont physiographic province of Georgia,<br />
recent research has found that if a 1:1 ratio is applied, then turbidity (in NTUs) will somewhat<br />
overestimate suspended sediment (in mg/L) (Barnes, Meyer, and Freeman, 1996). [Their<br />
regression curves indicate that the overestimation may be on the order of about 20 percent]. The<br />
high clay content of Piedmont soils could explain the high turbidity readings. Therefore, a<br />
sediment-turbidity calibration curve should be developed for each watershed, in order to use<br />
turbidity as an estimation tool.<br />
Runoff Modeling<br />
In 1994 to 1995 the Georgia EPD began work on model calibration studies for the Chattahoochee<br />
River Modeling Project (CRMP). The CRMP’s goal is to provide a time-variable hydrodynamic<br />
and water quality model for the main stem of the Chattahoochee River from Buford Dam to the<br />
headwaters of West Point Lake at Franklin, Georgia. The desire of EPD is to have a generalpurpose<br />
model capable of supporting regulatory decision-making for various water resource and<br />
water quality management issues into the 21 st Century (EPD, 1996). For example, predictions<br />
have been made on the possible impact of the new wastewater discharges that are planned (Burke<br />
et al., 1997).<br />
The mainstem model (CRMP) is designed to simulate water quality-impacts of stormwater runoff<br />
from the tributary watersheds within the study area, and the modeling also includes efforts to<br />
verify the Environmental Protection Agency’s Storm <strong>Water</strong> <strong>Management</strong> Model (SWMM). The<br />
SWMM can be used to estimate pollution loadings to the mainstem model and to evaluate<br />
alternatives (Law, 1996; Law, 1994). The CRMP and SWMM projects required field testing, with<br />
multiple intensive surveys to determine if the predictions would be valid. Individual studies or<br />
modules were set up for certain tributaries. Module testing from 1995 to 1996 on Suwanee Creek<br />
included the water-quality parameters pH, biochemical oxygen demand, chemical oxygen<br />
demand, total Kjeldahl nitrogen, ammonia, nitrate plus nitrite, phosphorus, ortho-phosphate, total<br />
suspended solids, turbidity, and fecal coliforms (Law, 1996).<br />
The modeling work was conducted in partnership with the U.S. Environmental Protection<br />
Agency, the U.S. Geological Survey, various local entities, and other federal agencies in the area<br />
(including NPS) at an estimated total project cost of over $4 million. As of early 1999, the model<br />
129
Figure 6.3.a. Comparison of natural and urban flood-frequency curves for a hypothetical one-<br />
square-mile basin (from Golden, 1977).<br />
130
is functioning for practical questions and prediction needs (pers. com., R. Burke, Georgia EPD,<br />
February 1999).<br />
Ground-<strong>Water</strong> Quality and Pollution<br />
A water quality concern in the area is the possible impact of septic tanks on ground and surface<br />
waters. Leakage of septic tanks in the clayey soils of the area could spill pathogens and<br />
chemicals into streams. Nitrates also move readily through the ground and have the potential to<br />
contaminate ground water and to migrate with the ground-water flow, eventually reaching the<br />
surface. For example, a 589-unit planned residential development with hotel and conference<br />
center is proposed on the shores of Lake Lanier, Hall County. This development would rely<br />
primarily on a community septic system. The close proximity of this septic system to the lake<br />
increases the risk of contamination.<br />
Information available from the Natural <strong>Resources</strong> Conservation <strong>Service</strong> shows the degree and<br />
kind of soil limitations that affect septic tank absorption fields, sewage lagoons, and sanitary<br />
landfills. Soil limitations are graded for particular uses:<br />
• Soil limitations are considered "slight" if soil properties and site features are<br />
generally favorable for an indicated used, such as septic tanks.<br />
• Limitations for a particular soil use are considered “moderate” if soil properties or<br />
site features are basically not favorable for the indicated use, and difficulties could<br />
arise. Special designs will be needed to overcome “moderate” limitations.<br />
• With "severe" limitations, soil properties are such that the soils are highly unsuitable<br />
for the particular use (NRCS, 1996).<br />
The soil surveys for Cobb, Fulton, Forsyth, and Gwinnett Counties show many or most soils have<br />
"moderate or severe" limitations for septic tank use. For example, the 1996 update for Cobb<br />
County (the only recent NRCS update among the counties) lists 53 kinds of soil in the county,<br />
grading 29 (55 percent) of them moderate, 24 (45 percent) as severe, and none as slight as regards<br />
septic tank suitability.<br />
This soil information highlights the lack of suitability for septic tanks in most soils of the area.<br />
Nonetheless, major subdivisions are planned or under development, including a major<br />
development near the Bowmans Island Unit of the CRNRA.<br />
Landfills have the potential to leak all types of common and toxic chemicals into the ground<br />
water, and eventually into streams. One landfill is found in the SE corner of Forsyth County, and<br />
another across the river in Gwinnett County, at the upper end of the CRNRA. Fulton County has<br />
landfills near the Island Ford Unit and a large one near Morgan Falls. A landfill close to the river<br />
or a tributary has the potential to leak into the ground water and eventually affect the river.<br />
Historically, the focus of water-quality studies in the Metropolitan Atlanta area has been on<br />
surface water, since over 90 percent of the water used in the area comes from lakes and streams.<br />
Limited observations of ground-water quality are available, such as the Willeo, Sope, and<br />
Rottenwood creek basin studies of the U.S. Geological Survey (Frick, 1997).<br />
131
7.0 INSTREAM SAND AND GRAVEL MINING<br />
7.1 OVERVIEW<br />
Instream sand and gravel dredging occurs in the riverbed at several sites within the CRNRA; this<br />
mining occupies about eight percent of the 48-mile river stretch. The mining operations have<br />
been mostly near the McGinnis Ferry Unit, in the area of the Abbotts Bridge Unit, and near the<br />
Island Ford Unit area (Martin and Hess, 1986; CRNRA, 1989).<br />
Most sand and gravel mined in the U.S. is used in the construction of buildings and roads. A<br />
large demand exists for construction materials in the Atlanta area, given the fast population<br />
growth and concomitant development needs. Instream gravel is an especially desirable<br />
construction material, since the stream abrasion produces durable, rounded, more chemically<br />
inert, and well-sorted gravel. For this reason, rivers continue to be highly desirable sources of<br />
sand and gravel for commercial use.<br />
7.2 EFFECTS OF INSTREAM MINING<br />
Instream mining affects the physical, chemical, and biological aspects of aquatic habitats. The<br />
potential negative impacts of instream mining include:<br />
• more substrate instability, that decreases aquatic invertebrate substrate;<br />
• physical changes to the stream configuration, decreasing variability of the physical<br />
habitat, that may influence salmonid habitat;<br />
• a reduction of woody debris, snags, and other “cover” that fish need (cover is critical<br />
for trout);<br />
• possible water temperature or subtle chemistry changes;<br />
• creation of pools mostly appealing to undesirable fish species, such as suckers;<br />
• a reduction of aquatic insects by reducing water velocities and by removing the<br />
gravel that the insects need;<br />
• a general reduction of carrying capacity for fish in the area mined when all these<br />
factors are considered;<br />
• possible erosion upstream from the mining (headcutting), affecting fish habitat there,<br />
and in cases affecting upstream streamside property values;<br />
• potential safety hazard;<br />
• aesthetic impacts. (Meador and Layher, 1998; Martin and Hess, 1986).<br />
.<br />
Instream sand and gravel mining also can provide benefits to the aquatic habitat of a river, which<br />
can include:<br />
• creation of sediment basins or pools, which trap shifting sands, thereby benefiting<br />
insects;<br />
• creation of ledges by the dredging, where trout find resting sites;<br />
• removal of sand, which can be beneficial, since sand smothers habitat (conversely,<br />
removal of gravel is generally not beneficial) (Meador and Layher, 1998; Martin and<br />
Hess, 1986).<br />
132
7.3 SAND AND GRAVEL MINING IN THE CRNRA<br />
A study was conducted from 1984 to 1986 at sites in the Chattahoochee River within the CRNRA<br />
to evaluate the impacts of the sand and gravel dredging on trout and other fish, and on their<br />
habitat. Five sand and gravel dredges operated in this section of the river in 1984. Martin and<br />
Hess (1986), sampled fish by electrofishing and detonation cord at six sites near McGinnis Ferry<br />
Unit and Rogers Bridge.<br />
Martin and Hess found the most trout in recently dredged sites in both of the areas shown in<br />
Table 7.3.a. The largest number of species also was collected at recently dredged or dredged<br />
sites. Mining was not found to be directly detrimental to the fish, according to this study.<br />
However, the high numbers of trout in the dredged areas of Rogers Bridge (Table 7.a) is<br />
misleading. This site served as a regular stocking location, and it is not surprising that stocked<br />
trout would congregate in the nearest downstream pool below a stocking point.<br />
Confounding the results of Martin and Hess's study is the fact that the river itself was already a<br />
disturbed system with associated species assemblage shifts and changes in habitat diversity.<br />
Dredging at Rogers Bridge may have been beneficial in that it created more habitat diversity<br />
whereas before this diversity was swamped. This could account for the increases in species<br />
richness and trout abundance.<br />
Sand dredging can potentially improve aquatic habitat by creating small, short pools in a river<br />
where they did not formerly exist. The small pools dredged out can be beneficial to fish, if not too<br />
large or too many. Too much pool creation in the river, however, can be detrimental, since pools<br />
are created at the expense of the food-producing, swift-water areas. While removal of the sand<br />
can be beneficial to insect and trout abundance, removal of gravel and debris is not. Gravel and<br />
cobble substrate should be protected, especially in swift portions of the river, since this will<br />
maintain the production of invertebrates.<br />
High turbidities occur when sand dredging in the river returns water; however, the effect is<br />
localized and only occurs while an individual dredge is operating. Dredging results in deeper,<br />
wide channels and slower water velocities. This habitat modification favors a different<br />
assemblage of fishes, primarily as a result of the change in water velocities (in this study 0.28 m/s<br />
in dredged pools versus 0.71 m/s in undredged areas).<br />
The investigators recommended that the instream mining needs to be based on technical<br />
guidelines, to control the size, extent, and pattern/distribution of the dredging sites, to attain a<br />
good pool/riffle mix. The guidelines would emphasize removal of mostly sand (not the beneficial<br />
gravel) and promote the retention of fallen trees and other streambank cover that is beneficial to<br />
fish (Martin and Hess, 1986). According to fishery and mining specialists, good instream mining<br />
guidelines could greatly reduce impacts and provide measures to protect the aquatic environment<br />
(Meador and Layher, 1998).<br />
133
Table 7.3.a Numbers of fish collected (electrofishing + detonation cord) on the<br />
Chattahoochee River during October and November 1984 at two sand and gravel<br />
dredge areas (modified from Martin and Hess, 1986). (U = an undredged<br />
sampling site; R = a recently dredged sampling site [within 7 days]; D = a<br />
sampling site dredged approximately 7 months prior to sampling).<br />
134<br />
TWO SAMPLE AREAS<br />
McGinnis Ferry<br />
(three sampling sites)<br />
Rogers Bridge<br />
(three sampling sites)<br />
Species U R D U R D<br />
rainbow trout 35 55 12 33 38 33<br />
brown trout 39 20 5 39 108 63<br />
chain pickerel 1 7 1<br />
golden shiner 64<br />
carp 1<br />
spotted sucker 26 4 6<br />
redbreast sunfish 1<br />
white catfish 4<br />
warmouth 2<br />
bluegill 6 3 9 16 15 3<br />
redear sunfish 1 1<br />
largemouth bass 1 8 33 1 1<br />
spotted bass 3<br />
black crappie 5<br />
yellow perch 6 8 37 18 33 19<br />
Total Trout<br />
(relative abundance)<br />
74<br />
(45%)<br />
75<br />
(45%)<br />
17<br />
(10%)<br />
72<br />
(23%)<br />
146<br />
(47%)<br />
Total Number of Species 6 4 8 6 9 9<br />
7.4 REGULATIONS FOR INSTREAM MINING<br />
Sand and gravel mining may be one of the least-regulated of all mining activities, and the mining<br />
regulations of the U.S. Corps of Engineers have “undergone numerous changes” with the<br />
regulatory process “confusing, … complicated, … and … unclear,” according to a recent<br />
96<br />
(30%)
conference on instream mining (Meador and Layher, 1998). The Corps operates under the<br />
authority of Section 404 of the Clean <strong>Water</strong> Act, which requires a permit for the mining.<br />
Litigation was initiated in 1997 to question the Corps’ authority under 404 (which was written<br />
relevant to discharging, not removing, materials). Also, the Corps uses only an abbreviated<br />
review and not an environmental impact assessment under the <strong>National</strong> Environmental Policy<br />
Act. In general, work is needed on instream mining to develop guidelines and regulations that<br />
integrate biology and politics to protect aquatic resources (Meador and Layher, 1998).<br />
In general, the U.S. Army Corps of Engineers has the responsibility to permit dredging operations<br />
in rivers. On the Chattahoochee River within the CRNRA, the NPS issues Special Use Permits<br />
for the sand and gravel operations. However, the CRNRA presently is analyzing this permit<br />
process to see if another process may be preferable. The Corps also allows the NPS to place<br />
conditions on the Corps permits issued to the sand and gravel operators, which provides a<br />
mechanism for the NPS to advise on any aspect of the mining that might impact the natural<br />
resources of the CRNRA (Chattahoochee River <strong>National</strong> Recreation Area, 1989; pers. comm.,<br />
Chattahoochee River <strong>National</strong> Recreation Area, 1999).<br />
The Metropolitan River Protection Act allows instream mining activities so long as no bank<br />
erosion occurs and no more effluent is returned to the river than is withdrawn. However, the<br />
land-based portions of such operations are subject to the standards of the Chattahoochee Corridor<br />
<strong>Plan</strong>.<br />
7.5 NEED FOR SOME FOLLOW-UP<br />
As recreational use along the river grows, the potential will increase for the mining to cause<br />
aesthetic or safety concerns, or otherwise conflict with the recreational experience of visitors<br />
(CRNRA, 1989). The CRNRA will want to address this potential problem within the framework<br />
of developing guidelines for the mining. This report therefore recommends that the CRNRA<br />
needs to (1) collect new information on sand and gravel mining impacts, since no information has<br />
been collected for about 15 years, and (2) to develop a good set of guidelines, goals, and desirable<br />
restrictions for instream sand and gravel mining operations within the CRNRA.<br />
8.0 BIOASSESSMENTS AND BIOLOGICAL INTEGRITY<br />
8.1 OVERVIEW OF BIOLOGICAL INTEGRITY<br />
Perhaps the most compelling argument for restoring or preserving<br />
the integrity of streams in the southeastern Piedmont is that they will<br />
be the principal source of drinking water for an expanding human<br />
population. The plant and animal communities present in the<br />
streams can provide an indication of water quality and the extent to<br />
which these streams can be utilized for drinking water, recreation<br />
and fishing (Mulholland and Lenat, 1992).<br />
The phrase biological integrity was first used in 1972 to establish the goal of the Clean <strong>Water</strong> Act:<br />
"to restore and maintain the chemical, physical, and biological integrity of the Nation's waters."<br />
This mandate clearly established a legal foundation for protecting aquatic biota. Unfortunately, the<br />
vision of biological integrity was not reflected in the act's implementing regulations. Those<br />
135
egulations were aimed at controlling or reducing release of chemical contaminants and thereby<br />
protecting human health; the integrity of biological communities was largely ignored (Karr, 1991). As<br />
a result, aquatic organisms and aquatic environments have declined in recent decades. The assessment<br />
of water resources extends beyond pollutant-caused degradation of water quality in addition, we face<br />
loss of species, homogenized biological assemblages, and lost fisheries.<br />
Biological integrity refers to the capacity to support and maintain a balanced, integrated, and adaptive<br />
biological system having the full range of elements (e.g., populations, species, assemblages) and<br />
processes (e.g. biotic interactions, energy dynamics, biogeochemical cycles) expected in a region’s<br />
natural habitat (Karr et al., 1986). The biological integrity of water resources is jeopardized by altering<br />
one or more of five classes of environmental factors: alteration of physical habitat, modifications of<br />
seasonal flow of water, changes in the food base of the system, changes in interactions within the<br />
stream biota, and chemical contamination (Karr, 1992). Urbanization, for example, compromises the<br />
biological integrity of streams by severing the connections among segments of a watershed and by<br />
altering hydrology, water quality, energy sources, habitat structure, and biotic interactions.<br />
<strong>Water</strong> managers are increasingly being called upon to evaluate the biological effects of their<br />
management decisions, for no other aspect of a river gives a more integrated perspective about the<br />
condition of a river and its biota. Widespread recognition of this and the continued degradation of our<br />
water resources have stimulated numerous efforts to improve our ability to track aquatic biological<br />
integrity (Davis and Simon, 1995). Comprehensive, multimetric indexes (Barbour et al., 1995) were<br />
first developed in the Midwest for use with fishes (Karr, 1981; Fausch et al., 1984; Karr et al., 1986),<br />
and modified for use in other regions of the U. S. (Mifier et al., 1988) and with invertebrates (Ohio<br />
EPA, 1988; Plafkin et al., 1989; Kerans and Karr, 1994; Deshon, 1995; Fore et al., 1996). The<br />
conceptual basis of the multimetric approach has now been applied to a variety of aquatic<br />
environments (Davis and Simon, 1995), including large rivers, lakes, estuaries, wetlands, riparian<br />
corridors, and reservoirs, and in a variety of geographic locations (Lyons et al., 1995).<br />
Presently, more comprehensive approaches have been developed and are being adopted by state and<br />
federal agencies. Forty-two states now use multimetric biological assessments of biological condition<br />
and six states are developing biological assessment approaches; only three states used multimetric<br />
biological approaches in 1989 (U.S. Environmental Protection Agency, 1996a). Efforts are at last<br />
being made to monitor the biological integrity of water resources as mandated by the Clean <strong>Water</strong> Act<br />
28 years ago (Karr, 1991; Davis and Simon, 1995; U.S. Environmental Protection Agency, 1996a,b).<br />
The set of metrics incorporated into a multimetric index integrates information from ecosystem,<br />
community, population, and individual levels (Karr, 1991; Barbour et al., 1995). Multimetric indexes<br />
are generally dominated by metrics of tan richness (number of tan) because structural changes, such as<br />
shifts among taxa, generally occur at lower levels of stress than do changes in ecosystem processes<br />
(Karr et al., 1986; Schindler, 1987, 1990). However, the most appropriate and integrative multimetric<br />
indexes embrace several concepts, including tan richness, indicator taxa or guilds (e.g. tolerant and<br />
intolerant), health of individual organisms; and assessment of processes (e.g., as reflected by trophic<br />
structure) of the sampled assemblage.<br />
LIke the multimetric indexes used to track national economies, multimetric biological indexes<br />
measure many dimensions of complex ecological systems (Karr, 1992). Multimetric economic indexes<br />
assess economic health against a standard fiscal period; indexes of biological integrity assess the<br />
biological well being of sites against a regional “baseline condition” reflecting the relative absence of<br />
human influence. The goal is to understand and isolate, through sampling design and analytical<br />
procedures, patterns that derive from natural variation in environments.<br />
136
The systematic, biological assessment of species assemblages using multimetric indexes is<br />
presently one of the only practical and cost-effective approaches to determine if human actions<br />
are degrading biological integrity (Davis and Simon, 1995). Such monitoring provides both<br />
numeric and narrative descriptions of resource condition, which can be compared among<br />
watersheds, across a single watershed, and over time (Karr, 1991), and it does so at costs which<br />
are often less than the cost of complex chemical monitoring ( Yoder and Rankin, 1995).<br />
8.2 THE INDEX OF BIOTIC INTEGRITY<br />
The Index of Biotic Integrity (181), the first of the multimetric indexes, was conceived to provide<br />
a broadly based and ecologically sound tool to evaluate biological conditions in a stream (Karr,<br />
1981). The 181 and its sister indexes are based on a series of assumptions and intuitions of how<br />
biotic assemblages change with increased environmental degradation (Table 8.2.a). A single<br />
sample from a stream reach is evaluated using 12 metrics (Table 8.2.b.) to determine the extent to<br />
which the resident community diverges from that expected of an undisturbed site in the same<br />
geographic area and of the same stream size. Unlike efforts to define chemical criteria that do not<br />
take variation by geographic region into account, this approach explicitly recognizes natural<br />
variation in water resource conditions. Ratings of 5,3, and 1 are assigned to each metric according<br />
to whether its value approximates, deviates somewhat from, or deviates strongly from the value<br />
expected at the undisturbed site (Table 8.2.b.). Ratings are then summed and placed into integrity<br />
classes (excellent, good, fair, poor, and very poor) to provide an assessment of the biological<br />
integrity or health of a system.<br />
The 12 metrics represent differing sensitivities across the range of biotic integrity (Figure 8.2.a).<br />
Municipal effluents, for example, generally affect total abundance and trophic structure. Toxic<br />
effects are typically manifested as unusually low total abundance. On the other hand, some<br />
environments low in nutrients support a limited number of individuals, and an increase in<br />
abundance could indicate organic enrichment. Additionally, bottom dwelling species (e.g.,<br />
darters) that depend on benthic habitats are especially sensitive to siltation and benthic oxygen<br />
depletion and are good barometers of habitat degradation.<br />
Regardless of whether fish, invertebrates, or other tan are used, the search for a small set of<br />
metrics that reliably signal resource condition along gradients of human influence yields the same<br />
basic suite of metrics (Mifier et al., 1988; Karr, 1991; Davis and Simon, 1995). With usually only<br />
minor modification, the suite can be adapted to specific regions (Miller et al., 1988), such as<br />
Piedmont region of the Chattahoochee River basin.<br />
Table 8.2.a. Typical effects of environmental degradation on biotic assemblages (from Fausch et<br />
al., 1990).<br />
1. The number of native species, and those in specialized taxa or guilds declines<br />
2. The percentage of exotic or introduced species or stocks increases<br />
3. The number of generally intolerant or sensitive species declines<br />
4. The percentage of the assemblage comprising tolerant or insensitive species increases<br />
5. The percentage of trophic and habitat specialists declines<br />
6. The percentage of trophic and habitat generalists increases<br />
7. The abundance of the total number of individuals declines<br />
8. The incidence of disease and anomalies increases<br />
9. The percentage of large, mature, or old-growth individuals declines<br />
10. Reproduction of generally sensitive species declines<br />
137
11. The number of size- and age-classes declines<br />
12. Spatial or temporal fluctuations are more pronounced<br />
8.3 BIOLOGICAL MONiTORING AND BIOASSESSMENTS IN THE<br />
CRNRA<br />
Within the Piedmont of the Southeast little has been published on the use and/or modification of<br />
the 181. DeVivo et al. (1997) presented a preliminary (because of small sample size and need for<br />
verification) 18! for fish communities of urban streams of metropolitan Atlanta. For their<br />
approach, DeVivo et al. reduced the number of metrics to eight using statistical measures, thereby<br />
dropping a few of the metrics that have been used consistently in many different regions, and<br />
modified the remaining metrics (Table 8.3.c) (Mifier et al., 1988). Methc selection was based on<br />
the sensitivity of metrics to watershed disturbance, defined as human population density.<br />
However, of the 13 metrics evaluated, only seven represented original 181 metrics (Karr, 1981)<br />
or slightly modified versions (Table 8.3.c).<br />
Of the 21 tributary sites sampled, five were on creeks within the CRNRA Big, Suwanee, Willeo,<br />
Sope, and Rottenwood creeks. None of these streams scored higher than fair. In general, the 18!<br />
scores from these urban streams were inversely related to watershed population density, as seen<br />
in the examples in Table 8.3.e.<br />
The Georgia Environmental Protection Division uses biological monitoring and assessments as<br />
surface water monitoring tools to manage and regulate Georgia water resources (U.S. EPA,<br />
1996a). The EPD has recently prepared draft standard operating procedures for aquatic<br />
macroinvertebrate assessments (Environmental Protection Division, 1997). These procedures<br />
represent an intensive, multi-habitat, multimetric approach to assessing macroinvertebrate<br />
communities. In addition, fish survey information from the Wildlife <strong>Resources</strong> Division of the<br />
Georgia DNR has been evaluated using Karr’s (1981) Index of Biotic Integrity (e.g., Mauldin and<br />
McCollum, 1992). Biological assessment information is used by the State in the designated use<br />
support characterization process — stream segments rated as poor or very poor are considered as<br />
not meeting the “fishing” water use classification and are included in the partially supporting list<br />
(U.S. Environmental Protection Agency, 1996a).<br />
As part of a study for the urban watersheds initiative for metropolitan Atlanta, CH2MHi11<br />
(1998a) sampled aquatic macroinvertebrates and fish using bioassessment protocols developed by<br />
the Georgia Environmental Protection Division (1997) and the U.S. Environmental Protection<br />
Agency (Pflakin et al., 1989). The analysis of benthic macroinvertebrate data integrated seven<br />
community, population, and functional metrics (Table 8.3.d). This 7-metric index is a slight<br />
modification of the more commonly used 8-metric Rapid Bioassessment Protocol ifi of Pflakin et<br />
aL 1989; the ‘community similarity index’ metric was dropped. Metric values were compared to<br />
values derived from use of the same suite of metrics at reference stations. Each metric was<br />
assigned a score according to the percent comparability with the reference value.<br />
A slightly modified version of the Index of Biotic Integrity (Karr, 1981) was used to evaluate the<br />
health of stream fish communities (Table 8.2.c). The 18! is equivalent to Rapid Bioassessment<br />
Protocol V of Pflakin et al. (1989). In addition, the 12-metric 18! was compared with the 8-metric<br />
18! (DeVivo et al., 1997) using the same set of fish sampling data from the same streams.<br />
Because the different sets of metrics result in different scales of 18! scoring, scores were<br />
normalized as a percentage of the maximum possible score. The 8-metric 18! of DeVivo et al.<br />
yielded a wider range of scores than the 12-metric 18!. Generally, intermediate-impact sites<br />
scored higher using the metrics of DeVivo et al., while the most<br />
138
degraded sites scored lower. In all cases differences of less than 10 percent occurred between the<br />
two sets of metrics. Relative rankings of sites of the two different sets of metrics were the same.<br />
Finally, CH2MH1II (1998b) compared the scores from the fish-based if! (12-metric) with the<br />
benthic macroinvertebrate-based Rapid Bioassessment Protocol III. The scores from these<br />
indexes were highly correlated further supporting the reliability of monitoring biological<br />
assemblages in predicting biotic integrity. Differences in scores for individual sites are a result of<br />
assemblage response to different environment stressors. For example, benthic macroinvertebrate<br />
diversity and abundance usually respond to chemical input from industrial effluent. Fish, on the<br />
other hand, typically exhibit no response to the organic inputs and a negative response to metal<br />
concentrations in the water.<br />
Table 8.3.e. 131 scores for streams in the CRNRA, showing the strong relationship between<br />
population density and water quality (from DeVivo et al., 1997).<br />
Site Population per Square Kilometer USGS<br />
Big Cr at Hwy 29 96<br />
Gage No.<br />
02335580 26, fair urbanizing<br />
Suwanee Creek 151 02334865 28, fair urbaiñzing<br />
139<br />
Average IBI * Note<br />
Big Cr at Roswell 218 02335760 20, poor urbanizing<br />
Suwanee Cr 254at<br />
02334740 30, fair/good urbanizing<br />
Woodward Mifi Rd<br />
Willeo Creek 605 02335790 22-28, fair urban<br />
Sope Creek 800 02335870 28-30,fair urban<br />
Rottenwood Creek 1,050 02335910 12-16, very poor urban<br />
*40 perfect score, best integrity, or cleanest zero would be totally disrupted ecosystem,<br />
presumably most polluted.<br />
9.0 PROGRAMS, POLICIES, AND PLANNING FOR WATERSHEDS<br />
9.1 INTRODUCTION<br />
This chapter reviews watershed issues and protection from the planning and long-term<br />
perspective and reviews the principal programs, policies, and legal measures which are designed<br />
to protect watersheds, water quality, strearuflow, and the aquatic environment.<br />
9.2 WATERSHED ASSESSMENTS AND PLANNING<br />
People in the Atlanta metro area appear to have a clear vision of what they want for green space<br />
and natural areas for the year 2020. When asked to respond to: “I think the protection of forested<br />
areas/streams/rivers should be a high public priority (looking to the future),” 79 percent<br />
responded that they “agree very much,” with another 15 percent indicating “agree somewhat”<br />
(ARC, 1996). Clearly, people in the area value the natural environment.
Figure 8.2.a. The range of primary sensitivity for each of the 1218! metrics listed in Table 8.2.a<br />
(after Karr et al., 1986).<br />
140
141
142
143
River Basin <strong>Management</strong> <strong>Plan</strong><br />
The State Environmental Protection Division views river basin planning as an important step in<br />
its broader, long-range planning for the Chattahoochee River basin. The State’s river basin<br />
management plan (RBMP) for the Chattahoochee Basin is intended to:<br />
• facilitate the coordination of water quality and quantity in the Chattahoochee<br />
River basin;<br />
• identify present and future water resource demands;<br />
• present and facilitate the implementation of water protection efforts; and<br />
• enhance stakeholder understanding and involvement in basin planning (EPD,<br />
1998a).<br />
The RBMP is intended primarily for water supply and flood control, but also attempts to improve<br />
aquatic habitat, to help protection of wildlife benefits, and to promote water-based recreation. The<br />
plan should be updated every 5 years (EPD, 1998a).<br />
The Chattahoochee RBMP lists some specific plans or actions for Hydrologic Unit 03130001,<br />
Area B, (Buford Dam to Peachtree Creek) the river reach that includes the CRNRA. Some of the<br />
actions that the RBMP proposes are (abbreviated here):<br />
• Review metals data by September, 1999;<br />
• Propose a plan to re-sample streams not supporting or partially supporting their<br />
designated uses; complete the sampling by December, 2000 (*);<br />
• Continue with all aspects of the stormwater management program;<br />
• Continue to develop Rapid Bioassessment Protocol capabilities for assessing aquatic life<br />
(*);<br />
• Encourage Adopt-A-Stream (volunteer) efforts in urban stream restoration (*);<br />
• Ensure that point sources remain in compliance vis-à-vis metals;<br />
• Develop a draft <strong>Water</strong> Quality <strong>Management</strong> <strong>Plan</strong> for the Atlanta metro area in FY-99<br />
(Atlanta Regional Commission lead) (*);<br />
• Re-evaluate stream status and management strategies during the next basin cycle in<br />
2001 (*);<br />
• Study habitat requirements of the fish populations (*);<br />
• Continue to sample and analyze fish tissue, planned for 2000 (EPD, 1998a).<br />
All of these efforts are relevant to the CRNRA; however, the items with asterisks (*) may offer<br />
exceptional opportunity for meaningful NPS involvement or cooperation.<br />
Metropolitan River Protection Act (MRPA)<br />
The Atlanta Regional Commission (ARC) is the principal environmental planning organization<br />
within the metro area. ARC provides technical assistance to “ensure that healthy growth occurs<br />
while maintaining environmental integrity” and “to protect the .. .drinking water source as well as<br />
the scenic, recreational, and natural resources of the Chattahoochee River and its surrounding<br />
lands” (ARC, l998b). The “protection of recreational values” also is salient in the ARC’s mission<br />
for the river.<br />
The Metropolitan River Protection Act (MRPA) provides for the protection of a corridor within<br />
2000 feet of the river, with its Corridor <strong>Plan</strong>, and the ARC has the responsibility to “prepare,<br />
adopt, and keep up-to-date a comprehensive, coordinated land and water use plan for the stream<br />
144
corridor” (ARC, 1987). The MRPA also requires local development to be consistent with land<br />
vulnerability standards, buffer zones adjacent to the river and tributaries, and floodplain<br />
standards. The local governments near the <strong>National</strong> Recreation Area will continue to follow the<br />
goals of the Corridor <strong>Plan</strong>, to set buffer strips, promote best management practices, control<br />
building setbacks, and protect floodplains (ARC, l997a; EPD, 1998a; ARC, 1987).<br />
The ACF Multi-agency Allocation (Tn-state) Studies and <strong>Plan</strong>s<br />
Future water quantity needs and allocations of flows are addressed in the ongoing Apalachicola -<br />
Chattahoochee - Flint allocation study coordinated by the Corps of Engineers, as discussed in<br />
detail in Section 5.2 of this report. Therefore, the planning of future streamfiows for recreational<br />
and fishing needs in the Recreation Area hinges on the outcome of this ACF study.<br />
Additional EPD work is still underway to evaluate flows with its Chattahoochee River Modeling<br />
Project. Currently, the state requirement for minimum flows is 7QlO (7-day average flow with a<br />
once in 10 years recurrence interval), but EPD is receptive to changing this rule to increase<br />
minimum flows that could benefit aquatic life (EPD, l998a).<br />
Localized <strong>Water</strong>shed Studies or <strong>Plan</strong>s<br />
The Big Creek <strong>Water</strong>shed Protection Study was launched in Forsyth and Fulton counties as a<br />
comprehensive approach to address the impacts of urbanization. As the project develops, it will<br />
provide a better understanding of the impacts on water resources, which should help local<br />
governments develop better conservation guidelines, structural designs, and riparian protective<br />
measures. The study should help serve as a model for future initiatives to address urban nonpoint<br />
source impacts on streams (EPD, l998a; ARC, 1998c).<br />
Owinnett County is conducting watershed assessment and modeling (scheduled for 1999<br />
completion) to evaluate water quality in all major streams in the county as related to land use,<br />
point/non-point source pollutant loads, and the influences of urbanization. Its models should help<br />
planning pennitting decisions in protecting stream water quality into the future. The study<br />
includes the Chattahoochee River plus Crooked, Level, Richland, and Suwanee creeks within the<br />
CRNRA. Aquatic habitats and fish are part of the assessment (CH2MHiI1, 1998b)<br />
Cobb County has possibly the most intensive water quality monitoring and biological assessment<br />
program for tributaries in the area, with sampling for fish and other organisms at about 20<br />
tributary sites, as well sampling for routine chemical and fecal coliform analyses. Some of these<br />
tributary sites are in headwaters that eventually flow into the CRNRA. The county provides much<br />
of its data to the Atlanta Regional Commission and/or the State Environmental Protection<br />
Division. The 1998 data should be compiled and available in a report by late 1999. Cobb County<br />
also is considering involvement in the State’s Adopt-a-Stream Program (pers. com., R. Bourne,<br />
Cobb County, 1999).<br />
Fulton County has a “Comprehensive <strong>Plan</strong> 2010,” updated in 1998, which considers water<br />
supplies, green space/recreation needs, population growth, waste disposal, natural resources, and<br />
historic resources (Fulton County <strong>Plan</strong>ning Commission, 1998).<br />
145
The Chattahoochee River <strong>National</strong> Recreation Area is presently developing its own General<br />
<strong>Management</strong> <strong>Plan</strong> (GMP), so NPS involvement in planning activities for the area is valuable. The<br />
GMP is reviewing a number of the water-related issues considered in this report.<br />
9.3 MONiTORING ACTIVITIES IN THE AREA<br />
This sub-section reviews some of the stream assessment and monitoring activities in the CRNRA<br />
and vicinity. Monitoring efforts cover a wide range of types, from routine sampling by the state or<br />
counties, to focused efforts by groups of volunteers or by conservation organizations.<br />
Agency Monitoring<br />
Monitoring is an essential tool that agencies and organizations need for managing water<br />
resources. <strong>Water</strong> quality sampling can:<br />
•describe trends • define • develop<br />
conditions baselines<br />
•identify impacts • observe stream • document<br />
improvements violations<br />
•verity • support • establish<br />
compliance enforcement wasteload<br />
allocations<br />
(EPD, 1994)<br />
Under the Clean <strong>Water</strong> Act (CWA), the State develops water quality standards by considering<br />
three components: (i) the uses of a water body (e.g., recreation, fishing, etc); (ii) the criteria that<br />
are needed to protect the uses (such as the fecal coliform limits); and (iii) an anti-degradation<br />
provision to protect the existing uses of the water body (Shelton and Fox, 1994).<br />
The CWA advises states to develop standards. Appendix C shows the Georgia standards, namely:<br />
(i) water use instream classifications and water-quality standards; (ii) the drinking water<br />
standards; and (iii) the standards for toxic substances.<br />
The Georgia EPD plays a key monitoring role. The EPD conducts long-term monitoring at<br />
specific sites on a periodic basis to observe trends. This work is often contracted out, for example,<br />
to the U.S. Geological Survey. Routine chemical, as well as some biological, samples are<br />
collected. Toxic substance monitoring is conducted at certain sites, for example, below a large<br />
effluent point Facility compliance sampling also is carried out Sometimes intensive surveys are<br />
used to focus on a special project, for example, for model calibration. Lake studies and<br />
recreational waters also are including in EPD’s monitoring, including Lake Lather. Aquatic<br />
biological monitoring provides insight into long-term toxicity effects on aquatic life. Fish tissue<br />
monitoring provides the data for fish consumption guidelines. The Georgia EPD regularly puts<br />
these various tools to use (EPD, l998b).<br />
The counties, some other agencies (including NPS), or municipalities also have significant<br />
involvement in monitoring, often in cooperation with the EPD or the Atlanta Regional<br />
Commission. The counties monitor stormwater permit compliance, violations of erosion and<br />
146
sedimentation control, and incidents of sewage spills or leaks. With new State plans that are<br />
evolving on stormwater control, towns in the 50,000 to 100,000 population range will<br />
increasingly need to apply for <strong>National</strong> Pollutant Discharge Elimination System (NPDES)<br />
Stormwater Discharge Permits, which will require them to initiate monitoring (Bourne, 1997).<br />
The Atlanta Regional Commission has established a Regional Stormwater <strong>Management</strong> Task<br />
Force, which coordinates the monitoring required for stormwater sampling by 20 local<br />
governments. Annual monitoring reports are submitted to the Georgia EPD (EPD, l998a). The<br />
U.S. Geological Survey has been a key player in providing monitoring information, as discussed<br />
in detail in Chapters 4.4 (water quality), 6.2 (chemicals), and 6.3 (urbanization) of this report. The<br />
<strong>Water</strong> <strong>Resources</strong> Division of the <strong>National</strong> <strong>Park</strong> <strong>Service</strong> also supported the U.S. Geological<br />
Survey in water quality assessments conducted under the <strong>National</strong> <strong>Water</strong> Quality Assessment<br />
Program (Long et al., 1996) as described in Chapter 6.2 of this report.<br />
The monitoring of stream discharges and streamfiow patterns is another important form of<br />
information collection. For example, once the Apalachicola-Chattahoochee-Flint (Ui-state<br />
allocation project makes its decision (presumably in the year 2000), then it will be important to<br />
monitor the impacts of these decisions. How will the aquatic environment be affected if the<br />
releases from Buford Dam are changed, and how will water-borne recreation be impacted in the<br />
CRNRA? Conservationists and aquatic biologists believe that “post-allocation monitoring” will<br />
be essential (River Chat, spring 1998).<br />
Localized Efforts and Volunteer Efforts<br />
Private or volunteer monitoring groups can be one approach for detecting spills, leaks,<br />
stormwater runoff pollution, sediment from land-use impacts, or in observing other problems.<br />
Volunteers have been valuable in reporting sewage spills in the CRNRA (EPD, l997a; River<br />
Chat, spring 1998).<br />
The concept of volunteer monitoring programs has been in use for at least a quarter century. In<br />
the mid-l970s, the Chattahoochee Chapter of Trout Unlimited (it!) worked with the EPD and<br />
others to develop water quality surveillance, including work on the Chattahoochee River<br />
headwaters. TO volunteers measured pH, conductivity, temperature, stream stage, and dissolved<br />
oxygen in the field and collected samples for turbidity and coliforms, plus some samples of<br />
macroinvertebrates for EPD analyses (Snead, 1981).<br />
By the early l990s, the town of Alpharetta organized its Project Ripple, a volunteer monitoring<br />
program including workshops and field education. This program has been active in protecting the<br />
Big Creek watershed (West, 1997). Alpharetta also operates an environmental education program<br />
for children in conjunction with various municipalities and counties that seeks to bring greater<br />
environmental awareness into schools in the area. At this time the town is building a new<br />
environmental center, where NPS cooperation would be welcomed (pers. com., D. West, 1999).<br />
The Georgia Adopt-A-Stream program (sponsored by the State Environmental Protection<br />
Division) is a major volunteer program in stream conservation. Through this program, the public<br />
and local communities take part in visual surveys, water quality monitoring, and other stream<br />
activities (EPD, l998a). More than 5,000 volunteers are involved, often in association with civic<br />
organizations, businesses, conservation groups, and local governments. The volunteers receive<br />
technical training, environmental education, and field instruction, with hands-on technical<br />
training courses offered in macroinvertebrate surveys, chemical analyses, and field visual<br />
surveys. Conservation groups, such as Upper Chattahoochee Riverkeeper and Sierra Club also<br />
147
have been active in Adopt-A-Stream. Some examples of participating Adopt-A Stream groups are<br />
shown in Table 9.3.a.<br />
The Upper Chattahoochee Riverkeeper have a variety of volunteer activities, from the elementary<br />
to the more sophisticated, including:<br />
• stream sampling • biological analyses • software and map/GIS<br />
development<br />
• analysis of data (e.g., • “hot line” for incident • training and public<br />
NPDES reports) reporting education<br />
•development of training • operation of a web site • political action. Materials<br />
and kits<br />
The Upper Chattahoochee Riverkeeper maintains a “Stream Database” at: <<br />
http://www.chattahoochee.org>, whereby conservation groups and others can share data and<br />
observations.<br />
STREAM AREA ADOPT-A-STREAM PARTICIPANTS<br />
Big Creek City of Alpharetta, City of Roswell<br />
Suwanee Creek Allegiance Healthcare, Norcross; Gwinnett Cty Sierra<br />
Club; Suwanee Elem. School, Suwanee<br />
Long Island Creek Streams Alive!, Fulton County; Holy Innocents School,<br />
Atlanta<br />
Rottenwood Creek Lovett School, Atlanta; Sierra Club, Roswell<br />
Sope Creek Walton High School, Marietta; North Springs High<br />
School, Atlanta; Cobb County<br />
Monitoring Innovations For Volunteers<br />
Volunteer monitoring programs normally require techniques that suit their particular capabilities;<br />
therefore, some innovative monitoring methods have evolved.<br />
A 1-year study of sediment loads in the Big Creek watershed involved volunteer sampling. The<br />
key to the project was the adaptation of the old Corps of Engineers 1950-vintage “automatic”<br />
rising stage samplers, which are basically bottles on a rack, which gather sediment when a storm<br />
hydrograph rises. The sampling rack made it possible for volunteers to observe sediment and to<br />
detect erosion problems (Groszmann, 1997).<br />
The Upper Chattahoochee Riverkeeper has used a simplified kit for coliform and fecal coliform<br />
determinations (the “Coliscan Easygel” brand) for volunteer projects. This simple technique,<br />
although not an approved standard method, makes it possible to generally detect fecal<br />
contamination without the expensive incubators, stainless steel filtration gear, skills in media<br />
148
preparation, and the microbiological training associated with the membrane ifiter determinations<br />
needed for more sophisticated work (Micrology, 1997). It is ideal for volunteer monitoring. In<br />
some cases, biological techniques (e.g., counting the numbers of macroinvertebrates by genus)<br />
can be useful tools for volunteer work, where the biological samples can act as a red flag for the<br />
presence of contaminants.<br />
9.4 CONSERVATION GUIDES AND EDUCATIONAL MATERIALS<br />
In order to protect streams and watersheds from impacts, it is valuable to have volunteer<br />
technicians trained in the techniques of watershed protection and to have the general population<br />
involved in conservation. For this reason, the State EPD and other organizations in the metro area<br />
place an emphasis on education and training in stream and watershed protection (Georgia Soil<br />
and <strong>Water</strong> Cons. Comm., 1996). The State EPD will be emphasizing public involvement in<br />
decision-making and in programs of stream improvement (EPD, l996a).<br />
Making the Public Aware<br />
The Atlanta Regional Commission promotes public awareness of watershed protection. A<br />
community working group on water developed a vision for the 2l~ Century environment to<br />
encourage the public (and local governments) to:<br />
• preserve water for recreation;<br />
• reuse wastewater, to help recharge aquifers;<br />
• stress adequate buffers along streams;<br />
• clean up existing landfills;<br />
• promote best management practices;<br />
• involve local citizens in tributary ecosystem management;<br />
• improve effluent quality and stormwater control; and<br />
The ARC’s program of work reflects citizen’s interests and includes several action items to:<br />
• develop a Regional <strong>Water</strong> Quality <strong>Plan</strong>;<br />
• produce a Stormwater Design Manual;<br />
• coordinate a <strong>Water</strong> and Sewer Study Commission;<br />
• facilitate a Big Creek watershed study;<br />
• provide local governments with watershed assistance;<br />
• facilitate source water protection assessment from metro area water utilities; and<br />
• coordinate the forecasting of weekly water needs from the Chattahoochee River and<br />
Lake Lather County (among other items) (ARC, l997a).<br />
ARC alerts people to the Metropolitan River Protection Act (MRPA) and promotes its goals and<br />
program elements for protecting the river, tributary streams, and riparian areas.<br />
Providing Technical Guidelines<br />
The State Environmental Protection Division (EPD) and the Department of Community Affairs<br />
promote conservation guidelines for local governments to use, for example, their “Criteria for<br />
<strong>Water</strong>shed Protection,” which includes recommendations such as:<br />
149
• limit impervious surface densities to 25 percent or less over a 100 mi 2 watershed;<br />
these requirements do not apply to the intakes and their watersheds on the<br />
Chattahoochee River;<br />
• use buffers/setbacks of 100/150 feet within a 7-mile radius of a water supply intake,<br />
and 50175 feet beyond the 7 miles for 100 mi 2 watersheds or less; these<br />
requirements do not apply to the intakes and their watersheds on the Chattahoochee<br />
River; and<br />
• keep a 150-foot buffer around the perimeter of a reservoir (for watersheds of < 100<br />
mi 2 ) (EPD, l998a).<br />
The 25 percent impervious surface limit and the buffer limits do not apply to the Big Creek water<br />
supply watershed above the city of Roswell intake.<br />
The ARC provides local governments technical guidelines on conservation and watershed<br />
protection as well, encouraging the governments to:<br />
• Enact “land-use controls,” such as setting a minimum on housing lot sizes (larger lots =<br />
less pollution);<br />
• Expand the buffers in sensitive areas (e.g., steep slopes);<br />
• Exclude sewer/water service to some areas --to limit development;<br />
• Promote cluster development (which reduces total impervious surface);<br />
• Require tree covers in riparian or sensitive zones;<br />
• Set impervious surface percent limits (
These handbooks also provide information on the Erosion and Sediment Control Law, the<br />
Erosion and Sediment Control <strong>Plan</strong>, buffer requirements, and requirements for disposal of<br />
construction waste materials (Soil and <strong>Water</strong> Conservation Districts, Cobb County, 1997; Fulton<br />
County, 1997).<br />
Gwinnett and Forsyth counties provide similar guidelines, such as the “Field Manual for Erosion<br />
and Sediment Control in Georgia,” by the Georgia Soil and <strong>Water</strong> Conservation Commission.<br />
This manual provides an excellent set of best management practices (BMPs) for use by<br />
contractors and others covering:<br />
• streambank protection • seeding • drawdown structures<br />
• gabions • geotextiles • drop inlet structures<br />
• sediment traps • slope protection • waterways<br />
• retaining walls • sediment barriers • basins.<br />
Gwinnett County (1998) provides valuable training courses and materials, such as the booklet<br />
“Guidelines for Streambank Restoration” from the Georgia Soil and <strong>Water</strong> Commission (1994).<br />
This report provides excellent illustrations and descriptions on erosion control techniques, with<br />
emphasis on vegetation (and less on structures). Some topics include:<br />
• streambank erosion • live plantings for banks • fascines & cut branches<br />
• brush mattresses • covers for streambanks • cribwalls with plants<br />
• riprapping + plants.<br />
The counties also provide booklets on stormwater as well, including Forsyth County’s “Storm<br />
<strong>Water</strong> <strong>Management</strong> Design Manual (Forsyth County, 1998)” which provides details on:<br />
• drainage pipe designs • stormwater detention<br />
and calculations<br />
ponds<br />
• stormwater mgt • definitions & lists of<br />
ordinances<br />
best mgt practices<br />
• the stormwater plan • maintenance<br />
requirements.<br />
Promoting Education<br />
151<br />
• reporting requirements<br />
for plans etc<br />
• obtaining a permit<br />
Educational materials and workshops on watershed and stream protection are increasingly<br />
available--mostly of a general or semi-technical nature. The State Environmental Protection<br />
Division’s Project WET (<strong>Water</strong> Education for Teachers) is targeted at educators and students in<br />
grades K-12, and provides training for educators. Project WET provides the teachers with an<br />
understanding of the problems of non-point source pollution and of the tools that can be used to<br />
prevent, control, or abate these impacts. The project produces training materials, demonstrations,<br />
and a newsletter, and conducts workshops and field walking trips (EPD, 1998a). The CRNRA has<br />
facilitated Project WET workshops for teachers at its Geosphere Environmental Education<br />
Training Center (Giroux, 1997).<br />
The State Environmental Protection Division (EPD) offers Adopt-A-Stream training courses,<br />
presentations, and workshops around the state, with major focus on the Atlanta metro area. Each<br />
year about 500 volunteers participate in these training activities. The EPD has distributed about
1,000 Georgia Adopt-A-Stream manuals to volunteers and a bi-monthly newsletter is<br />
disseminated. Each fall, the annual Georgia River Clean-Up Week brings volunteers out to clean<br />
up river segments around the state (EPD, 1998a).<br />
In 1997, the U.S. Geological Survey and <strong>National</strong> <strong>Park</strong> <strong>Service</strong> collaborated to produce an<br />
illustrated, educational poster “Everyone Lives Downstream” (Hippe et al., 1997). This poster<br />
has been popular as a teacher educational tool, and during the last 2 years it has appeared on<br />
many classroom and office walls in the Atlanta metro area and Chattahoochee River basin.<br />
10.0 RECOMMENDATIONS<br />
10.1 OVERVIEW<br />
This chapter lists recommendations and ideas for potential activities, projects, and actions in the<br />
area of water resource management.<br />
• Section 10.2 offers some general recommendations to park resource staff. The authors view<br />
these as higher priority.<br />
• Section 10.3 consists of items that may be appropriate for submission to the NPS <strong>Water</strong><br />
<strong>Resources</strong> Division's annual call for short-term technical assistance requests.<br />
• Section 10.4 contains recommendations more closely related to public health and safety, and<br />
therefore may rate a higher priority for consideration.<br />
• Section 10.5 comprises various items on water quality monitoring and watershed protection.<br />
Some of these are of more immediate concern, but others are for future consideration.<br />
• Six of the higher-priority recommendations from 10.4 and 10.5 have been developed into<br />
Project Statements (proposals) which appear in Chapter 11.<br />
10.2 GENERAL RECOMMENDATIONS<br />
The items in this section are general recommendations which relate to setting priorities, selecting<br />
targets, and developing program elements.<br />
1. Use the New Senior Position in <strong>Resources</strong> <strong>Management</strong> to Strengthen the <strong>Water</strong><br />
Program: This report's authors recommend that the new senior resources management position<br />
(to begin in mid-2000) focus primarily on water resources. The position would cover planning,<br />
project design, cooperation, public relations in water resources, proposal preparation, and the<br />
other aspects of strengthening the water activities. In addition, it is suggested that one internlevel<br />
position focus on water resources. The intern-level position could provide support in<br />
monitoring, GIS functions, database assembly, and other technical roles to backstop the two<br />
Natural Resource Specialists. The <strong>National</strong> Recreation Area would be able to develop a viable,<br />
permanent and sustainable water program, if these positions focus on water-related activities.<br />
2. Integrate the Natural Resource, Ranger, and Interpretive Programs: The new senior<br />
position in resources management should seek to better integrate the natural resources program<br />
with the work of the rangers and interpreters. For example, the CRNRA's Geosphere Program<br />
152
and other programs could participate in the “river-monitoring program” of Project Statement No.<br />
2, Chapter 11.<br />
3. Conduct a Follow-Up Analysis of Specific Cooperation Opportunities: The CRNRA<br />
has cooperated with some important entities, such as the U.S. Geological Survey and the State<br />
DNR (e.g., EPD and FWD); however, the Recreation Area has little cooperation with some other<br />
equally-important entities [recognizing that the critical lack of staffing at the CRNRA to date is<br />
the main reason]. It is recommended that the future senior resource manager meet with a number<br />
of the organizations listed in Appendix B of this report to evaluate:<br />
• what ongoing programs or activities of the counties or other local organizations;<br />
would strengthen CRNRA's own specific goals, if close cooperation were established;<br />
• what organizations/agencies have motivation to cooperate (e.g., the technical people<br />
in Gwinnett County are receptive to joint work; Alpharetta likewise has expressed<br />
strong interest);<br />
• what programs are suitable for “piggybacking” (e.g., Gwinnett's Adopt-a-Stream<br />
effort is active inside the CRNRA); and<br />
• what ongoing training programs are useful for CRNRA staff to attend.<br />
4. Develop Stronger Local Cooperation: Research cooperation with Federal and State<br />
agencies can continue to be valuable; however, it is recommended that special emphasis should<br />
go toward strengthening applied cooperation at the county level--where routine monitoring and<br />
watershed management takes place. Closer cooperation with non-governmental organizations<br />
also can allow NPS to have a greater influence on the control of water pollution.<br />
10.3 TECHNICAL ASSISTANCE REQUESTS<br />
The items in this sub-section may be appropriate for submission to the NPS <strong>Water</strong> <strong>Resources</strong><br />
Division’s (WRD) annual call for short-term "technical assistance requests."<br />
1. Technical Assistance Request -- Build a <strong>Water</strong> Quality Database: As a follow-up to the<br />
water quality overview provided in this <strong>Water</strong> <strong>Resources</strong> <strong>Management</strong> <strong>Plan</strong>, request that the NPS<br />
<strong>Water</strong> <strong>Resources</strong> Division conduct a more complete statistical analyses and interpretations of the<br />
latest water quality data available from the counties, State, STORET, or other sources. The<br />
NPS/WRD routinely provides such analyses of water quality information for parks, and the<br />
CRNRA reportedly is on the list to receive such assistance. Such analyses obviously would be<br />
valuable. In addition, the U.S. Geological Survey plans to compile a water quality summary as<br />
well (pers. comm., Chattahoochee River <strong>National</strong> Recreation Area, 1999). A combined<br />
NPS/USGS effort would be ideal.<br />
2. Technical Assistance Request -- Evaluate the Effects of the Tri-State <strong>Water</strong><br />
Allocation Formula: Confer with the Corps of Engineers and other agencies to evaluate the<br />
effects of the Tri-State <strong>Water</strong> Allocation Formula once it has been approved and is applied.<br />
Review the allocation formula to determine if the flows allocated are acceptable for recreation<br />
and fisheries. The Tri-State effort paid little attention to river recreation in developing the water<br />
allocation formula; therefore, it is important that a “post-formula” analysis determine if<br />
CRNRA’s needs have been met. The technical assistance also may need to include development<br />
of a proposal for a project to carry out some additional analysis on the allocation.<br />
153
3. Technical Assistance Request -- Help Develop Better Guidelines for Instream Sand<br />
and Gravel Mining: Information available on the impact of instream sand and gravel instream<br />
mining within the CRNRA is quite old. This short-term technical assistance would allow a WRD<br />
specialist to confer with the CRNRA, the Corps of Engineers, the State DNR, and State EPD to<br />
design a project and prepare a project proposal. The project to be proposed would: (i) evaluate<br />
the effects of the in-stream mining on the fish and aquatic biology populations in the river; (ii)<br />
evaluate any guidelines now in use; and (iii) develop updated guidelines for managing the sand<br />
and gravel mining, to protect the river water quality, fish habitat, and aesthetics along the river.<br />
Guidelines would include recommendations on the size, extent, pattern, and distribution of<br />
dredging sites that would provide the best pool/riffle combination for fish, produce the fewest<br />
hazards for recreationists, and be least disruptive of the environment, aesthetics, or river<br />
recreation.<br />
4. Technical Assistance Request -- Help CRNRA Develop a Project Statement on<br />
CRNRA’s Role and Function in River, Riparian Zone, Wetland, and <strong>Water</strong> Resource<br />
<strong>Management</strong>: A complexity of political entities as well as regulations are present along the<br />
river, with an array of counties, towns, and organizations within the CRNRA. An analysis is<br />
needed, to understand the legal role(s) that NPS is entitled to assume in protecting water<br />
resources in the river, streambank, and riparian areas. A clarification of the CRNRA’s legal<br />
options would allow the park to better support local actions to protect the riverine environment<br />
and to understand those areas where NPS can take the lead. This technical assistance from the<br />
<strong>Water</strong> <strong>Resources</strong> Division would help CRNRA staff refine the Project Statement of this title<br />
(shown in Chapter 11), to help flesh out the budgetary, staffing, specific steps of the work plan,<br />
and other basic details of the proposal. (See Project Statement No.6, Chapter 11)<br />
5. Technical Assistance Request -- Evaluate Land Acquisition Options from the <strong>Water</strong><br />
Resource Perspective: Evaluate those parcels of land which are potential parkland acquisitions<br />
along the river or its tributaries, to determine which parcels have the highest potential impact on<br />
the river, i.e., which parcels could produce the most sediment and other impacts. Slopes, soils,<br />
present vegetative cover, proximity to the 100-year floodplain, and other physical and biological<br />
factors would need to be evaluated. The analyses would identify potential land acquisition areas<br />
where the benefits of water quality protection benefit would be the greatest or conversely, where<br />
the pollution risks are the greatest. The acreage offering greater river protection could be<br />
afforded a higher priority for purchase or encouragement for purchase by trust fund groups or<br />
others.<br />
6. Technical Assistance Request – Address the Bank Sloughing Problem Caused by<br />
Hydroelevation Surge Flows: This problem should be brought to the attention of the U.S.<br />
Army Corps of Engineers District office in Mobile, AL before they complete the FEIS for the<br />
ACR compact. Secondly, an attempt should be made to quantify the amount of widening of the<br />
river channel in the upper reach of the CRNRA and also quantify the sediment added to the river<br />
on an annual basis. Finally, determine possible stabilization and mitigation needed.<br />
10.4. PUBLIC HEALTH RELATED RECOMMENDATIONS<br />
1. Develop a Bacterial <strong>Water</strong> Quality Monitoring Program of Recreational <strong>Water</strong>s with<br />
CRNRA: Approximately 12 sites along the 48-mile river corridor of CRNRA are heavily used for<br />
aquatic-based recreational activity. Prudent management dictates that a recreational water quality<br />
monitoring program be a high park priority. Monitoring protocols will be designed in consultation<br />
with the U.S. Public Health <strong>Service</strong> and the Georgia Environmental Protection Division that will<br />
154
oth meet the intent of Directive Order #83 (<strong>National</strong> <strong>Park</strong> <strong>Service</strong>, 1999) and also be consistent<br />
with state water quality standards. (See Project Statement No. 3, Chapter 11).<br />
2. Develop a System to Display <strong>Water</strong> Pollution and Quality Information: Develop a<br />
method to compile and display recent and current water quality indicator data and information<br />
available from the counties, municipalities, private organizations, State, U.S. Geological Survey,<br />
or others. Make this information easily available to NPS park visitors and provide interpretations.<br />
The information could be displayed on a homepage, placed on a telephone hotline, or shown in<br />
printouts at park units, visitor centers, raft rental sites, fishing locations, swimming areas, or boat<br />
ramps. A project is needed to design and test a method to routinely access, store, and quickly<br />
display this information to the public. (See Project Statement No. 4, Chapter 11)<br />
3. Enter Pipeline Information into the CRNRA’s GIS System: Working with the counties,<br />
municipalities, and pipeline companies, enter sewer pipeline into the new GIS maps of the<br />
CRNRA’s individual units. This map information will provide a tool to help track pipeline and<br />
manhole sewage leaks. Leaks have polluted CRNRA units and nearby waters with raw sewage<br />
and presented a serious health hazard. (See Project Statement No. 1, Chapter 11)<br />
4. Evaluate Metal Concentrations in Prime Fishing Areas of the CRNRA: In<br />
cooperation with the State DNR, review information on the concentrations of common metals<br />
(Cd, Zn, Hg, Pb, and Cu) in river water, substrate, sediment, invertebrates, and fish tissue at<br />
popular fishing sites within the CRNRA. Although the State provides routine analyses of metals<br />
along the river, the CRNRA could benefit from more focused information on the fishing sites that<br />
NPS manages. The information would assist the CRNRA to better advise its visitors on health<br />
hazards and to understand the impacts of metals on aquatic habitats in the CRNRA. The data<br />
would allow the NPS to request adjustments in the State’s monitoring sites and schedules to<br />
provide greater benefit to the CRNRA.<br />
10.5 GENERAL WATER QUALITY MONITORING AND<br />
OTHER RECOMMENDATIONS<br />
1. Design and Initiate a River Monitoring Program for the Recreation Area: Develop<br />
simple monitoring protocols and a monitoring design for collecting diverse sets of information<br />
about river conditions, using readily available equipment and utilizing the park’s staff from all<br />
divisions, plus volunteers. The collected data should be credible and adequate for alerting park<br />
management of problems needing special attention. The data should be in formats useful to all<br />
park divisions and acceptable for scientific analysis. The design project should recommend a<br />
final suite of data collection schedules, data recording and archiving responsibilities, and the<br />
staffing requirement to conduct a permanent park program of river monitoring. (See Project<br />
Statement No. 2, Chapter 11)<br />
2. Develop a Cooperative Volunteer Monitoring Program: Develop a monitoring program<br />
to spot or track problem areas where contaminants could enter waters of the CRNRA --for<br />
example, areas where sewage spills have occurred and could take place again. Simple<br />
techniques, the involvement of volunteers, and cooperation with another organization would be<br />
the basis of the project. Conduct this work in tandem with a program underway, for example,<br />
Gwinnett County’s Adopt-a-Stream program, some of Riverkeeper’s efforts, or Cobb County’s<br />
monitoring activities. Linking to existing programs would make the effort much easier.<br />
Volunteer-based monitoring programs are often not suitable for routine monitoring, however they<br />
155
can be used to identify, flag, and publicize specific pollution problems of concern. [suggested as<br />
a higher priority project]<br />
3. Identify and Map Key Sources of Impacts on <strong>Water</strong>sheds: Identify the principal existing<br />
and potential sources of impacts on the water resources in the CRNRA, and enter this information<br />
into the Recreation Area’s GIS system. Many potential significant impacts exist, for example,<br />
major shopping centers, large subdivisions, new highway projects, expanding sewage treatment<br />
plants, etc. Use existing project and development information from counties, municipalities, and<br />
planning organizations, and, wherever possible, obtaining the information in GIS format. The<br />
information would allow the CRNRA to recognize key problem areas, to help exert influence on<br />
development designs for water protection and protection of fish habitat from sediment and other<br />
impacts. [suggested as a medium-to-higher priority project]<br />
4. Evaluate the Effectiveness of Sediment Control: Conduct a cooperative project (e.g.,<br />
with a county) to evaluate sediment levels flowing in from development, road construction, and<br />
other watershed disturbances in selected tributaries within the CRNRA where sediment is a<br />
salient problem. Sample storms with rising stage automatic sediment samplers (bottles fill during<br />
storms), using field volunteers for sample collection and cooperating with the State or a county<br />
laboratory for sediment filtration. In recent years, some volunteer-based studies in a few sites<br />
have been effective to demonstrate that prevailing methods of erosion control are not effective,<br />
and that sediment/turbidity levels are excessive in many tributaries around and above the<br />
CRNRA. However, the information is very limited. Additional studies could help publicize the<br />
need for better erosion control in specific areas of concern to the CRNRA. In addition, this<br />
project should collect some background river stability and geomorphological information, for<br />
example, on widths, depths, bed material, stream types, etc. [suggested as a medium-to-higher<br />
priority project]<br />
5. Evaluate the Instream Flow Needs of the CRNRA for Recreation: Studies of flows in<br />
the river related to recreation are 15 years old, as reported in Section 5.4 of this report. The<br />
CRNRA needs fresh information on models for water-based recreation/and streamflow relations,<br />
to determine: (i) optimal flow conditions for recreation in the CRNRA; (ii) the economics of<br />
water based recreation; and (iii) the demands of river-based recreation. (See Project Statement No.<br />
5, Chapter 11)<br />
6. Evaluate Effects of Septic Tanks on Surface <strong>Water</strong>s: Develop a short-term, cooperative<br />
monitoring project to evaluate possible water pollution from large-scale subdivision areas where<br />
septic tanks threaten the river. Samples for chemicals (nitrates, conductivity, chlorides, etc) and<br />
microbial indicators would be taken from selected tributaries above and below areas of suspected<br />
septic tank seepage, with sampling carried out under a range of hydrologic conditions. The<br />
project would help identify sites of potential septic tank problems in and upstream from the<br />
CRNRA and provide information to publicize problems to encourage stronger guidelines and<br />
enforcement on septic tank use. [suggested as a medium-to-higher priority project]<br />
7. Conduct an Economic Evaluation of <strong>Water</strong>-Based Recreation and Fishery at the<br />
CRNRA: Good information on the economics of river recreation within the CRNRA is lacking.<br />
Quantification of the financial value of recreation at the park could help attract project support,<br />
inspire cooperative projects, attract attention for the CRNRA, and help justify investment in<br />
projects to protect the river environment. [suggested as a medium-to-higher priority project]<br />
156
8. Better Quantify Buford Dam’s Effects on the Aquatic Habitat Within the CRNRA:<br />
Cooperate with the State Department of Game and Fish and the EPD to support their efforts to<br />
better understand the effect of Buford Dam’s releases on dissolved oxygen, metals, or other<br />
constituents in the river--at the upper end of the CRNRA. Seek additional information to<br />
interpret the effect of these constituents on the fish and aquatic habitat in terms of metals<br />
accumulation, aquatic organism impacts, or potential human health impacts. The project would<br />
complement efforts of the State to strengthen its projects to quantify and interpret water quality at<br />
the most popular fishing sites within the CRNRA. By better understanding the impacts of the<br />
dam, it would be possible to explore options to lessen or manage these effects.<br />
[suggested as a medium-priority project]<br />
9. Inventory the Aquatic Biology and Assess Biological Integrity of CRNRA<br />
Tributaries: Only a few studies have evaluated the aquatic organisms and the biotic<br />
communities of the tributaries of the CRNRA. Baseline information on the tributaries’ aquatic<br />
biologies will be a key yardstick for future environmental evaluations in this rapidly urbanizing<br />
area. Analyzing this baseline information using multimetric indices will allow an assessment of<br />
biological integrity. These indices can be used on a regular basis as a long-term monitoring tool<br />
or to evaluate mitigation activities. (See Project Statement No. 7, Chapter 11)<br />
10. Evaluate Optimal Designs for Riverside Trails and Recreational Landings: Evaluate<br />
the locally-used designs for trails, boat landings, and river access points to determine what<br />
combination of materials and designs work best for erosion and water quality protection along the<br />
river within the CRNRA units. Carry out surveys following storms to evaluate the extent of<br />
erosion, estimated sediment losses, and durability at each structure or treatment for trails,<br />
landings, or other features [“treatment” involves various materials or combinations of<br />
biological/physical actions]. [suggested as a medium-priority project]<br />
11. Delineate the Wetlands within the CRNRA Units and Describe Riparian<br />
Vegetation: Define wetland and vegetative information for the park units and enter the<br />
information into the CRNRA’s evolving GIS databases. The park's small wetlands are vital in the<br />
preservation of wildlife and birds and for nature appreciation. Delineation of wetlands within the<br />
CRNRA would help in protecting these ecosystems. [suggested as a future, lower-priority<br />
project]<br />
12. Conduct Fish Surveys to Evaluate the Effect of Biomass Increase and Changing<br />
<strong>Water</strong> Quality on the River and Fisheries at the CRNRA: Appraisal (in cooperation with the<br />
Department of Natural <strong>Resources</strong>) of both the fishery and the public angling activity could be used to<br />
provide the information for the management of this fishery. There have been several changes to the<br />
trout fishery since 1983. Numbers of stocked, catchable trout have progressively increased since the<br />
early 1980s. Regulations were changed from seasonal to year-round fishing in 1996. What is the<br />
effect of these changes? Appraisals are needed. (See Project Statement Abstract No.4, Appendix A)<br />
157
11.0 PROJECT STATEMENTS (PROPOSALS)<br />
PROJECT STATEMENT NO. 1<br />
Title: Develop a Pipeline Information System for Monitoring Pollution and Spills<br />
Funding Status: Funded: 0 Unfunded: $ 27K<br />
Problem Statement<br />
Pipelines, pumping stations, treatment plants, manholes, and other features of sewerage systems<br />
in the CRNRA area sometimes malfunction or overflow. Hazardous raw sewage then pours out<br />
onto park grounds, into nearby creeks, or into the river, posing a serious risk to visitors' health.<br />
For example, a clogged pipe caused a spill over 2 days in June 1998 and dumped some 600,000<br />
gallons of raw sewage into one park unit. A similar major spill occurred in July 1999. The<br />
problem occurs frequently.<br />
The park needs a mapping system for depicting the sewage pipelines and facilities that traverse<br />
the park units, or are found close by. A system of large-scale maps digitized for use in a<br />
geographic information system format would:<br />
• highlight sites where past leaks have occurred, especially locations of special concern (for<br />
example, a manhole next to a popular jogging trail);<br />
• provide a systematic way to keep visible and digital records of pipelines as well as spill<br />
events, and record them on maps;<br />
• offer a way to flag areas of high risk (e.g., areas near pipes where visitation is particularly<br />
heavy, where pipes run next to swimming sites or boat ramps, etc); and<br />
• provide a useful tool for publicizing spills, by having the information in a format easily<br />
distributed in hard copy, online, or to the press via email;<br />
• serve as a tool to help predict where spill problems are likely to occur.<br />
The project would operate in close cooperation with local conservation groups involved in<br />
calling alert to pipeline pollution problems and in reporting leaks or spills.<br />
The CRNRA has a newly yet slowly revolving geographic information system (GIS); however,<br />
does not have a GIS specialist on the staff. No CRNRA staff member has the level of GIS<br />
expertise needed to design and set up a system of maps, hence the need for this project. GIS<br />
consulting expertise is readily available in the Atlanta area.<br />
Description of the Recommended Project or Activity<br />
This project proposes to develop a mapping and tracking system for recording, monitoring, and<br />
reporting on sewage leaks or overflows in the CRNRA. The system would be established in the<br />
Recreation Area, based on ArcView software and compatible with the geographic information<br />
system now being developed in the CRNRA.<br />
158
The consulting work to carry out this project would necessarily be done in close conjunction with<br />
the local counties, municipalities, and planning agencies, to enter existing pipeline and other<br />
information that they have into the Recreation Area's GIS. Some of the existing information is<br />
already in a digital format, but not necessarily ArcView. Some maps will be only in hard copy<br />
formats, and some information may only be in engineering or maintenance office files.<br />
The essential steps for a consultant to carry out the project would be as follows:<br />
(1). Review all information on sewage infrastructures available at the CRNRA, including hardcopy<br />
maps, any digital geographic information, or reports. Visit key entities in the area, to<br />
borrow or copy relevant maps, make copy of available GIS digital data on pipelines, meet with<br />
maintenance and engineering coordinators to learn about new unmapped pipes, and gather<br />
relevant reports or other information on sewerage systems within or adjacent to the CRNRA.<br />
Gather any reports available on spills. This phase of work would involve visits to four counties, a<br />
few municipalities, and the Atlanta Regional Commission, at a minimum. [2.5 weeks]<br />
(2). Access local newspaper records, county records, and other historical information sources to<br />
summarize the sewage spill and overflow events which have occurred in or adjacent to the<br />
CRNRA within the past decade. Record dates, sites, gallons lost, or other details available. [2<br />
weeks]<br />
(3). Digitize the pipeline information that is found only on hard copy maps. Convert other GIS<br />
digital data into ArcView, so all information will be in the format suitable for entry into the<br />
CRNRA’s GIS. Digitize historical information on spills as well. Develop a color system for the<br />
pipelines and also for segments of the pipelines. For example, red pipe segments might = highest<br />
risk; yellow = medium; green = low. Stretches of highest risk, for example, would be: (i) areas<br />
where a stretch of pipe is in close proximity to swimming areas, popular trails, or other sensitive<br />
sites; and (ii) sites where spills have occurred and caused problems in the past and might be<br />
expected to spill again. Develop a symbol to show where spills have already occurred, with dates<br />
and volumes shown. [3 weeks]<br />
(4). Enter the pipeline, other sewerage, and historical spill information into the CRNRA's GIS<br />
system, with expanded views of the individual park units. [3 weeks]<br />
(5). Provide short-term training to the CRNRA staff on how to operate the system so they can<br />
print out maps, save maps to other formats, add information (as situations change or spill events<br />
occur), and put certain information online for access on homepages. [1 week]<br />
The Products and Deliverables<br />
• The project's consultant would provide the CRNRA with a functioning system in ArcView<br />
which will provide both historical and current information on pipelines and other sewerage<br />
system features in the Recreation Area and provide maps to show where high risk areas are<br />
present.<br />
• CRNRA staff will have been trained in the use of this system and in how to input new<br />
information.<br />
• The consultant will produce a final report with large-scale maps, brief interpretive text, and a<br />
set of instructions on how to use the system.<br />
159
The budget would consist of $20,000 salary; $1,500 local travel/per diem; $1,000 telephones,<br />
printing supplies, paper; and, $4,500 overhead for a total of $27,000. The CRNRA would<br />
provide 1 month of staff time to work with the consultant.<br />
Budget and FTEs<br />
---------------FUNDED---------------<br />
Source Activity Fund Type Budget ($1K) FTEs<br />
Total 0.1<br />
Budget and FTEs<br />
---------------UNFUNDED---------------<br />
Source Activity Fund Type Budget ($1K) FTEs<br />
Total 27.0<br />
______________________________________________________________________________<br />
PROJECT STATEMENT NO. 2<br />
Title: Design an Integrated River Monitoring Program for the Chattahoochee River<br />
<strong>National</strong> Recreation Area<br />
Funding Status: Funded: 0 Unfunded: $75K<br />
Problem Statement<br />
Protecting the health and safety of the CRNRA visitors while promoting an enjoyable and<br />
educational experience requires that the CRNRA maintain an awareness of conditions of the river<br />
and river corridor. Up-to-date information should be collected by regular, periodic monitoring by<br />
boat along the river, supplemented by inspection from riverbank sites. The extent of data that<br />
needs to be collected is considerable and needs to be efficiently integrated to maximize the<br />
limited resources of the Recreation Area. A 2-year project is needed to: design the data collection<br />
protocols and monitoring schedules; field test the procedures; and assess staffing requirements.<br />
The project would ensure that the information collected is credible and adequate. The project<br />
would also test options to integrate the CRNRA’s Resource <strong>Management</strong>, Ranger, Interpretation,<br />
and volunteer programs into a viable, ongoing, river monitoring program.<br />
The objective of the design project would be to develop simple monitoring protocols for<br />
collecting diverse sets of information about river conditions, using readily available equipment<br />
and utilizing the CRNRA’s staff from all divisions and volunteers. The collected data should be<br />
adequate to alert park management of problems needing special attention. Such “alerts” would be<br />
based on water quality standards, criteria, and other quantifiable numbers available from the<br />
monitoring. The data should be available in formats useful to all <strong>Park</strong> divisions as well as for<br />
scientific analysis. The project should recommend a final suite of data collection schedules, data<br />
recording and archiving responsibilities, and the park staffing requirement to conduct a<br />
permanent and sustainable Recreation Area program of river monitoring.<br />
A diverse data collection program is needed, and the diversity is a challenge to developing an<br />
efficient, low-budget program. The design should assess the importance of the individual data<br />
collection components; the efficiency of various monitoring schedules in terms of park staffing,<br />
equipment, and data adequacy; and the training that would be required to operate the equipment<br />
and record and prepare the data.<br />
160
The project should determine what data collection efforts would be required to do the following<br />
in an integrated river monitoring program:<br />
• Document stream bank and island erosion;<br />
• Document sewer line and outfall conditions along the river;<br />
• Document sand and gravel operations along the river;<br />
• Collect visitor use statistics on the river;<br />
• Collect data from fishermen on fish health and condition;<br />
• Document river hazards (fallen trees, in-stream debris, etc.);<br />
• Document land development along immediate corridor of the river;<br />
• Document condition of streams entering the river (especially for sediment increases);<br />
• Document conditions of bridges and utilities crossing the river;<br />
• Document changes in the river’s cross-section profile at select sites; and<br />
• Document trash accumulations along the river.<br />
Description of the Recommended Project or Activity<br />
Year 1:<br />
• Conduct a workshop with all park divisions and outside experts to select the data<br />
collection components of a river monitoring program.<br />
• Develop data collection procedures and collection schedules required for each<br />
component.<br />
• Survey the river for data collection sites.<br />
• Select and purchase necessary equipment for conducting the data collection.<br />
• Design data collection forms and data recording procedures.<br />
• Evaluate alternative combinations of data collection river runs for procedural<br />
efficiency, equipment adequacy, and park staffing requirements.<br />
• Select "photopoints" on the river.<br />
• Design and develop computer data files and programs.<br />
• Conduct second workshop to review efficiencies of procedures, equipment, schedules,<br />
manpower estimates, data recording and analysis.<br />
During the first year, involve park staff from the different divisions in the actual fieldwork and<br />
data recording to assess the training requirements that would be necessary to implement a full<br />
river monitoring program.<br />
Year 2:<br />
• Select final suite of data collection components, establish a full year’s schedule of<br />
river monitoring, and select final data collection sites.<br />
• Assign aspects of the river monitoring responsibilities to the CRNRA staff in order to<br />
assess fully the training requirements needed and the scheduling problems likely to<br />
arise in a park-run monitoring effort.<br />
• Review with park management and staff the proposed one-year test of the monitoring<br />
suite.<br />
• Conduct a 1-year test of protocols, schedules, equipment, data recording and analysis<br />
using as much of the Recreation Area’s own staff as appropriate. Adjust procedures<br />
as necessary to maintain adequacy of the data collection.<br />
161
• Evaluate the one-year test and recommend a final suite of data collection components,<br />
data collection schedules, data collection protocols, equipment, staffing requirements,<br />
training needed, best data formats, and appropriate data analysis and reporting.<br />
Budget and FTEs<br />
FUNDED<br />
Activity Fund Type Budget ($1K) FTEs<br />
Year 1 0.3<br />
(matching funds to be determined by CRNRA)<br />
Year2<br />
UNFUNDED<br />
Year 1: Workshops, Protocol<br />
Design, River Survey,<br />
Equipment Purchase,<br />
Data Format Design<br />
and Development,<br />
Staff Training 40<br />
Year 2: Workshops, One-Year<br />
Test of Monitoring<br />
Suite Utilizing <strong>Park</strong><br />
Staff, Evaluation of<br />
Data Format Adequacy,<br />
Staff Training 35<br />
Total 75 0.3<br />
($50K request to WRD; $25K from matching)<br />
________________________________________________________________________<br />
PROJECT STATEMENT NO. 3<br />
Title: Bacterial <strong>Water</strong> Quality Monitoring of Recreational <strong>Water</strong>s within Chattahoochee<br />
River <strong>National</strong> Recreation Area<br />
Funding Status: Funded: 0.00 Unfunded: 13.00-60.00 (annual)<br />
Problem Statement<br />
High levels of fecal-indicator bacteria are the principal basis for the impairment of streams in the<br />
metropolitan Atlanta area, including the Chattahoochee River and its tributaries (Georgia<br />
Environmental Protection Division, 1998). The levels of microbial contamination are of particular<br />
concern in the Chattahoochee River <strong>National</strong> Recreation Area (CRNRA) where water-based<br />
recreational activities including fishing, boating, tubing, wading, and swimming are popular<br />
visitor activities. There are numerous potential sources of microbial contaminants within the<br />
heavily populated upper Chattahoochee River watershed including urban/suburban stormwater<br />
runoff, leaking and overflowing sanitary sewers, and raw or partially-treated sewage that<br />
sometimes bypasses wastewater treatment facilities and is discharged into the river. While<br />
elevated fecal coliform bacteria levels are one of the most commonly listed causes of “nonsupport”<br />
of the State’s designated uses of the waters within the Chattahoochee River and its<br />
tributaries (Georgia Environmental Protection Division, 1998) , the <strong>National</strong> <strong>Park</strong> <strong>Service</strong><br />
162
currently lacks a recreational water quality monitoring program within the <strong>National</strong> Recreation<br />
Area. Consequently, the situation may exist where the public is sometimes allowed to recreate in<br />
waters that exceed recommended public health standards for recreational use.<br />
<strong>National</strong> <strong>Park</strong> <strong>Service</strong> Director’s Order 83: Public Health (dated August 2, 1999) directs NPS<br />
park managers to reduce the risk of waterborne disease by requiring that designated bathing<br />
beaches and recommending that other heavily utilized recreational waters be appropriately<br />
monitored. Guidance pertaining to this monitoring are found in Reference Manual 83 (NPS,<br />
1999) and include:<br />
Conducting a sanitary survey<br />
Preparing a bathing beach monitoring protocol<br />
Sampling for enterococcus or Escherichia coli bacteria levels<br />
Issuing swimming advisories when bathing beach waters exceed the bacterial<br />
standards<br />
While Chattahoochee River <strong>National</strong> Recreation Area does not contain designated bathing<br />
beaches, wading, rafting and canoeing are popular, and approximately 8 sites along the 48 mile<br />
river corridor are considered to be heavily utilized for aquatic-based recreational activity (Bill<br />
Carroll, Assistant Superintendent, Chattahoochee River NRA, personal communication,<br />
February, 2000). This being the case, prudent management dictates that a recreational water<br />
quality monitoring program be a high park priority.<br />
Description of Recommended Activity<br />
In FY99, the US Geological Survey and the <strong>National</strong> <strong>Park</strong> <strong>Service</strong> initiated a research study to<br />
better understand fecal-indicator bacteria (fecal coliforms, E. coli, and enterococci) relationships,<br />
and their correlation to weather conditions at sites along the Chattahoochee River and eight<br />
tributaries within the Chattahoochee River NRA. The purpose of this research is to establish the<br />
correlation between indicator-bacteria levels and the waterborne pathogens that pose human<br />
health risk within the <strong>National</strong> Recreation Area (USGS, 1998). A complementary study, begun<br />
in FY00, is using genetic analysis of ribosomal fingerprints (ribotyping) to statistically match E.<br />
coli strains found in the water with E. coli strains originating from fecal samples from humans,<br />
domesticated animals, and wildlife (USGS, 1999). This will provide information pertaining to the<br />
“source” of the contaminants.<br />
Data from these two studies and from earlier Georgia Environmental Protection Division<br />
monitoring programs will be utilized along with information pertaining to water-based<br />
recreational use patterns, to design a seasonal recreational water quality monitoring program.<br />
Monitoring protocols will be designed in consultation with the US Public Health <strong>Service</strong> and US<br />
Geological Survey. In addition, Chattahoochee River NRA will consult with the Georgia<br />
Environmental Protection Division to see if it would be possible to develop a Memorandum of<br />
Understanding for to agree upon program protocols which meet State of Georgia <strong>Water</strong> Quality<br />
Standards and are consistent with Director’s Order 83. This would be beneficial since the State<br />
of Georgia’s <strong>Water</strong> Quality Standards are based upon fecal coliform bacteria levels rather than<br />
the newer E. coli criteria recommended by Director’s Order 83.<br />
163
Techniques and protocols for monitoring recreational water quality are changing rapidly with a<br />
shift away from the older fecal coliform indicator–based program to programs based upon E. coli<br />
and Enterococci indicators. Legislation currently in Congress would require states to adopt the<br />
new standards that conform with the newer US EPA recommended criteria within 3 ½ years of<br />
enactment. While these newer protocols have been adopted by the NPS and a number of states,<br />
they are not yet adopted in the State of Georgia <strong>Water</strong> Quality Standards. Thus, a MOU with the<br />
state, similar to that signed between Glen Canyon NRA and the States of Arizona and Utah could<br />
address monitoring, enforcement and management protocols. For instance, Glen Canyon <strong>National</strong><br />
Recreation Area and the States of Utah and Arizona have recently developed a strategic plan<br />
addressing monitoring and enforcement protocols accepted by both the NPS and the states (Utah<br />
utilizes fecal coliform levels in its state water quality standards while Arizona utilizes E. coli<br />
levels).. The NPS and states have agreed to utilize a simpler, more cost effective E. coli sampling<br />
test (Idexx Laboratories Quanti-tray 2000 test) for the weekly “screening” of swimming areas by<br />
NPS personnel (Budnick et al., 1996). When E. coli levels exceed 126 colonies / 100 ml, sites<br />
are re-sampled (in triplicate) by a state certified laboratory utilizing the more complex fecal<br />
coliform/membrane filtration technique. Should the arithmatic mean of these three samples<br />
exceed 200 colonies/100 ml on two consecutive days, the area will be closed to swimming. Daily<br />
sampling of fecal coliform will continue and a beach will not be re-opened to use until the<br />
geometric mean of the most recent daily, 2-day, 3-day, 4-day, and 5-day samples fall below 200<br />
colonies/100 ml (Andersen, 1999).<br />
Similar cooperation between Chattahoochee River NRA and the Georgia Environmental<br />
Protection Division is encouraged.<br />
Literature Cited<br />
APHA, 1992. Standards methods for the examination of water and wastewater, 18 th edition,<br />
American Public Health Association. Washington, DC.<br />
Anderson, Mark. 1999. Quality assurance project plan and standard operating procedures for<br />
Glen Canyon <strong>National</strong> Recreation Area water quality lab. Resource <strong>Management</strong> and Science<br />
Division, Glen Canyon <strong>National</strong> Recreation Area, Page, AZ.<br />
Budnick, G.E., R. T. Howard, and D.R. Mayo. 1996. Evaluation of Enterolert for Enumeration of<br />
Enterococci in Recreational <strong>Water</strong>s. Applied and Environmental Microbiology 62:10 3881-3884.<br />
Georgia Environmental Protection Division. 1998. 1998 State of Georgia List of Non-attainment<br />
W as required by Section 303(d) of the Federal Clean <strong>Water</strong> Act. Atlanta, GA. 120 pp.<br />
<strong>National</strong> <strong>Park</strong> <strong>Service</strong>. 1999. Reference Manual to Director’s Order 83 - Public Health. <strong>National</strong><br />
<strong>Park</strong> <strong>Service</strong>, Washington, DC. Appendix D (Bathing Beaches).<br />
US Geological Survey, 1998. Microbial Contamination of <strong>Water</strong> <strong>Resources</strong> in the Chattahoochee<br />
River <strong>National</strong> Recreation Area, Georgia. Project Proposal to the FY99 USGS/NPS <strong>Water</strong><br />
Quality Partnership. USGS Georgia District, Atlanta, GA 10 pp. (see also<br />
http://ga.water.usgs.gov/projects/chatm)<br />
US Geological Survey, 1999. Microbial Source Tracking in the Chattahoochee River Utilizing<br />
Ribosomal RNA Typing. Project Proposal to the FY00 USGS/NPS <strong>Water</strong> Quality Partnership.<br />
USGS Georgia District, Atlanta, GA. 10 pp.<br />
164
Budget<br />
The annual cost of this monitoring program would run between $18,000 and $70,000. The basic<br />
“screening” program ... assuming that waters always meet EPA-recommended criteria for E.<br />
col.i… would cost approximately $18,000 per year. A regulatory program, assuming waters<br />
frequently exceeded the screening criteria and were sometimes out of compliance with state water<br />
quality standards could add an additional cost estimated to be up to $52,000 per year.<br />
Screening Program<br />
Idexx Quanti-tray 2000 is a simple and relatively inexpensive quantitative test for E. coli that<br />
would be adopted as the “screening procedure.” Capital equipment costs would not exceed<br />
$2000 and sample costs are approximately $7.00 per sample. Thus, a recreational “screening”<br />
program consisting of 8 sites sampled weekly for 22 weeks from approximately the first of April<br />
through the first of October would incur the following costs:<br />
Seasonal Employee (GS-7 26 weeks ) $ 6,500<br />
(35% of time)<br />
Laboratory Equipment $ 2,000<br />
Expendible Test Supplies ($7/sample) $ 7,000<br />
Training $ 500<br />
Vehicle Costs $ 3,000<br />
Sub- total $18,000<br />
Regulatory Program<br />
Additional costs, assuming that a significant proportion of the sites failed to meet state<br />
recreational water quality standards, at least part of the time, would include additional staff time<br />
(re-sampling and intensified monitoring), use of a state certified lab for fecal coliform/membrane<br />
filtration analysis, data interpretation and regulatory coordination. Approximate cost estimates<br />
(which will vary according to the quality of the water) are:<br />
Seasonal Employee (GS-7 26 weeks) $ 12,000<br />
(additional 65% of time)<br />
State Certified Lab ($25/sample) $ 27,000<br />
Signage/Maintenance $ 3,000<br />
Data Evaluation/Interpretation/Consultation $ 5,000<br />
Regulatory Coordination $ 5,000<br />
Sub-total $52,000<br />
APPROXIMATE TOTAL COSTS:<br />
SCREENING + REGULATORY PROGRAM up to $70,000/yr<br />
______________________________________________________________________________<br />
165
PROJECT STATEMENT NO. 4<br />
Title: Develop a System to Provide Current <strong>Water</strong> Pollution Information to Visitors<br />
Funding Status: Funded: 0 Unfunded: $30K<br />
Problem Statement<br />
This project proposes to develop a system for informing visitors about river water quality and<br />
water pollution in the Chattahoochee River <strong>National</strong> Recreation Area (CRNRA).<br />
<strong>Water</strong> recreation is an important activity in the CRNRA, where thousands of visitors enjoy<br />
rafting, canoeing, swimming, and other water-contact pleasures along the river during a long<br />
summer season. Unfortunately, river water pollution is a serious problem in parts of the river<br />
within the CRNRA. Fecal coliform concentrations frequently are above the standard<br />
recommended for water contact--especially in the down-river portions of the Recreation Area.<br />
The tributaries in the CRNRA are generally even more polluted than the river, and their loads of<br />
pollutants of course add to the river’s contamination. To aggravate the water pollution problem,<br />
sewer pipes sometimes overflow, adding additional slugs of raw sewage to the river.<br />
The CRNRA needs a system to compile and display current reports on the water quality in the<br />
river and also to provide general information on water pollution. Much water quality information<br />
is available from counties, municipalities, private organizations, the State, the USGS, EPA,<br />
universities, and others in the area. The NPS should gather certain water quality and river<br />
information as well. Assistance from a consultant is needed: (i) to determine the best method(s)<br />
to routinely access and quickly display varied pollution information, and (ii) to actually develop<br />
and test the methodology(s) for this display.<br />
Description of the Recommended Project or Activity<br />
The project proposes to develop a method to access and rapidly display recent water quality data<br />
for visitors to the CRNRA. The information could be displayed on a homepage, placed on a<br />
telephone hotline, or in daily printouts (displayed at locations such as visitor centers, raft rental<br />
sites, popular fishing reaches, swimming areas, or boat ramps). Information would include data<br />
on fecal coliforms, water temperature, descriptions of water quality standards, fish consumption<br />
information, announcements of any sewage or chemical spills, discussions of parasites,<br />
descriptions of water pathogens, stories of relevant research taking place on the river, or other<br />
river information. Maps, photographs, and other visual aids should be used extensively.<br />
The web page or other displays can provide flow and other basic river information as well, for<br />
example, rafting conditions, problems of low flows (hence worsening water quality likely), flood<br />
periods, warm waters (identify any problems associated with this), breakdowns of sewer pipes,<br />
treatment plants, or overflows, where raw sewage may be present, spills of chemicals or other<br />
substances. Where some of the information exists (e.g., USGS flows, Riverkeeper information,<br />
etc), the web page could offer hypertext entry into these relevant sites. The site also should<br />
provide for responses where visitors observe special problems.<br />
A consultant would be needed to carry out the project. This person would need: marketing/public<br />
relations knowledge; good computer skills; the ability to develop web pages and (800)<br />
information hotlines; and knowledge about other interactive information sources. The skill of<br />
the consultant to prepare interpretative materials and to inform in a lively, illustrative way would<br />
be prerequisite. Interest in water pollution problems would be valuable. The budget would<br />
166
consistent of 10 weeks of consultant salary ($20,000), supplies ($1,500), local travel, faxes, telephones<br />
($1,000), software and related materials ($4,000), and overhead ($3,500) = $30,000<br />
Budget and FTEs<br />
---------------FUNDED---------------<br />
Source Activity Fund Type Budget ($1K) FTEs<br />
0.1<br />
Total 0.1<br />
Budget and FTEs<br />
---------------UNFUNDED---------------<br />
Source Activity Fund Type Budget ($1K) FTEs<br />
Total 30<br />
_____________________________________________________________________________<br />
PROJECT STATEMENT NO. 5<br />
Title: Recreation Flow Assessment for the Chattahoochee River <strong>National</strong> Recreation<br />
Area<br />
Funding Status: Funded: 0 Unfunded: $45K<br />
Background: This project statement draws heavily on a 1997 “concept proposal” of the same<br />
title from the NPS <strong>Water</strong> <strong>Resources</strong> Division. This project statement also relates to an NPS<br />
project entitled “Recreation Flow Preference Study on the Chattahoochee River," which is an<br />
interview type study being conducted by consultants for the CRNRA.<br />
Problem Statement<br />
The <strong>Water</strong> <strong>Resources</strong> Division, NPS, recommends a comprehensive recreation flow assessment<br />
for the CRNRA by conducting instream flow assessments to evaluate alternative water allocation<br />
strategies. The assessments would determine how alternative allocations relate to water-borne<br />
recreation and evaluate the benefits and impacts of various flow levels. The assessment would<br />
relate directly to the multi-agency, tri-state water allocation work that is discussed in Sections 5.2<br />
(allocation) and 5.4 (recreation) of the <strong>Water</strong> <strong>Resources</strong> <strong>Management</strong> <strong>Plan</strong> for the CRNRA.<br />
Brief Description of the Activity<br />
The following basic actions were recommended by the NPS <strong>Water</strong> <strong>Resources</strong> Division, in its<br />
earlier concept proposal (portions excerpted and paraphrased here):<br />
Year 1:<br />
• Facilitate a meeting of agency representatives to define the recreational aspects to be<br />
evaluated, and to define the study objectives, methods (models, etc), and products.<br />
• Facilitate a meeting of CRNRA staff and recreational stakeholders, to help define specific<br />
flow-dependent attributes associated with the recreation activities to be evaluated by this<br />
study (Note: such a meeting also should draw on any results of the 1999 NPS study on<br />
"Recreation Preferences" described in the abstract below). Refer to the relevant work carried<br />
out earlier at the CRNRA by Nestler et al., 1984 on flow as related to fishing and recreation.<br />
167
• Prepare a report to summarize information from the above meetings and to summarize the<br />
basic CRNRA information on the recreation resource, recreation use, recreation facilities, and<br />
other related information. Describe the flow-dependent attributes of each recreational<br />
activity.<br />
• Develop a scope of work to assess the relationship between river discharge and hydraulic<br />
geometry and to define streamflow-hydraulic geometry relationships for specific recreation<br />
activities along the river. The study would assess the dependency of hydraulic variables such<br />
as depth, top-width, wetted perimeter, and velocity on discharge and would evaluate the flow<br />
preferences for specific recreation opportunities (rafting, canoeing, etc).<br />
• Coordinate with other resource interests (especially fisheries), which also relate to<br />
streamflow-hydraulic geometry and flow.<br />
• Draw on information from the 1999 "Recreation flow preference study" (see abstract in<br />
Appendix A).<br />
Year 2:<br />
In this second year, carry out the river cross-sectional studies scoped out in the meetings and<br />
other activities of the first year, as describe above. Complete the flow-hydraulic geometry study<br />
in the field, to assess the dependency of such hydraulic variables as depth, top-width wetted<br />
perimeter, and velocity on discharge. Relate these physical assessments to surveys of recreation<br />
users’ preferences for flows (from the results of the NPS 1999 study on “recreational<br />
preferences”). Prepare a report to describe minimum and maximum flows needed for different<br />
recreation activities, preferred flows for recreation, and options for optimizing flows for all<br />
recreation interests. The report will provide the information needed to describe the recreation<br />
implications and tradeoffs associated with alternative water allocation strategies.<br />
A final report and recommendations would be prepared and reviewed by the NPS <strong>Water</strong><br />
<strong>Resources</strong> Division and cooperators.<br />
The fieldwork, analyses, and modeling would require the services of a hydrologist or hydraulic<br />
engineer with experience in developing at-station hydraulic-geometry relationships and<br />
interacting with counterparts in other agencies. Such an individual could be secured via a<br />
cooperative agreement, personal services contract, interagency agreement, or drawn from NPS<br />
expertise.<br />
Literature Cited<br />
Nestler, J.M., R.T. Milhous, J. Troxel, and J. Fritschen. 1984. Effects of flow alterations on trout,<br />
angling, and recreation in the Chattahoochee River between Buford Dam and Peachtree<br />
Creek. USAE <strong>Water</strong>ways Experimental Station. Vicksburg, MS. 100.<br />
168
Year 1<br />
Year 2<br />
Budget and FTEs<br />
FUNDED<br />
Activity Fund Type Budget (($1K) FTEs<br />
UNFUNDED<br />
Activity Fund Type Budget ($1K) FTEs<br />
Year 1 Meetings/scoping etc 20<br />
Year 2 Field flow assessments 25<br />
Total 45<br />
PROJECT STATEMENT NO. 6<br />
Title: Define CRNRA’s Role and Function for River <strong>Management</strong> and <strong>Water</strong> Resource<br />
Protection<br />
Funding Status: Funded: 0 Unfunded: $12K<br />
Problem Statement<br />
A exceptionally complex mix of political entities is found along the Chattahoochee River within<br />
the boundaries of the CRNRA and nearby. The large array of counties, municipalities,<br />
organizations, institutes, and other stakeholders exert influence, promote policy, issue permits, or<br />
carry out enforcement within the <strong>National</strong> Recreation Area. As would be expected, an equally<br />
complicated mixture of water resource policies, laws, regulations, authorities, permitting roles,<br />
and enforcement responsibilities has evolved over the decades. These policy and legal factors all<br />
significantly influence the management of the river and its waters within the <strong>National</strong> Recreation<br />
Area.<br />
A clarification and better understanding of the <strong>National</strong> Recreation Area’s legal options and<br />
enforcement roles as regards water resources would be valuable to the park managers.<br />
Brief Description of the Activity<br />
A solid understanding of NPS’s legal options and enforcement roles in water resources would<br />
allow the park to strengthen its support of local actions to protect water resources and riparian<br />
environments. An analysis of the local policies, laws, and authorities in water resources by an<br />
expert consultant would help the Superintendent identify areas where NPS could strengthen its<br />
own role and also identify those areas where NPS could complement enforcement by other<br />
agencies.<br />
“Pre-project” Work: Full development of this Project Statement will require one week of<br />
technical assistance from the NPS’s <strong>Water</strong> <strong>Resources</strong> Division to flesh out the project design.<br />
This WRD assistance would:<br />
• Spell out the focus of the project and its research, including identification of the key<br />
organizations and sources of information which should be tapped; identify areas beyond the<br />
scope of the project (i.e., set sideboards);<br />
169
• In conjunction with park staff, write details of the study plan, to specify the schedule, steps of<br />
the project, and report to be produced;<br />
• Develop a job description for a consultant, describing the experience, skills, and abilities<br />
needed;<br />
• Identify a supportive role for park staff in the project; and<br />
• Specify the details of the budget (mainly cost of the consultant).<br />
The actual project would require a consultant for 6 to 8 weeks, plus costs for library research. By<br />
using a local consultant, other costs beyond salary and library research could be minimized.<br />
Total cost (as of this preliminary stage of the proposal) is estimated at $12,000.<br />
The consultant would provide a final report and make a presentation of the report to the<br />
superintendent and relevant staff. The report would:<br />
• Describe specific parts of laws, policies, and regulations in water resources and<br />
watershed protection which are most relevant to the CRNRA;<br />
• Interpret parts of laws, policies, and regulations which CRNRA can use to<br />
advantage to better manage NPS units and protect the river;<br />
• Identify connections between the park’s own enabling legislation and key State,<br />
County, Municipal, or regional laws, policies, and regulations, clarifying the<br />
boundaries of responsibilities, overlapping of authorities, and complementary<br />
enforcement roles;<br />
• Bring to the superintendent’s attention legal options which would be most valuable<br />
to the CRNRA in protecting water resources from pollution and other impacts;<br />
• List specific examples and precedents where other parks in the <strong>National</strong> <strong>Park</strong><br />
<strong>Service</strong> have taken advantage of legal options to reduce pollution or other impacts,<br />
and describe how such approaches could be useful for the CRNRA (examples from<br />
the U.S. in general, especially in urban areas).<br />
Budget and FTEs<br />
FUNDED<br />
Activity Fund Type Budget (($1K) FTEs<br />
Year 1 0 0.1<br />
UNFUNDED<br />
Activity Fund Type Budget ($1K) FTEs<br />
Year 1 Meetings/scoping etc 12<br />
Grand Total 12 0.1<br />
______________________________________________________________________________<br />
PROJECT STATEMENT NO. 7<br />
Title: Assessment of Biological Integrity of Tributary Streams of the Chattahoochee River<br />
<strong>National</strong> Recreation Area<br />
Funding status: Funded: 0.0 Unfunded: 42.0<br />
The <strong>Park</strong> and Surrounding Land Use<br />
Background<br />
170
The Chattahoochee River <strong>National</strong> Recreation Area (CRNRA) occupies a 48-mile corridor of the<br />
Chattahoochee River in the Atlanta metropolitan area. Sixteen tributaries with basins greater than 3<br />
mi 2 enter into the Chattahoochee River within the CRNRA. Big Creek is the largest at 103 mi 2 ,<br />
followed by Suwanee (51.3 mi 2 ) and Sope (35.4 mi 2 ) creeks. The remaining 13 tributaries are less<br />
than 20 mi 2 in size.<br />
The Atlanta metropolitan area is one of the most rapidly growing urban areas in the U.S., ranking<br />
12 th in population. Urbanization has converted about half of the land in the CRNRA vicinity from<br />
agricultural or forested land uses into residential, commercial, industrial or other more intensive<br />
uses. The southern end of the CRNRA, nearest to downtown Atlanta, is the most developed. The<br />
northern end still contains some open fields and forests, but is changing rapidly. Urbanization is<br />
sprawling northward of Atlanta as commuters seek inexpensive housing. Single family housing<br />
comprises the bulk of the development in the northern end.<br />
The park’s enabling legislation was amended in 1984 to recognize a 2000-foot protective buffer<br />
along both sides of the Chattahoochee. Protection of the tributary watersheds is a special problem<br />
for the CRNRA since the park’s tributary watersheds extend far beyond the 2000-foot protective<br />
buffer. For example, the most recent State of Georgia 305(b) report on water quality lists 13 of the<br />
tributaries in the CRNRA as non-supporting of their designated uses. Urban runoff (including, e.g.,<br />
sedimentation, toxic contaminants, pesticides/herbicides) is the dominant factor cited for this nonsupport.<br />
In particular, Rottenwood Creek has been referred to as one of the most threatened streams<br />
in Cobb County because of siltation and contaminants.<br />
The Concept of Biological Integrity and its Assessment<br />
The phrase biological integrity was first used in 1972 to establish the goal of the Clean <strong>Water</strong> Act:<br />
"to restore the chemical, physical, and biological integrity of the Nation's waters." This mandate<br />
clearly established a legal foundation for protecting aquatic biota. Unfortunately, the vision of<br />
biological integrity was not reflected in the act's implementing regulations. Those regulations were<br />
aimed at controlling or reducing release of chemical contaminants and thereby protecting human<br />
health; the integrity of biological communities was largely ignored (Karr, 1991).<br />
Biological integrity refers to the capacity to support and maintain a balanced, integrated, and<br />
adaptive biological system having the full range of elements (e.g., populations, species,<br />
assemblages) and processes (e.g. biotic interactions, energy dynamics, biogeochemical cycles)<br />
expected in a region’s natural habitat (Karr et al., 1986). The biological integrity of water resources<br />
is jeopardized by altering one or more of five classes of environmental factors: alteration of physical<br />
habitat, modifications of seasonal flow of water, changes in the food base of the system, changes in<br />
interactions within the stream biota, and chemical contamination (Karr, 1990). Urbanization, for<br />
example, compromises the biological integrity of streams by severing the connections among<br />
segments of a watershed and by altering hydrology, water quality, energy sources, habitat structure,<br />
and biotic interactions.<br />
<strong>Water</strong> managers are increasingly being called upon to evaluate the biological effects of their<br />
management decisions, for no other aspect of a river gives a more integrated perspective about the<br />
condition of a river and its biota. Widespread recognition of this and the continued degradation of<br />
our water resources have stimulated numerous efforts to improve our ability to track aquatic<br />
biological integrity (Davis and Simon, 1995). Comprehensive, multimetric indexes (Barbour et al.,<br />
1995) were first developed in the Midwest for use with fishes (Karr, 1981; Fausch et al., 1984; Karr<br />
et al., 1986), and modified for use in other regions of the U. S. (Miller et al., 1988) and with<br />
invertebrates (Ohio EPA, 1988; Plafkin et al., 1989; Kerans and Karr, 1994; Deshon, 1995; Fore et<br />
171
al., 1996). The conceptual basis of the multimetric approach has now been applied to a variety of<br />
aquatic environments (Davis and Simon, 1995), including large rivers, lakes, estuaries, wetlands,<br />
riparian corridors, and reservoirs, and in a variety of geographic locations (Lyons et al., 1995).<br />
These indices incorporate many attributes of aquatic communities that cover the range of ecological<br />
levels from the individual through population, community and ecosystem. Biological community<br />
measures offer the advantage that they respond to a variety of stressors, they integrate impacts<br />
over time (thereby reducing the amount of sampling), and they directly assess the achievement of<br />
a primary objective of the Clean <strong>Water</strong> (Barbour et al., 1995). The original multimetric index, the<br />
Index of Biotic Integrity (Karr et al., 1986), summarized stream fish collection data into 12<br />
ecological characters from three categories: species richness and composition, trophic composition,<br />
and fish abundance and condition. Each metric is scored as poor, good, or excellent relative to an<br />
'expected community' from a natural undisturbed ecosystem of similar size and characteristics from<br />
the same ecoregion. The strength of these multimetric indices is that many factors that affect biotic<br />
integrity can be seen or measured. The goal is to understand and isolate, through sampling design<br />
and analytical procedures, patterns that derive from natural variation in environments.<br />
Status of Tributary Aquatic Biology and Local Attempts at Biological Assessment<br />
Couch et al. (1995), using museum records of historic surveys, identified a total of 50 species of fish<br />
known to inhabit the tributaries of metropolitan Atlanta. The majority of these surveys were<br />
conducted before urbanization.<br />
Three studies in the last 20 years (Hess et al., 1981; Couch et al., 1995; DeVivo, 1996) have defined<br />
the baseline condition for tributaries of the CRNRA. These studies found a total of 35 fish species<br />
for 69 percent of the tributaries in the CRNRA. That this number is less than the ‘potential’ 50<br />
species listed by Couch et al. is not surprising when one considers the amount of urbanization that<br />
these tributary watersheds have undergone. The apparent ‘loss’ of 15 species is a crude measure of<br />
the loss of biological integrity from these tributary systems.<br />
Information on aquatic invertebrates in tributaries of the CRNRA is limited primarily to a few,<br />
dated studies (Environmental Protection Division, 1966, 1973; Hess et al., 1981).<br />
Within the Piedmont of the Southeast little has been published on the use of multimetric indices of<br />
biological integrity. DeVivo et al. (1997) presented a preliminary (because of small sample size and<br />
need for verification) IBI for fish communities of urban streams of metropolitan Atlanta. Of the 21<br />
tributary sites sampled, five were on creeks within the CRNRA. None of these streams scored<br />
higher than fair. In general, the IBI scores from these urban streams were inversely related to<br />
watershed population density.<br />
The Georgia Environmental Protection Division (EPD) uses biological monitoring and assessments<br />
as surface water monitoring tools to manage and regulate Georgia water resources (Davis et al.,<br />
1996). The EPD has recently prepared a (draft) standard operating procedures manual for<br />
macroinvertebrate assessments (Georgia Environmental Protection Division, 1997). These<br />
procedures represent an intensive, multi-habitat, multimetric approach to assessing<br />
macroinvertebrate communities. In addition, fish survey information from the Wildlife <strong>Resources</strong><br />
Division has been evaluated using Karr’s (1981) Index of Biotic Integrity (e.g., Mauldin and<br />
McCollum, 1992). Biological assessment information is used by the State in the designated use<br />
support characterization process – stream segments rated as poor or very poor are considered as not<br />
meeting the “fishing” water use classification and are included in the partially supporting list (Davis<br />
et al., 1996).<br />
172
As part of a study for the urban watersheds initiative for metropolitan Atlanta, CH2MHill (1998)<br />
sampled aquatic macroinvertebrates and fish using bioassessment protocols developed by the<br />
Georgia Environmental Protection Division (1997) and the U.S. Environmental Protection Agency<br />
(Pflakin et al., 1989). They compared the scores from the fish-based index with the benthic<br />
macroinvertebrate-based index. The scores from these indexes were highly correlated supporting<br />
the reliability of monitoring biological assemblages in predicting biotic integrity.<br />
Regardless of whether fish, invertebrates, or other taxa are used, the search for a small set of metrics<br />
that reliably signals resource condition along gradients of human influence yields the same basic list<br />
of metrics (Miller et al., 1988; Karr, 1991; Davis and Simon, 1995). With usually only minor<br />
modification, the list can be adapted to specific regions (Miller et al., 1988), such as Piedmont<br />
region of the Chattahoochee River basin.<br />
Problem Statement<br />
Because of the: (1) lack of knowledge of tributary aquatic biology; (2) rapid urbanization of<br />
tributary watersheds and the need to assess ongoing and future mitigation of impacts from<br />
urbanization; and (3) need to establish a long-term, cost-effective assessment program for tributary<br />
watersheds where none exists, the CRNRA will explore further the development of multimetric<br />
indices (or rapid bioassessment protocols) for use in its tributary systems. The systematic,<br />
biological assessment of species assemblages using multimetric indexes is presently the only<br />
practical and cost-effective approach to determine if human actions are degrading biological<br />
integrity (Davis and Simon, 1995). Such monitoring provides both numeric and narrative<br />
descriptions of resource condition, which can be compared among watersheds, across a single<br />
watershed, and over time (Karr, 1991), and it does so at costs which are often less than the cost of<br />
complex chemical monitoring. Costs per evaluation are low for ambient biological monitoring<br />
(based on a decade of sampling and including equipment; supplies; and logistical, administrative,<br />
and data analysis and interpretation activities: benthic invertebrates, $824; fish, $740; Yoder and<br />
Rankin, 1995) in comparison with chemical and physical water quality ($1,653) and bioassays<br />
($3,573 to $18,318).<br />
Monitoring the effectiveness of sediment control measures in urban areas via an assessment of the<br />
amount of sediment entering the stream from storm runoff will show reductions in sediment<br />
loading. This type of sediment monitoring is the subject of another CRNRA project. However,<br />
whether this reduction translates into an improvement in biological integrity remains to be seen.<br />
An additional way to assess the effectiveness of sediment control measures is to assess biological<br />
integrity through the use of multimetric indexes. Simply stated, if sediment control measures are<br />
being effective then one should see some improvements in biotic integrity.<br />
By conducting bioassessments and monitoring sediment accumulation on a regular basis in<br />
tributary waters of CRNRA, one can attempt to remedy two additional problems: 1) there is a<br />
general lack of sediment sites on small tributaries in Georgia – in the Chattahoochee River basin<br />
there are only 10 sites on small tributaries versus 31 sites on main stem rivers and large tributaries<br />
(Barnes et al., 1996); and 2) Barnes et al. determined that there was an absence of<br />
contemporaneous fish and sediment data at the same sites. Because of insufficient long-term<br />
comparative data, temporal trends in biological integrity cannot be related to long-term trends in<br />
sediment regimes. Fieldwork is needed to establish a relationship between biological integrity and<br />
increasing sedimentation of CRNRA’s tributaries.<br />
173
Description of Recommended Project<br />
Biological monitoring of CRNRA tributary streams will be based on the premise that biological<br />
integrity can be measured in terms of the composition, structure, and function of resident biotic<br />
communities. Because fish and benthic macroinvertebrate communities are sensitive to and<br />
integrate diverse aspects of their environments, including human-induced alterations, they serve as<br />
continual monitors of biotic integrity.<br />
In an effort to foster partnering and to reduce any duplicative efforts, CRNRA will contact the<br />
Georgia Environmental Protection Division about the possibilities of a pilot study that would (1)<br />
sample the habitat and fish and benthic macroinvertebrate communities of the tributaries; (2) use or<br />
refine multimetric indexes of past local studies to the fish and benthic macroinvertebrate data; and,<br />
(3) remedy the absence of contemporaneous fish/macroinvertebrate and sediment data for these<br />
streams. Depending upon the level of State involvement, the CRNRA could conduct its own<br />
biological assessment program (with appropriate training), conduct the sampling and contract to the<br />
state the identification and analysis phases, or just contract to the state all phases (sampling,<br />
identification, and analysis). The ultimate goal would be to establish several permanent, CRNRAbased<br />
tributary sampling stations as part of Georgia’s monitoring and assessment program. To this<br />
end, the CRNRA would be able to assess tributary biological integrity on a regular basis with<br />
minimal personnel and monetary investments.<br />
A biological monitoring plan would be developed that provides detailed technical guidance for<br />
completing the field studies, including the following information:<br />
♦ Final study station locations;<br />
♦ Reference station locations;<br />
♦ Field protocols and sampling gear requirements for assessing habitat conditions and sampling<br />
benthic macroinvertebrate and fish communities;<br />
♦ QA/QC protocols for sample handling, record keeping, and chain of custody;<br />
♦ Field safety instructions; and,<br />
♦ Schedule.<br />
The monitoring plan would be peer-reviewed by personnel from the <strong>Water</strong> <strong>Resources</strong> Division of<br />
the <strong>National</strong> <strong>Park</strong> <strong>Service</strong> and the Environmental Protection and Wildlife <strong>Resources</strong> divisions of the<br />
State of Georgia prior to implementation of the field studies.<br />
Habitat assessments will be conducted at all monitoring stations following the Georgia Draft<br />
Standard Operating Procedures-Freshwater Macroinvertebrate Biological (1997). These<br />
procedures include an evaluation of the immediate watershed, substrates, stream width, and general<br />
water quality conditions.<br />
Benthic macroinvertebrates will be sampled at each monitoring station following qualitative<br />
techniques described in the Georgia standard operating procedures (Georgia Department of Natural<br />
<strong>Resources</strong>, 1997). This multi-habitat method could be modified, consistent with the U.S.<br />
Environmental Protection Agency’s Rapid Bioassessment Protocols (Pflakin et al., 1989) to<br />
maximize efficiency of fieldwork and analysis. This could involve compositing samples from the<br />
various habitats for analysis and data evaluation.<br />
Once a multimetric approach for benthic macroinvertebrate data is determined [e.g. RBP III<br />
(Pflakin et al. 1989], a numerical value will be calculated for each metric. Values will then be<br />
174
compared to values derived for the same metrics at corresponding reference stations. Each metric<br />
will be scored according to its percent comparability to the reference value. Scores for the<br />
individual metrics will then be totaled and compared to the total metric score for reference stations.<br />
The percent similarity between the total scores will correspond with one of four qualitative integrity<br />
ratings ranging from severely impaired to non-impaired.<br />
Fish sampling will be conducted in accordance with the standards set by Pflakin et al. (1989).<br />
Representative habitats, including riffles, runs, and pools will be sampled in study reaches varying<br />
in length from 100- 150 m, or longer, depending on stream size and the distribution of habitats. The<br />
principal sampling method will be electroshocking supplemented by seining. Seining is particularly<br />
effective in collecting darters, minnows, and other smaller fish generally not as vulnerable to<br />
backpack electrofishing. Unit sampling effort will be compared among stations.<br />
Stream biotic integrity will be evaluated for each study station using the index of biotic integrity as<br />
developed by Karr et al. (1986) and adapted for use by RBP V (Pflakin et al., 1989) or some<br />
modification of this index (e.g. DeVivo et al., 1997). The IBI rates 12 metrics of fish community<br />
structure and assumes that each metric correlates either positively or negatively with increase<br />
stream degradation. Because the number of fish species tends to increase with stream size, fish<br />
sampling data from the various reference stations of differing watershed size will be used to develop<br />
expectation criteria for the species richness metrics and other selected metrics (Plafkin et al., 1989).<br />
Literature Cited<br />
Barbour, M. J. Stribling, and J. Karr. 1995. Multimetric approach for establishing biocriteria and<br />
measuring biological condition. Pages 63-77 in W. Davis and T. Simon, editors.<br />
Biological assessment and criteria: tools for water resource planning and decision making.<br />
Lewis Publishers, Boca Raton, FL.<br />
Barnes, K., J. Meyer, and B. Freeman. 1996. Suspended sediments and Georgia’s fishes: an<br />
analysis of existing information. Tech. Completion Report 14-08-0001-G2013 (04), U.S.<br />
Geological Survey, <strong>Water</strong> <strong>Resources</strong> Program, Atlanta, GA.<br />
CH2MHill. 1998. Draft watershed characteristics task plan. A work plan, for review, with steps<br />
for the project (spring 1998). Atlanta. 25pp.<br />
Couch, C., J. DeVivo, and B. Freeman. 1995. What fish live in the streams of metropolitan<br />
Atlanta? U. S. Geological Survey Fact Sheet FS-091-95, Feb. 1995. Atlanta. 4pp.<br />
Davis, W., and T. Simon. 1995. Biological assessment and criteria: tools for water resource<br />
planning and decision making. Lewis Publishers, Boca Raton, FL.<br />
Deshon, J. 1995. Development and application of the invertebrate community index (ICI). Pages<br />
217-243 in W. Davis and T. Simon. Biological assessment and criteria: tools for water<br />
resource planning and decision making. Lewis Publishers, Boca Raton, FL.<br />
DeVivo, J. 1996. Fish assemblages as indicators of water quality within the Appalachicola-<br />
Chattahoochee-Flint (ACF) River basin. M.S. thesis. U. of Georgia, Athens.<br />
DeVivo, J., C. Couch, and B. Freeman. 1997. Use of a preliminary index of biotic integrity in urban<br />
streams around Atlanta, Georgia. Pages 40-43 In Hatcher, K. (ed.). 1997. <strong>National</strong> <strong>Water</strong>-<br />
Quality Assessment (NAWQA) Program, Appalachicola-Chattahoochee-Flint River basin,<br />
175
Georgia, Florida, and Alabama. Proceedings, 1997 Georgia <strong>Water</strong> <strong>Resources</strong> Conference. U.S.<br />
Geological Survey. Atlanta. 55pp.<br />
Environmental Protection Division. 1966. A biological study of Sope Creek, Cobb County,<br />
Georgia. Copy in files of Georgia EPD, GA Dept. Nat. Res., Atlanta.<br />
Environmental Protection Division. 1973. Sope Creek water quality investigation. Copy in files of<br />
Georgia EPD, GA Dept. Nat. Res. Atlanta.<br />
Fausch, K, J. Karr, and P. Yant. 1984. Regional application of an index of biotic integrity based on<br />
stream fish communities. Trans. Am. Fish. Soc. 113:39-55.<br />
Fore, L., J. Karr, and R. Wisseman. 1996. Assessing invertebrate responses to human activities:<br />
evaluating alternative approaches. J. North Am. Benthological Soc. 15:212-231.<br />
Hess, T., A. Mauldin, and G. Walker. 1981. Evaluation of some important river systems within the<br />
Walton District of the East Central Region – Middle Chattahoochee River tributaries.<br />
Georgia Dept. of Nat. Res., Game and Fish Div., Atlanta, GA. Report is from a series of<br />
reports from Project EC-3.<br />
Karr, J. 1981. Assessment of biotic integrity using fish communities. Fisheries 6:21-27. Karr, J.<br />
1991. Biological integrity: a long-neglected aspect of water resource management. Ecol.<br />
App. 1:66-84.<br />
Karr, J., K. Fausch, P. Angermeier, P. Yant, and I. Schlosser. 1986. Assessment of biological<br />
integrity in running water: a method and its rationale. Special Publication No. 5, Illinois<br />
Natural History Survey, Champaign, IL.<br />
Kerans, B., and J. Karr. 1994. A benthic index of biotic integrity (B-IBI) for rivers of the<br />
Tennessee Valley. Ecol. App. 4:768-785.<br />
Lyons, J., and S. Navaho-Perez, P. Cochran, E. Santen-C., and M. Gunman-Arroyo. 1995. Index<br />
of biotic integrity based on fish assemblages for the conservation of streams and rivers in<br />
west central Mexico. Conserve. Biol. 9:569-594.<br />
Mauldin, A. and J. McCollum. 1992. Status of the Chattahoochee River fish population<br />
downstream of Atlanta, Georgia. Project No. F-26. Georgia Dept. of Nat. Res., Game and<br />
Fish Div., Atlanta.<br />
Miller, D., and seventeen others. 1998. Regional applications of an index of biotic integrity for use<br />
in water resource management. Fisheries 13:12-20.<br />
Ohio Environmental Protection Division. 1988. Biological criteria for the protection of aquatic<br />
life, volumes 1-3. Ecological Assessment Section, Division of <strong>Water</strong> Quality Monitoring<br />
and Assessment, Ohio EPA, Columbus, OH.<br />
Plafkin, J., Barbour, K. Porter, S. Gross, and R. Hughes. 1989. Rapid bioassessment protocols for<br />
use in streams and rivers: benthic macroinvertebrates and fish. EPA/440/4-89-001. U.S.<br />
Environmental Protection Agency, Washington, DC.<br />
176
Yoder, C. and E. Rankin. 1995. Biological response signatures and the area of degradation value:<br />
new tools for interpreting multimetric data. Pages 263-286 In W. Davis and T. Simon, eds.,<br />
Biological assessment and criteria: tools for water resource planning and decision making.<br />
Lewis Publishers, Boca Raton, FL<br />
BUDGET AND FTEs:<br />
FUNDED<br />
Source Act Type Budget FTEs<br />
Year 1 0.4<br />
Year 2 0.2<br />
Year 3 0.2<br />
UNFUNDED<br />
Source Act Type Budget FTEs<br />
Year 1 18,000<br />
Year 2 12,000<br />
Year 3 12,000<br />
Total 42,000 0.8<br />
177
12.0 LITERATURE CITED<br />
Atlanta Regional Commission. 1987. Metropolitan River Protection Act review: Administrative<br />
manual. ARC Bulletin, January, 1987. 65 pp.<br />
Atlanta Regional Commission. 1992a. Chattahoochee River corridor map. ARC. Atlanta. Map<br />
and 4 pp text. Atlanta, January, 1992.<br />
Atlanta Regional Commission. 1992b. Chattahoochee watershed protection study: Buford Creek<br />
to Peachtree Creek. Prepared for Georgia Environmental Protection Division by ARC,<br />
partially funded by the U.S. Environmental Protection Agency. Atlanta. 72 pp +<br />
appendices.<br />
Atlanta Regional Commission. 1992c. <strong>Water</strong> resources of the Atlanta Region. Annotated map of<br />
24 x 27 inches, with writeup and data on water resources and pollution for the area.<br />
Atlanta.<br />
Atlanta Regional Commission. 1996. Vision 2020 collaborative reports: Environment--<br />
September, 1994 to May, 1995. Atlanta. 240 pp.<br />
Atlanta Regional Commission. 1997a. (Draft) Strategy 98, Atlanta Regional Commission: 1998<br />
Work Program and Budget, October 22, 1997. Atlanta. 100 pp.<br />
Atlanta Regional Commission. 1997b. Urban streams assessment and evaluation guidelines.<br />
ARC technical report in cooperation with the U.S. Geological Survey. September, 1997.<br />
Atlanta. 44 pp.<br />
Atlanta Regional Commission. 1997c. Urban streams assessment and evaluation guidelines-technical<br />
report. ARC technical report in cooperation with the U.S. Geological Survey.<br />
September, 1997. Atlanta. 85 pp.<br />
Atlanta Regional Commission. 1998a. Atlanta regional water supply plan update (includes<br />
Atlanta region water supply map of January, 1998). Atlanta. 50 pp.<br />
Atlanta Regional Commission. 1998b. <strong>Water</strong> resources of the Atlanta Region. Annotated map<br />
of 24 x 27 inches, with writeup and data on water resources and pollution for the area.<br />
Atlanta.<br />
Atlanta Regional Commission. 1998c. Big Creek watershed study: Scope of services. Atlanta.<br />
11 pp.<br />
Atlanta Regional Commission. 1998d. Regional water and sewage study commission meeting<br />
materials (text, maps, charts, lists, and other handout materials). Atlanta. 75 pp.<br />
Baer, K.E., and M.J. Paul. 1995. Suburban stormwater runoff: the Sope Creek case study. pp<br />
269-273 In K. Hatcher (ed.). 1995. Georgia <strong>Water</strong> <strong>Resources</strong> Conference. University of<br />
Georgia. Athens. 412 pp.<br />
178
Bain, M. and J. Boltz. 1989. Regulated streamflow and warmwater stream fish: a general<br />
hypothesis and research agenda. U.S. Fish and Wildlife <strong>Service</strong> Biological Report<br />
89(18).<br />
Bain, M., J. Finn, and H. Brooke. 1988. Streamflow regulation and fish community structure.<br />
Ecology 69:382-392.<br />
Bain, M. and V. Travnichek. 1996. Assessing impacts and predicting restoration benefits of flow<br />
alterations in rivers developed for hydroelectric power production. Pages B543-B552 in<br />
M. Leclerc, H. Capra, S. Valentin, A. Boudreault, and Y. Co te, editors. Proceedings of<br />
the Second IAHR Symposium on Habitat Hydraulics, Ecohydraulics 200. Institute<br />
<strong>National</strong> de la Recherche Scientifique-Eau, Ste-Foy, Quebec, Canada.<br />
Barbour, M., J. Stribling, and J. Karr. 1995. Multimetric approach for establishing biocriteria<br />
and measuring biological condition. Pages 63-77 in W. Davis and T. Simon, eds.,<br />
Biological Assessment and Criteria: Tools for <strong>Water</strong> Resource <strong>Plan</strong>ning and Decision<br />
Making. Lewis Publishers, Boca Raton, FL.<br />
Barkuloo, J., L., P.L. Stith, and W. Troxel. 1987. Natural resource inventory Apalachicola-<br />
Chattahoochee-Flint River Basin. U.S. Fish and Wildlife <strong>Service</strong>, Panama City, FL.<br />
Barnes, K., J. Meyer, and B. Freeman. 1996. Suspended sediments and Georgia’s fishes: an<br />
analysis of existing information. Tech. Completion Report 14-08-0001-G2013 (04), U.S.<br />
Geological Survey, <strong>Water</strong> <strong>Resources</strong> Program, Atlanta, Georgia.<br />
Biagi J., and R. Brown. 1997. Upper temperature tolerance of juvenile and adult brown and<br />
rainbow trout tested under flowing conditions (Project No. F-26). Georgia Dept. of Nat.<br />
Res., Wildlife Res. Div., Atlanta.<br />
Biagi, J. and C. Martin. 1992. The effect of three stocking rates on growth, survival, and angler<br />
success and harvest of brown trout on a 27-km section of the Chattahoochee River<br />
(Project No. F-26-19). Georgia Dept. Nat. Res., Game and Fish Div., Atlanta.<br />
Bourne, R., and R. Bennett. 1997. Stream quality assessments in the developing community. pp<br />
99-102 In K. Hatcher (ed). Proceedings of the 1997 Georgia <strong>Water</strong> <strong>Resources</strong><br />
Conference. Athens. 550 pp.<br />
Brouckaert, B., A. Amirtharajah, G. Zhu, and M. Timmerly York. 1997. Heavy metal loading to<br />
Lake Lanier from point sources of pollution and urban runoff. pp 474-477 In K. Hatcher<br />
(ed). Proceedings of the 1997 Georgia <strong>Water</strong> <strong>Resources</strong> Conference. Athens. 550 pp.<br />
Buell, G. and C. Couch. 1995. Environmental distribution of organochlorine compounds in the<br />
Apalachicola-Chattahoochee-Flint River Basin. In Hatcher, Kathryn J. (ed). 1995.<br />
<strong>National</strong> <strong>Water</strong>-Quality Assessment (NAWQA) Program: Apalachicola-Chattahoochee-<br />
Flint River Basin, Georgia, Florida, and Alabama. Reprints from proceedings of the<br />
1995 Georgia <strong>Water</strong> <strong>Resources</strong> Conference. U.S. Geological Survey. Atlanta. 37 pp.<br />
Burch, J. 1973. Freshwater Unionacean clams of North American. Biota of Freshwater<br />
Ecosystems. U.S. Environmental Protection Agency, Identification Manual No. 11.<br />
179
Burke, R., III. 1994. Field study plan, Part I: Purposes and guiding principles. Chattahoochee<br />
River Modeling Project. Environmental Protection Division. Georgia Department of<br />
Natural <strong>Resources</strong>. Atlanta. 55 pp.<br />
Burke, R. III, P. Lamarre, C. Hesterlee, and R. Olson. 1997. Preliminary partition: Forsyth<br />
County wastewater discharge. Chattahoochee River Modeling Project. Environmental<br />
Protection Division. Georgia Department of Natural <strong>Resources</strong>. Atlanta. 100 pp.<br />
Calow, P. and Petts, G., eds. 1992. The Rivers Handbook, Vol. 1: Hydrological and Ecological<br />
Principles. Blackwell Scientific, Oxford, UK.<br />
Carter, R.W. and S.M. Herrick. 1951. <strong>Water</strong> resources of the Atlanta metropolitan area.<br />
Geological Survey Circular 148. U.S. Geological Survey. Atlanta. 19 pp.<br />
Cederstrom, D.J., E.H. Boswell, and G.R. Tarver. 1979. Summary appraisals of the nation's<br />
ground-water resources--South Atlantic-Gulf Region. Geological Survey Professional<br />
Paper 813-0. Washington, D.C. 35 pp.<br />
Chapman, M.J., and M. Peck. 1997. Ground-water resources of the Upper Chattahoochee River<br />
Basin in Georgia–Subarea 1 of the Apalachicola-Chattahoochee-Flint and Alabama-<br />
Coosa-Tallapoosa River Basins. U.S. Geological Survey Open-File Report 96-363.<br />
Atlanta. 43 pp.<br />
Chattahoochee River <strong>National</strong> Recreation Area. 1982. Resource protection technique study.<br />
Chattahoochee River NRA, Atlanta. 132 pp.<br />
Chattahoochee River <strong>National</strong> Recreation Area. 1989. General management plan, development<br />
concept plan, environmental assessment. Chattahoochee NRA, Atlanta. 49 pp.<br />
Chattahoochee River <strong>National</strong> Recreation Area. 1995. Statement for management: basic<br />
operations statement. Chattahoochee River NRA, Atlanta. 19 pp.<br />
Cherry, R.N., R.E. Faye, J.K. Stamer, and R.L. Kleckner. 1980. Summary of the river-quality<br />
assessment of the Upper Chattahoochee River Basin, Georgia. U.S. Geological Survey<br />
Circular 811. Atlanta. 47 pp.<br />
CH2MHill. 1998a. Draft watershed characteristics task plan. A work plan, for review, with<br />
steps for the project (spring 1998). Atlanta. 25 pp.<br />
CH2MHill. 1998b. <strong>Water</strong>shed characterization task plan – Gwinnett County watershed<br />
assessment and modeling. Draft Report. Atlanta, GA.<br />
Cobb County Soil and <strong>Water</strong> Conservation District. 1997. How to protect natural resources on<br />
conservation sites: the builder's guide. Joint publication of the Cobb County Soil and<br />
<strong>Water</strong> Conservation District, the USDA Natural <strong>Resources</strong> Conservation <strong>Service</strong>, and the<br />
Georgia Forestry Commission. Atlanta, GA. 22 pp.<br />
Collier, Michael, R.H. Webb, and J.C. Schmidt. 1996. Dams and rivers: A primer on the<br />
downstream effects of dams. U.S. Geological Survey Circular 1126. Tucson. 94 pp.<br />
180
Couch, C.A. 1993. Environmental setting of the Apalachicola-Chattahoochee-Flint River Basin.<br />
In Hatcher, K.J. (ed). 1993. <strong>National</strong> <strong>Water</strong>-Quality Assessment (NAWQA) Program,<br />
Apalachicola-Chattahoochee-Flint River Basin. Proceedings of the 1993 Georgia <strong>Water</strong><br />
<strong>Resources</strong> Conference, Athens, Georgia. 40 pp.<br />
Couch, C.A. 1997. Environmental distribution of mercury related to land use and<br />
physicochemical setting in watersheds of the Apalachicola-Chattahoochee-Flint River<br />
Basin. pp 33-39 In Hatcher, Kathryn J.(ed). 1997. Proceedings of the 1997 Georgia<br />
<strong>Water</strong> <strong>Resources</strong> Conference. Athens. 55 pp.<br />
Couch, C.A. 1997. Fish dynamics in urban streams from Atlanta, Georgia (Technical Note 94).<br />
<strong>Water</strong>shed Protection Techniques 2(4):511-514.<br />
Couch C.A., J.C. DeVivo and B.J. Freeman. 1995. What fish live in the streams of metropolitan<br />
Atlanta? U.S. Geological Survey Fact Sheet FS-091-95, Feb. 1995. Atlanta. 4 pp.<br />
Couch, C.A, E.H. Hopkins, and P.S. Hardy. 1996. Influences of environmental settings on<br />
aquatic ecosystems in the Apalachicola-Chattahoochee-Flint River Basin. U.S.<br />
Geological Survey. <strong>Water</strong>-<strong>Resources</strong> Investigations Report 95-4278. Atlanta. 58 pp.<br />
Cowie, G., and P. Hardy. 1997. Environmental management requirements for stream and river<br />
corridors in Georgia. Booklet prepared for Georgia Environmental Protection Division<br />
by Institute of Community and Area Development, University of Georgia, with support<br />
of U.S. Environmental Protection Agency. Athens, GA. 73 pp.<br />
Cressler, C.W., C.J. Thurmond, and W.G. Hester. 1983. Ground water in the greater Atlanta<br />
region, Georgia. Information Circular 63. Georgia Environmental Protection Division.<br />
Atlanta. 144 pp.<br />
Cushman, R. 1985. Review of ecological effects of rapidly varying flows downstream of<br />
hydroelectric facilities. North American J. of Fish. Mgmt. 5:330-339.<br />
Dahlbery, M. and D. Scott. 1971. The freshwater fishes of Georgia. Bulletin of the Georgia<br />
Academy of Science 29:1-64.<br />
Davis, W. and T. Simon. 1995. Biological assessment and criteria: tools for water resource<br />
planning and decision making. Lewis, Boca Raton, FL.<br />
Decaire, C. 1997. Regulating instream flow levels to benefit and preserve aquatic ecology:<br />
Potential legal authority for instituting variable flow regimes. pp 332-336 In K. Hatcher<br />
(ed). Proceedings of the 1997 Georgia <strong>Water</strong> <strong>Resources</strong> Conference. Athens. 550 pp.<br />
Decker, C.J. 1989. Cobb County’s stream assessment program. pp 140-143 In K. Hatcher (ed).<br />
1989. Proceedings of the 1989 Georgia <strong>Water</strong> <strong>Resources</strong> Conference. Athens. 245 pp.<br />
Deshon, J. 1995. Development and application of the invertebrate community index (ICI).<br />
Pages 217-243 In W. Davis and T. Simon, eds., Biological assessment and criteria: tools<br />
for water resource planning and decision making. Lewis Publishers, Boca Raton, FL.<br />
181
Devivo, J.C. 1995. Impact of introduced red shiners, Cyprinella lutrensis, on stream fishes near<br />
Atlanta, Georgia. pp 95-98 In K. Hatcher (ed.). 1995. Georgia <strong>Water</strong> <strong>Resources</strong><br />
Conference. University of Georgia. Athens. 412 pp.<br />
DeVivo, Joseph. 1996. Fish assemblages as indicators of water quality within the<br />
Appalachicola-Chattahoochee-Flint (ACF) River basin. M.S. thesis. U. of Georgia,<br />
Athens.<br />
Devivo, J.C., C.A. Couch, and B.J. Freeman. 1997. Use of a preliminary index of biotic integrity<br />
in urban streams around Atlanta, Georgia. Pages 40-43 In Hatcher, Kathryn J. (ed). 1997.<br />
<strong>National</strong> <strong>Water</strong>-Quality Assessment (NAWQA) Program, Apalachicola-Chattahoochee-<br />
Flint River Basin, Georgia, Florida, and Alabama. Proceedings, 1997 Georgia <strong>Water</strong><br />
<strong>Resources</strong> Conference. U.S. Geological Survey. Atlanta. 55 pp.<br />
Devivo, J.C., E.A. Frick, D.J. Hippe, and G.R. Buell. 1995. Effect of restricted phosphate<br />
detergent use and mandated upgrades at two wastewater-treatment facilities on water<br />
quality, metropolitan Atlanta, Georgia, 1988-93. In Hatcher, Kathryn J. (ed). 1995.<br />
<strong>National</strong> <strong>Water</strong>-Quality Assessment (NAWQA) Program: Apalachicola-Chattahoochee-<br />
Flint River Basin, Georgia, Florida, and Alabama. Reprints from proceedings of the<br />
1995 Georgia <strong>Water</strong> <strong>Resources</strong> Conference. U.S. Geological Survey. Atlanta. 37 pp.<br />
Edmiston, H. and H. Tuck. 1987. Resource inventory of the Apalachicola River and Bay<br />
drainage basin. Florida Game and Freshwater Fish Commission, Tallahassee, FL.<br />
Elliot, J. 1975a. The growth rate of brown trout fed on maximum rations. Journal of Animal<br />
Ecology 44:805-821.<br />
Elliot, J. 1975b. The growth rate of brown trout fed on reduced rations. J. Anim. Ecol. 44:823-<br />
842.<br />
Elliot, J. 1975c. Number of meals in a day, maximum weight of food consumed in a day and<br />
maximum ration of feeding for brown trout. Freshwater Biology 5:287-303.<br />
Environmental Protection Division. 1966. A biological study of Sope Creek, Cobb County,<br />
Georgia. Copy in files of Georgia EPD, GA Dept. Nat. Res., Atlanta.<br />
Environmental Protection Division. 1973. Sope Creek water quality investigation. Copy in files<br />
of Georgia EPD, Dept. of Natural <strong>Resources</strong>. Atlanta.<br />
Environmental Protection Division. 1982a. Suspended sediment transport study in<br />
Chattahoochee River tributaries. Technical paper by EPD. Georgia Department of<br />
Natural <strong>Resources</strong>, Atlanta. 29 pp.<br />
Environmental Protection Division. 1982b. <strong>Water</strong> quality investigations of Rottenwood Creek<br />
Basin (Chattahoochee) Cobb County, Georgia. Investigation summary report. Georgia<br />
Dept. of Natural <strong>Resources</strong>. Atlanta. 26 pp.<br />
Environmental Protection Division. 1982. <strong>Water</strong> quality investigation of Sope Creek Basin<br />
(Chattahoochee), Cobb County, Georgia. Investigation summary report. Georgia Dept.<br />
of Natural <strong>Resources</strong>. Atlanta. 47 pp.<br />
182
Environmental Protection Division. 1994. <strong>Water</strong> quality in Georgia 1992-1993. Clean <strong>Water</strong><br />
Act Report by the State. Georgia Dept. of Natural <strong>Resources</strong>. Atlanta. 99 pp.<br />
Environmental Protection Division. 1995a. Georgia Erosion and Sedimentation Act of 1975, as<br />
amended through 1995. Materials for the Official Code of Georgia summarized by the<br />
Department of Natural <strong>Resources</strong>, EPD, Erosion and Sedimentation Control. Atlanta. 14<br />
pp.<br />
Environmental Protection Division. 1995b. Module 5: River and supplemental tributary<br />
sampling. Technical report of the Georgia Dept. of Natural <strong>Resources</strong>. Atlanta. 37 pp.<br />
Environmental Protection Division. 1996a. Erosion and sedimentation control: Summary report<br />
of local ordinance adoption and program implementation. Georgia Dept of Natural<br />
<strong>Resources</strong>, Atlanta. 25 pp.<br />
Environmental Protection Division. 1997. Draft standard operating procedures: freshwater<br />
macroinvertebrates biological assessment. Georgia Department of Natural <strong>Resources</strong>.<br />
Atlanta.<br />
Environmental Protection Division. 1997a. Georgia Adopt-a-Stream. Basic brochure on Adopta-Stream<br />
program, with overview papers on Level I, II, and III projects. Georgia Dept. of<br />
Natural <strong>Resources</strong>. Atlanta. 12 pp.<br />
Environmental Protection Division. 1997b. Rules and regulations for water quality control:<br />
Chapter 391-3-6, Revised May 22, 1997. Georgia Department of Natural <strong>Resources</strong>.<br />
Atlanta. 96 pp.<br />
Environmental Protection Division. 1998a. Chattahoochee River Basin <strong>Management</strong> <strong>Plan</strong>.<br />
Georgia Department of Natural <strong>Resources</strong>. Atlanta. 334 pp.<br />
Environmental Protection Division. 2000. Georgia 2000 lists of water as required by the Section<br />
303(d) of the Federal Clean <strong>Water</strong> Act. Georgia Dept. of Natural <strong>Resources</strong>. Atlanta..<br />
Environmental Protection Division. 1998b. <strong>Water</strong> quality in Georgia: 1996-97. Section 305(b)<br />
of Clean <strong>Water</strong> Act summary report. Atlanta. Georgia Dept. of Natural <strong>Resources</strong>.<br />
Atlanta. 205 pp.<br />
Evans, J.W. and R.H. England. 1997. Recommended flows to protect aquatic habitat in Georgia<br />
streams. pp 329-331 In Hatcher, K. (ed.) Proc. Of 1997 Georgia <strong>Water</strong> <strong>Resources</strong><br />
Conference. University of Georgia. Atlanta.<br />
Fausch, K., J. Karr, and P. Yant. 1984. Regional application of an index of biotic integrity based<br />
on stream fish communities. Trans. Am. Fish. Soc. 113:39-55.<br />
Fausch, K., J. Lyons, J. Karr, and P. Angermeir. 1990. Fish communities as indicators of<br />
environmental degradation. American Fisheries Society Symposium 8:123-144.<br />
Faye, R.E., W.P. Carey, J.K. Stamer, and R.L. Kleckner. 1980. Erosion, sediment discharge, and<br />
channel morphology in the Upper Chattahoochee River Basin, Georgia. Geological<br />
Survey Professional Paper 1107. Washington, D.C. 85 pp.<br />
183
Fore, L., J. Karr, and R. Wisseman. 1996. Assessing invertebrate responses to human activities:<br />
evaluating alternative approaches. Journal N. A. Benthological Society 15:212-231.<br />
Forsyth County. 1997. Storm water management, Forsyth County, Georgia, Ordinance No. 75.<br />
Cumming, GA. 20 pp.<br />
Forsyth County. 1998. Storm water management design manual. Cumming, GA. 17 pp.<br />
Frick, E.A. 1997. Surface-water and shallow ground-water quality in the vicinity of metropolitan<br />
Atlanta, Upper Chattahoochee River Basin, Georgia, 1992-95. Pages 44-48 In Hatcher,<br />
Kathryn J. (ed). 1997. <strong>National</strong> <strong>Water</strong>-Quality Assessment (NAWQA) Program,<br />
Apalachicola-Chattahoochee-Flint River Basin, Georgia, Florida, and Alabama.<br />
Proceedings, 1997 Georgia <strong>Water</strong> <strong>Resources</strong> Conference. U.S. Geological Survey.<br />
Atlanta. 55 pp.<br />
Frick, E.A., G.R. Buell, and E.E. Hopkins. 1996. Nutrient sources and analysis of nutrient<br />
water-quality data, Apalachicola-Chattahoochee-Flint River Basin, Georgia, Alabama,<br />
and Florida, 1972-90. U.S. Geological Survey <strong>Water</strong>-<strong>Resources</strong> Investigations Report<br />
96-4101. Atlanta. 120 pp.<br />
Frick, E.A., D.J. Hippe, G.R. Buell, C.A. Couch, E.H. Hopkins, D.J. Wangsness, and J.W.<br />
Garrett. 1998. <strong>Water</strong> quality in the Apalachicola-Chattahoochee-Flint River Basin,<br />
Georgia, Alabama, and Florida, 1992-95. U.S. Geological Survey Circular 1164.<br />
Atlanta. 38 pp.<br />
Fulton County Board of Commissioners. (Undated). Construction and the environment: How to<br />
protect natural resources on construction sites. 28 pp.<br />
Fulton County <strong>Plan</strong>ning Commission. 1998. North Fulton update: Fulton County comprehensive<br />
plan, 1994 (update May 7, 1998). Board of Commissioners. 181 pp.<br />
General Assembly of Georgia. 1992. House Bill No. 149. To enact the Apalachicola-<br />
Chattahoochee-Flint River Basin Compact. A bill to be enacted. Atlanta. 17 pp.<br />
Georgia Soil and <strong>Water</strong> Conservation Commission. 1994. Guidelines for streambank restoration.<br />
Booklet based largely on examples from Robbin B. Sotir & Associates. Athens. 52 pp.<br />
Georgia Soil and <strong>Water</strong> Conservation Commission. 1996. Manual for erosion and sediment<br />
control in Georgia, 4th edition. Athens. 250 pp.<br />
Georgia Soil and <strong>Water</strong> Conservation Commission. 1997. Field manual for erosion and sediment<br />
control in Georgia. 3rd edition. Athens. 150 pp.<br />
Gilbert, R. 1969. The distribution of fishes in the central Chattahoochee River drainage. M.S.<br />
thesis, Auburn University, Auburn, AL.<br />
Gilbert, R. and R. Reinert. 1978. Fishes in the Buford Dam tailrace, August through December,<br />
1977. Final Contract Report No. DACW01-77-C-0160, submitted to U.S. Army Corps<br />
of Engineers, Mobile, AL.<br />
184
Giroux, P. (ed). 1997. Georgia Project WET. (i) Dragonfly Gazette 1:(1). Newsletter from the<br />
Environmental Protection Division, Georgia Department of Natural <strong>Resources</strong>. (ii)<br />
Georgia Rivers Teachers' Guide: Handout materials describing Project WET. Atlanta. 8<br />
pp.<br />
Golden, H.G. 1977. Preliminary flood-frequency relations for urban streams, metropolitan<br />
Atlanta, Georgia. U.S. Geological Survey <strong>Water</strong>-<strong>Resources</strong> Investigations 77-57.<br />
Doraville, GA. 16 pp.<br />
Groszmann, G.F. 1967. Big Creek watershed volunteer monitoring and education program:<br />
Focus on wet weather sediment and turbidity levels. pp 134-138 In K. Hatcher (ed).<br />
Proceedings of the 1997 Georgia <strong>Water</strong> <strong>Resources</strong> Conference. Athens. 550 pp.<br />
Gwinnett County. 1997a. Erosion and sediment control workshop. Prepared by CH2MHill for<br />
the county. Lawrenceville, GA. 75 pp.<br />
Gwinnett County. 1997b. Gwinnett County wetland training manual. Lawrenceville, GA. 200<br />
pp.<br />
Gwinnett County. 1998. Correspondence regarding 1997 Adopt-A-Stream Program. Memo<br />
from Adopt-A-Stream coordinator, Gwinnett County, Lawrenceville, GA. 1 pp.<br />
Gwinnett County. 1998. Gwinnett County storm water management–Ditch and stream assistance<br />
programs. Materials from Dept of Transportation, Storm <strong>Water</strong> Div and Development<br />
and Inspections Division. Pamphlets on erosion control & non-point source pollution,<br />
Lawrenceville, GA.<br />
Hammitt, W.E. and R.D. Bixler. 1994. Visitor perceptions and reactions to on-site impacts: Blue<br />
Ridge <strong>Park</strong>way; Chattahoochee River <strong>National</strong> Recreation Area; Chickamauga and<br />
Chattanooga <strong>National</strong> Military <strong>Park</strong>. Final Report. Dept. of <strong>Park</strong>s, Recreation and<br />
Tourism <strong>Management</strong>. Clemson University. 180 pp.<br />
Hansen, Bill. 1999. Feb. 2, 1999 correspondence re: draft environmental impact analysis by<br />
Corp of Engineers for the Apalachicola-Chattahoochee-Flint tri-state water allocations.<br />
<strong>National</strong> <strong>Park</strong> <strong>Service</strong>, <strong>Water</strong> <strong>Resources</strong> Div., Ft. Collins, CO. 3 pp.<br />
Harkins, John. 1995. Targeting sanitary sewer overflows using in-stream fecal coliform<br />
measurements. U.S. Environmental Protection Agency. Municipal Facilities Branch,<br />
<strong>Water</strong> <strong>Management</strong> Division. Atlanta, GA. 44 pp.<br />
Hatcher, K.J. 1992. Summary of the clean lakes program study of Lake Lanier, 1991-92. pp 1-<br />
15 In Hatcher, K. (ed.) Workshop on Lake Lanier's water quality. 1992. Institute of<br />
Natural <strong>Resources</strong>. University of Georgia. Athens, GA. 62 pp.<br />
Hatcher, K.J. (ed). 1992. Workshop on Lake Lanier's water quality. Institute of Natural<br />
<strong>Resources</strong>. University of Georgia. Athens, GA. 62 pp.<br />
Hatcher, K.J. (ed). 1997. Proceedings of the 1997 Georgia <strong>Water</strong> <strong>Resources</strong> Conference.<br />
Athens, GA. 550 pp.<br />
185
Heard, W. 1977. Freshwater mollusca of the Apalachicola drainage. Pages 37-67 In R.<br />
Livingston and E. Joyce, eds., Proceedings of the Conference on the Apalachicola<br />
Drainage System. Florida Department of Natural <strong>Resources</strong>, Marine Research<br />
Laboratory, Florida Marine Research Publication Vol. 26.<br />
Hendrix, Gary. 1992. Recreation demand scope of work and reviews comments. Chattahoochee<br />
River <strong>National</strong> Recreation Area. Atlanta, GA. 1992. 19 pp.<br />
Henry, Bruce. 1994. The incidence of PCBs in Lake Lanier and the Chattahoochee River from<br />
Buford Dam to Peachtree Creek. U.S. Environmental Protection Agency. Technology<br />
Transfer Unit. <strong>Water</strong> <strong>Management</strong> Division. Draft report. Atlanta, GA. 16 pp.<br />
Hess, T. 1980. An evaluation of the fishery resources of the Chattahoochee River below Buford<br />
Dam. Project No. F-26-7. Georgia Dept. of Nat. Res., Game and Fish Div., Atlanta, GA.<br />
Hess, T., A. Mauldin, and G. Walker. 1981. Evaluation of some important river systems within<br />
the Walton District of the East Central Region – Middle Chattahoochee River tributaries.<br />
Georgia Dept. of Nat. Res., Game and Fish Div., Atlanta, GA. Report is from a series of<br />
reports from Project EC-3.<br />
Higdon, Jim. 1996. Procedures and guidelines for the review of developments of regional<br />
impact. Georgia Department of Community Affairs. Atlanta. 16 pp.<br />
Hippe, D.J. and J.W. Garrett. 1997. The spatial distribution of dissolved pesticides in surface<br />
water of the Apalachicola-Chattahoochee-Flint River Basin in relation to land use and<br />
pesticide runoff-potential ratings, May 1994. In Hatcher, Kathryn J. (ed.) <strong>National</strong><br />
<strong>Water</strong>-Quality Assessment (NAWQA) Program, Apalachicola-Chattahoochee-Flint River<br />
Basin, Georgia, Florida, and Alabama. Proceedings, 1997 Georgia <strong>Water</strong> <strong>Resources</strong><br />
Conference. U.S. Geological Survey. Atlanta. 55 pp.<br />
Hippe, D.J., H.H. Hatzell, L.K. Ham, and P.S. Hardy. 1995. Pesticide occurrence and temporal<br />
distribution in streams draining urban and agricultural basins in Georgia and Florida,<br />
1993-94. p 1-8 In Hatcher, Kathryn J. (ed). 1995. <strong>National</strong> <strong>Water</strong>-Quality Assessment<br />
(NAWQA) Program: Apalachicola-Chattahoochee-Flint River Basin, Georgia, Florida,<br />
and Alabama. Reprints from proceedings of the 1995 Georgia <strong>Water</strong> <strong>Resources</strong><br />
Conference. U.S. Geological Survey. Atlanta. 37 pp.<br />
Hippe, D.J., D.J. Wangsness, E.A. Frick, and J.W. Garrett. 1994. <strong>Water</strong> quality of the<br />
Apalachicola-Chattahoochee-Flint and Ocmulgee River Basins related to flooding from<br />
Tropical Storm Alberto; pesticides in urban and agricultural watersheds; and nitrate and<br />
pesticides in ground water, Georgia, Alabama, and Florida. U.S. Geological Survey<br />
<strong>Water</strong>-<strong>Resources</strong> Investigations Report 94-4183. Atlanta, GA. 36 pp.<br />
Hippe, D.J., C.J. Wipperfurth, E.A. Hopkins, E.A. Frick, and D.J. Wangsness. 1997. Everyone<br />
lives downstream: <strong>Water</strong>-quality issues related to urban development of the upper<br />
Chattahoochee River <strong>Water</strong>shed. U.S. Geological Survey. Atlanta, GA. (poster)<br />
Hobbs, H. 1942. The crayfishes of Florida. University of Florida, Biological Science Studies<br />
Vol. 3(2). Gainesville, FL.<br />
Hobbs, H. 1981. The crayfishes of Georgia. Smithsonian Contributions to Zoology No. 318.<br />
186
Ingols, R. 1962. How a dam changed the Chattahoochee’s ‘personality’. Res. Eng. December<br />
1962:10-11.<br />
Johnson, C.D. 1995. Urban runoff --how polluted is it? University of Wisconsin Extension note.<br />
Madison, WI. 6pp.<br />
Johnson, R. 1972. The Unionidae of peninsular Florida. Bull. FL. State. Museum, Biological<br />
Sciences 16(4):181-249.<br />
Karr, J. 1981. Assessment of biotic integrity using fish communities. Fisheries 6:21-27.<br />
Karr, J. 1991. Biological integrity: A long-neglected aspect of water resource management.<br />
Ecol. Appl. 1:66-84.<br />
Karr, J. 1992. Measuring biological integrity: lessions from streams. Pages 83-104 In S.<br />
Woodley, J. Kay, and G. Francis, eds., Ecological integrity and the management of<br />
ecosystems. St. Lucie Press, Delray Beach, FL.<br />
Karr, J. 1996. Ecological integrity and ecological health are not the same. Pages 100-113 In P.<br />
Schulze, editor. Engineering within ecological constraints. <strong>National</strong> Academy Press,<br />
Washington, D.C.<br />
Karr, J., K. Fausch, P. Angermeir, P. Yant, and I. Schlosser. 1986. Assessment of biological<br />
integrity in running water: a method and its rationale. Illinois Natural History Survey<br />
Special Publication No. 5. Champaign, IL.<br />
Kerans, B. and J. Karr. 1994. A benthic index of biotic integrity for rivers of the Tennessee<br />
Valley. Ecological Applications 4:768-785.<br />
Kundell, J.E. 1997. <strong>Water</strong>-related legislation of the 1995-1996 term of the Georgia General<br />
Assembly. pp 5-8 In K. Hatcher (ed). Proceedings of the 1997 Georgia <strong>Water</strong> <strong>Resources</strong><br />
Conference. Athens. 550 pp.<br />
Kunkle, S.H. and G.H. Comer. 1971. Estimating suspended sediment concentrations in streams<br />
by turbidity measurements. Journal of Soil and <strong>Water</strong> Conservation 28(1):18-20.<br />
Law Engineering and Environmental <strong>Service</strong>s, Inc. 1994. Chattahoochee river modeling project:<br />
Phase I Report C Issue Analysis and model selection. Submitted to Georgia<br />
Environmental Protection Division. Project 55-3510. Kennesaw, GA. 150 pp.<br />
Law Engineering and Environmental <strong>Service</strong>s, Inc. 1996. Chattahoochee River modeling project<br />
--Phase I Report: Storm water monitoring. Report for the <strong>National</strong> <strong>Park</strong> <strong>Service</strong>, SE<br />
Region. Project 55-3510. Kennesaw, GA. 40 pp.<br />
Law Engineering and Environmental <strong>Service</strong>s, Inc. 1998. Phase II --final draft: 1995 storm<br />
water management modeling. Report for the <strong>National</strong> <strong>Park</strong> <strong>Service</strong>, SE Region. Project<br />
55-3510. January, 1998. 200 pp.<br />
Littlejohn, Margaret. 1998. Chattahoochee River <strong>National</strong> Recreation Area visitor study. Report<br />
102. Cooperative <strong>Park</strong> Studies Unit. University of Idaho, Moscow. 57 pp.<br />
187
Long, B.A., G.W. Rosenlieb, W.H. Walker, and W.L. Jackson. 1996. Review of the <strong>National</strong><br />
<strong>Water</strong> Quality Assessment (NAWQA) Program in national parks, Fiscal Year 1995.<br />
<strong>National</strong> <strong>Park</strong> <strong>Service</strong> Technical Report NPS/NRWRD/NRTR-96/91. Fort Collins, CO.<br />
26 pp.<br />
Lyons, J., S. Navarro-Perez, P. Cochran, E. Santana-C., and M. Guzman-Arroyo. 1995. Index of<br />
biotic integrity based on fish assemblages for the conservation of streams and rivers of<br />
westcentral Mexico. Conserv. Biol. 9:569-584.<br />
Martin, C.R. 1985a. Hatchery and field performance of six trout strains stocked as catchables in<br />
the Chattahoochee River, Georgia. Project No. F-26-12. Georgia Dept. Nat. Res., Game<br />
and Fish Div., Atlanta.<br />
Martin C.R. 1985b. Creel survey of the Chattahoochee River and an evaluation of the effects of<br />
poor fall water.<br />
Martin, C.R., and T.B. Hess. 1986. The impacts of sand and gravel dredging on trout and trout<br />
habitat in the Chattahoochee River, Georgia. Project Final Report. Georgia Dept of<br />
Natural <strong>Resources</strong>. Game and Fish Division. Atlanta. 36 pp.<br />
Mauldin, A. and J. McCollum. 1992. Status of the Chattahoochee River fish population<br />
downstream of Atlanta, Georgia. Project No. F-26. Georgia Dept. of Nat. Res., Game<br />
and Fish Div., Atlanta.<br />
McConnell, J.B. 1980. Impact of urban storm runoff on stream quality near Atlanta, Georgia.<br />
U.S. Environmental Protection Agency Report No. EPA-600/2-80-094. (Work by U.S.<br />
Geological Survey, <strong>Water</strong> <strong>Resources</strong> Division, Doraville, GA). EPA, Cincinnati. 64 pp.<br />
McMahon, George, and Pat Stevens. 1995. Storage analysis for the ACF, ACT and Savannah<br />
River Basins. In K. Hatcher (ed.). 1995 Georgia <strong>Water</strong> <strong>Resources</strong> Conference.<br />
University of Georgia. Athens. 412 pp.<br />
Meador, M.R. and A.O. Layher. 1998. Instream sand and gravel mining. Fisheries 23(11):6-13.<br />
Micrology Laboratories. 1997. Coliscan Easygel for coliform and fecal coliform testing.<br />
Directions for technique use and interpretation from Micrology Labs, Goshen, IN. 5 pp.<br />
Mikalsen, Ted. 1989. Factors influencing the quality of urban streams in Georgia and the<br />
implications for stream management. pp 135-138 In K. Hatcher (ed.). 1989 Proceedings<br />
of the 1989 Georgia <strong>Water</strong> <strong>Resources</strong> Conference. Athens. 245 pp.<br />
Miller, D., and seventeen others. 1988. Regional applications of an index of biotic integrity for<br />
use in water resource management. Fisheries 13(5):12-20.<br />
Mulholland, P. and D. Lenat. 1992. Streams of the southeastern Piedmont, Atlantic drainage.<br />
Pages 193-232 in C. Hackney, S. Adams, and W. Martin, eds., Biodiversity on the<br />
Southeastern United States. John Wiley and Sons, Inc. New York, NY.<br />
188
<strong>National</strong> <strong>Park</strong> <strong>Service</strong>. 1997. Draft proposal: River-based recreation assessment for development<br />
and evaluation of the water allocation formulas under the ACT and ACF Interstate<br />
Compacts. Southeast Regional Office, NPS, Atlanta, GA. 7 pp.<br />
<strong>National</strong> <strong>Park</strong> <strong>Service</strong>. 1999. Referenced Manual to Director’s Order 83 – Public Health.<br />
<strong>National</strong> <strong>Park</strong> <strong>Service</strong>, Washington, D.C. Appendix D (Bathing Beaches).<br />
Natural <strong>Resources</strong> Conservation <strong>Service</strong>. 1996. Update for the soil survey of Cobb County,<br />
Georgia. USDA, providing new interpretative tables. Atlanta, GA. 95 pp.<br />
Neal, Larry. 1994. Chattahoochee River modeling project issue identification. Handout<br />
materials primarily in table format. Law Engineering and Environmental <strong>Service</strong>s, Inc.<br />
Kennesaw, GA. 18 pp.<br />
Nestler, J.M. , R.T. Milhous, J. Troxel, and J. Fritschen. 1984. Effects of flow alterations on<br />
trout, angling, and recreation in the Chattahoochee River between Buford Dam and<br />
Peachtree Creek. U.S. Army Corps of Engineers report. USAE <strong>Water</strong>ways Experiment<br />
Station, Vicksburg, MS. 100 pp.<br />
Nichols, David. 1997. Land development provisions to protect Georgia water quality. Booklet<br />
prepared for the Environmental Protection Division, State of Georgia by staff at<br />
University of Georgia, School of Environmental Design. Athens. 35 pp.<br />
Norman, C.E. 1970. Geometric relationships between geologic structure and ground stresses<br />
near Atlanta, Ga. U.S. Department of Interior, Bureau of Mines. Report of<br />
Investigations 7365. Washington, D.C. 24 pp.<br />
Ohio EPA. 1988. Biological criteria for the protection of aquatic life, volumes 1-3. Ecological<br />
Assessment Section, Division of <strong>Water</strong> Quality Monitoring and Assessment, Ohio EPA,<br />
Columbus, OH.<br />
Office of Legislative Counsel. 1996. Official code of Georgia --Annotated: Title 12.<br />
Conservation and natural resources. The Code Revision Commission, State of Georgia.<br />
Published by Michie Law Publishers, Charlottesville, VA. pp 312-363.<br />
Office of the Solicitor. 1997. Recoveries of cost: response and damage assessment. December<br />
17, 1997 Correspondence from Office of the Solicitor, US Dept of Interior, Washington,<br />
regarding “Coordination of cases under the <strong>Park</strong> System <strong>Resources</strong> Protection Act, ”<br />
with copy of Public Law 101-337 [H.R. 2844] of July 27, 1990, “<strong>National</strong> <strong>Park</strong> System<br />
<strong>Resources</strong>: Damage.” 6 pp.<br />
Pendergrast, C.K. 1997. Whose water is it anyway? --A survey of Georgia law on surface water<br />
and groundwater withdrawal rights. pp 447-451 In K. Hatcher (ed). Proceedings of the<br />
1997 Georgia <strong>Water</strong> <strong>Resources</strong> Conference. Athens. 550 pp.<br />
Perlman, H.A. 1985. Sediment data for Georgia streams, water years 1958-82. U.S. Geological<br />
Survey Open File Report 84-722. Doraville, GA. 101 pp.<br />
189
Peters, N.E. and S.J. Kandell. 1997. Evaluation of streamwater quality in the Atlanta region. pp<br />
51-55 In Hatcher, Kathryn (ed). 1997. <strong>National</strong> <strong>Water</strong>-Quality Assessment (NAWQA)<br />
Program, Apalachicola-Chattahoochee-Flint River Basin, Georgia, Florida, and Alabama.<br />
Proceedings, 1997 Georgia <strong>Water</strong> <strong>Resources</strong> Conference. U.S. Geological Survey.<br />
Atlanta. 55 pp.<br />
Peters, N.E., G.R. Ruell, and E.A. Frick. 1997. Spatial and temporal variability in nutrient<br />
concentrations in surface waters of the Chattahoochee River Basin near Atlanta, Georgia.<br />
p 14-23 In Hatcher, Kathryn J. (ed). <strong>National</strong> <strong>Water</strong>-Quality Assessment (NAWQA)<br />
Program, Apalachicola-Chattahoochee-Flint River Basin, Georgia, Florida, and Alabama.<br />
Proceedings, 1997 Georgia <strong>Water</strong> <strong>Resources</strong> Conference. U.S. Geological Survey.<br />
Atlanta. 55 pp.<br />
Petts, G. 1984. Impounded Rivers. John Wiley and Sons, New York, NY.<br />
Pflakin, J., M. Barbour, K. Porter, S. Gross, and R. Hughes. 1989. Rapid bioassessment<br />
protocols for use in streams and rivers. EPA 440-4-89-001. Office of <strong>Water</strong> Regulations<br />
and Standards, U.S. Environmental Protection Agency, Washington, D. C.<br />
Poff, N. and J. Ward. 1989. Implications of streamflow variability and predictability for lotic<br />
community structure: a regional analysis of streamflow patterns. Canadian Journal of<br />
Aquatic Sciences 46:1805-1818.<br />
Public Health <strong>Service</strong>. 1962. Summary report on quality of interstate waters: Upper<br />
Chattahoochee River, Alabama-Georgia. U.S. Public Health <strong>Service</strong>, Region IV, <strong>Water</strong><br />
Supply and Pollution Control. Technical report. Atlanta, 13 pp.<br />
Reinert, Bob. 1992. Contaminants in fish: their effects on fish health and human health. pp 54-<br />
62 In Hatcher, Kathryn J. (ed). 1992. Workshop on Lake Lanier's water quality.<br />
Institute of Natural <strong>Resources</strong>. University of Georgia. Athens, GA. 62 pp.<br />
Richter, B., J. Baumgartner, R. Wigington, and D. Braun. 1997. How much water does a river<br />
need? Freshwater Biology 37:231-249.<br />
River Chat. 1997 (summer). [Two items]: (i) Outboard motors are fouling our waterways. (ii)<br />
Roswell approves strong buffer ordinance. Summer 1997 Issue of River Chat, newsletter<br />
of Upper Chattahoochee Riverkeeper. Atlanta, GA. 8 pp.<br />
River Chat. 1998 (winter). [Three items]: (i) Moving from litigation to solutions. (ii) Lake<br />
Lanier report card issued. (iii) Number of stream buffer variances alarming. Winter<br />
1998 Issue of River Chat, newsletter of Upper Chattahoochee Riverkeeper. Atlanta, GA.<br />
8 pp.<br />
River Chat. 1998 (spring). Resolving the water wars. Newsletter of Upper Chattahoochee<br />
Riverkeeper. 1p.<br />
Satterfield, J. 1961. A study of the distribution of fishes in the headwaters of streams of northern<br />
Georgia. M.S. thesis, U. of Georgia, Athens, GA.<br />
Schindler, D. 1987. Determining ecosystem responses to anthropogenic stress. Canadian J. Fish.<br />
Aquat. Sci. 44 (Suppl. 1):6-25.<br />
190
Schindler, D. 1990. Experimental perturbations of whole lakes as tests of hypotheses concerning<br />
ecosystem structure and function. Oikos 57:25-41.<br />
Seabrook, C. 1997. Various articles in The Atlanta Journal-Constitution:<br />
#(i) "Risky waters: Health hazards put damper on outdoor fun. "Sunday, July 20, 1997.<br />
Atlanta. 1 pp.<br />
#(ii) "Development's dirty aftermath. "Nov. 24, 1997. 7 pp equivalent.<br />
#(iii) Lake Lanier: Just turning 40, but old before its time. 3 pp equivalent.<br />
Shefter, J.E. and R.M. Hirsch. 1980. An economic analysis of selected strategies for dissolvedoxygen<br />
management: Chattahoochee River, Georgia. Geological Survey Professional<br />
Paper 1140. Washington. 26 pp.<br />
Shelby, B., T.C. Brown, and J.G. Taylor. 1992. Streamflow and recreation. USDA Forest<br />
<strong>Service</strong> General Tech Rpt RM-209. Rocky Mt. Forest and Range Experiment Station.<br />
Fort Collins, CO. 27 pp.<br />
Shelton, N., and L. Fox. 1994. An introduction to selected laws important for resources<br />
management in the <strong>National</strong> <strong>Park</strong> <strong>Service</strong>. Natural <strong>Resources</strong> Rpt NPS/NRPO/NRR-<br />
94/15. Washington. 48 pp.<br />
Sierer, S., A. Davis, and B. Willkie. 1980. Capability of state and local resource laws to protect<br />
Chattahoochee River resources. Georgia Institute of Technology, Department of City<br />
<strong>Plan</strong>ning, in cooperation with the <strong>National</strong> <strong>Park</strong> <strong>Service</strong> <strong>Plan</strong>ning Team for<br />
Chattahoochee River NRA. Atlanta, GA. 143 pp.<br />
Snead, N. K. 1981. <strong>Water</strong> quality surveillance of the Chattahoochee River headwaters. The<br />
Georgia Council of Trout Unlimited, in cooperation with Environmental Protection<br />
Division, Georgia Department of Natural <strong>Resources</strong>. Atlanta, GA. 76 pp.<br />
Sparks, R. 1995. Need for ecosystem management of large rivers and their floodplains.<br />
Bioscience 45:169-182.<br />
Spencer, D. 1999. Comments of the <strong>National</strong> <strong>Park</strong> <strong>Service</strong> on the draft environmental impact<br />
state: <strong>Water</strong> Allocation for the Apalachicola-Chattahoochee- Flint River Basin.<br />
Correspondence from NPS Regional Office, Atlanta, GA to Corps of Engineers. 4 pp.<br />
Soil Conservation <strong>Service</strong>. 1958. Soil survey of Fulton County, Georgia. Series 1949, No. 7.<br />
J.H. Walker, Coordinator. U.S. Department of Agriculture, SCS, in cooperation with the<br />
University of Georgia, College of Agriculture, Athens, Ga. 79 pp plus 50 plates.<br />
Soil Conservation <strong>Service</strong>. 1960. Soil survey of Forsyth County, Georgia. U.S. Department of<br />
Agriculture, SCS, in cooperation with the University of Georgia, College of Agriculture,<br />
Athens, Ga. 47 pp plus 20 plates.<br />
Soil Conservation <strong>Service</strong>. 1967. Soil survey of Gwinnett County, Georgia. U.S. Department of<br />
Agriculture, SCS, in cooperation with the University of Georgia, College of Agriculture,<br />
Agricultural Experiment Stations. 94 pp text plus 56 pp maps.<br />
191
Soil Conservation <strong>Service</strong>. 1973. Soil survey of Cobb County, Georgia. [see also NRCS, 1996<br />
update]. Grover J. Thomas, Jr., Coordinator. U.S. Department of Agriculture, SCS, in<br />
cooperation with the University of Georgia, College of Agriculture, Agricultural<br />
Experiment Stations. December, 1973. Athens, Ga. 70 pp plus 45 plates.<br />
Stanford, J., J. Ward, W. Liss, C. Frissell, R. Williams, J. Lichatowich, and C. Coutant. 1996. A<br />
general protocol for restoration of regulated rivers. Regulated Rivers, Research and<br />
<strong>Management</strong> 12:391-413.<br />
Stell, Susan M. 1993. Analysis of available information on pesticides for the Apalachicola-<br />
Chattahoochee-Flint River Basin. In Proceedings of the 1993 Georgia <strong>Water</strong> <strong>Resources</strong><br />
Conference. Hatcher, K.J (ed). U.S. Geological Survey. Atlanta. 40 pp.<br />
Stell, S.M., E.H. Hopkins, G.R. Buell, and D.J. Hippe. 1995. Use and occurrence of pesticides in<br />
the Apalachicola-Chattahoochee-Flint River, Georgia, Alabama, and Florida, 1960-91.<br />
U.S. Geological Survey Open-File Report 95-739. Atlanta. 65 pp.<br />
Stevens, P.A. 1989. <strong>Water</strong> supply planning and coordination in the Atlanta region. pp 88-90 In<br />
K. Hatcher (ed). 1989. Proceedings of the 1989 Georgia <strong>Water</strong> <strong>Resources</strong> Conference.<br />
Athens. 245 pp.<br />
Stevens, P.A. 1993. <strong>Water</strong> resources of the Atlanta region. pp 45-53 In K. Hatcher (ed).<br />
Proceedings of the 1993 Georgia <strong>Water</strong> <strong>Resources</strong> Conference. Athens. 412 pp.<br />
Swift, C. C. Gilbert, S. Bortone, G. Burgess, and R. Yerger. 1986. Zoogeography of the<br />
freshwater fishes of the southeastern United States: Savannah River to Lake<br />
Pontchartrain. Pages 213-266 In C. Hocutt and E. Wiley, editors, The Zoogeography of<br />
North American Freshwater Fishes. John Wiley and Sons, Inc., New York, New York..<br />
Tilmant, Jim. 1999. Correspondence, re: tri-state allocation draft EIS, Apalachicola-<br />
Chattahoochee-Flint River Basins. <strong>National</strong> <strong>Park</strong> <strong>Service</strong>, <strong>Water</strong> <strong>Resources</strong> Div., Ft.<br />
Collins, CO. 6 pp.<br />
Topper, Erwin. 1992. Lake Sidney Lanier: Program Summary. pp 36-38 In Hatcher, Kathryn<br />
(ed). 1992. Workshop on Lake Lanier's <strong>Water</strong> Quality: 1992. University of Georgia.<br />
Athens, GA. 62 pp.<br />
Topper, Erwin. 1997. <strong>Water</strong> quality/beach testing plan for CY97. Army Corps of Engineers<br />
Internal Memorandum June 7, 1997. Mobile, AL. 7 pp.<br />
Trust for Public Land. 1997. Saving Atlanta's Lifeline: Protecting the Chattahoochee River. p 9<br />
In TPL Annual report, 1997, with brochures. San Francisco, CA. 28 pp.<br />
Upper Chattahoochee Riverkeeper. 1996. Permit monitoring project. Riverkeeper Fact Sheet,<br />
December, 1996. Atlanta, GA. 4 pp.<br />
Upper Chattahoochee Riverkeeper Homepage. 1996-97. Various articles on its homepage.<br />
Upper Chattahoochee Riverkeeper. 1997. Conservation packet for developers. Atlanta, GA.<br />
192
U.S. Army Corps of Engineers. 1973. Flood plain information: Chattahoochee River --Buford<br />
Dam to Whitesburg, Georgia. Technical report, Mobile District, Mobile, AL. 16 pp.<br />
U.S. Army Corps of Engineers. 1974. Flood plain information: Rottenwood Creek. Technical<br />
report, Mobile District. 17 pp text. 12 maps.<br />
U.S. Army Corps of Engineers. 1978. Metropolitan Atlanta area water resources management<br />
study: Appendix A: Background information. Savannah District, Savannah, GA. 400 pp.<br />
U.S. Army Corps of Engineers. 1981. Metropolitan Atlanta area water resources management<br />
study. Savannah District, Savannah, GA. 250 pp.<br />
U.S. Army Corps of Engineers. 1987a. Design memorandum, Lake Lanier re-regulation dam.<br />
(Vol 1 of 2). Savannah District, Savannah, GA. 8 pp.<br />
U.S. Army Corps of Engineers. 1987b. Lakeshore management plan: Lake Sidney Lanier.<br />
Mobile District. Mobile, Alabama. 28 pp.<br />
U.S. Army Corps of Engineers. 1997a. Federal interagency management plan for the evaluation<br />
and implementation of the ACT/ACF water allocation formulas. Final plan, 29 July<br />
1997. Mobile, AL. 39 pp.<br />
U.S. Army Corps of Engineers. 1997b. The story of Lake Lanier. Buford, GA. 7 pp.<br />
U.S. Army Corps of Engineers. 1998a. Sharing the water: ACT and ACF River Basins.<br />
Newsletter No. 2, June 1998. Mobile, AL. 6 pp.<br />
U.S. Army Corps of Engineers. 1998b. <strong>Water</strong> allocation for the Apalachicola-Chattahoochee-<br />
Flint (ACF) River Basin. Main Report, Mobile, AL. 353 pp.<br />
U.S. Congress. 1978. An act to authorize the establishment of the Chattahoochee River <strong>National</strong><br />
Recreation Area in the State of Georgia, and for other purposes. Public Law 95-344.<br />
95th Congress, August 15, 1978. Washington. pp 206-209.<br />
U S. Environmental Protection Agency. 1996a. Summary of state biological assessment<br />
programs for streams and rivers. EPA 230-R-96-007. Office of Policy, <strong>Plan</strong>ning, and<br />
Evaluation, Washington, D.C.<br />
U.S. Environmental Protection Agency. 1996b. Biological assessment methods, biocriteria, and<br />
biological indicators: bibliography of selected technical, policy, and regulatory literature.<br />
EPA 230-B-96-001. Office of Policy, <strong>Plan</strong>ning, and Evaluation, Washington, D. C.<br />
U. S. Geological Survey. 1998a. http://nas.er.usgs.gov/fishes/accounts/synbranc/mo_albus.html.<br />
U.S. Geological Survey. 1998b. http://biology.usgs.gov/newsrelease/1998/5-15.html.<br />
U.S. Geological Survey. 1999. Microbial contamination of water resources in the Chattahoochee<br />
River <strong>National</strong> Recreation Area. Project progress report, Atlanta, GA. 8 pp.<br />
193
Wangsness, D.J., E.A. Frick, G.R. Buell, and J.C. DeVivo. 1994. Effect of restricted use of<br />
phosphate detergent and upgraded wastewater-treatment facilities on water quality in the<br />
Chattahoochee River near Atlanta, Georgia. USGS summary note. Atlanta, GA. 4 pp.<br />
Ward, J. and J. Stanford, eds. 1979. The ecology of regulated streams. Plenum Press, New York,<br />
NY.<br />
West, D. 1997. Protection of water resources in the Big Creek watershed. pp 213-215 In K.<br />
Hatcher (ed). Proceedings of the 1997 Georgia <strong>Water</strong> <strong>Resources</strong> Conference. Athens.<br />
550 pp.<br />
Whittaker, Doug, B. Shelby, W. Jackson, and R. Beschta. 1993. Instream flows for recreation: A<br />
handbook on concepts and research methods. <strong>National</strong> <strong>Park</strong> <strong>Service</strong>, <strong>Water</strong> <strong>Resources</strong><br />
Division. Fort Collins, CO. 103 pp.<br />
Williams, J. and J. Box. 1993. Freshwater mussels of the Chattahoochee and Flint Rivers. Pages<br />
296-297 in K. Hatcher, editor, 1993 Georgia <strong>Water</strong> <strong>Resources</strong> Conference, U. of Georgia,<br />
Athens.<br />
Word, David, and Kathryn J. Hatcher. 1993. Plenary session: Comprehensive study of the ACF<br />
and ACT River Basins. pp 8-13 In K. Hatcher (ed). Proceedings of the 1993 Georgia<br />
<strong>Water</strong> <strong>Resources</strong> Conference. Athens. 412 pp.<br />
World Health Organization. 1984. Guidelines for drinking-water quality. Vol 2: Health criteria<br />
and other supporting information. WHO. Geneva, Switzerland. 335 pp.<br />
Yerger, R. 1977. Fishes of the Apalachicola River. Pages 22-23 in R. Livingston and E. Joyce,<br />
eds., Proceedings of the Conference on the Apalachicola Drainage System. Florida<br />
Marine Research Publication.<br />
Yoder, C. and E. Rankin. 1995. Biological response signatures and the area of degradation<br />
value: new tools for interpreting multimetric data. Pages 263-286 in W. Davis and T.<br />
Simon, eds., Biological assessment and criteria: tools for water resource planning and<br />
decision making. Lewis Publishers, Boca Raton, FL.<br />
Zimmerman, M.J., and M.S. Dortch. 1988. <strong>Water</strong> quality modeling study of proposed reregulation<br />
dam downstream from Buford Dam, Chattahoochee River, Georgia. U.S.<br />
Army Corps of Engineers Technical Report EL-88-14. Vicksburg, MS. 32 pp +<br />
appendices.<br />
194
APPENDIX A. ABSTRACTS OF ONGOING OR PROPOSED PROJECTS<br />
WITHIN THE CRNRA<br />
________________________________________________________________________<br />
ABSTRACT NO. 1<br />
Title: Recreation Flow Preference Study on the Chattahoochee River (1999)<br />
(the complete proposal is available at CRNRA or the NPS Regional Office)<br />
Basic Objective(s): Conduct surveys at 10 points along the Chattahoochee River to estimate the<br />
number and type of riverine recreation users and their preferences for various flow regimes<br />
during late August and September, 1999 (note, nearly all river recreation occurs in spring and<br />
summer). Interviews with recreationists will provide information about the recreationists (age,<br />
etc), the type of recreation (fishing, wading, canoeing, etc), impressions of the interviewees about<br />
water conditions (too high, too low, ideal, etc), and notes on problems recreationists see (water<br />
quality, hazards, etc). The interviewee information will be compared to river flow information at<br />
the time of the interview. Interpretations or implications can then be drawn about optimum flow<br />
levels for various recreation activities. The study’s results will be compared to the flow levels<br />
planned by the tri-state allocation. Thus, the study will provide a way to interpret how the tristate<br />
allocations would be acceptable, or not, to river recreationists.<br />
Overview: The <strong>National</strong> <strong>Park</strong> <strong>Service</strong>’s SE Regional Office and the CRNRA have prepared a<br />
contract with the local office of the consulting firm CH2MHill for a study of recreation users on<br />
the Chattahoochee River. The purpose of the study is to evaluate user preferences for various<br />
flow regimes on segments of the river in the CRNRA. The information will be used by the NPS<br />
to evaluate the impacts of the proposed water allocation formula on riverine recreation use in the<br />
CRNRA.<br />
________________________________________________________________________<br />
ABSTRACT NO. 2<br />
Title: Microbial Contamination of <strong>Water</strong> <strong>Resources</strong> in the Chattahoochee River<br />
<strong>National</strong><br />
Recreation Area, Georgia (October 1, 1998 to September 30, 2000)<br />
Investigators: Elizabeth A. Frick, M. Brian Gregory and Adrienne L. Funk, Georgia District, U.<br />
S. Geological Survey<br />
Basic Objective(s): Measure fecal-indicator bacteria (fecal coliforms, E. coli, and enterococci)<br />
at sites on the river and in eight tributaries in the CRNRA. This is a joint U.S. Geological Survey<br />
and <strong>National</strong> <strong>Park</strong> <strong>Service</strong> project.<br />
Overview: Sampling of fecal-indicator bacteria (fecal coliform, E. coli, and enterococci)<br />
provides an understanding of potential public-health risks. The study will help determine the<br />
correlation between indicator-bacteria levels and the waterborne pathogens that pose humanhealth<br />
risks within the CRNRA. Sampling of chemical sewage tracers during a wide range of<br />
hydrologic conditions will further enable definitions of point and nonpoint sources of microbial<br />
contamination. The study also proposes to measure Clostridium perfringens, coliphages and<br />
more than 40 non-conventional contaminants or "chemical sewage tracers." Clostridium<br />
perfrigens is a sensitive bacterial indicator of microorganisms that enter streams from point<br />
sources. Coliphages are a bacteriophage that is representative of viruses in the environment. The<br />
project area is the watershed for the Chattahoochee River from Buford Dam to just downstream<br />
195
of the mouth of Peachtree Creek. The area includes the entire CRNRA, much of the Metropolitan<br />
Atlanta, and extends downstream of two major wastewater treatment plant outfalls for the City of<br />
Atlanta and Cobb County. The study measures fecal-indicator bacteria every 5 to 8 days at three<br />
main stem Chattahoochee River sites. One diel sample, which samples indicator bacteria every 2<br />
hours for a 26-hour period, will be accomplished. Four synoptic surveys will also be done at four<br />
Chattahoochee River sites and eight tributary sites during critical seasons and hydrologic<br />
conditions.<br />
Some goals of the project in 2000 includes: (1) Relate microbial levels to predictor variables and<br />
evaluate stream status over a range of hydrologic conditions in river reaches with different land<br />
use and sewered characteristics within the CRNRA. (2) Evaluate sources of microbial<br />
contaminants relative to tributary stream baseflow and stormflow periods and peak recreational<br />
use periods. Evaluate occurrence and distribution of pathogens and coliphages relative to fecalindicator<br />
bacteria. (3) Relate occurrence and distribution of microbial contaminants to presence<br />
and source of domestic wastewater based on concentrations of chemical sewage tracers. (4)<br />
Provide timely dissemination of fecal-indicator bacteria data that can be used by the CRNRA.<br />
Current data and project description are available at < http://ga.water.usgs.gov/projects/chatm >.<br />
ABSTRACT NO. 3<br />
Title: Microbial source tracking utilizing ribosomal RNA typing in the<br />
Chattahoochee River<br />
<strong>National</strong> Recreation Area watershed, Metropolitan Atlanta<br />
Investigators: Elizabeth A. Frick, M. Brian Gregory and Adrienne L. Funk, Georgia District,<br />
U. S. Geological Survey<br />
Basic Objective(s): This joint U.S. Geological Survey (USGS) and <strong>National</strong> <strong>Park</strong> <strong>Service</strong><br />
(NPS) project will cooperate with a contract laboratory to use genetic analysis of ribosomal<br />
fingerprints (ribotyping) to statistically match Escherichia coli (E. coli) strains in water samples<br />
to E. coli strains from fecal samples from humans, domestic animals, and wildlife.<br />
Overview: The CRNRA includes 48 miles of the Chattahoochee River from Buford Dam to<br />
Peachtree Creek, its bed and banks, as well as several land-based areas adjacent to the river.<br />
Within the northern Metropolitan Atlanta area, high levels of fecal-indicator bacteria are the<br />
principal reason for impairment of streams draining lands adjacent to the CRNRA. Although<br />
fecal coliform data provide information about the occurrence and distribution of microbial water<br />
contaminants, they do not indicate the sources of contamination. Different types of data are<br />
needed to determine the relative importance of various sources of microbial contamination in a<br />
watershed.<br />
Ribotyping consists of a DNA fingerprinting technique utilizing highly conserved DNA<br />
sequences that ultimately produce the proteins that produce ribosomal RNA. The ribotyping<br />
technique consists of: (1) positive identification of E. coli and pure culture growth, (2) DNA<br />
isolation and restriction enzyme digestion, (3) gel electrophoresis and DNA probing using<br />
segments of the ribosomal operon, and (4) Southern hybridization and analysis. Similar to<br />
forensic techniques, unknown ribotypes from water samples are matched to unique ribotypes<br />
196
from individual warm-blooded species found in the watershed. These ribotypes from fecal source<br />
samples will be added to a regional library of ribotypes so that future work may benefit from this<br />
project.<br />
Prior to April 2000, 24 water samples will be collected during low-flow and wet-weather synoptic<br />
surveys at four Chattahoochee River and eight tributary sites in the Metropolitan Atlanta area. In<br />
addition, 40 source fecal samples will be collected. Ribotypes will be generated from 600 E. coli<br />
isolates from water samples and 1,000 E. coli isolates from source samples. The percent<br />
similarities among individual ribotypes will be matched statistically to determine the distribution<br />
of each source's contribution to contamination. The relative importance of human, domestic<br />
animals, and wildlife as sources of fecal contamination is expected to vary among watersheds and<br />
between base-flow and wet-weather conditions within watersheds. Data on the distribution of<br />
each source's contribution to contamination in each watershed will provide information to<br />
prioritize sources of fecal contamination and more effectively design and implement nonpoint and<br />
point source pollution controls.<br />
_____________________________________________________________<br />
ABSTRACT NO. 4 OF ONGOING PROJECT WITHIN THE CRNRA<br />
Title: Complete Investigation of Chattahoochee Trout Fishery<br />
Subtitle: Phase II Fish Tagging and Creel Survey<br />
(complete proposal available at the CRNRA)<br />
Basic Objective(s): The proposed project will accomplish an overall survey of the fisheries and<br />
monitor water quality including invertebrates in order to make recommendations as to trout size and<br />
stocking rate. The <strong>Park</strong> will take an active role in the monitoring of the fisheries located in the<br />
CRNRA by providing funding for a Microtagging/Mortality Evaluation and Creel survey, as the<br />
second part of an overall DNR fishery survey.<br />
Overview: Two distinct rainbow and brown trout fisheries exist in the CRNRA. A put-and-take<br />
fishery is implemented from Buford Dam to Morgan Falls Dam and a second put-grow-and-take<br />
fishery lies below Morgan Falls Dam. The stocking rate for trout has greatly increased while the<br />
physical and chemical characteristics of the River have changed considerably over the last decade.<br />
Trout growth and adaptability, along with invertebrate food sources, need to be evaluated as possible<br />
indicators of water quality and overall ecosystem health. The last survey was in 1983. The park<br />
needs to evaluate the effect of biomass increase and changing water quality on the river and fisheries.<br />
The Chattahoochee River from Buford Dam to Morgan Falls Dam is a popular put-and-take trout<br />
fishery. There have been several changes to the trout fishery since 1983. Numbers of stocked,<br />
catchable trout have progressively increased since the early 1980s, and regulations were changed<br />
from seasonal to year-round fishing in 1996.<br />
Expansive development in the metropolitan Atlanta area over the last decade has contributed heavily<br />
to declining water quality in both the upper and lower sections of the river. Increased angler pressure,<br />
excessive sediment loads from tributaries, nutrient loading from wastewater treatment plants,<br />
seasonal water quality issues associated with low dissolved oxygen levels in Lake Lanier and<br />
changes in fishing regulations have affected the trout fishery in the Chattahoochee River.<br />
197
The first 2 years of the project have been completed by the DNR without financial or manpower<br />
assistance from the NPS. The portion of the study to be funded by the NPS for the FY-2000 will<br />
include the Microtagging/Mortality Evaluation, Creel Survey and Final Report Preparation. This<br />
effort is designed to accomplish the following objectives: 1) conduct a complete review of all<br />
pertinent literature; 2) estimate growth and survival of microtagged cohorts of brown trout and<br />
rainbow trout; 3) conduct a 12-month creel survey on the upper section of the river; 4) monitor water<br />
quality in the upper section of the river for a 12-month period; 5) recommend sizes and stocking rates<br />
of trout to maximize harvest and minimize cost; and 6) conduct an invertebrate survey for trout food<br />
availability.<br />
Data from this study will be used to determine the overall health of the river system, determine<br />
the current stocking needs in the upper section of the river, and allow the NPS to take an active<br />
role, which has not existed before, in fishery management of the Chattahoochee River. The new<br />
data will provide baseline information, which will be used for management decisions and for<br />
follow-up surveys. Intensive sampling of both the fishery and the angling public will provide the<br />
necessary information for the management of this fishery.<br />
198
APPENDIX B. SOME OF THE WATER RESOURCE EXPERTISE<br />
AROUND THE CRNRA<br />
Legend: (NAME IN CAPS) = a person visited by authors of this report. Name underlined =<br />
person contacted by authors via telephone or correspondence.<br />
ORGANIZATION NAMES AND CONTACTS<br />
Adopt-A-Stream (for Georgia)<br />
Environmental Protection Division<br />
<strong>Water</strong> Protection Branch<br />
4220 International <strong>Park</strong>way – Suite 101<br />
Atlanta, GA 30354<br />
Alpharetta, Town of<br />
Environmental Education Center<br />
131 Roswell St Suite A-1<br />
Alpharetta, GA 30201<br />
Atlanta Regional Commission<br />
200 Northcreek, Suite 300<br />
3715 Northside <strong>Park</strong>way; Atlanta, GA 30327-<br />
2809<br />
Center for Spatial Analysis Technologies (CSAT)<br />
(cooperative program of USGS, Ga Tech, & Ga<br />
Dept of Nat Res)<br />
Ga Tech Electro-Optics Lab; 236 Baker Bldg,<br />
Atlanta, GA 30332-0841<br />
CH2MHill<br />
115 Perimeter Center Place NE;<br />
Suite 700; Atlanta, GA 30346-1278<br />
Cobb County<br />
660 South Cobb Drive<br />
Marietta, GA 30060-3113<br />
Environmental Protection Agency (EPA)<br />
(downtown)<br />
100 Alabama Street NW<br />
Atlanta, GA 30303<br />
MICHELE DROSZCZ , Georgia Adopt-a-Stream, EPD (404)<br />
675-1636<br />
PETEY GIROUX, Program Coordinator, Non-Point Source<br />
Education, EPD<br />
Eve Funderburke, (404) 675-1636<br />
Dee West, (770) 442 9057; (770) 410-5760; fax (770) 751-7868<br />
(watershed protection training courses; erosion control training;<br />
environmental education; monitoring in the area)<br />
MS PAT STEVENS, 404 364 2580<br />
[fax: (404) 364-2599]<br />
JIM SANTAOS, 404 364 2583<br />
BEVERLY RHEA, (404) 364-2562<br />
Steve Kendall, Principal Environmental <strong>Plan</strong>ner (404) 364-2582<br />
Jim Bohn, (404) 364-2612, Principal Programmer Analyst<br />
THOMAS R. (BOB) DYAR, Chief CSAT (USGS)<br />
894-0123S<br />
JACK ALHADEFF, Associate Chief<br />
NICK FAUST, (404) 894-0021 nick.faust@gtri.gatech.edu<br />
Jonathan W. Musser, Hydrologist. (405) 894-0125<br />
Georgia GIS Data Clearinghouse affiliated as well<br />
\csat.gatech.edu<br />
TOM SIMPSON, (770) 604-9182 x509 tsimpson@ch2m.com<br />
DOUG BAUGHMAN, Environmental Scientist, (770) 604-9182<br />
x510, Dbaughma@ch2m.com<br />
fax (770) 604-9183<br />
BOB BRICE, Director <strong>Water</strong> Systems, (770) 419-6225<br />
BILL HIGGINS (watersheds & floods), (770) 419-6435<br />
FRANK W. BOCKMAN, Operations Mgr<br />
WILLIAM J. HIGGINS, Div Mgr, Stormwater Mgt Div<br />
DAVID C. PHILLIPS, Tech Support (GIS; maps)<br />
Robert Bourne, <strong>Water</strong> Quality (770) 528-1480; J.J. Chastain,<br />
<strong>Water</strong> Dept (770) 419 6317 fax (770) 419-6335<br />
HOWARD MARSHALL, (404) 562-9392<br />
STEVE BLACKBURN, Non-Point Source Program, 562-9397<br />
LLOYD WISE, Coordinator, Gulf of Mexico Program<br />
NANCY BETHUNE, EPA-FS sediment, , (404) 562-9379<br />
GARY DAVIS, Geographic <strong>Plan</strong>ning and Support Branch<br />
BRUCE HENRY, (water quality, pollution)<br />
TOM WELBORN, Chief, Wetlands, Coastal & WQ Grants<br />
Branch, 404-562-9379<br />
BILL COX, Chief Wetlands Section<br />
(404) 562-9351 fax (404) 562-9343<br />
COX.WILLIAML@EPAMAIL.EPA.GOV Lee Pelej,<br />
Botanist (404) 562-9396<br />
199
JOHN NEMETH, Reference Librarian, (404) 562-8190<br />
SHERYL EXLEY, Reference Librarian, (404) 562-8883<br />
Federal Emergency <strong>Management</strong> Agency Porter Martin (770) 220-5410 (floodplains)<br />
Federal Interagency Task Force for<br />
Federal Interagency <strong>Management</strong> <strong>Plan</strong> for<br />
the Evaluation and Implementation of<br />
ACT/ACF <strong>Water</strong> Allocation Formulas<br />
U.S. Army Engineer District, Mobile<br />
P.O. Box 2288<br />
Mobile, AL 36628-0001<br />
Forest <strong>Service</strong> (USDA)<br />
Regional Office<br />
Atlanta<br />
Forest <strong>Service</strong>, 1720 Peachtree Rd NW, Suite<br />
846N, Atlanta, GA 30367<br />
Forsyth County<br />
110 East Main Street, Suite 120<br />
Cumming, GA 30130<br />
Fulton County<br />
141 Pryor St SW, Suite 5001<br />
Atlanta, GA 30303<br />
Georgia Game , Dept of Natural <strong>Resources</strong>,<br />
Wildlife <strong>Resources</strong> Branch, Fisheries Section<br />
3123 Sheppard Rd<br />
Mansfield, GA 30055<br />
Contact on Chattahoochee Basin part of ACT/ACF:<br />
Joanne Brandt (see U.S. Army Corps of Engineers)<br />
Dave Meriwether, (404) 347-4663<br />
Bruce Bayle, (404) 347-3872<br />
re: Chris Frey (GIS person in the RO)<br />
Holcomb, Jack, Project Hydrologist, (404) 347-5058<br />
[fax: (404) 347-4448]<br />
JOHN CUNARD, County Engineer, (770) 781-2104 ,<br />
fax 770 781-2104<br />
Barry Loukas (770) 781-2104, fax 770 781-2104<br />
BETSY BERNS-STARK, Senior <strong>Plan</strong>ner, Environmental<br />
<strong>Plan</strong>ning, (404) 730-8050<br />
fax (404) 730-8112<br />
Sharon Cowden, Adopt-a-Stream/Fulton Cty<br />
(404) 730-8006<br />
BIAGI, JOHN, Fisheries Biologist, Mansfield, GA (770)<br />
784-3126<br />
LISA BOHM CLINE<br />
lbohm@mail.morgan.public.lib.ga.us<br />
(770) 918-6418, (monitoring, creel survey)<br />
DON JOHNSON (770) 918 6418<br />
200
Georgia EPD <strong>Water</strong> Protection Branch<br />
4220 International <strong>Park</strong>way – Suite 101<br />
Atlanta, GA 30354<br />
ALAN HALLUM, Branch Chief EPD, <strong>Water</strong> Protection<br />
Branch (404) 675-6232<br />
KEVIN FARRELL, Unit Coordinator & Environmental<br />
Engineer, (404) 675-6233<br />
ROY BURKE III, (404) 675-6233<br />
LAWRENCE W. (LARRY) HEDGES, Program Mgr<br />
(NonPoint Source Program) (404) 675-6240<br />
Ted Mikalsen, Environmental Project Administrator,<br />
NonPoint Source Program, (404)675-6240<br />
Permits/Compliance: (404) 362-2680<br />
<strong>Water</strong>shed <strong>Plan</strong>ning/Monitoring: (404) 675-6236<br />
Georgia DNR fisheries, Athens Russ England, DNR russ_england@mail.dnr.state.ga.us<br />
(in-stream flows)<br />
Georgia Fish Hatchery Buford BILL COUCH, (770) 781 6888<br />
Georgia Tech, Library<br />
Ga Tech Library; Ga Institute of Technology;<br />
Library and Info Center; Atlanta, GA<br />
30332-0900<br />
GEORGIA, University of<br />
Institute of Ecology<br />
Ecology Bldg; University of Ga; Athens,<br />
GA; 30602-2204<br />
Georgia, University of<br />
Office of Technology Outreach <strong>Service</strong>s<br />
1180 E. Broad St.<br />
Athens, GA 30602-5418<br />
Groszmann, Glynn F<br />
Groszman Environmental and Engineering<br />
<strong>Service</strong>s<br />
160 Thompson Place<br />
Roswell, GA 30075-3506<br />
Gwinnett County<br />
75 Langley Dr (New Courthouse);<br />
Lawrenceville, GA 30245-6900<br />
Law Engineering & Environmental <strong>Service</strong>s,<br />
Inc<br />
PAT JOHNSON, Bette Finn, (404) 894-1790<br />
bette.finn@library.gatech.edu, Librarian<br />
HEATHER JEFFCOAT (GIS and library) (404) 894-<br />
1102 fax (404) 894-6084<br />
Kathryn (Kathy) Hatcher (706) 542-3709 ; (706) 542-<br />
1555 (editor, Chattahoochee conferences)<br />
Institute of Ecology<br />
khatcher@ecology.uga.edu<br />
Byron (Bud) Freeman, (706) 542-2968<br />
STEVE R. DAVIS, OTOS<br />
Kasey Hartley (706) 542-5308 fax (706) 542-6535<br />
(OTOS also provides contact with the Georgia GIS<br />
Clearinghouse for access to GIS data)<br />
Steve@itos.uga.edu<br />
Groszmann, Glynn F. (770) 642-8947<br />
WAYNE WOODALL, Development Inspection,<br />
770 822-7641 Fax (770) 822-7513<br />
STEVE CANNON Dept. Public Utilities 822-7175<br />
MICHAEL O’SHIELD, Adopt-A-Stream Coordinator<br />
Janet Vick, Principal Engineer, Dept of Trans. (770) 822<br />
7400<br />
Connie Wiggins, “Gwinnett Clean & Beautiful” 822-<br />
5187<br />
Jeff West, (plan review), 822 7500<br />
David Chastant, Dept of Trans., 822 7428<br />
JAMES R WALLACE, Senior VP, Div of Eng. &<br />
Science jwallace@lawco.com, (770) 499-6878,<br />
201
114 Town<strong>Park</strong> Drive, Suite 250<br />
Kennesaw, GA 30144<br />
Natural <strong>Resources</strong> Conservation <strong>Service</strong><br />
(NRCS/USDA)<br />
USDA-NRCS 355 East Hancock Avenue,<br />
Athens, GA 30601<br />
<strong>National</strong> <strong>Park</strong> <strong>Service</strong><br />
Chattahoochee River <strong>National</strong> Recreation<br />
Area (CRNRA), 1978 Island Ford Pkwy,<br />
Dunwoody, GA 30350<br />
<strong>National</strong> <strong>Park</strong> <strong>Service</strong>, SE Regional Office<br />
(SERO)<br />
100 Alabama St SW<br />
Atlanta, GA 30303<br />
<strong>National</strong> <strong>Park</strong> <strong>Service</strong>, <strong>Water</strong> <strong>Resources</strong><br />
Division<br />
1201 Oak Ridge Drive, Suite 250<br />
Fort Collins, CO 80225-0287<br />
<strong>National</strong> <strong>Park</strong> <strong>Service</strong>, <strong>Water</strong> <strong>Resources</strong><br />
Division<br />
P.O. Box 25287<br />
Denver, CO 80225-0287<br />
770 499-6800, fax 770 421 3580<br />
ROBERT R KELLY, Acct. Mgr., (770) 421-7045<br />
LARRY A NEAL, Princ. Envir. Eng., VP, 499-<br />
6791,lneal@lawco.com<br />
ELIZABETH A BOOTH, Senior Envir. Eng. (770) 421-<br />
3334, fax 421-3454 ebooth@lawatl.mhs.compuserve.com<br />
(GIS)<br />
MELVIN S BROWN, Regional Mgr.<br />
Anwer R Ahmed, Senior <strong>Water</strong> Res. Eng. (770) 421-<br />
3527, aahmed@lawco.com<br />
Jimmy Bramblett, Athens, (GIS/mapping, wq), (706)<br />
546-2116 ; fax 706 546-=2145;<br />
jimmy@nrcsga.nrcs.usda.gov<br />
Steven Lawrence, Soil Scientist, Athens.<br />
Steve Leslie , District Conservationist, Gwinnett-Dekalb<br />
Counties, 770 963 9288, fax 770 963-3324;<br />
BRIAN WENBERG , Engineer, USDAnNRCS; 240 Oak<br />
St; Room 102; Lawrenceville, GA. 30245-4828<br />
CINDY HAYGOOD (1998) District Conservationist,<br />
Cobb-Fulton Counties 770 528 2218 NRCS; 1151<br />
Whitlock Ave; Marietta, GA; 30064<br />
BUDDY BELFLOWER, District Conservationist,<br />
Forsyth Cty, 770 536-6981; fax 770 534-9684. Upper<br />
Chat. Soil & <strong>Water</strong> Conservation District; 734 East<br />
Cresent Dr., Suite 400, Gainesville, GA 30501<br />
Telephone: (770) 399-8074<br />
TED WATERS, Nat. Res. Specialist X 230<br />
SUZANNE LEWIS, Superintendent X 222<br />
CONNIE JOHNSON, Secretary X 221<br />
BILL CARROLL, Asst Superintendent X 223<br />
Adrienne Funk, Natural Resource Assistant X 240<br />
HANK SNYDER (404) 562-3113<br />
DAVE SPENCER (404) 562-3113 (contracts on<br />
recreational waters; water person for SERO )<br />
RICHARD SUSSMAN <strong>Plan</strong>ner<br />
SARAH ZIMNY<br />
Kelly Watson, Data Mgt (404) 562-3113<br />
BILL JACKSON, (970) 225-3503<br />
DAN MCGLOTHLIN, (970) 225 3536, (water rights)<br />
ROY IRWIN, 225-3520, (toxicity)<br />
BARRY LONG, 225-3519, (NAWQA information)<br />
DAVE VANA-MILLER, (303) 969-2813<br />
MARK FLORA (303) 969-2956<br />
202
<strong>National</strong> <strong>Park</strong> <strong>Service</strong>, Washington, D.C. RICK DAWSON, (in Atlanta), (404) 331-2629 (national<br />
role hazardous materials)<br />
TRISH CORTELYOU-HAMILTON (Office of the<br />
Solicitor, coordinating with Dawson)<br />
RIVERKEEPER<br />
Upper Chattahoochee Riverkeeper, P.O. Box<br />
7338, Atlanta, GA 30357-0338<br />
Charles Karpowicz (NPS dam safety), (202) 548-5828<br />
SALLY BETHEA, Executive Director<br />
tel: (404) 352-9828 fax: (404) 352-8676<br />
ALICE CHAMPAGNE, Environmental Education<br />
Coordinator<br />
DANA POOLE (monitoring activities & Adopt-a-<br />
Stream)<br />
Katherine Baer (770 )538-2819, Gainesville<br />
Southern Appalachia Assessment Tom Hatley Southern Appalachia Assessment database<br />
E-mail: tomr@safc.org (also in coordination with US<br />
Forest <strong>Service</strong> on GIS projects)<br />
Sotir, Robin & Associates<br />
434 Villa Rica Rd.<br />
Marietta, GA 30064-2732<br />
Robin Sotir 770 424 0719 fax 770 499-8771<br />
sotir@mindspring.com<br />
(local company, active with counties; internationally<br />
known for biologically-based erosion control works and<br />
streambank restoration)<br />
Trust for Public Lands Rand Wentworth (404) 873 7306 (land purchases for<br />
within the present CRNRA boundary)<br />
Kevin Johnson, Program Mgr (404) 873 7306 X 227<br />
U.S. CORPS OF ENGINEERS<br />
P.O. Box 567<br />
Buford, GA 30518-0567<br />
U.S. CORPS OF ENGINEERS, Mobile<br />
(see also Federal Task Force)<br />
U.S. Army Corps of Engineers<br />
P.O. Box 2288<br />
Mobile, Alabama 36628-0001<br />
U.S. Fish and Wildlife <strong>Service</strong><br />
Panama City, FL<br />
U.S. Geological Survey, Regional Office<br />
U.S. Geological Survey<br />
3850 Holcomb Bridge Road Suite 160<br />
Norcross, GA 30092<br />
U.S. Geological Survey, District Office<br />
Peachtree Business Center<br />
3039 Amwiler Rd, Suite 130<br />
PAT TAYLOR, Assistant Director, (770) 945-9531<br />
DARYL STONE, planner<br />
JIM SHINNAL, Environmental compliance coordinator,<br />
(770) 382-4700<br />
MARK WILLIAMS, Ranger, 404 763 7945<br />
Erwin Topper, Director, (770) 945 9531<br />
Joanne Brandt, Coordinator, ACF Basins' EIS, '98-99, for<br />
the Corps (334) 694-3882; (334) 690-3260<br />
Kim Caldwell, Economist, (334) 694-3842 (recreation<br />
report Buford to Peachtree Cr)<br />
Cheryl Martin, Librarian, (334) 690-3181<br />
Carmody, Gail, FWS coordinating person on tri-state<br />
compact, Gail_Carmody@fws.gov,.<br />
CAROL A. COUCH, Regional Biologist, <strong>Water</strong> Res.<br />
Div, Reg. Office, 770 409-7709, fax 770 409-7725<br />
WADE BRYANT, Biological Research Division<br />
JEFF ARMBRUSTER, Asst Regional Hydrologist<br />
NORMAN (JAKE) PETERS, Research Hydrologist<br />
DAVE WANGSNESS, (770) 903-9156<br />
Wangnes@usgs.gov<br />
DAN HIPPE, djhippe@usgs.gov, (770) 903 9162<br />
CARYL WHIPPERFURTH, (Graphics), 770 903-9178<br />
203
Atlanta GA 30360-2884 Carolyn Casteel, Editor<br />
ELIZABETH (BETSY) FRICK , (770) 903-9166 X 158<br />
HOWARD PERLMAN, Hydrologist<br />
Brian Gregory, Ecologist (770) 903-9163<br />
204
391-3-6-.03 <strong>Water</strong> Use Classifications and <strong>Water</strong> Quality Standards? Amended.<br />
(1) Purpose. The establishment of water quabty standards.<br />
(2) <strong>Water</strong> Quality Enhancement:<br />
(a) The purposes and intent of the State in establishing <strong>Water</strong> Quality Standards are to provide enhancement of water quality and prevention of<br />
pollution; to protect the public health or welfare in accordance with the public interest for drinking water supplies, conservation of fish,<br />
wildlife and other beneficial aquatic life, and agricultural, industrial, recreational, and other reasonable and necessary uses and to maintain<br />
and improve the biological integrity of the waters of the State.<br />
(b) Those waters in the State whose existing quality is better than the minimum levels established in standards on the date standards become<br />
effetive will be maintained at high quality; with the State having the power to authorize new developments, when it has been affirmatively<br />
demonstrated to the State that a change is justifiable to provide necessary social or economic development; and provided further that the<br />
level of treatment required is the highest and best practicable under existing technology to protect existing beneficsal water uses. Existing<br />
instream water uses and the level of water quality necessary to protect the existing uses shall be maintained and protected. All requirements<br />
in the Federal Regulations, 40 C.F.R. 131.12, will be achieved before lowering of water quality is allowed for high quality water.<br />
205
<strong>Water</strong> Quality Control Chapter 391.3-6<br />
(c) Outstanding <strong>National</strong> Resource <strong>Water</strong>s (ONRVV). This designation will be considered for an outstanding national resource waters, such as<br />
waters of <strong>National</strong> or State parks and wildlife refuges and waters of exceptional recreational or ecological significance. For waters<br />
designated as ONRW, existing water quality shall be maintained and protected.<br />
(I) No new point source discharges or increases in the discharge of pollutants above permitted level from existing point source discharges to<br />
ONRW shall be allowed.<br />
(ii) Existing point source discharges to ONRW shall be allowed, provided they are treated or controlled in accordance with applicable laws and<br />
regulations.<br />
(iii) New point source discharges or expansions of existing point source discharges to waters upstream of, or tributary to, ONRW shall be<br />
regulated in accordance with applicable laws and regulations, including compliance with water quality criteria for the use classification<br />
applicable to the particular water. However, no new point source discharge or expansion of an existing point source discharge to waters<br />
upstream of, or tributary to, ONRW shall be allowed if such discharge would not maintain and protect water quality within the ONRW.<br />
(d) In applying these policies and requirements, the State of Georgia will recognize and protect the interest of the Federal Govemment in<br />
interstate and intrastate (including coastal and estuarine) waters. Toward this end the State will consult and cooperate with the<br />
Environmental Protection Agency on all matters affecting the Federal interest.<br />
•Applicable to Intrastate and Interstate <strong>Water</strong>s of Georgia.<br />
(3) Definitions. All terms used in this paragraph shall be interpreted in accordance with definitions as set forth in the Act and as otherwise<br />
herein defined:<br />
(a) “Biological integrity” is functionally defined as the condition of the aquatic community inhabiting least impaired waterbodies of a specified<br />
habitat measured by community structure and function.<br />
(b) “Coastal waters” are those littoral recreational waters on the ocean side of the Georgia coast<br />
(c) “Existing instream water uses” include water uses actually attained in the waterbody on or after November 28, 1975.<br />
(d) “Intake temperature” is the natural or background temperature of a particular waterbody unaffected by any man-made discharge or thermal<br />
input<br />
(e) “Reasonable and necessary uses” means drinking water supplies, conservation, protection, and propagation of fish, shellfish, wildlife and<br />
other beneficial aquatic life, agricultural, industrial, recreational, and other legitimate uses.<br />
(f) “Secondary contact recreation” ~ ~incidental contact with the water, wading, and occasional swimming.<br />
(g) “Shellfish” refers to clams, oysters, scallops, mussels, and other bivalve mollusks.<br />
(h) “<strong>Water</strong>” or”waters of the State” means any and all rivers, streams, creeks, branches, lakes, reservoirs, ponds, drainage systems, springs,<br />
wells, wetlands, and all other bodies of surface or subsurface water, natural or artificial, lying within or forming a part of the boundaries of<br />
the State which are not entirely confined and retained completely upon the property of a single individual, partnership, or corporation.<br />
(4) <strong>Water</strong> Use Classifications. <strong>Water</strong> use classifications for which the criteria of this Paragraph are applicable are as follows:<br />
(a) Drinking <strong>Water</strong> Supplies<br />
(b) Recreation<br />
(c) Fishing, Propagation of Fish, Shellfish, Game and Other Aquatic Life<br />
(d) Wild River<br />
(e) Scenic River<br />
(f) Coastal Fishing<br />
(5) General Criteria for All <strong>Water</strong>s. The following criteria are deemed to be necessary and applicable to all waters of the State:<br />
(a) All waters shall be free from materials associated with municipal or domestic sewage, industrial waste or any other waste which will settle to<br />
form sludge deposits that become putrescent unsightly or otherwise objectionable.<br />
(b) All waters shall be free from oil, scum and floating debris associated with municipal or domestic sewage, industrial waste or other discharges<br />
in amounts sufficient to be unsightly orto interfere with legitimate water uses.<br />
(c) All waters shall be free from material related to municipal, industrial or other discharges which produce turbidity, color, odor or other<br />
objectionable conditions which interfere with legitimate water uses.<br />
(d) Turbidity. The following standard is in addition to the narrative turbidity standard in Paragraph 391-3-6-.03(5)(c) above:<br />
All waters shall be free from turbidity which results in a substantial visual contrast in a water body due to a man-made activity. The upstream<br />
appearance of a body of water shall be as observed at a point immediately upstream of a turbidity-causing man-made activity. That upstream<br />
appearance shall be compared to a point which is located sufficiently downstream from the activity so as to provide an appropriate mixing zone.<br />
For land disturbing activities, proper design, installation, and maintenance of best management practices and compliance with issued permits shall<br />
constitute compliance with Paragraph 391-3-6-.03(5)(d).<br />
(e) Afl waters shall be free from toxic, corrosive, acidic and caustic substances discharged from municipalities, industries or other sources, such<br />
as nonpoint sources, in amounts, concentrations or combinations which are harmful to humans, animals or aquatic life.<br />
206
<strong>Water</strong> Quality Control Chapter 391-3-6<br />
(i) Instream concentrations of the following chemical constituents which are considered to be other toxic pollutants of concem in the State of<br />
Georgia shall not exceed the criteria indicated below under 7-day, 10-year minimum flow (7Q10) or higher stream flow conditions except<br />
within established mixing zones:<br />
‘I. 2,4-Dichlorophenoxyacetic acid (2,4-D) 70 pg/I<br />
2. Methoxychlor 0.03 pg/I t<br />
3. 2,4,5-Trichlorophenoxy propionic acid (1? Silvex) 50 pg/I<br />
(ii) Instream concentrations of the following chemical constituents listed by the U.S. Environmental Protection Agency as toxic priority<br />
pollutants pursuant to Section 307(a)(1) of the Federal Clean <strong>Water</strong> Act (as amended) shall not exceed criteria indicated below under 7-day,<br />
10-year minimum flow (7Q10) or higher stream flow conditions except within established mixing zones or in accordance with site specific<br />
effluent limitations developed in accordance with procedures presented in 391-3-6-.06.<br />
1. Arsenic<br />
(a) Freshwater 50 pg/l<br />
(b) Coastal and Marine Estuarine <strong>Water</strong>s 36 pg/I<br />
2. Cadmium<br />
(a) Freshwater<br />
(at hardness levels less than 100 mg/I) 0.7 pg/I”<br />
(at hardness levels of 100 mg/I to 199 mg/I) 1.1 pg/I t<br />
(at hardness levels greater than or equal to 200 mg/I) 2.0 pg/I”<br />
Note: Total hardness expressed as CaCO3.<br />
(b) Coastal and Marine <strong>Water</strong>s 9.3 pg/I<br />
3. Chlordane<br />
(a) Freshwater 0.0043 pg/I”<br />
(b) Coastal and Marine Estuarine <strong>Water</strong>s 0.004 pg/I”<br />
4. Chromium (VI)<br />
(a) Freshwater 11 pg/I<br />
(b) Coastal and Marine Estuarine <strong>Water</strong>s 50 pg/I<br />
5. Total Chromium<br />
(at hardness levels less than 100 mg/i) 120 pg/I<br />
(at hardness levels of 100 mg/I to 199 mg/I) 210 pg/I<br />
(at hardness levels greater than or equal to 200 mg/I) 370 pg/I<br />
Note: Total hardness expressed as CaCO3.<br />
6. Copper<br />
(a) Freshwater<br />
(at hardness levels less than 100 mg/I) 6.5 pg/I<br />
(at hardness levels of 100 mg/I to 199 mg/I) 12 pg/I<br />
(at hardness levels greater than or equal to 200 mg/I) 21 pg/I<br />
Note: Total hardness expressed as CaCO3<br />
(b) Coastal and Marine Estuarine <strong>Water</strong>s 2.9 pg/I”<br />
7. Cyanide<br />
(a) Freshwater 5.2 pg/I”<br />
(b) Coastal and Marine Estuarine <strong>Water</strong>s 1.0 pg/I”<br />
8. Dieldrin 0.0019 pg/I”<br />
9. 44’-DDT 0.001 pg/I”<br />
10. a-Endosulfan<br />
(a) Freshwater 0.056 pg/I”<br />
(b) Coastal and Marine Estuarine <strong>Water</strong>s 0.0087 pg/I”<br />
11. b-Endosulfan<br />
(a) Freshwater 0.056 pg/I”<br />
(b) Coastal and Marine Estuarine <strong>Water</strong>s 0.0067 pg/I”<br />
12. Endrin 0.002 pg/I”<br />
13. Heptachlor<br />
(a) Freshwater 0.0038 pg/I”<br />
(b) Coastal and Marine Estuarine <strong>Water</strong>s 0.0036 pg/I”<br />
14. Heptachlor Epoxide<br />
(a) Freshwater 0.0038 pg/I”<br />
(b) Coastal and Marine Estuarine <strong>Water</strong>s 0.0036 pg/I”<br />
15. Lead<br />
(a) Freshwater<br />
(at hardness levels less than 100 mg/I) 1.3 pg/I”<br />
(at hardness levels of 100 mg/I to 199 mg/I) 3.2 pg/I”<br />
(at hardness levels greater than or equal to 200 mg/I) 7.7 pg/I”<br />
Note: Total hardness expressed as CaCO3<br />
(b) Coastal and Marine Estuarine <strong>Water</strong>s 5.6 pg/I”<br />
16. Lindane (Hexachlorocyclohexane (g-BHC-Gammafl 0.08 pg/I<br />
17. Mercury<br />
(a) Freshwater 0.012 pg/I”<br />
(b) Coastal and Marine Estuarine <strong>Water</strong>s 0.025 pg/I”<br />
18. Nickel<br />
(a) Freshwater<br />
(at hardness levels less than 100 mg/I) 88 pg/I<br />
(at hardness levels of 100 mg/I to 199 mg/I) 160 pg/I<br />
(at hardness levels greater than or equal to 200 mg/) 280 pg/I<br />
Note: Total hardness expressed as CaCO3<br />
(b) Coastal and Marine Estuarine <strong>Water</strong>s 8.3 pg/I<br />
207
<strong>Water</strong> Quality Control Chapter 391-3-6<br />
19. Pentachlorophenol<br />
(a) Freshwater 2.1 pg/I”<br />
(b) Coastal and Marine Estuarine <strong>Water</strong>s 7.9 pg/I”<br />
20. PCB-1016 0.014 pg/I<br />
21. PCB-1221 0.014 pg/I<br />
22. PCB-1 232 0.014 pg/I<br />
23. PCB-1242 0.014 pg/I<br />
24. PCB-1248 0.014 pg/I<br />
25. PCB-1 254 0.014 pg/I<br />
26. PCB-1 260 0.014 pg/I<br />
27. Phenol 300 pg/I<br />
28. Selenium<br />
(a) Freshwater 5.0 pg/I<br />
(b) Coastal and Marine Estuarine <strong>Water</strong>s 71 pg/I<br />
29. Silver<br />
30. Toxaphene 0.0002 pg/I”<br />
31. Zinc<br />
(a) Freshwater<br />
(at hardness levels less than 100 mg/I) 60 pg/I<br />
(at hardness levels of 100 mg/I to 199 mg/I) 110 pg/I<br />
(at hardness levels greater than or equal to 200 mg/I) 190 pg/I<br />
Note: Total hardness expressed as CaCO3.<br />
(b) Coastal and Marine Estuarine <strong>Water</strong>s 86 pg/I<br />
“The in-stream criterion is lower than the EPD laboratory detection limits. ““This pollutant is addressed in 391-3-6-.06.<br />
(iii) Instream concentrations of the following chemical constituents listed by the U. S. Environmental Protection Agency as toxic priority<br />
pollutants pursuant to Section 307(a)(1) of the Federal Clean <strong>Water</strong> Act (as amended) shall not exceed criteria indicated below under<br />
annual average or higher stream flow conditions:<br />
1. Acenaphthene<br />
2. Acenaphthylene<br />
3. Acrolein 780 pg/I<br />
4. Acrylonitrile 0.665 pg/I<br />
5. Aldrin 0.000136 pg/I<br />
6. Anthracene 110000 pg/I<br />
7. Antimony 4308 pg/I<br />
8. Arsenic 50 pg/I<br />
9. Benzidine 0.000535 pg/I<br />
10. Benzo(a)Anthracene 0.0311 pg/I<br />
11. Benzo(a)Pyrene 0.0311 pg/I<br />
12. 3.4-Benzofluoranthene 0.0311 pg/I<br />
13. Benzene 71.28 pg/I<br />
14. Benzo(ghi)Perylene<br />
15. Benzo(k)Fluoranthene 0.0311 pg/I<br />
16. Beryllium<br />
17. a-BHC-Alpha 0.0131 pg/I<br />
18. b-BHC-Beta 0.046 pg/I<br />
19. Bis(2-Chloroethyl)Ether 1.42 pg/I<br />
20. Bis(2-Chloroisopropyl)Ether 170000 pg/I<br />
21. Bis(2-Ethylhexyl)Phthalate 5.92 pg/I<br />
22. Bromoform (Tribromomethane) 360 pg/I<br />
23. Carbon Tetrachloride 4.42 pg/I<br />
24. Chlorobenzene 21000 pg/I<br />
25. Chlorodibromomethane 34 pg/I<br />
26. 2-Chloroethylvinyl Ether<br />
27. Chlordane 0.000588 pg/I<br />
28. Chloroform (Trichloromethane) 470.8 pg/I<br />
29. 2-Chlorophenol<br />
30. Chrysene 0.0311 pg/I<br />
31. Dibenzo(a,h)Anthracene 0.O3llpg/I<br />
32. Dichlorobromomethane 22 pg/I<br />
33. 1 ,2-Dichloroethane 98.6 pg/I<br />
34. 1,1-Dichloroethylene 3.2 pg/I<br />
35. 1 ,3-Dichloropropylene (Cis) 1700 pg/I<br />
36. 1 ,3-Dichloropropylene (Trans) 1700 pg/I<br />
37. 2,4-Dichlorophenol 790 pg/I<br />
38. 1 ,2-Dichlorobenzene 17000 pg/I<br />
39. 1 ,3-Dichlorobenzene 2600 pg/I<br />
40. 1 ,4-Dichlorobenzene 2600 pg/I<br />
41. 3,3’-Dichlorobenzidine 0.0Th pg/I<br />
42. 4,4’-DDT 0.00059 pg/I<br />
43. 4,4’-DDD 0.00084 pg/I<br />
208
<strong>Water</strong> Quality Control Chapter 391-3-6<br />
44. 4,4’-DDE 0.00059 pg/I<br />
45. Dieldrin 0.000144 pg/I<br />
46. Diethyl Phthalate 120000 pg/I<br />
47. Dimethyl Phthalate 2900000 pg/I<br />
48. 2,4-Dimethylphenol<br />
49. 2.4-Dinitrophenol 14264 pg/I<br />
50. Di-n-Butyl Phthalate 12100 pg/I<br />
51. 2,4-Dinitrotoluene 9.1 pg/I<br />
52. 1 ,2-Diohenylhydrazine 0.54 pg/I<br />
53. Endrin Aldehyde 0.81 pg/I<br />
54. Endosulfan Sulfate 2.0 pg/I<br />
55. Ethylbenzene 28718 pg/I<br />
56. Fluoranthene 370 pg/I<br />
57. Fluorene 14000 pg/I<br />
58. Heptachlor 0.000214 pg/I<br />
59. Heptachlor Epoxide 0.00011 pg/I<br />
60. Hexachlorobenzene 0.00077 pg/I<br />
61. Hexachlorobutadiene 49.7 pg/I<br />
62. Hexachlorocyclopentadiene 17000 pg/I<br />
63. Hexachloroethane 8.85 pg/I<br />
64. Indeno(1 ,2,3-cd)Pyrene .0311 pg/I<br />
65. lsophorone 600 pg/I<br />
66. Lindane (Hexachlorocyclohexane (g-BHC-Gamma)] 0.0625 pg/I<br />
67. Methyl Bromide (Bromomethane) 4000 pg/I<br />
68. Methyl Chloride (Chloromethane)<br />
69. Methylene Chloride 1600 pg/I<br />
70. 2-Methyl-4,6-Dinitrophenol 765 pg/I<br />
71. 3-Methyl-4-Chlorophenol<br />
72. Nitrobenzene 1900 pg/I<br />
73. N-Nitrosodimethylamine 8.12 pg/I<br />
74. N-Nitrosodi-n-Propylamine<br />
75. N-Nitrosodiphenylamine 16.2 pg/I<br />
76. PCB-1016 0.00045 pg/I<br />
77. PCB-1 221 0.00045 pg/I<br />
78. PCB-1232 0.00045 pg/I<br />
79. PCB-1242 0.00045 pg/I<br />
80. PCB-1 248 0.00045 pg/I<br />
81. PCB-1254 0.00045 pg/I<br />
82. PCB-1260 0.00045 pg/I<br />
83. Phenanthrene<br />
84. Phenol 4,600,000 pg/I<br />
85. Pyrene 11,000 pg/I<br />
86. 1 ,1,2,2-Tetrachloroethane 10.8 pg/I<br />
87. Tetrachloroethylene 8.85 pg/I<br />
88. Thallium 6.3 pg/I<br />
89. Toluene 200000 pg/I<br />
90. 1 ,2-Trans-Dichloroethylene<br />
91. 1,1 .2-Trichloroethane 41.99 pg/I<br />
92. Trichloroethylene 80.7 pg/I<br />
93. 2,4,6-Trichlorophenol 6.5 pg/I<br />
94. 1 ,2,4-Trichlorobenzene<br />
95. Vinyl Chloride 525 pg/I<br />
These pollutants are addressed in 391-3-6-06.<br />
(iv) Site specific criteria for the following chemical constituents will be developed on an as-needed basis through toxic poflutant monitoring efforts at<br />
new or existing discharges that are suspected to be a source of the pollutant at levels sufficient to interfere with designated uses:<br />
1. Asbestos<br />
(v) Instream concentrations of 2,3,7,8-tetrachlorodibenzo-p-dioxin (TCDD) must not exceed 0.0000012 pg/I under long-term average<br />
stream flow conditions.<br />
(f) AppUcable State and Federal requirements and regulations for the discharge of radioactive substances shall be met at all times.<br />
(g) The dissolved oxygen criteria as specified in individual water use classifications shall be applicable at a depth of one meter below the water<br />
surface; in those instances where depth is less than two meters, the dissolved oxygen criterion shall be applied at a mid-depth. On a case<br />
specific basis, altemative depths may be specified.<br />
(6) Specific Criteria for Classified <strong>Water</strong> Usage. In addition to the general criteria, the following criteria are deemed necessary and shall be<br />
required for the specific water usage as shown:<br />
209
<strong>Water</strong> Quality Control Chapter 391 -3-6<br />
(a) Drinking <strong>Water</strong> Supplies: Those waters approved as a source for public drinking water systems permitted or to be permitted by the<br />
Environmental Protection Division. <strong>Water</strong>s classified for drinking water supplies will also support the fishing use and any other use<br />
requiring water of a lower quality.<br />
(I) Bacteria: For the months of May through October, when water contact recreation activities are expected to occur, fecal coliform<br />
not to exceed a geometric mean of 200 per 100 ml based on at least four samples collected from a given sampling site over a 30day<br />
penod at intervals not less than 24 hours. Should water quality and sanitary studies show fecal coliform levels from non-human<br />
sources exceed 200/100 ml (geometric mean) occasionally, then the allowable geometric mean fecal coliform shall not exceed 300<br />
per 100 ml in lakes and reservoirs and 500 per 100 ml in free flowing freshwater streams. For the months of November through<br />
April, fecal coliform not to exceed a geometric mean of 1,000 per 100 ml based on at least four samples collected from a given<br />
sampling site over a 30-day period at intervals not less than 24 hours and not to exceed a maximum of 4,000 per 100 ml for any<br />
sample. The State does not encourage swinTning in surface waters since a number of factors which are beyond the control of any<br />
State regulatory agency contribute to elevated levels of fecal coliform.<br />
(ii) Dissolved oxygen: A daily average of 6.0 mg/I and no less than 5.0 mg/I at all times for waters designated as trout streams by the<br />
Wildlife <strong>Resources</strong> Division. A daily average of 5.0 mg/I and no less than 4.0 mg/I at all times for water supporting warm water<br />
species of fish.<br />
(iii) pH: Within the range of 6.0 - 8.5.<br />
(iv) No material or substance in such concentration that, after treatment by the public water treatment system, exceeds the maximum<br />
contaminant level estabhshed for that substance by the Environmental Protection Division pursuant to the Georgia Rules for Safe<br />
Drinking <strong>Water</strong>.<br />
(v) Terrperature: Not to exceed 90 F. Al no time is the temperature of the receiving waters to be increased more than SF above intake<br />
temperature except that in estuarine waters the increase will not be more than 1.5 F. In streams designated as primary trout or<br />
smallmouth bass waters by the Wildlife <strong>Resources</strong> Division, there shall be no elevation of natural stream temperatures. In streams<br />
designated as secondary trout waters, there shall be no elevation exceeding 2’ F of natural stream temperatures.<br />
(b) Recreation: General recreational activities such as water skiing, boating, and swimming, or for any other use requiring water of a<br />
lower quality, such as recreational fishing. These criteria are not to be interpreted as encouraging water contact sports in proximity<br />
to sewage or industrial waste discharges regardless of treatment requirements:<br />
(I) Bacteria: Fecal coliforni not to exceed the following geometric means based on at least four samples collected from a given<br />
sampling site over a 30-day period at intervals not less than 24 hours:<br />
(1) Coastal waters 100 per 100 ml<br />
(2) All other recreational waters 200 per 100 ml<br />
(3) Should water quality and sanitary studies show natural fecal coliform levels exceed 200/100 ml (geometric mean) occasionally in<br />
high quality recreational waters, then the allowable geometric mean fecal coliform level shall not exceed 300 per 100 ml in lakes<br />
and reservoirs and 500 per 100 ml in free flowing fresh water streams.<br />
(ii) Dissolved Oxygen: A daily average of 6.0 mg/I and no less than 5.0 mg/I at all times for waters designated as trout streams by the<br />
Wildlife <strong>Resources</strong> Division. A daily average of 5.0 mg/I and no less than 4.0 mg/I at all times for waters supporting warm water<br />
species of fish.<br />
(iii) pH: Within the range of 6.0- 8.5.<br />
(iv) Temperature: Not to exceed 90°F. At no time is the temperature of the receiving waters to be increased more than 5°F above intake<br />
temperature except that in estuarine waters the increase will not be more than 1.5 F. In streams designated as primary trout or<br />
smallmouth bass waters by the Wildlife <strong>Resources</strong> Division, there shall be no elevation of natural stream temperatures. In streams<br />
designated as secondary trout waters, there shall be no elevation exceeding 2°F natural stream temperatures.<br />
(c) Fishing: Propagation of Fish, Shellfish, Game and Other Aquatic Life; secondary contact recreation in and on the water or for any<br />
other use requiring water of a lower quality:<br />
(I) Dissolved Oxygen: A daily average of 6.0 mg/I and no less than 5.0 mg/I at all times for water designated as trout streams by the<br />
Wildlife <strong>Resources</strong> Division. A daily average of 5.0 mg/I and no less than 4.0 mg/I at all times for waters supporting warm water<br />
species of fish.<br />
(ii) pH: Within the range of 6.0 - 8.5.<br />
(iii) Bacteria: For the months of May through October, when water contact recreation activities are expected to occur, fecal coliform<br />
notto exceed a geometric mean of 200 per 100 ml based on at least four samples collected from a given sampling site over a 30-day<br />
period at intervals not less than 24 hours. Should water quality and sanitary studles show fecal coliform levels from non-human<br />
sources exceed 200/100 ml (geometric mean) occasionally, then the allowable geometric mean fecal coliform shall not exceed 300<br />
per 100 ml in lakes and reservoirs and 500 per 100 ml in free flowing freshwater streams. For the months of November through<br />
April, fecal coliform not to exceed a geometric mean of 1,000 per 100 ml based on at least four samples collected from a given<br />
sampling site over a 30-day period at intervals not less than 24 hours and not to exceed a maximum of 4,000 per 100 ml for any<br />
sample. The State does not encourage swnning in surface waters since a number of factors which are beyond the control of any<br />
210
<strong>Water</strong> Quality Contro) Chapter 391-3-6<br />
State regulatory agency contribute to elevated levels of fecal coliform. For waters designated as approved shellfish harvesting waters by the<br />
appropriate State agencies, the requirements will be consistent with those established by the State and Federal agencies responsible for the<br />
<strong>National</strong> Shellfish Sanitation Program. The requirements are found in the <strong>National</strong> Shellfish Sanitation Program Manual of Operation,<br />
Revised 1988, Interstate Shellfish Sanitation Conference, U. S. Department of Health and Human <strong>Service</strong>s (PHS/FDA), and the Center for<br />
Food Safety and Applied Nutrition. Streams designated as generally supporting shellfish are listed in Paragraph 391-3-6-.03(14).<br />
(iv) Temperature: Notto exceed 90 F. At no time is the temperature of the receiving waters to be increased more than 5 F above intake<br />
temperature except that in estuarine waters the increase will not be more than 1.5°F. In streams designated as primary trout or smallmouth<br />
bass waters by the Wildlife <strong>Resources</strong> Division, there shall be no elevation of natural stream temperatures. In streams designated as<br />
secondary trout waters, there shall be no elevation exceeding 2 F natural stream temperatures.<br />
(d) Wild River For all waters designated in 391-3-6-.03(13) as ‘Wild River,” there shall be no aiteration of natural water quality from any<br />
source.<br />
(e) Scenic River For all waters designated in 391-3.-6-.03(13) as “Scenic River,” there shall be no alteration of natural water quality from any<br />
source.<br />
(1) Coastal Fishing: This classification will be applicable to specific sites when so designated by the Environmental Protection Division. For<br />
waters designated as “Coastal Fishing”, site specific criteria for dissolved oxygen will be assigned and detailed by footnote in Section 391 -<br />
3-6-.03(3), “Specific <strong>Water</strong> Use Classiflcations.’~ All other criteria and uses for the fishing use classification will apply for coastal fishing.<br />
(7) Natiral <strong>Water</strong> Quality. It is recognized that certain natural waters of the State may have a quality that will not be within the general or<br />
specific requirements contained herein. This is especially the case for the criteria for dissolved oxygen, temperature, pH and fecalcoliform.<br />
NPDES permits and best management practices will be the primary mechanisms for ensuring that discharges will not create a harmful<br />
situation.<br />
(8) Treatment Requirements. Notwithstanding the above criteria, the requirements of the State relating to secondary or equivalent treatment of<br />
all waste shall prevail. The adoption of these criteria shall in no way preempt the treatment requirements.<br />
(9) Streamfiows. Specific criteria or standards set for the various parameters apply to all flows on regulated streams. On unregulated steams,<br />
they shall apply to all streamilows equal to or exceeding the 7-day, 10-year minimum flow (7Q10). All references to 7-day, 10-year<br />
minimum flow (7010) also apply to all flows on regulated streams. All references to annual average stream flow also apply to long-term<br />
average stream flow conditions.<br />
(10) Mixing Zone. Effluents released to streams or impounded waters shall be fully and homogeneously dispersed and mixed insofar as practical<br />
with the main flow or water body by appropriate methods at the discharge point. Use of a reasonable and limited mixing zone may be<br />
permitted on receipt of satisfactory evidence that such a zone is necessary and that it will not create an objectionable or damaging pollution<br />
condition. Protection from acute toxicity shall be provided within any EPD designated mixing zone to ensure a zone of safe passage for<br />
aquatic organisms. The procedure is as described in paragraph 391-3-6-.06(4)(d)(5)(vi), except that the numerical pass/fail criteria applies to<br />
the end-of-pipe without the benefit of dilution provided by the receiving stream.<br />
(11) Toxic Pollutant Monitoring. The Division will monitor waters of the State for the presence or impact of Section 307 (a)(l) Federal Clean<br />
<strong>Water</strong> Act toxic pollutants, and other priority pollutants. The monitoring shall consist of the collection and assessment of chemical and/or<br />
biological data as appropriate from the water column, from stream bed sediments, and/or from fish tissue. Specific stream segments and<br />
chemical constituents for monitoring shall be determined by the Director on the basis of the potential for water quality impacts from toxic<br />
pollutants from point or nonpoint waste sources. Singularly or in combination, these constituents may cause an adverse effect on fish<br />
propagation at levels lower than the criteria. Instream concentrations will be as described in 391-3-6-03 (5)(d). Additional toxic substances<br />
and priority pollutants will be monitored on a case specific basis using Section 304(a) Federal Clean <strong>Water</strong> Act guidelines or other<br />
scientifically appropriate documents.<br />
(12) Fecal Coliform Criteria. The criteria for fecal coliform bacteria provide the regulatory framework to support the USEPA requirement that<br />
States protect all waters for the use of primary contact recreation or swimming. This ls a worthy national goal, although potentially<br />
unrealistic with the current indicator organism, fecal coliform bacteria, in use today. To assure that waters are safe for swirrrning indicates a<br />
need to test waters for pathogenic bacteria. However, analyses for pathogenic bacteria are expensive and results are generally diflicultto<br />
reproduce quantitatively. Also, to ensure the water is safe for swimming would require a whole suite of tests be done for organisms such as<br />
Salmonella, Shioella, ~ etc. as the presence/absence of one organism would not document the presence/absence of another. This type of<br />
testing program is not possible due to resource constraints. The environmental community in the United States has based the assessment of<br />
the bacteriological quality of water on testing for pathogenic indStor organisms, principally the coliform group. The assessment of streams,<br />
rivers, lakes, and estuaries in Georgia and other States is based on fecal coliform organisms.<br />
Coliform bacteria live in the intestinal tract of warm blooded animals including man. These organisms are excreted in extremely high<br />
numbers, averaging about 1.5 billion coliform per ounce of human feces. Pathogenic bacteria also originate in the fecal material of diseased<br />
persons. Therefore, waters with high levels of fecal coliform bacteria represent potential problem areas for swrnming. However, there is no<br />
positive scientific evidence correlating elevated fecai coliform counts with transmission of enteric diseases. In addition, these bacteria can<br />
originate from any warm blooded animal or from the soil.<br />
Monitoring programs have documented fecal coliform levels in excess of the criteria in many streams and rivers in urban areas, agricultural<br />
areas, and even in areas not extensively impacted by man such as national forest areas. This is not a unique situation to Georgia as similar<br />
levels of fecal coliform bacteria have been documented in streams across the nation. The problem appears to lie in the lack of an organism<br />
which specifically indicates the presence of human waste materials which can be correlated to human illness. Other organisms such as the<br />
Enterococci group and E ç~fl have been suggested by the USEPA as indicator<br />
211
<strong>Water</strong> Quality Control Chapter 391-3-6<br />
organisms. However, testing using these organisms by States and the USEPA has indicated similar problems with these indicator organisms.<br />
The Environmental Protection Division will conduct a monitoring project from 1993 through 1995 to evaluate the use of ff~ ~!j and<br />
Enterococo as indicators of bacteriological quality in Georgia. The Environmental Protection Division will also conduct studies to determine<br />
if a better human specific indicator can be found to replace current indicator organisms.<br />
(13) Specific <strong>Water</strong> Use Classifications. Beneficial water uses assigned by the State to all surface waters. These classifications are<br />
scientifically determined to be the best utilization of the surface water from an environmental and economic standpoint Streams and<br />
stream reaches not specifically listed are ciassified as Fishing. The specific classifications are as follows:<br />
SAVANNAH RIVER BASIN CLASSIFICATION<br />
Chattooga River Georgia-North Carolina State Line<br />
to Tugaloo Reservoir Wild and Scenic<br />
West Fork Chattooga Confluence of Overflow<br />
Creek and Clear Creek to confluence<br />
with Chattooga River (7.3 mi.) Wild and Scenic<br />
TaIlulah River Headwaters of Lake Burton to<br />
confluence with Chattooga River Recreation<br />
Tugaloo River Confluence of Tallulah and<br />
Chattooga Rivers to Yonah Lake Dam Recreation<br />
Savannah River Highway 184 to Clark Hill Dam (Mile 238) Recreation<br />
Savannah River Clark Hill Dam (Mile 238) to Augusta,<br />
13th Street Bridge Drinking <strong>Water</strong><br />
Savannah River US Hwy. 301 Bridge (Mile 129)<br />
to Seaboard Coastline RR Bridge<br />
(Mile 27.4) Drinking <strong>Water</strong><br />
Savannah River Seaboard Coastiine RR Bridge (Mile 27.4) to<br />
Fort Pulaski (Mile 0) Coastal Fishing<br />
Savannah RiverFort Pulaski (Mile 0) to Open Sea and all<br />
littoral waters of Tybee Island Recreation<br />
OGEECHEE RIVER BASIN CLASSIFICATION<br />
Ogeechee RiverU.S. Hwy. 17 Bndge to Open Sea and<br />
littoral waters of Skidaway, Ossabaw,<br />
Sapelo. and St Catherines Islands Recreation<br />
Little Ogeechee River South end of White Bluff Road near<br />
Carmelite Monastery to Open Sea and<br />
littoral waters of Skidaway and Ossabaw Islands Recreation<br />
OCONEE RIVER BASIN CLASSIF1CAT1ON<br />
Middle Oconee River Georgia Hwy. 82 to Athens <strong>Water</strong> Intake Drinking <strong>Water</strong><br />
North Oconee River Jackson County Road 432 to<br />
Athens <strong>Water</strong> Intake Drinking <strong>Water</strong><br />
Oconee River Georgia Hwy. 16 to Sinclair Dam Recreation<br />
Oconee River Sinclair Dam to Georgia Hwy. 22 Drinking <strong>Water</strong><br />
Oconee River Georgia Hwy. 57 to U.S. Hwy. 80 Drinking <strong>Water</strong><br />
UPPER OCMULGEE RIVER CLASSIFICATION<br />
Big Haynes Creek Georgia Hwy. 20 to Bald Rock Road Drinking <strong>Water</strong><br />
Alcovy River Georgia Hwy. 81 to City of Covington<br />
<strong>Water</strong> Intake Drinking <strong>Water</strong><br />
Yellow River Georgia Hwy. 124 to Porterdale <strong>Water</strong> Intake Drinking <strong>Water</strong><br />
Jackson Lake From South River at Georgia Hwy. 36: from Yellow<br />
212
<strong>Water</strong> Quality Control Chapter 391-3-6<br />
River at Georgia Hwy. 36: from Alcovy River at Newton<br />
Factory Road Bridge to Lloyd Shoals Dam Recreation<br />
Big Haynes Creek Georgia Highway 78 to Confluence with the<br />
YeUow River Drinking <strong>Water</strong><br />
LOWER OCMULGEE RIVER BASIN CLASSIFICATION<br />
Towaliga River Headwaters to Georgia Hwy. 36 Drinking <strong>Water</strong><br />
Towaliga River Georgia Hwy. 36 to High Falls Dam Recreation<br />
Ocmulgee River Georgia Hwy. 18 to Macon <strong>Water</strong> Intake Drinking <strong>Water</strong><br />
Tobesofkee Creek Lake Tobesofkee Recreation<br />
ALTAMAHA RIVER BASIN CLASSIFICATION<br />
All littoral waters on the ocean side of St. Simons, Recreation<br />
Sea, and Sapelo Islands<br />
SATILLA RIVER BASIN CLASSIFICATION<br />
All littoral waters on the ocean side of Cumberland Recreation<br />
and Jekyll Islands<br />
ST. MARYS RIVER BASIN CLASSIFICATION<br />
All littoral waters on the ocean side of Cumberland Recreation<br />
Island<br />
FLINT RIVER BASIN CLASSIFICATION<br />
Flint River Wcolsey Road (Fayette Clayton Counties) to<br />
Georgia Hwy. 16 Drinking <strong>Water</strong><br />
Flint River Georgia Hwy. 27 to Georgia Power Dam at<br />
Lake Worth, Albany Recreation<br />
Flint River Bainbridge, U.S. Hwy. 84 Bridge to Jim Woodruff<br />
Dam, Lake Seminole Recreation<br />
CHATTAHOOCHEE RIVER BASIN CLASSIFICATION<br />
Chattahcochee River Headwaters to Buford Dam Recreation<br />
Chattahoochee River Buford Dam to Atianta (Peachtree Creek) Drinking <strong>Water</strong><br />
and Recreation<br />
Chattahoochee River Atlanta (Peachtree Creek) to Cedar Creek Fishing 2<br />
Chattahoochee River New River to West Point Dam Recreation<br />
Chattahcochee River West Point Dam to West Point Mfg<br />
Company <strong>Water</strong> Intake Drinking <strong>Water</strong><br />
Chattahcochee River Osanippa Creek to Columbus<br />
(North Highland Dam) Recreation and<br />
Drinking <strong>Water</strong><br />
Chattahcochee River Cowikee Creek to Great Southem Division<br />
of Great Northem Paper Company Recreation<br />
Chattahcochee River Georgia Hwy. 91 (Nears Landing) to Jim<br />
Woodruff Dam Recreation<br />
Big Creek Georgia Hwy. 400 to City of Roswell <strong>Water</strong><br />
intake Drinking <strong>Water</strong><br />
Dog River Headwaters to Dog River Reservoir Drinking <strong>Water</strong><br />
Bear Creek Headwaters to Douglasville-Douglas County<br />
213
<strong>Water</strong> Quality Control Chapter 391 -3-6<br />
<strong>Water</strong> and Sewer Authority <strong>Water</strong> Intake Drinking <strong>Water</strong><br />
TALLAPOOSA RIVER BASIN CLASSIFICATION<br />
Tallapoosa River Headwaters to Georgia Hwy. 100 Drinking <strong>Water</strong><br />
Little Tallapoosa Headwaters to SCS Dam No. 36 (Carroliton Drinking <strong>Water</strong><br />
River Raw <strong>Water</strong> Intake)<br />
COOSA RIVER BASIN CLASSIFICATION<br />
Conasauga River Georgia Hwy. 2 to Dalton <strong>Water</strong> Intake Drinking <strong>Water</strong><br />
Ellijay River Headwaters to Ell~ay <strong>Water</strong> Intake Drinking <strong>Water</strong><br />
Cartecay River Headwaters to Ellijay <strong>Water</strong> Intake Drinking <strong>Water</strong><br />
Coosawattee River Confluence to Mountaintown Creek to<br />
Carters Dam Recreation<br />
Coosawattee River U. S. Hwy. 411 to confluence of Conasauga<br />
River Drinking <strong>Water</strong><br />
Oostanaula River Confluence to Conasauga and Coosawattee<br />
Rivers to Calhoun <strong>Water</strong> Intake Drinking <strong>Water</strong><br />
Oostanaula River Confluence with Armuchee Creek to Rome<br />
<strong>Water</strong> Intake Drinking <strong>Water</strong><br />
Oostanaula River Confluence of Little Dry Creek (below Rome<br />
<strong>Water</strong> Intake) to Coosa River Fishing<br />
Etowah River Cherokee County Road 782 to Canton <strong>Water</strong><br />
intake Drinking <strong>Water</strong><br />
Etowah River Georgia Hwy. 20 to Allatoona Dam Recreation and<br />
Drinking <strong>Water</strong><br />
Etowah River Allatoona Dam to Cartersville <strong>Water</strong> Intake Drinking <strong>Water</strong><br />
Coosa River Confluence of Etowah and Coosawattee to<br />
Mayo’s Lock and Dam Fishing<br />
Coosa River At the Alabama State Line Recreation<br />
Mill Creek Headwaters to Dalton <strong>Water</strong> Supply Drinking <strong>Water</strong><br />
Conasauga River <strong>Water</strong>s Within the Cohutta Wildemess Area Wild and Scenic<br />
Jacks Creek <strong>Water</strong>s Within the Cohutta Wildemess Area Wild and Scenic<br />
TENNESSEE RIVER BASIN CLASSIFICATION<br />
Hiawassee River Headwaters to Georgia-North Carolina State<br />
Line (including Lake (including Lake Chatuge) Recreation<br />
Nottely River Headwaters to Georgia-North Carolina State Line Recreation<br />
Toccoa River Headwaters to Georgia-Tennessee State Line<br />
(including Lake Blue Ridge) Recreation<br />
(1) Site specific criteria for this classification are minimum Instantaneous and will apply throughout the water column. The dissolved oxygen criteria<br />
is no less than 3.0 mg/I in June, July, August, September, and October: no less than 3.5 mg/I in May and November and no less than 4.0 mg/I in<br />
December, January, February, March, and April.<br />
(2) Specific criteria apply at all times when the river flow measured at a point immediately upstream from Peachtree Creek equals or exceeds 750 cfs<br />
(Atlanta gage flow minus Atlanta water supply withdrawal):<br />
(14) Trout Streams. Streams designated as Primary Trout <strong>Water</strong>s are waters supporting a self-sustaining population of Rainbow, Brown or Brook<br />
Trout Streams designated as Secondary Trout Streams are those with no evidence of natural trout reproduction, but are capabe of supporting trout<br />
throughout the year. Trout streams are classified in accordance with the designations and criteria as follows:<br />
(a) Criteria.<br />
(i) There shall be no elevation of natural stream temperatures for Primary Trout <strong>Water</strong>s; 2°F or less elevation for Secondary Trout <strong>Water</strong>s.<br />
214
<strong>Water</strong> Quality Control Chapter 391-3-6<br />
(ii) No person shall construct an impoundment on Primary Trout <strong>Water</strong>s, except on streams with drainage basins less than 50 acres upstream of the<br />
impoundment Impoundments on streams with drainage basins less than 50 acres must be approved by the Division.<br />
(iii) No person shall construct an impoundment on Secondary Trout <strong>Water</strong>s without the approval of the Division.<br />
(b) Designations by County.<br />
BARTOW COUNTY<br />
Primary:<br />
None.<br />
Secondary:<br />
1. Boston Creek watershed upstream from Georgia Hwy. 20.<br />
2. Connesena Creek watershed.<br />
3. Dykes Creek watershed.<br />
4. Pine Log Creek watershed.<br />
5. Pyle Creek watershed.<br />
6. Salacoa Creek watershed.<br />
7. Spring Creek watershed.<br />
8. Stamp Creek watershed upstream from Bartow County Road 269.<br />
9. Toms Creek watershed upstream from Bartow County Road 82.<br />
10. Two Run Creek watershed.<br />
11. Ward Creek watershed.<br />
CARROLL COUNTY<br />
Primary:<br />
None.<br />
Secondary:<br />
1. Brooks Creek watershed.<br />
2. Mud Creek watershed.<br />
3. Tallapoosa River.<br />
CATOOSA COUNTY<br />
Primary:<br />
None.<br />
Secondary:<br />
1. Hurricane Creek watershed upstream from Peters Branch.<br />
2. Little Chickamauga Creek watershed upstream from Catoosa County Road 387.<br />
3. Tiger Creek watershed upstream from Georgia Hwy. 2.<br />
4. Dry Creek watershed upstream from Catoosa County Road 257 (East Chickamauga Creek <strong>Water</strong>shed).<br />
CHAT~OOGA COUNTY<br />
Primary:<br />
None.<br />
Secondary:<br />
1. Allgood Branch watershed upstream from Southem Railroad.<br />
2. Chappel Creek watershed.<br />
3. Chelsea Creek watershed.<br />
4. East Fork Little River watershed.<br />
215
<strong>Water</strong> Quality Control Chapter 391-3-6<br />
5. Hinton Creek watershed.<br />
6. Kings Creek watershed.<br />
7. Little Armuchee Creek watershed upstream from Chattooga County Road 326.<br />
8. Middle Fork Little River watershed.<br />
9. Mt. Hope Creek watershed.<br />
10. Perennial Spring watershed.<br />
11. Raccoon Creek watershed upstream from Georgia Hwy. 48.<br />
12. Ruff Creek watershed.<br />
13. Storey Mill Creek watershed.<br />
14. Taliaferro Creek watershed.<br />
CHEROKEE COUNTY<br />
Primary:<br />
None.<br />
Secondary:<br />
1. Boston Creek watershed.<br />
2. Pine Log Creek watershed.<br />
3. Salacoa Creek watershed.<br />
4. Stamp Creek watershed.<br />
5. Bluff Creek watershed upstream from Cherokee County Road 114.<br />
6. Murphy Creek watershed.<br />
7. Soap Creek watershed upstream from Cherokee County Road 116.<br />
8. Wiley Creek watershed.<br />
COBB COUNTY<br />
Primary:<br />
None.<br />
Secondary:<br />
1. Chattahoochee River upstream from 1-285 West Bridge.<br />
DADE COUNTY<br />
Primary:<br />
None.<br />
Secondary:<br />
1. Allison Creek watershed.<br />
2. East Fork Little River watershed.<br />
3. Lookout Creek watershed upstream from Dade County Road 197.<br />
4. Rock Creek watershed.<br />
5. West Fork Little River watershed.<br />
DAWSON COUNTY<br />
Primary:<br />
1. Amicalola Creek watershed upstream from Dawson County Road 192 (Devil’s Elbow Road).<br />
2. Sweetwater Creek watershed.<br />
3. Anderson Creek watershed.<br />
4. Long Swamp Creek watershed.<br />
/<br />
216
<strong>Water</strong> Quality Control Chapter 391-3-6<br />
5. Nimblewill Creek watershed.<br />
Secondary:<br />
1. Amicalola Creek watershed from Georgia Hwy. 53 upstream to Dawson County Road 192 (Devirs Elbow Road).<br />
2. Shoal Creek watershed upstream from the mouth of Burt Creek.<br />
ELBERT COUNTY<br />
Primary:<br />
None.<br />
Secondary:<br />
1. Savannah River for the ten-mile reach downstream from Hartwell Dam.<br />
FANNIN COUNTY<br />
Primary:<br />
1. Conasauga River - Jacks River watershed.<br />
2. Ellijay River watershed.<br />
3. Etowah River watershed.<br />
4. Fightingtown Creek watershed.<br />
5. Owenby Creek watershed.<br />
6. Persimmon Creek watershed.<br />
7. South Fork Rapier Mill Creek watershed.<br />
8. Toccoa River watershed upstream to Blue Ridge Reservoir dam.<br />
9. Toccoa River watershed upstream from the backwater of Blue Ridge Reservoir.<br />
10. Tumbling Creek watershed.<br />
11. Wilscot Creek watershed.<br />
Secondary:<br />
All streams or stream sections not classified as primary in the above list<br />
FLOYD COUNTY<br />
Primary:<br />
None.<br />
Secondary:<br />
1. Dykes Creek watershed.<br />
2. Johns Creek watershed upstream from Floyd County Road 212.<br />
3. Kings Creek watershed.<br />
4. Lavender Creek watershed upstream from Floyd County Road 234.<br />
5. LIttle Cedar Creek watershed.<br />
6. Mt Hope Creek watershed.<br />
7. Spring Creek watershed (flows into Etowah River).<br />
8. Spring Creek watershed (flows into State of Alabama).<br />
9. Toms Creek watershed.<br />
10. Silver Creek watershed upstream from Georgia Highway I E.<br />
FORSYTH COUNTY<br />
217
<strong>Water</strong> Quality Control Chapter 391-3-6<br />
1. Chattahoochee River.<br />
FULTON COUNTY<br />
Primary:<br />
None.<br />
Secondary:<br />
1. Chattahoochee River upstream from 1-285 West Bridge.<br />
GILMER COUNTY<br />
Primary:<br />
1. Cartecay River watershed upstream from the mouth of Clear Creek.<br />
2. Clear Creek watershed upstream from Gilmer County Road 92.<br />
3. Conasauga River - Jacks River watershed.<br />
4. Ellijay River watershed upstream from the mouth of Kells Creek.<br />
5. Harris Creek watershed.<br />
6. Johnson Creek watershed.<br />
7. Mountaintown Creek watershed upstream from U.S. Highway 76.<br />
8. - Tails Creek watershed upstream from Georgia Hwy. 282.<br />
9. Toccoa River - Fightingtown Creek watershed.<br />
Secondary:<br />
1. All streams or sections thereof except the Coosawattee River downstream from Ga. Hwy. 5 Bridge, and Talking Rock Creek (not including<br />
tributaries) and those classified as primary.<br />
2. Ball Creek watershed.<br />
3. Sevenmile Creek watershed.<br />
4. Town Creek watershed.<br />
5. Wildcat Creek watershed.<br />
GORDON COUNTY<br />
Primary:<br />
None:<br />
Secondary:<br />
1. Johns Creek watershed.<br />
2. Long Branch watershed.<br />
3. Pine Log Creek watershed upstream from Georgia Hwy. 53.<br />
4. Pin Hook Creek watershed upstream from Ryo Road.<br />
5. Rocky Creek watershed upstream from West Union Road.<br />
6. Salacoa Creek watershed upstream from U.S. Hwy. 411.<br />
7. Snake Creek watershed.<br />
GWINNE1T COUNTY<br />
Primary:<br />
None.<br />
Secondary: /<br />
1. Chattahoochee River.<br />
HABERSHAM COUNTY<br />
Primary:<br />
218
<strong>Water</strong> Quality Control Chapter 391-3-6<br />
1. Chattahoochee River watershed upstream from Georgia Hwy. 255 Bridge.<br />
2. Middle Fork Broad River watershed upstream from USFS Route 92-B.<br />
3. Panther Creek watershed.<br />
4. Soque River watershed upstream from King’s Bridge (bridge on Georgia Hwy. 197 just below the mouth of Shoal Creek).<br />
Secondary:<br />
1. Chattahoochee River watershed upstream from Georgia Hwy. 115 to the Georgia Hwy. 255 Bridge.<br />
2. Davidson Creek watershed.<br />
3. Middle Fork Broad River tributaries entering below USFS Route 92-B.<br />
4. Nancytown Creek watershed upstream from Nancytown Lake.<br />
5. North Fork Broad River watershed.<br />
6. Soque River watershed upstream from the mouth of Deep Creek to King’s Bridge.<br />
7. Toccoa Creek watershed.<br />
HARALSON COUNTY<br />
Primary:<br />
None.<br />
Secondary:<br />
1. Beach Creek watershed upstream from Haralson County Road 34.<br />
2. Flatwood Creek watershed.<br />
3. Lassetter Creek watershed.<br />
4. Mann Creek watershed upstream from Haralson County Road 162.<br />
5. Tallapoosa River watershed upstream from Haralson County Road 222.<br />
6. Mountain Creek watershed.<br />
7. Tallapoosa Creek watershed.<br />
HART COUNTY<br />
Primary:<br />
1. Savannah River.<br />
LUMPKIN COUNTY<br />
1. Amicalola Creek watershed.<br />
2. Camp Creek watershed.<br />
3. Cane Creek watershed upstream from Cane Creek Falls.<br />
4. Cavender Creek watershed.<br />
5. Chestatee River watershed upstream from Lumpkin County Road 52-S976.<br />
6. Clay Creek watershed.<br />
7. Etowah River watershed upstream from the Georgia Hwy. 52 Bridge.<br />
8. Hurricane Creek watershed upstream from Lumpkin County Road 118.<br />
9. Mooney Branch watershed.<br />
10. Tobacco Pouch Branch watershed.<br />
Secondary:<br />
1. Cane Creek watershed upstream from Georgia Hwy. 52 Bridge to Cane Creek Falls.<br />
219
<strong>Water</strong> Quality Control Chapter<br />
391-3-6<br />
2. Chestatee River watershed upstream from the mouth of Tesnatee Creek to Lumpkin County Road 52-S976.<br />
3. Etowah River watershed upstream from Castleberry Bridge to Georgia Hwy. 52 except those classified as primary above.<br />
4. Shoal Creek watershed.<br />
5. Yahoola Creek watershed upstream from Georgia Hwy. 52.<br />
MURRAY COUNTY .<br />
Primary:<br />
1. Conasauga - Jacks River watershed upstream from Georgia-Tennessee state line.<br />
2. Holly Creek watershed upstream from Murray County Rd. SR826 (U.S. Forest <strong>Service</strong> line).<br />
3. Rock Creek watershed upstream from Murray County Rd. 4 (Dennis).<br />
Secondary:<br />
1. All tributaries to Carters Reservoir.<br />
2. Holly Creek watershed (including Emory Creek watershed) upstream from Emory Creek to Murray County Road SR826 (U.S. Forest<br />
<strong>Service</strong> line). I<br />
3. Mill Creek watershed upstream from Murray County Road 27. I<br />
4. North Prong Sumac Creek watershed.<br />
5. Sugar Creek watershed upstream from Murray County Road 4.<br />
6. Sumac Creek watershed upstream from Coffey Lake.<br />
7. Mill Creek watershed.<br />
8. Rock Creek watershed upstream of Murray County Road 301.<br />
PAULDING COUNTY<br />
Primary:<br />
None. I<br />
Secondary:<br />
1. Possum Creek watershed upstream from Paulding County Road 64. I<br />
2. Powder Creek watershed.<br />
3. Pumpkinvine Creek watershed upstream from Paulding County Road 231. I<br />
4. Pyle Creek watershed.<br />
5. Raccoon Creek watershed upstream from Road SR2299.<br />
6. Tallapoosa River watershed.<br />
7. Ward Creek watershed.<br />
8. Simpson Creek watershed.<br />
9. Thompson Creek watershed. I<br />
PICKENS COUNTY<br />
Primary:<br />
1. Cartecay River watershed. I<br />
2. Talking Rock Creek watershed upstream from Route SlOll.<br />
Secondary:<br />
1. Amicalola Creek watershed. I<br />
2. East Branch watershed (including Damell Creek watershed).<br />
3. Fisher Creek watershed (upstream from the confluence of Talona Creek and Fisher Creek).<br />
4. Fourmile Creek watershed.<br />
5. Hobson Creek watershed.<br />
220
<strong>Water</strong> Quality Control Chapter 391-3-6<br />
6. Little Scarecom Creek watershed.<br />
7. Long Branch watershed.<br />
8. Long Swamp Creek watershed upstream from Pickens County Road 294.<br />
9. Mud Creek watershed.<br />
10. Pin Hook Creek watershed.<br />
11. Polecat Creek watershed.<br />
12. Rock Creek watershed.<br />
13. Salacoa Creek watershed.<br />
14. Scarecom Creek watershed upstream from Georgia Hwy. 53.<br />
15. Ball Creek watershed.<br />
16. Bluff Creek watershed.<br />
17. Sevenmile Creek watershed.<br />
18. Soap Creek watershed.<br />
19. Town Creek watershed.<br />
20. Wildcat Creek watershed.<br />
POLK COUNTY<br />
Primary:<br />
None.<br />
Secondary:<br />
1. Cedar Creek watershed upstream from Polk County Road 121.<br />
2. Lassetter Creek watershed.<br />
3. Little Cedar Creek watershed.<br />
4. Pumpkinpile Creek watershed upstream from Road SRi 032.<br />
5. Spring Creek watershed.<br />
6. Swinney Branch watershed.<br />
7. Thomasson Creek watershed.<br />
8. Fish Creek watershed upstream of <strong>Plan</strong>tation Pipeline.<br />
9. Silver Creek watershed.<br />
10. Simpson Creek watershed upstream of Lake Dorene.<br />
11. Thompson Creek watershed upstream of Polk County Road 441.<br />
RABUN COUNTY<br />
Primary:<br />
1. Chattooga River - all tributaries classified as primary.<br />
2. Little Tennessee River - entire stream and tributaries classified as primary except all streams or sections thereof classified as secondary.<br />
3. Tallulah River - entire stream and tributaries classified as primary except the Tallulah River downstream from Lake Rabun Dam to headwaters of<br />
Tugaloo Lake.<br />
Secondary:<br />
1. Little Tennessee River downstream from U.S. Hwy. 441 Bridge.<br />
2. Mud Creek downstream from Sky Valley Ski Resort Lake to the Little Tennessee River.<br />
STEPHENS COUNTY<br />
Primary:<br />
1. Middle Fork Broad River watershed upstream from USFS Route 92-B.<br />
221
<strong>Water</strong> Quality Control Chapter 391-3-6<br />
2. Panther Creek watershed upstream from the mouth of Davidson Creek.<br />
Secondary:<br />
i. Davidson Creek watershed.<br />
2. Leatherwood Creek watershed upstream from Georgia Hwy. 184 Bridge.<br />
3. Little Toccoa Creek watershed.<br />
4. Middle Fork Broad River watershed upstream from SCS flood control structure #44 to USFS Route 92-B.<br />
5. North Fork Broad River watershed upstream from SCS flood control structure #1.<br />
6. Panther Creek watershed downstream from the mouth of Davidson Creek.<br />
7. Toccoa Creek upstream from Toccoa Falls.<br />
TOWNS COUNTY<br />
Primary:<br />
1. Brasstown Creek watershed.<br />
2. Chattahoochee River watershed.<br />
3. Gumlog Creek watershed.<br />
4. Hiawassee River watershed - entire stream and all tributaries classified as primary except all streams or sections thereof classified as secondary.<br />
5. Tallulah River watershed.<br />
6. Winchester Creek watershed.<br />
Secondary:<br />
1. Hightower Creek downstream from the mouth of Little Hightower Creek.<br />
UNION COUNTY<br />
Primary:<br />
1. Arkaqua Creek watershed.<br />
2. Brasstown Creek watershed.<br />
3. Chattahoochee River watershed.<br />
4. Conley Creek watershed upstream from Road S2325.<br />
5. Coosa Creek watershed upstream from mouth of Anderson Creek.<br />
6. Dooley Creek watershed.<br />
7. East Fork Wolf Creek watershed upstream from Lake Trahlyta.<br />
8. Gumlog Creek watershed.<br />
9. lvylog Creek watershed upstream from USDA Forest <strong>Service</strong> property line.<br />
10. Nottely River watershed upstream from the mouth of Town Creek.<br />
11. Toccoa River watershed.<br />
12. Town Creek watershed.<br />
13. West Fork Wolf Creek watershed.<br />
14. Youngcane Creek watershed upstream from the mouth of Jones Creek.<br />
Secondary:<br />
1. All streams or sections thereof except the Buttemut Creek watershed and the Nottely River downstream of Nottely Dam and those classified as<br />
pnmary.<br />
WALKER COUNTY<br />
Primary:<br />
1. Fumace Creek watershed.<br />
2. Harrisburg Creek watershed (including Dougherty Creek and Allen Creek) upstream from Dougherty Creek.<br />
222
<strong>Water</strong> Quality Control Chapter 391-3-6<br />
Secondary:<br />
1. Chappel Creek watershed.<br />
2. Concord Creek watershed.<br />
3. Dry Creek watershed (tributary to East Armuchee Creek).<br />
4. Duck Creek watershed.<br />
5. East Armuchee Creek watershed upstream from Georgia Hwy. 136.<br />
6. East Fork Little River watershed (flows into Dade County).<br />
7. East Fork Little River watershed (flows into Chattooga County; includes Gilreath Creek).<br />
8. Gulf Creek watershed.<br />
9. Johns Creek watershed.<br />
10. Left Fork Coulter Branch watershed.<br />
11. Little Chickamauga Creek watershed.<br />
12. Middle Fork Little River watershed (includes Cannon Branch and Hale Branch).<br />
13. Rock Creek watershed (including Sawmill Branch) upstream from Sawmill Branch.<br />
14. Ruff Creek watershed.<br />
15. Snake Creek watershed.<br />
16. West Armuchee Creek watershed.<br />
17. West Chickamauga Creek watershed upstream from Walker County Road 107.<br />
18. West Fork Little River watershed.<br />
19. Chattanooga Creek watershed upstream of Walker County Road 235.<br />
WHITE COUNTY<br />
Primary:<br />
1. Cathey Creek watershed upstream from the Arrowhead Campground Lake.<br />
2. Chattahoochee River watershed upstream from Georgia Hwy. 255 Bridge.<br />
3. Town Creek watershed upstream from the mouth of Jenny Creek.<br />
Secondary:<br />
1. Chattahoochee River watershed upstream from Georgia Hwy. 115 to the Georgia Hwy. 255 Bridge.<br />
2. Little Tesnatee Creek watershed upstream from the mouth of Tumer Creek.<br />
3. Tumer Creek watershed except as listed under primary above (Tumer Creek nearest to Cleveland city limits).<br />
WHITFIELD COUNTY<br />
Primary:<br />
None.<br />
Secondary:<br />
1. Coahulla Creek watershed upstream from Whitfield County Road 183.<br />
2. East Arrnuchee Creek watershed.<br />
3. Snake Creek watershed.<br />
4. Spring Creek watershed.<br />
5. Swamp Creek watershed upstream from Whitfield County Road 9.<br />
6. Tiger Creek watershed.<br />
7. Dry Creek watershed.<br />
223
<strong>Water</strong> Quality Control Chapter 391-3-6<br />
(15) <strong>Water</strong>s Generally Supporting Shellfish. <strong>Water</strong>s designated by the Coastal <strong>Resources</strong> Division as productive shellfish waters (currently<br />
produdng or with the potential to produce shellfish) are opened and closed according to State Law and the requirements of the <strong>National</strong><br />
Shellfish Sanitation Program Manual of Operations. For a current listing of open productive shellfish waters. contact the Coastal <strong>Resources</strong><br />
Division. Specific water reaches generally supporting shellfish are as follows:<br />
CHATHAM COUNTY<br />
1. Savannah River South Channel at Fort Pulaski to confluence with Lazaretto Creek.<br />
2. Tybee River at confluence with Bates Creek and eastward, including Bates Creek.<br />
3. Wilmington River at confluence with Herb River and eastward.<br />
4. Herb River at confluence with Wilmington River to County Road 890.<br />
5. All waters surrounding Skidaway Island including Moon River North to Skidaway Island Road.<br />
6. Vemon River at Vemonburg and eastward.<br />
7. Little Ogeechee River from Rose Dhu Island and eastward excluding Harvey Creek on Harvey’s Island.<br />
8. Ogeechee River below Shad Island and eastward (north of center line).<br />
9. All waters surrounding Ossabaw Island and Wassaw Island to the center line of the intracoastal waterway.<br />
BRYAN COUNTY<br />
1. Ogeechee River below Shad Island and eastward (south of center line).<br />
2. Redbird Creek at Cottonham and eastward.<br />
3. All waters west of main channel center line of intracoastal waterway to confluence of Medway River.<br />
4. Medway River at south confluence of Sunbury Channel and East Channel and eastward (north of center line).<br />
LIBERTY COUNTY<br />
1. Medway River at south confluence of Sunbury Channel and East Channel and eastward (south of center line).<br />
2. Dickinson Creek at Latitude 310 44.2’ to confluence with Medway River.<br />
3. Johns Creek at end of County Road 3 and eastward to confluence with Medway River.<br />
4. All other waters east and north of Colonels Island.<br />
5. North Newport River System at confluence with Cans Neck Creek and eastward, including Cross Tide Creek.<br />
6. South Newport River System north of center line and eastward from confluence with South Hampton Creek.<br />
MCINTOSH COUNTY<br />
1. South Newport River System south of centeriine and eastward from confluence with South Hampton Creek.<br />
2. Julienton River at Latitude 310 36.8’ and eastward to confluence with Sapelo River, including Broad River near Shellman Bluff.<br />
3. Sapelo River from end of County Road 127 eastward excluding White Chimney River and Savannah Cut.<br />
4. All waters surrounding Creighton Island.<br />
5. Atwood Creek at Latitude 310 28.3’ and eastward.<br />
6. Hudson Creek at Latitude 310 27.7 and eastward.<br />
7. Camigan River at Latitude 310 26.2’ and eastward.<br />
8. All waters surrounding Sapelo Island to the canter line of Sapelo Sound, including New Teakettle Creek, Old Teakettle Creek and Dark Creek.<br />
9. Dead River at Longitude 81° 21.5’ to confluence with Folly River.<br />
10. Folly River at Longitude 810 21.2’ to confluence with intracoastal waterways including Fox Creek tributary.<br />
11. North River from confluence with Old Darien River to confluence with intracoastal waterway, including Old Darien River.<br />
12. Darien River from confluence with Three Mile Cut to intracoastal waterway.<br />
13. Rockdedundy River from confluence with Darien River to intracoastal waterway.<br />
14. All waters surrounding Doboy Island, Commodore Island, Wolf Island, and Rockdedundy Island.<br />
224
<strong>Water</strong> Quality Control Chapter 391-3-6<br />
15. South River at confluence of intracoastal waterway to Doboy Sound.<br />
16. Altamaha River from confluence with Three Mile Cut and Mackay River and eastward, including Buttermilk Sound, but excluding South<br />
Altamaha River.<br />
17. Dog Hammock to confluence with Sapelo River.<br />
18. Eagle Creek to confluence with Mud River.<br />
GLYNN COUNTY<br />
1. Mackay River water system from confluence with South Altamaha River to confluence with Brunswick River, excluding Wally’s Leg.<br />
2. All waters surrounding St Simons Island and Little St Simons Island.<br />
3. All waters surrounding Andrews Island excluding Academy Creek<br />
4. Turtle River from confluence with Buffalo River to confluence with South Brunswick River, excluding Cowpen Creek. Yellow Bluff Creek, and<br />
Gibson Creek.<br />
5. South Brunswick River and drainage system to confluence of Brunswick River.<br />
6. Fancy Bluff Creek from confluence with South Brunswick River to the Little Satilla River.<br />
7. Brunswick River from confluence of Turtle River and South Brunswick River to St. Simons Sound.<br />
8. Little Satilla River from confluence with Fancy Bluff Creek to St. Andrews Sound (north of center line).<br />
9. All waters surrounding Jekyll Island, Jointer Island, and Colonels Island.<br />
CAMDEN COUNTY<br />
1. Little Satilla River from confluence with Fancy Bluff Creek to St Andrews Sound (south of center line), excluding Maiden Creek.<br />
2. Umbrella Creek from confluence with Dover Creek below Dover Bluff.<br />
3. Dover Creek from confluence with Umbrella Creek to confluence with Satilla River.<br />
4. Satilla River near Floyd Basin and unnamed cut over to Dover Creek to St Andrews Sound.<br />
5. Floyd Basin at confluence with Todd Creek to confluence with Satilla River.<br />
6. Floyd Basin at confluence with Todd Creek to confluence with Cumberiand River.<br />
7. Black Point Creek south of Latitude 30° 52.0’ south to Crooked River.<br />
8. Crooked River from Crooked River State <strong>Park</strong> to Cumberiand River.<br />
9. Cumberiand River from confluence of St Andrews Sound to confluence with St Marys River (north of center line).<br />
10. North River from County Road 75 to confluence with St. Marys River.<br />
11. All waters surrounding Cumberland Island.<br />
12. St Marys River (north of center line) from end of State Road 40 to Cumberiand Sound.<br />
(16) Specific Criteria for Lakes and Major Lake Tributaries. In addition to the general criteria, the following lake specific criteria are deemed<br />
necessary and shall be required for the specific water usage as shown:<br />
(a) West Point Lake: Those waters impounded by West Point Dam and downstream of U.S. 27 at Franklin.<br />
(I) Chlorophyll a: For the months of April through October, the average of monthly photic zone composite samples shall not exceed 27 rig/I at the<br />
LaGrange <strong>Water</strong> Intake.<br />
(ii) pH: Within the range of 6.0- 9.5.<br />
(iii) Total Nitrogen: Notto exceed 4.0 mg/I as Nitrogen in the photic zone.<br />
(iv) Phosphorus: Total lake loading shall not exceed 2.4 pounds per acre foot of lake volume per year.<br />
(v) Fecal Conform Bacteria:<br />
1. U.S. 27 at Franklin to New River Fecal coliform bacteria shall not exceed the Fishing criterion as presented in 391-3-6 .03(6)(c).<br />
2. New River to West Point Dam: Fecal coliform bacteria shall not exceed the Recreation criterion as presented in 391 -3-6-.03(6)(b).<br />
(vi) Dissolved Oxygen: A daily average of 5.0 mg/I and no less than 4.0 mg/I at all times at the depth specified in 391-3-6-.03(5)(f).<br />
(vii) Temperature: Not to exceed 90°F. At no time is the temperature of the receiving waters to be increased more than 5°F above intake temperature.<br />
225
<strong>Water</strong> Quality Control Chapter 391-3-6<br />
(viii)<br />
the following:<br />
Major Lake Tributaries: For the following tributaries, the annual total phosphorus loading to West Point Lake shall not exceed<br />
1. Yellow Jacket Creek at Hammet Road: 11,000 pounds.<br />
2. New River at Hwy 100: 14,000 pounds.<br />
3. Chattahoochee River at U.S. 27: 1,400,000 pounds.<br />
(b) Lake Walter F. George: Those waters impounded by Wafter F. George Dam and upstream to Georgia Highway 39 near Omaha.<br />
(I) Chlorophyll a: For the months of April through October, the average of monthly photic zone composite samples shall not exceed 18 ug/l at<br />
mid-river at U.S. Highway 82 or 15 ug/l at mid-river in the dam forebay.<br />
(ii) pH: Within the range of 6.0-9.5 standard units.<br />
(iii) Total Nitrogen: Not to exceed 3.0 mg/I as nitrogen in the photic zone.<br />
(iv) Phosphorous: Total lake loading shall not exceed 2.4 pounds per acre-foot of lake volume per year.<br />
(v) Fecal Coliform:<br />
1. Georgia Highway 39 to Cowikee Creek Fecal coliform bacteria shall not exceed the Fishing criterion as presented in 391-3-6-.03(6)(c)(iii).<br />
2. Cowikee Creek to Walter F. George Dam: Fecal coliform bacteria shall not exceed the Recreation criterion as presented in 391-3-6-.03(6)(b)(l).<br />
(vi) Dissolved Oxygen: A daily average of no less than 5.0 mg/I and no less than 4.0 mg/I at all times at the depth specified in 391-3-6-.03(5)(f).<br />
(vii) Temperature: <strong>Water</strong> temperature shall not exceed the Recreation criterion as presented in 391-3-6-.03(6)(b)(iv).<br />
(viii) Major Lake Tributary: The annual total phosphorous loading to Lake Walter F. George, monitored at the Chattahoochee River<br />
at Georgia Highway 39, shall not exceed 2,000,000 pounds.<br />
(c) Lake Jackson: Those waters impounded by Lloyd Shoals Dam and upstream to Georgia Highway 36 on the South and Yellow Rivers,<br />
upstream to Newton Factory Bridge Road on the Alcovy River and upstream to Georgia Highway 36 on Tussahaw Creek.<br />
(I) Chlorophyf a: For the months of April through October, the average of monthly mid-channel photic zone composite samples shall not exceed<br />
20 ugh at a location approximately 2 mIles downstream of the confluence of the South and Yellow Rivers at the junction of Butts, Newton and<br />
Jasper Counties.<br />
(ii) pH: Within the range of 6.0-9.5 standard units.<br />
(iii) Total Nitrogen: Not to exceed 4.0 mg/I as nitrogen in the photic zone.<br />
(iv) Phosphorous: Total lake loading shall not exceed 5.5 pounds per acre-foot of lake volume per year.<br />
(v) Fecal Coliform: Fecal coliform bacteria shall not exceed the Recreation criterion as presented in 391 -3-6-.03(6)(b)(I).<br />
(vi) Dissolved Oxygen: A daily average of 5.0 mg/I and no less than 4.0 mg/I at all times at the depth specified in 391 -3-6-.03(5)(f).<br />
(vii) Temperature: <strong>Water</strong> temperature shall not exceed the Recreation criterion as presented in 391 -3-6-.03(6)(b)(iv).<br />
(viii) Major Lake Tributaries: Forthe following major tributaries, the annual total phosphorous loading to Lake Jackson shall not exceed the following:<br />
1. South River at Island Shoals: 179,000 pounds<br />
2. Yellow River at Georgia Highway 212: 116,000 pounds<br />
3. Alcovy River at Newton Factory Bridge Road: 55,000 pounds<br />
4. Tussahaw Creek at Fincherville Road.: 7,000 pounds<br />
(17) Effective Date. This rule shall become effective twenty days after filing with the Secretary of State’s office.<br />
Authorty Ga. Laws 1964. p. 416. as amended: Reorganization Act of 1972, Ga. Laws 1972. Section 32. 1517. and 1534. Administrative History.<br />
Original Rule entitled ‘<strong>Water</strong> use classifications and ~er Ouality Standards” was filed on June 10. 1974: effective June 30. 1974. Amended: Filed May<br />
29. 1985: effective June 19. 1985. Amended: Filed De~rnber9. 1968: effective December29. 1988. Amen~ Filed May 31. 1989: effective June 20, 1989.<br />
Amended: ER391-3—6-O.16-.O3wasf. Jul. 6, 1989: eff. June 30. 1989. the date of adoption to reman in effect for a period of 120 days or until the<br />
effective date of a permanent Rule covering the same subject matter superseding this ER. as specified by the Agency. Amended: ER. 391-3-5-0.17-03<br />
was f. Aug. 25,1989. the date of adoption, to remain i’t effect for a period of 120 days or until the effective date of a permanent Rile covering the same<br />
subject matter supersedng this ER.. as specified by the Agency. Amended. ER. 391-3.6-0.19-03 was f. 0cc. 8, 1989. the date of adoption, to remain in<br />
effect for a period of 120 cays or until the effective date of a permanent Rule covenng the same subject matter superseding this ER.. as specified by the<br />
Agency. Amended:<br />
F. Dec. 8,1989. Amended: F.. Apr. 3. 1990: eff. Apr. 23, 1990, Amendet F. Apr. 8. 1993: eff. Apr. 28, 1993. Amended F. Aug. 9. 1993: eff. Aug29.<br />
1993.: Amended: F. Aug. 30. 1995: Eff. Sept 19. 1995 Amended: ER. 391-3-6 was filed May. 1,1996, eff. April 25. 1996, the date of adoption to remain<br />
in effect for a period of 120 days or until the effective date of a permanent Rule covering the same subject matter superseding this ER, as specified by the<br />
Agency. Amended: F. July 10. 1996. Eff. July 30. 1996. Amended: F. Oct 17. 1996; Eff. Nov. 6, 1996. Amended: F. May 2. 1997; Eff. May 22. 1997.<br />
226
APPENDIX C (Part 2 -- <strong>National</strong> Primary Drinking <strong>Water</strong> Regulations)<br />
(in mg/L unless otherwise specified). From U.S. Environmental Protection Agency<br />
www.epa.gov/OST, July, 1999.<br />
Inorganic<br />
Chemicals MCLG<br />
(see footnote)<br />
MCL<br />
(see<br />
footnote)<br />
Potential<br />
Health<br />
227<br />
Effects<br />
Antimony 0.006 0.006 Increase in blood<br />
cholesterol;<br />
decrease in blood<br />
glucose<br />
Arsenic none 0.05 Skin damage;<br />
circulatory system<br />
problems;<br />
increased risk of<br />
cancer<br />
Asbestos 7 million<br />
fibers per<br />
Liter<br />
(fiber >10 micrometers)<br />
Barium 2 2 Increase in blood<br />
pressure<br />
Sources of the Contaminant<br />
Discharge from petroleum refineries; fire<br />
retardants; ceramics; electronics; solder<br />
Discharge from semiconductor<br />
manufacturing; petroleum refining; wood<br />
preservatives; animal feed additives;<br />
herbicides; erosion of natural deposits<br />
7 MFL Increased risk of Decay of asbestos cement in water mains;<br />
developing benign erosion of natural deposits<br />
intestinal polyps<br />
Discharge of drilling wastes; discharge from<br />
metal refineries; erosion of natural deposits<br />
Beryllium 0.004 0.004 Intestinal lesions Discharge from metal refineries and coalburning<br />
factories; discharge from electrical,<br />
aerospace, and defense industries<br />
Cadmium 0.005 0.005 Kidney damage Corrosion of galvanized pipes; erosion of<br />
natural deposits; discharge from metal<br />
refineries; runoff from waste batteries and<br />
paints<br />
Chromium (total) 0.1 0.1 Some people who<br />
use water<br />
containing<br />
chromium well in<br />
excess of the<br />
MCL over many<br />
years could<br />
experience<br />
Copper 1.3 Action<br />
Level=1.3;<br />
TT<br />
Discharge from steel and pulp mills; erosion<br />
of natural deposits<br />
allergic dermatitis<br />
Short term exposure: Gastrointestinal distress.
Cyanide (as free<br />
cyanide)<br />
Long term exposure: Liver or kidney damage. Those with Wilson's<br />
Disease should consult their personal doctor if their water systems<br />
exceed the copper action level.<br />
0.2 0.2 Nerve damage or<br />
thyroid problems<br />
Fluoride 4 4 Bone disease<br />
(pain and<br />
tenderness of the<br />
bones); Children<br />
may get mottled<br />
Lead zero Action<br />
Level=0.01<br />
5; TT<br />
teeth.<br />
Infants and<br />
children: Delays in<br />
physical or mental<br />
228<br />
Discharge from steel/metal factories;<br />
discharge from plastic and fertilizer factories<br />
<strong>Water</strong> additive which promotes strong teeth;<br />
erosion of natural deposits; discharge from<br />
fertilizer and aluminum factories<br />
Corrosion of household plumbing systems;<br />
erosion of natural deposits<br />
development.<br />
Adults: Kidney problems; high blood pressure<br />
Inorganic Mercury 0.002 0.002 Kidney damage Erosion of natural deposits; discharge from<br />
refineries and factories; runoff from landfills<br />
and cropland<br />
Nitrate (measured as<br />
Nitrogen)<br />
Nitrite (measured as<br />
Nitrogen)<br />
10 10 "Blue baby<br />
syndrome" in<br />
infants under six<br />
months - life<br />
threatening<br />
without immediate<br />
Runoff from fertilizer use; leaching from<br />
septic tanks, sewage; erosion of natural<br />
deposits<br />
medical attention.<br />
Symptoms: Infant looks blue and has shortness of breath.<br />
1 1 "Blue baby<br />
syndrome" in<br />
infants under six<br />
months - life<br />
threatening<br />
without immediate<br />
Selenium 0.05 0.05 Hair or fingernail<br />
loss; numbness in<br />
fingers or toes;<br />
circulatory<br />
Runoff from fertilizer use; leaching from<br />
septic tanks, sewage; erosion of natural<br />
deposits<br />
medical attention.<br />
Symptoms: Infant looks blue and has shortness of breath.<br />
problems<br />
Thallium 0.0005 0.002 Hair loss; changes<br />
in blood; kidney,<br />
intestine, or liver<br />
problems<br />
(in mg/L unless otherwised specified)<br />
Discharge from petroleum refineries; erosion<br />
of natural deposits; discharge from mines<br />
Leaching from ore-processing sites;<br />
discharge from electronics, glass, and<br />
pharmaceutical companies
<strong>National</strong> Secondary Drinking <strong>Water</strong> Regulations<br />
(or "secondary standards")<br />
Contaminant Secondary Standard<br />
Aluminum 0.05 to 0.2 mg/L<br />
Chloride 250 mg/L<br />
Color 15 (color units)<br />
Copper 1.0 mg/L<br />
Corrosivity noncorrosive<br />
Fluoride 2.0 mg/L<br />
Foaming Agents 0.5 mg/L<br />
Iron 0.3 mg/L<br />
Manganese 0.05 mg/L<br />
Odor 3 threshold odor number<br />
pH 6.5-8.5<br />
Silver 0.10 mg/L<br />
Sulfate 250 mg/L<br />
Total Dissolved Solids 500 mg/L<br />
Zinc 5 mg/L<br />
Maximum Contaminant Level Goal (MCLG) - The maximum level of a contaminant in drinking water at<br />
which no known or anticipated adverse effect on the health effect of persons would occur, and which<br />
allows for an adequate margin of safety. MCLGs are non-enforceable public health goals.<br />
Maximum Contaminant Level (MCL) - The maximum permissible level of a contaminant in water which is<br />
delivered to any user of a public water system. MCLs are enforceable standards. The margins of safety in<br />
MCLGs ensure that exceeding the MCL slightly does not pose significant risk to public health.<br />
1 Units are in milligrams per Liter (mg/L) unless otherwise noted.<br />
229
APPENDIX D. U.S. Geological Survey gaging stations within the Chattahoochee River<br />
<strong>National</strong> Recreation Area, including sites no longer active. See Table 4.2.a<br />
in Section 4.2 for the principal, active gaging stations.<br />
Station Number Station Name County Hydrologic Unit Code<br />
2334430 Chattahoochee River At<br />
Buford Dam Nr Buford, Ga.<br />
Gwinnett 3130001<br />
2334480 Richland Creek Near Buford,<br />
Ga.<br />
2334500 Chattahoochee River Near<br />
Buford, Ga.<br />
2334580 Level Creek At Settles Bridge<br />
Rd Nr Suwanee, Ga.<br />
2334880 Mill Creek At Wildwood<br />
Road Near Suwanee, Ga.<br />
2334885 Suwanee Creek At Us Rt 23<br />
At Suwanee, Ga.<br />
2334950 Chattahoochee River (Ga<br />
Hwy 120) At Duluth, Ga.<br />
2335000 Chattahoochee River Near<br />
Norcross, Ga.<br />
2335340 Chattahoochee R (Holcomb<br />
Br Rd) Nr Norcross, Ga.<br />
2335347 Crooked C Tr #2 (Holcomb<br />
Br Rd) Nr Norcross, Ga. Me<br />
2335450 Chattahoochee River At Eves<br />
Rd Ab Roswell, Ga.<br />
2335500 Chattahoochee River Near<br />
Roswell, Ga.<br />
2335600 Big Creek (State Bridge Rd)<br />
Nr Alpharetta, Ga.<br />
2335700 Big Creek Near Alpharetta,<br />
Ga.<br />
2335830 Chattahoochee R At Johnson<br />
Fy Rd Nr Atl, Ga.<br />
2335840 Sope Creek (Page St) At<br />
Marietta, Georgia<br />
2335844 Sope Creek (Us 41) At<br />
Marietta, Georgia<br />
2335846 Sope Creek (I-75) Near<br />
Marietta, Georgia<br />
2335850 Sope Creek (Barnes Mill Rd)<br />
Nr Marietta, Georgia<br />
2335854 Sope Creek (Loop 120n) Near<br />
Marietta, Georgia<br />
2335858 Sope Creek (Loop 120s) Near<br />
Marietta, Georgia<br />
2335859 Sope Creek (Roswell Rd)<br />
Near Marietta, Georgia<br />
230<br />
Gwinnett 3130001<br />
Gwinnett 3130001<br />
Gwinnett 3130001<br />
Gwinnett 3130001<br />
Gwinnett 3130001<br />
Gwinnett 3130001<br />
Gwinnett 3130001<br />
Gwinnett 3130001<br />
Gwinnett 3130001<br />
Fulton 3130001<br />
Fulton 3130001<br />
Fulton 3130001<br />
Fulton 3130001<br />
Fulton 3130001<br />
Cobb 3130001<br />
Cobb 3130001<br />
Cobb 3130001<br />
Cobb 3130001<br />
Cobb 3130001<br />
Cobb 3130001<br />
Cobb 3130001
2335860 Sope Creek (Holt Rd) Near<br />
Marietta, Georgia<br />
2335864 Sope Creek (Old Canton Rd)<br />
Nr Marietta, Georgia<br />
2335870 Sope Creek (S Roswell Rd)<br />
Nr Marietta, Ga.<br />
2335874 Sope Creek (Paper Mill Rd)<br />
Nr Marietta, Georgia<br />
2335880 Chatt R At Powers Fy & I-<br />
285 Nr Atlanta, Ga.<br />
2335888 Rottenwood Creek (Barclay<br />
Cir) At Marietta, Ga.<br />
2335891 Rottenwood Creek (Us Hwy<br />
41) Nr Marietta, Ga.<br />
2335894 Rottenwood Creek (Franklin<br />
Rd) At Marietta, Ga.<br />
2335895 Rottenwood Creek (I-75) At<br />
Marietta, Georgia<br />
2335897 Rottenwood Creek (Delk Rd)<br />
At Marietta, Georgia<br />
2335900 Rottenwood C (Terrell Mill<br />
Rd) Nr Marietta, Ga.<br />
2335905 Rottenwood C (Windy Hill<br />
Rd) Nr Smyrna, Georgia<br />
2335910 Rottenwood C (Interstate N<br />
Pkwy) Nr Smyrna, Ga.<br />
2335912 Rottenwood Creek (I-285<br />
East) Nr Smyrna, Ga<br />
231<br />
Cobb 3130001<br />
Cobb 3130001<br />
Cobb 3130001<br />
Cobb 3130001<br />
Fulton 3130001<br />
Cobb 3130001<br />
Cobb 3130001<br />
Cobb 3130001<br />
Cobb 3130001<br />
Cobb 3130001<br />
Cobb 3130001<br />
Cobb 3130001<br />
Cobb 3130001<br />
Cobb 3130001
Fecal coliforms, MPN/100<br />
ml<br />
mg/L BOD<br />
Percent Saturation<br />
1.2<br />
1<br />
0.8<br />
0.6<br />
0.4<br />
0.2<br />
0<br />
500<br />
450<br />
400<br />
350<br />
300<br />
250<br />
200<br />
150<br />
100<br />
50<br />
0<br />
100<br />
90<br />
80<br />
70<br />
60<br />
50<br />
APPENDIX E<br />
B O D in the R iver at the<br />
G w innett C ounty W ater Intake<br />
1986 1987 1988 1989 1990 1991 1992 1993 1994<br />
Y e a r (m edian num ber of sam ples = 12/year)<br />
F e c a l C o lifo r m C o u n ts in th e R iv e r a t th e<br />
G w in n ett C o u n ty W a ter In ta k e<br />
1986 1987 1988 1989 1990 1991 1992 1993 1994<br />
Y e a r (m edian num ber of sam ples = 12/year)<br />
D O in the R iver at the<br />
G w in n ett C ou n ty W ater In tak e<br />
1986 1987 1988 1989 1990 1991 1992 1993 1994<br />
Y e a r (m edian num ber of sam ples = 12/year)<br />
Figure E.a. (Appendix E). <strong>Water</strong> quality at the Gwinnett County water intake<br />
during the period 1986 to 1994 for BOD-5, fecal coliform, and dissolved<br />
oxygen annual mean values. Data from the U.S. Geological Survey and<br />
Atlanta Regional Commission.<br />
232
Mg/L NH 4 -N<br />
Mg/L NO 2 +NO 3<br />
Mg/l Total Phosphorus<br />
0.12<br />
0.1<br />
0.08<br />
0.06<br />
0.04<br />
0.02<br />
0<br />
0.35<br />
0.3<br />
0.25<br />
0.2<br />
0.15<br />
0.1<br />
0.05<br />
0<br />
0.12<br />
0.1<br />
0.08<br />
0.06<br />
0.04<br />
0.02<br />
0<br />
T o t a l N H 4 -N in th e R iv er a t th e<br />
G w in n ett C o u n ty W a ter In ta k e<br />
1986 1987 1988 1989 1990 1991 1992 1993 1994<br />
Y e a r (m edian num ber of sam ples = 12/year)<br />
T o t a l N O 2 + N O 3 -N in th e R iv er a t th e<br />
G w in n ett C o u n ty W a ter In ta k e<br />
1986 1987 1988 1989 1990 1991 1992 1993 1994<br />
Y e a r (m edian num ber of sam ples = 12/year)<br />
Total Phosphorus in the R iver at the<br />
G winnett County W ater Intake<br />
1986 1987 1988 1989 1990 1991 1992 1993 1994<br />
Year (m edian num ber of sam ples = 12/year)<br />
Figure E.b (Appendix E). <strong>Water</strong> quality at the Gwinnett County water intake during the period<br />
1986 to 1994, showing ammonia, nitrate, and total phosphorus mean annual values. Data are<br />
from the U.S. Geological Survey and the Atlanta Regional Commission.<br />
233
FCs, MPN/100ml<br />
Percent saturation<br />
Mg/L BOD<br />
1.4<br />
1.2<br />
1<br />
0.8<br />
0.6<br />
0.4<br />
0.2<br />
0<br />
1400<br />
1200<br />
1000<br />
800<br />
600<br />
400<br />
200<br />
100<br />
90<br />
80<br />
70<br />
60<br />
50<br />
0<br />
B O D in t h e R iv e r a t t h e<br />
D e k a lb C o u n t y W a t e r I n t a k e<br />
1986 1987 1988 1989 1990 1991 1992 1993 1994 1995<br />
Y e a r (m edian num ber of sam ples = 12/year)<br />
F ecal C oliform s in th e R iver at th e<br />
Dekalb County W ater Intake<br />
1986 1987 1988 1989 1990 1991 1992 1993 1994 1995<br />
Year (m edian num ber of sam ples = 12/year)<br />
D O in th e R iv e r a t th e<br />
Dekalb County W ater Intake<br />
1986 1987 1988 1989 1990 1991 1992 1993 1994 1995<br />
Y e a r (m edian num ber of sam ples = 12/year)<br />
Figure E.c (Appendix E). <strong>Water</strong> quality at the DeKalb County water intake during the<br />
period 1986 to 1995 for BOD-5, fecal coliform, and dissolved oxygen mean annual<br />
values. Data are from the U.S. Geological Survey and the Atlanta Regional Commission.<br />
234
Mg/L NH 4 -N<br />
Mg/L NO 2 +NO 3<br />
Mg/L Total Phosphorus<br />
0.09<br />
0.08<br />
0.07<br />
0.06<br />
0.05<br />
0.04<br />
0.03<br />
0.02<br />
0.01<br />
0<br />
0.4<br />
0.35<br />
0.3<br />
0.25<br />
0.2<br />
0.15<br />
0.1<br />
0.05<br />
0<br />
0.18<br />
0.16<br />
0.14<br />
0.12<br />
0.1<br />
0.08<br />
0.06<br />
0.04<br />
0.02<br />
0<br />
T o t a l N H 4 -N in th e R iver at th e<br />
D e k a lb C o u n t y W a t e r I n t a k e<br />
1986 1987 1988 1989 1990 1991 1992 1993 1994 1995<br />
Y e a r (m edian num ber of sam ples = 12/year)<br />
Total NO 2 + NO 3 -N in th e R iver at th e<br />
D e k a lb C o u n ty W a te r I n ta k e<br />
1986 1987 1988 1989 1990 1991 1992 1993 1994 1995<br />
Y e a r (m edian num ber of sam ples = 12/year)<br />
T o ta l P h o sp h oru s in th e R iver a t th e<br />
Dekalb County W ater Intake<br />
1986 1987 1988 1989 1990 1991 1992 1993 1994 1995<br />
Year (m edian num ber of sam ples = 12/year)<br />
Figure E.d (Appendix E). <strong>Water</strong> quality at the DeKalb County water intake during<br />
the period 1986 to 95 for Total NH4-N, Total NO2 + NO3-N, and total phosphorus<br />
mean annual values. The data are from the U.S. Geological Survey and the<br />
Atlanta Regional Commission.<br />
235
APPENDIX F<br />
This appendix (plus the map of the Island Ford and Vickery Creek units in<br />
Figure 1.1.c) shows nine closeup maps of individual park units in the<br />
CRNRA, comparing the 100-year floodplain lines to existing park unit<br />
boundaries.<br />
236
237
238
239
240
241
242
243
244