Memorandum - Low-Energy Muons
Memorandum - Low-Energy Muons
Memorandum - Low-Energy Muons

You also want an ePaper? Increase the reach of your titles
YUMPU automatically turns print PDFs into web optimized ePapers that Google loves.
PAUL SCHERRER INSTITUT<br />
Date:<br />
From:<br />
Phone:<br />
Room:<br />
E-mail:<br />
15/Dec/2006<br />
T. Prokscha<br />
4275<br />
WLGA / U119<br />
thomas.prokscha@psi.ch<br />
Background in LE- SR decay histograms<br />
<strong>Memorandum</strong><br />
To:<br />
cc:<br />
LEM group<br />
LEM user<br />
¡£¢¥¤ This memo explains the contributions to the measured background per bin in low-energy §¦<br />
(LE- ¦ (¨©<br />
¦<br />
(<br />
¨©<br />
¨©<br />
<br />
or LEM) raw decay histograms, with no post-pileup rejection of trigger detector , the<br />
“start” detector for the LE- SR measurement) and positron ) signals. The motivation to have the<br />
post-pileup rejection disabled in the data acquisition logic arises from the fact that the signals<br />
have correlated after-pulses, see Fig. 4. However, the absence of -post-pileup rejection results in<br />
an additional contribution to the background at times , where denotes the mean implantation<br />
time of the low-energy ¦<br />
¡£¢¥¤£¡£¢¥¤<br />
<br />
<br />
¡£¢¥¤ ¨©<br />
. As will be shown below, the ratio can be<br />
used to determine the detection efficiency of the trigger detector, therefore giving the possibility<br />
to continuously monitor (which is an important issue since the number of holes in the carbon<br />
foil of increases with time...). Furthermore, the background can be calculated in an<br />
easy way to be compared with fit results.<br />
On the other hand for data analysis it is of advantage to have , since in this case the background<br />
can be determined independently from the interval at , which at present has a width of about<br />
400 ns in the LEM experiment. This is achieved by rejecting those events which have i) ¨© a<br />
post-pileup, ii) <br />
¦<br />
a post-pileup and, iii) where a <br />
¦<br />
2nd detector was hit at the same time. At the<br />
moment, histograms with these additional cuts can be generated offline from the event-by-event data<br />
file. Starting in 2007 a 2nd set of histograms with post-pileup rejection enabled will be created by<br />
the LEM analyzer program, thus providing both sets of histograms online. The effect of post-pileup<br />
rejection on background and signal rates: in 2006, measured s-N with moderator, the raw event<br />
rate drops to 73.0%, whereas the background-corrected muon rate decreases to 84.7% (Run 1133,<br />
applied cuts: reject TD post-pileup, 2nd positron, require only one positron).<br />
The following definitions are used in the derivation of the equations describing the different background<br />
contributions:<br />
<br />
<br />
the positron rate of coincidences is denoted <br />
¦<br />
by<br />
positron detector pair to the run summary file.<br />
the positron rate consists of two components:<br />
¦<br />
<br />
¦ <br />
¦ , where<br />
<br />
, and its run average is written for each<br />
<br />
¦ – is the rate of uncorrelated positrons from scattered beam positrons. This rate can<br />
be measured experimentally by switching off the Mirror of the transport system.
¦ – is the rate of positrons from muons decaying in the sample region. Experimentally, it<br />
is derived by <br />
¦ measuring as described above:<br />
¦ <br />
¦ ¡ <br />
¦ .<br />
<br />
¢ is the bin width in the decay histogram.<br />
<br />
¨© ¦¥¨§© denotes the total number of ¨© ¥¨§© hits (a ¨© without pre-pileup) in a run,<br />
¤£<br />
which is the number of “starts” for the data acquisition logic. This number is available in the<br />
summary file (or in the “VME STATS” section of ODB, accessible on the Midas Status page).<br />
The background consists of the three components:<br />
<br />
¦ 1. uncorrelated background due to , contributing for all .<br />
2. correlated background, where the ¦ ¨© ¨©<br />
<br />
¦<br />
was not detected by , but another hit on started<br />
the measurement:<br />
, contributing for all .<br />
3. correlated background, where a ¦<br />
is detected ¨© in , but as a post-pileup, i.e., the start hit in<br />
is from an ion or beam positron (see Fig. 2):<br />
¨©<br />
<br />
¦ , contributing only at .<br />
<br />
Then, the background in the raw LEM decay histograms can be written, for ¢ ¦ (see also<br />
Fig. 1):<br />
<br />
¡ § <br />
¡ § <br />
¦<br />
<br />
¦<br />
¨© ¦¥§© ¢ <br />
¡£¢¥¤<br />
(1)<br />
¦<br />
¨© ¦¥§© ¢ <br />
¡£¢¥¤ ¨© ¦¥§© ¢ <br />
¡ § <br />
¦<br />
The ratio of background before and after can be derived from Eq. 1 and Eq. 2:<br />
¡£¢¥¤£<br />
¡£¢¥¤£<br />
<br />
<br />
£ ¡ § ¦ <br />
¦<br />
¨© from which the efficiency of the detector is obtained:<br />
If we write <br />
and<br />
<br />
¦<br />
<br />
<br />
¦ eqs. 3 and 4 can be rewritten as<br />
£ ¡£¢¥¤<br />
£ ¡£¢¥¤<br />
<br />
<br />
<br />
¦<br />
¦<br />
(2)<br />
¦<br />
(3)<br />
¥ ¡ <br />
¦<br />
¦ (4)<br />
<br />
¡ ¥ ¡ <br />
<br />
<br />
¡ <br />
<br />
Figure 3 illustrates, how can be determined by a fit of Eq. 5 to the data.<br />
(5)<br />
¡ <br />
<br />
(6)<br />
<br />
PAUL SCHERRER INSTITUTE, CH-5232 Villigen PSI, Switzerland Page 2
1000<br />
900<br />
800<br />
700<br />
600<br />
500<br />
400<br />
300<br />
200<br />
100<br />
t0<br />
0<br />
0 2 4 6 8 10 12<br />
time ( μs)<br />
Fri Dec 15 11:25:16 2006<br />
Background contributions 40 to LEM decay histograms<br />
bkg = Σ(TD-clean)<br />
× Δt<br />
×<br />
[e<br />
+<br />
uncorr<br />
+<br />
bkg = Σ(TD-clean)<br />
× Δt<br />
× ε × e<br />
TD μ<br />
bkg(tt ) = Σ(TD-clean)<br />
× Δt<br />
× e<br />
0<br />
uncorr<br />
+(1- ε ) × TD<br />
+(1- ε ) × TD<br />
<br />
¨© ¥¨§© ¨© ¦¥¨§©<br />
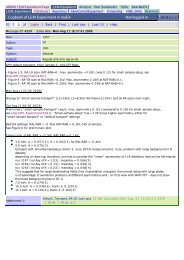
Figure 1: Background contributions to the LEM raw decay histograms. The difference in background<br />
between and arises from the non-rejection of post-pileups in the LEM data<br />
acquisition logic, as described in the text. Here, is the total number of in a<br />
run, ¢ is the bin width, <br />
¦<br />
<br />
efficiency ¨© of .<br />
<br />
§ <br />
¦<br />
+<br />
μ<br />
e ]<br />
+<br />
μ<br />
e ]<br />
is the measured positron rate, and is the detection<br />
¦<br />
PAUL SCHERRER INSTITUTE, CH-5232 Villigen PSI, Switzerland Page 3
1000<br />
900<br />
800<br />
700<br />
600<br />
500<br />
400<br />
300<br />
200<br />
100<br />
0<br />
0 2 4 6 8 10 12 14<br />
time ( μs)<br />
+ μ bkg<br />
Fri Dec 15 10:36:02 2006<br />
40 +<br />
+<br />
Reverse Muon decay histogram: e start, μ stop<br />
bkg<br />
+ μ<br />
delay<br />
bkg bkg<br />
¨©<br />
<br />
¦<br />
<br />
¦<br />
¨©<br />
¨©<br />
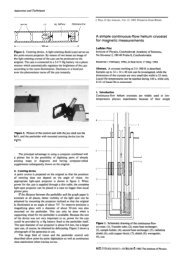
Figure 2: This figure illustrates, how and why a missing post-pileup rejection yields additional<br />
background in the region of the signal, i.e. the exponential part. Considering it with respect to the<br />
hit makes it more clear (at least for me...): the hypothetical histogram show the muon decay where<br />
the start is given by the decay , and the stop by the delayed hit. Beneath the histogram three<br />
pulse sequences with post-pileup are shown, which all do contribute to the histogram entries.<br />
The 1st sequence with the ¦ at 2.5 s followed by a background (bkg) hit at 4 s is a good event<br />
which would have been lost if pileup rejection were enabled. The 2nd sequence shows that the stop<br />
at 6 s is made by the wrong bkg hit which is followed by a ¦ ¦<br />
( ¡ <br />
¨©<br />
hit at 9 s; so, we got the wrong stop,<br />
i.e. a real contribution to background. This background event were rejected if post-pileup rejection<br />
were enabled. At s no do contribute to the background 100% assumed),<br />
only uncorrelated hits, as is illustrated by the 3rd sequence. Therefore, the bkg in this region is<br />
smaller than in the region with signal, i.e. the part with the exponential decay.<br />
PAUL SCHERRER INSTITUTE, CH-5232 Villigen PSI, Switzerland Page 4
r<br />
Left e+ detector<br />
3<br />
2.8<br />
2.6<br />
2.4<br />
2.2<br />
2<br />
1.8<br />
3<br />
2.8<br />
2.6<br />
2.4<br />
2.2<br />
2<br />
1.8<br />
Fri Dec 15 17:37:32 2006<br />
2 χ / ndf 6.851 / 4<br />
Prob 0.144<br />
x 0.8057 ± 0.1265<br />
epsTD 0.7507 ± 0.1179<br />
1136 1137 1138 1139 1140 1141<br />
Run<br />
Right e+ detector<br />
χ 2 / ndf 1.411 / 4<br />
Prob 0.8422<br />
x 0.6241 ± 0.1293<br />
epsTD 0.7751 ± 0.1605<br />
1136 1137 1138 1139 1140 1141<br />
Run<br />
r<br />
r<br />
Top e+ detector<br />
3<br />
2.8<br />
2.6<br />
2.4<br />
2.2<br />
2<br />
1.8<br />
3<br />
2.8<br />
2.6<br />
2.4<br />
2.2<br />
2<br />
1.8<br />
χ 2 / ndf 1.545 / 4<br />
Prob 0.8186<br />
x 0.7876 ± 0.1298<br />
epsTD 0.7339 ± 0.1209<br />
1136 1137 1138 1139 1140 1141<br />
Run<br />
Bottom e+ detector<br />
χ 2 / ndf 4.624 / 4<br />
Prob 0.3281<br />
x 0.8013 ± 0.1308<br />
epsTD 0.7512 ± 0.1227<br />
1136 1137 1138 1139 1140 1141<br />
Run<br />
Figure 3: Fit of Eq. 5 to the data to determine . Due to the strong correlation with the 2nd fit<br />
parameter (which in principal could be fixed, because it can be determined experimentally) the<br />
errors of the fit are large. But this figure is just to demonstrate, how it works.<br />
PAUL SCHERRER INSTITUTE, CH-5232 Villigen PSI, Switzerland Page 5
counts per TDC bin<br />
TD 1st pileup Run lem06_0667<br />
600<br />
500<br />
400<br />
300<br />
200<br />
100<br />
TD pileup spectrum<br />
hPileUp00<br />
Entries 2011861<br />
Mean 2.239e+04<br />
RMS 1.439e+04<br />
Underflow 7<br />
Overflow 1.173e+06<br />
Integral 8.39e+05<br />
0<br />
0 5000 10000 15000 20000 25000 30000 35000 40000 45000 50000<br />
TD 2nd pileup Run lem06_0667<br />
35<br />
30<br />
25<br />
20<br />
15<br />
10<br />
5<br />
hPileUp01<br />
Entries 619092<br />
Mean 2.839e+04<br />
RMS 1.336e+04<br />
Underflow 2<br />
Overflow 4.545e+05<br />
Integral 1.646e+05<br />
0<br />
0 5000 10000 15000 20000 25000 30000 35000 40000 45000 50000<br />
time (TDC bins, 1bin=195.3125 ps)<br />
Fri Dec 15 12:24:25 2006<br />
Figure 4: Measured post-pileup spectrum of the “trigger detector” ¨© . Shown are the spectra of the<br />
1st and 2nd post-pileup hit. The peaks are partially real, i.e. they move when changing the transport<br />
energy of the LEM apparatus, and partially generated by the electronics.<br />
PAUL SCHERRER INSTITUTE, CH-5232 Villigen PSI, Switzerland Page 6
Appendix<br />
The background after post-pileup rejections reads<br />
© ¥¨§© ¢ <br />
¨© ¡£¢¥¤<br />
£ ¡ <br />
¦<br />
and is now independent on . The integrated number £ ¨© © <br />
provided in the summary file from 2007 on.<br />
Further information:<br />
(7)<br />
¦<br />
¦¥¨§© of accepted ¨© ¥¨§© will be<br />
For more information on background contributions at continuous-particle beams, check, for<br />
<br />
example, Appendix B of [1]. The effect of non-post-pileup rejection on time-of-flight spectra<br />
has been discussed in [2] (the thereabouts derived equations are an approximation). Note, that<br />
the equations presented here are only valid for the case ¢ <br />
¦ .<br />
<br />
¡£¢¥¤ <br />
¡£¢¥¤ £¡£¢¥¤ <br />
Used Root macros, available in LEM SVN repository in analysis/root/macros:<br />
– bkgTFFit.C to do a simple TF fit with gaussian relaxation to determine at and<br />
at , determine the ratio .<br />
References:<br />
– bkgZFFit.C, analogous for ZF runs.<br />
– defineFit.C, used in the other two macros to define simple fit functions.<br />
[1] T. Prokscha, E. Morenzoni, M. Meyberg, T. Wutzke, B.E. Matthias, A. Fachat, K. Jungmann,<br />
and G. zu Putlitz, Muonium formation by collisions of muons with solid rare-gas and solid<br />
nitrogen layers, Phys. Rev. A58, 3739 (1998).<br />
[2] T. Prokscha, PSI <strong>Memorandum</strong> Nachweiseffizienz S1 für Myonen, Run IX,X, 17-Mar-1998.<br />
PAUL SCHERRER INSTITUTE, CH-5232 Villigen PSI, Switzerland Page 7