Relative quantification guide
Relative quantification guide
Relative quantification guide

Create successful ePaper yourself
Turn your PDF publications into a flip-book with our unique Google optimized e-Paper software.
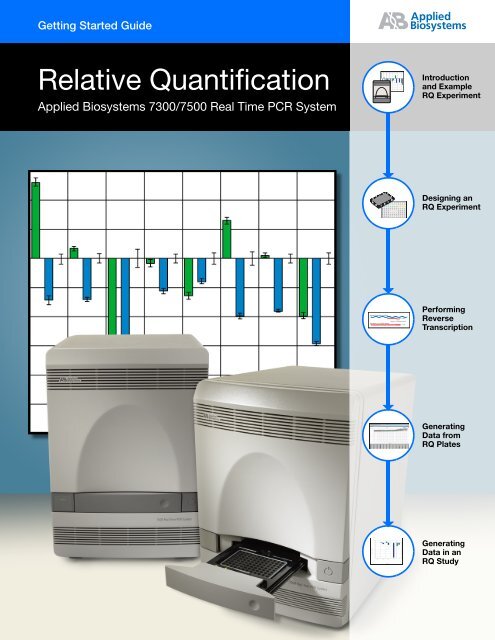
Getting Started Guide<br />
<strong>Relative</strong> Quantification<br />
Applied Biosystems 7300/7500 Real Time PCR System<br />
Primer Extended on mRNA<br />
5′ 3′<br />
5′ cDNA<br />
Reverse<br />
Primer<br />
Oligo d(T) or random hexamer<br />
Synthesis of 1st cDNA strand<br />
3′ 5′ cDNA<br />
Introduction<br />
and Example<br />
RQ Experiment<br />
Designing an<br />
RQ Experiment<br />
Performing<br />
Reverse<br />
Transcription<br />
Generating<br />
Data from<br />
RQ Plates<br />
Generating<br />
Data in an<br />
RQ Study
© Copyright 2004, Applied Biosystems. All rights reserved.<br />
For Research Use Only. Not for use in diagnostic procedures.<br />
Authorized Thermal Cycler<br />
This instrument, Serial No___________, is an Authorized Thermal Cycler. Its purchase price includes the up-front fee<br />
component of a license under United States Patent Nos. 4,683,195, 4,683,202 and 4,965,188, owned by Roche<br />
Molecular Systems, Inc., and under corresponding claims in patents outside the United States, owned by F. Hoffmann-<br />
La Roche Ltd, covering the Polymerase Chain Reaction ("PCR") process to practice the PCR process for internal<br />
research and development using this instrument. The running royalty component of that license may be purchased<br />
from Applied Biosystems or obtained by purchasing Authorized Reagents. This instrument is also an Authorized<br />
Thermal Cycler for use with applications licenses available from Applied Biosystems. Its use with Authorized<br />
Reagents also provides a limited PCR license in accordance with the label rights accompanying such reagents.<br />
Purchase of this product does not itself convey to the purchaser a complete license or right to perform the PCR<br />
process. Further information on purchasing licenses to practice the PCR process may be obtained by contacting the<br />
Director of Licensing at Applied Biosystems, 850 Lincoln Centre Drive, Foster City, California 94404.<br />
DISCLAIMER OF LICENSE: No rights for any application, including any in vitro diagnostic application, are<br />
conveyed expressly, by implication or by estoppel under any patent or patent applications claiming homogeneous or<br />
real-time detection methods, including patents covering such methods used in conjunction with the PCR process or<br />
other amplification processes. The 5' nuclease detection assay and certain other homogeneous or real-time<br />
amplification and detection methods are covered by United States Patent Nos. 5,210,015, 5,487,972, 5,804,375 and<br />
5,994,056, owned by Roche Molecular Systems, Inc.; by corresponding patents and patent applications outside the<br />
United States, owned by F. Hoffmann-La Roche Ltd; and by United States Patent Nos. 5,538,848 and 6,030,787, and<br />
corresponding patents and patent applications outside the United States, owned by Applera Corporation. Purchase of<br />
this instrument conveys no license or right under the foregoing patents. Use of these and other patented processes in<br />
conjunction with the PCR process requires a license. For information on obtaining licenses, contact the Director of<br />
Licensing at Applied Biosystems, 850 Lincoln Centre Drive, Foster City, California 94404, or The Licensing<br />
Department, Roche Molecular Systems, Inc., 1145 Atlantic Avenue, Alameda, California, 94501, USA.<br />
Trademarks<br />
Applied Biosystems, MicroAmp, Primer Express, ROX, and VIC are registered trademarks of Applera Corporation or<br />
its subsidiaries in the US and/or certain other countries.<br />
AB (Design), ABI PRISM, Applera, Assays-by-Design, Assays-on-Demand, Celera Genomics, FAM, iScience,<br />
iScience (Design), and MultiScribe are trademarks of Applera Corporation or its subsidiaries in the US and/or certain<br />
other countries.<br />
AmpErase, AmpliTaq Gold, and TaqMan are registered trademarks of Roche Molecular Systems, Inc.<br />
SYBR Green is a registered trademark of Molecular Probes, Inc.<br />
Microsoft and Windows are registered trademarks of Microsoft Corporation.<br />
All other trademarks are the sole property of their respective owners.<br />
Part Number 4347824 Rev. A<br />
1/2004<br />
ii <strong>Relative</strong> Quantification Getting Started Guide for the 7300/7500 System
Chapter<br />
Chapter<br />
Chapter<br />
Chapter<br />
Chapter<br />
1<br />
2<br />
3<br />
4<br />
5<br />
Primer Extended on mRNA<br />
5′ 3′<br />
5′ cDNA<br />
Reverse<br />
Primer<br />
Oligo d(T) or random hexamer<br />
Synthesis of 1st cDNA strand<br />
3′ 5′ cDNA<br />
Introduction<br />
and Example<br />
RQ Experiment<br />
Designing<br />
an RQ<br />
Experiment<br />
Performing<br />
Reverse<br />
Transcription<br />
Generating<br />
Data from<br />
RQ Plates<br />
Performing<br />
an RQ Study<br />
About the<br />
7300/7500 system<br />
Select the<br />
PCR method<br />
Isolate total RNA<br />
Prepare the<br />
PCR Master Mix<br />
Create a new<br />
RQ Study document<br />
About relative<br />
<strong>quantification</strong><br />
Specify the components<br />
of an RQ experiment<br />
Adjust RNA<br />
concentration<br />
Prepare the<br />
reaction plate<br />
Configure<br />
analysis settings<br />
Create a new<br />
RQ Plate document<br />
Adjust the<br />
baseline and<br />
threshold<br />
About<br />
RQ experiments<br />
Select the chemistry<br />
Convert<br />
total RNA to cDNA<br />
Program the<br />
thermal cycling<br />
conditions<br />
Example<br />
RQ experiment<br />
Select one-step or<br />
two-step RT-PCR<br />
<strong>Relative</strong> Quantification Getting Started Guide for the 7300/7500 System iii<br />
Analyze and<br />
view results<br />
Save the<br />
RQ Plate<br />
document<br />
If necessary,<br />
omit samples<br />
Start the run<br />
Export AQ<br />
Plate document,<br />
if desired<br />
RQ Experiment Workflow<br />
Choose probes<br />
and primers<br />
View<br />
RQ plate data<br />
Primer Extended on mRNA<br />
5′ 3′<br />
5′ cDNA<br />
Reverse<br />
Primer<br />
Oligo d(T) or random hexamer<br />
Synthesis of 1st cDNA strand<br />
3′ 5′ cDNA
iv <strong>Relative</strong> Quantification Getting Started Guide for the 7300/7500 System
Contents<br />
RQ Experiment Workflow iii<br />
Preface vii<br />
How to Use This Guide . . . . . . . . . . . . . . . . . . . . . . . . . . . . . . . . . . . . . . . . . . . . . . . . vii<br />
How to Obtain More Information . . . . . . . . . . . . . . . . . . . . . . . . . . . . . . . . . . . . . . . . viii<br />
How to Obtain Services and Support . . . . . . . . . . . . . . . . . . . . . . . . . . . . . . . . . . . . . viii<br />
Send Us Your Comments . . . . . . . . . . . . . . . . . . . . . . . . . . . . . . . . . . . . . . . . . . . . . . viii<br />
Chapter 1 Introduction and Example RQ Experiment 1<br />
Overview . . . . . . . . . . . . . . . . . . . . . . . . . . . . . . . . . . . . . . . . . . . . . . . . . . . . . . . . . . . . .1<br />
About the 7300/7500 System . . . . . . . . . . . . . . . . . . . . . . . . . . . . . . . . . . . . . . . . . . . . .2<br />
About <strong>Relative</strong> Quantification . . . . . . . . . . . . . . . . . . . . . . . . . . . . . . . . . . . . . . . . . . . . .2<br />
About RQ Experiments . . . . . . . . . . . . . . . . . . . . . . . . . . . . . . . . . . . . . . . . . . . . . . . . . .2<br />
Example RQ Experiment . . . . . . . . . . . . . . . . . . . . . . . . . . . . . . . . . . . . . . . . . . . . . . . . .5<br />
Chapter 2 Designing an RQ Experiment 11<br />
Workflow . . . . . . . . . . . . . . . . . . . . . . . . . . . . . . . . . . . . . . . . . . . . . . . . . . . . . . . . . . . .11<br />
Selecting the PCR Method . . . . . . . . . . . . . . . . . . . . . . . . . . . . . . . . . . . . . . . . . . . . . .12<br />
Specifying the Components of an RQ Experiment . . . . . . . . . . . . . . . . . . . . . . . . . . . .13<br />
Selecting the Chemistry . . . . . . . . . . . . . . . . . . . . . . . . . . . . . . . . . . . . . . . . . . . . . . . .15<br />
Selecting One- or Two-Step RT-PCR . . . . . . . . . . . . . . . . . . . . . . . . . . . . . . . . . . . . . .16<br />
Choosing the Probes and Primers . . . . . . . . . . . . . . . . . . . . . . . . . . . . . . . . . . . . . . . .17<br />
Chapter 3 Performing Reverse Transcription 19<br />
Workflow . . . . . . . . . . . . . . . . . . . . . . . . . . . . . . . . . . . . . . . . . . . . . . . . . . . . . . . . . . . .19<br />
Guidelines for Preparing RNA . . . . . . . . . . . . . . . . . . . . . . . . . . . . . . . . . . . . . . . . . . . .20<br />
Converting Total RNA to cDNA . . . . . . . . . . . . . . . . . . . . . . . . . . . . . . . . . . . . . . . . . . .21<br />
Chapter 4 Generating Data from RQ Plates 23<br />
Workflow . . . . . . . . . . . . . . . . . . . . . . . . . . . . . . . . . . . . . . . . . . . . . . . . . . . . . . . . . . . .23<br />
Before You Begin . . . . . . . . . . . . . . . . . . . . . . . . . . . . . . . . . . . . . . . . . . . . . . . . . . . . .24<br />
Preparing the PCR Master Mix . . . . . . . . . . . . . . . . . . . . . . . . . . . . . . . . . . . . . . . . . . .24<br />
<strong>Relative</strong> Quantification Getting Started Guide for the 7300/7500 System v
Preparing the Reaction Plate . . . . . . . . . . . . . . . . . . . . . . . . . . . . . . . . . . . . . . . . . . . .25<br />
Creating a <strong>Relative</strong> Quantification (RQ) Plate Document . . . . . . . . . . . . . . . . . . . . . . .26<br />
Specifying Thermal Cycling Conditions and Starting the Run . . . . . . . . . . . . . . . . . . .30<br />
Analyzing and Viewing RQ Plate Data . . . . . . . . . . . . . . . . . . . . . . . . . . . . . . . . . . . . .32<br />
Exporting RQ Plate Data . . . . . . . . . . . . . . . . . . . . . . . . . . . . . . . . . . . . . . . . . . . . . . . .34<br />
Chapter 5 Analyzing Data in an RQ Study 35<br />
Workflow . . . . . . . . . . . . . . . . . . . . . . . . . . . . . . . . . . . . . . . . . . . . . . . . . . . . . . . . . . . .35<br />
Creating an RQ Study Document . . . . . . . . . . . . . . . . . . . . . . . . . . . . . . . . . . . . . . . . .36<br />
Configuring Analysis Settings . . . . . . . . . . . . . . . . . . . . . . . . . . . . . . . . . . . . . . . . . . . .38<br />
Adjusting the Baseline and Threshold . . . . . . . . . . . . . . . . . . . . . . . . . . . . . . . . . . . . .40<br />
Analyzing and Viewing the Results of the RQ Study . . . . . . . . . . . . . . . . . . . . . . . . . .45<br />
Reanalyzing an RQ Study . . . . . . . . . . . . . . . . . . . . . . . . . . . . . . . . . . . . . . . . . . . . . . .49<br />
Omitting Samples from a Study . . . . . . . . . . . . . . . . . . . . . . . . . . . . . . . . . . . . . . . . . .50<br />
Exporting RQ Study Data . . . . . . . . . . . . . . . . . . . . . . . . . . . . . . . . . . . . . . . . . . . . . . .52<br />
Appendix A Creating Detectors 53<br />
References 55<br />
Index 57<br />
vi <strong>Relative</strong> Quantification Getting Started Guide for the 7300/7500 System
How to Use This Guide<br />
Purpose of This<br />
Guide<br />
Preface<br />
This manual is written for principal investigators and laboratory staff who conduct<br />
relative <strong>quantification</strong> studies for gene expression using the Applied Biosystems<br />
7300/7500 Real Time PCR System (7300/7500 system).<br />
Assumptions This <strong>guide</strong> assumes that you have:<br />
• Familiarity with Microsoft ® Windows ® XP operating system.<br />
• Knowledge of general techniques for handling DNA and RNA samples and<br />
preparing them for PCR.<br />
• A general understanding of hard drives and data storage, file transfers, and copying<br />
and pasting.<br />
If you want to integrate the 7300/7500 system into your existing laboratory data flow<br />
system, you need networking experience.<br />
Text Conventions • Bold indicates user action. For example:<br />
Type 0, then press Enter for each of the remaining fields.<br />
Italic text indicates new or important words and is also used for emphasis. For<br />
example:<br />
Before analyzing, always prepare fresh matrix.<br />
A right arrow bracket (>) separates successive commands you select from a dropdown<br />
or shortcut menu. For example:<br />
Select File > Open > Spot Set.<br />
User Attention<br />
Words<br />
The following user attention words appear in Applied Biosystems user documentation.<br />
Each word implies a particular level of observation or action as described below:<br />
Note: Provides information that may be of interest or help but is not critical to the use of<br />
the product.<br />
IMPORTANT! Provides information that is necessary for proper instrument operation,<br />
accurate chemistry kit use, or safe use of a chemical.<br />
Indicates a potentially hazardous situation that, if not avoided, may<br />
result in minor or moderate injury. It may also be used to alert against unsafe practices.<br />
Indicates a potentially hazardous situation that, if not avoided, could<br />
result in death or serious injury.<br />
<strong>Relative</strong> Quantification Getting Started Guide for the 7300/7500 System vii
Preface<br />
How to Obtain More Information<br />
Safety Refer to the Applied Biosystems 7300/7500 Real Time PCR System Installation and<br />
Maintenance Getting Started Guide and the Applied Biosystems 7300/7500 Real Time<br />
PCR System Site Preparation Guide for important safety information.<br />
How to Obtain More Information<br />
For more information about using the 7300/7500 system, refer to:<br />
• Applied Biosystems 7300/7500 Real Time PCR System Online Help<br />
• Applied Biosystems 7300/7500 Real Time PCR System Allelic Discrimination<br />
Getting Started Guide (PN 4347822)<br />
• Applied Biosystems 7300/7500 Real Time PCR System Plus/Minus Getting Started<br />
Guide (PN 4347821)<br />
• Applied Biosystems 7300/7500 Real Time PCR System Absolute Quantification<br />
Getting Started Guide (PN 4347825)<br />
• Applied Biosystems 7300/7500 Real Time PCR System Installation and<br />
Maintenance Getting Started Guide (PN 4347828)<br />
• Applied Biosystems 7300/7500 Real Time PCR System Site Preparation Guide<br />
(PN 4347823)<br />
• Sequence Detection Systems Chemistry Guide (PN 4348358)<br />
• ABI PRISM ® 7700 Sequence Detection System User Bulletin #2: <strong>Relative</strong><br />
Quantitation of Gene Expression (PN 4303859)<br />
How to Obtain Services and Support<br />
Send Us Your Comments<br />
For the latest services and support information for all locations, go to<br />
http://www.appliedbiosystems.com, then click the link for Support.<br />
At the Support page, you can:<br />
Search through frequently asked questions (FAQs)<br />
Submit a question directly to Technical Support<br />
Order Applied Biosystems user documents, MSDSs, certificates of analysis, and<br />
other related documents<br />
Download PDF documents<br />
Obtain information about customer training<br />
Download software updates and patches<br />
In addition, the Support page provides access to worldwide telephone and fax numbers<br />
to contact Applied Biosystems Technical Support and Sales facilities.<br />
Applied Biosystems welcomes your comments and suggestions for improving its user<br />
documents. You can e-mail your comments to:<br />
techpubs@appliedbiosystems.com<br />
viii <strong>Relative</strong> Quantification Getting Started Guide for the 7300/7500 System
Chapter 1<br />
Overview<br />
Notes<br />
Introduction and Example RQ<br />
Experiment<br />
Primer Extended on mRNA<br />
5′ 3′<br />
5′ cDNA<br />
Reverse<br />
Primer<br />
Oligo d(T) or random hexamer<br />
Synthesis of 1st cDNA strand<br />
3′ 5′ cDNA<br />
Introduction<br />
and Example<br />
RQ Experiment<br />
Designing<br />
an RQ<br />
Experiment<br />
Performing<br />
Reverse<br />
Transcription<br />
Generating<br />
Data from<br />
RQ Plates<br />
Performing<br />
an RQ Study<br />
About the<br />
7300/7500 system<br />
About relative<br />
<strong>quantification</strong><br />
About RQ experiments<br />
About the<br />
example RQ experiment<br />
See page 2<br />
See page 2<br />
See page 2<br />
See page 5<br />
<strong>Relative</strong> Quantification Getting Started Guide for the 7300/7500 System 1<br />
1
Chapter 1 Introduction and Example RQ Experiment<br />
About the 7300/7500 System<br />
About the 7300/7500 System<br />
Notes<br />
Description The Applied Biosystems 7300/7500 Real Time PCR System (7300/7500 system) uses<br />
fluorescent-based PCR chemistries to provide quantitative detection of nucleic acid<br />
sequences using real-time analysis and qualitative detection of nucleic acid sequences<br />
using end-point and dissociation-curve analysis.<br />
<strong>Relative</strong><br />
Quantification<br />
Assay<br />
The 7300/7500 system allows you to perform several assay types using plates or tubes in<br />
the 96-well format. This <strong>guide</strong> describes the relative <strong>quantification</strong> (RQ) assay type.<br />
For information about the other assay types, refer to the Sequence Detection Systems<br />
Chemistry Guide (SDS Chemistry Guide) and the Online Help for the 7300/7500 system<br />
(Online Help).<br />
About <strong>Relative</strong> Quantification<br />
Definition <strong>Relative</strong> <strong>quantification</strong> determines the change in expression of a nucleic acid sequence<br />
(target) in a test sample relative to the same sequence in a calibrator sample. The<br />
calibrator sample can be an untreated control or a sample at time zero in a time-course<br />
study (Livak and Schmittgen, 2001). For example, relative <strong>quantification</strong> is commonly<br />
used to compare expression levels of wild-type with mutated alleles or the expression<br />
levels of a gene in different tissues.<br />
Real-time PCR<br />
Assays<br />
About RQ Experiments<br />
RQ Experiment<br />
Workflow<br />
RQ provides accurate comparison between the initial level of template in each sample,<br />
without requiring the exact copy number of the template. Further, the relative levels of<br />
templates in samples can be determined without the use of standard curves.<br />
RQ is performed using real-time PCR. In real-time PCR assays, you monitor the<br />
progress of the PCR as it occurs. Data are collected throughout the PCR process rather<br />
than at the end of the PCR process (end-point PCR).<br />
In real-time PCR, reactions are characterized by the point in time during cycling when<br />
amplification of a target is first detected rather than by the amount of target accumulated<br />
at the end of PCR.<br />
There are two types of quantitative real-time PCR: absolute and relative.<br />
In this document, the term “RQ experiment” refers to the entire process of relative<br />
<strong>quantification</strong>, beginning with generating cDNA from RNA (reverse transcription) and<br />
ending with analyzing an RQ study. The RQ experiment workflow is shown on page iii.<br />
2 <strong>Relative</strong> Quantification Getting Started Guide for the 7300/7500 System
RQ Studies with<br />
the 7300/7500<br />
System<br />
Notes<br />
Terms Used in<br />
Quantification<br />
Analysis<br />
About RQ Experiments<br />
RQ Studies with the 7300/7500 System<br />
The data-collection part of an RQ assay is a single-plate document, called the RQ Plate.<br />
Amplification data from PCR runs is stored with sample setup information on the plate.<br />
The data-analysis part of an RQ assay is a multi-plate document, called the RQ Study.<br />
You can analyze up to ten RQ plates in a study. RQ Study documents neither control the<br />
instrument, nor do they provide tools for setting up or modifying plates.<br />
IMPORTANT! RQ Study software is an optional package for the 7300 instrument but is<br />
standard for the 7500 instrument.<br />
The following figure illustrates the RQ Study process.<br />
Kidney<br />
Liver<br />
Bladder<br />
Plated Reactions<br />
kidneyplate.sds<br />
liverplate.sds<br />
bladderplate.sds<br />
7300/7500 System SDS Software RQ Plate Documents SDS Software<br />
RQ Study Document<br />
Note: The 7300/7500 system software uses only the comparative method (∆∆C T) to<br />
calculate relative quantities of a nucleic acid sequence.<br />
Term Definition<br />
Baseline The initial cycles of PCR in which there is little change in<br />
fluorescence signal.<br />
Threshold A level of ∆R n —automatically determined by the SDS software or<br />
manually set—used for C T determination in real-time assays. The<br />
level is set to be above the baseline and sufficiently low to be within<br />
the exponential growth region of the amplification curve. The<br />
threshold is the line whose intersection with the Amplification plot<br />
defines the C T.<br />
Threshold cycle (C T ) The fractional cycle number at which the fluorescence passes the<br />
threshold.<br />
Passive reference A dye that provides an internal fluorescence reference to which the<br />
reporter dye signal can be normalized during data analysis.<br />
Normalization is necessary to correct for fluorescence fluctuations<br />
caused by changes in concentration or in volume.<br />
Reporter dye The dye attached to the 5′ end of a TaqMan probe. The dye<br />
provides a signal that is an indicator of specific amplification.<br />
Normalized reporter<br />
(R n )<br />
The ratio of the fluorescence emission intensity of the reporter dye<br />
to the fluorescence emission intensity of the passive reference dye.<br />
Delta R n (∆R n) The magnitude of the signal generated by the specified set of PCR<br />
conditions. (∆R n = R n − baseline)<br />
<strong>Relative</strong> Quantification Getting Started Guide for the 7300/7500 System 3<br />
1
Notes<br />
Chapter 1 Introduction and Example RQ Experiment<br />
About RQ Experiments<br />
Required<br />
User-Supplied<br />
Materials<br />
The figure below shows a representative amplification plot and includes some of the<br />
terms defined in the previous table.<br />
Rn<br />
Threshold<br />
Baseline<br />
C T<br />
Sample<br />
Cycle Number<br />
No Template Control<br />
0 5 10 15 20 25 30 35 40<br />
4 <strong>Relative</strong> Quantification Getting Started Guide for the 7300/7500 System<br />
Rn<br />
GR0757<br />
Rn +<br />
Rn –<br />
Item Source<br />
ABI PRISM 6100 Nucleic Acid PrepStation Applied Biosystems<br />
(PN 6100-01)<br />
High Capacity cDNA Archive Kit Applied Biosystems<br />
(PN 4322171)<br />
TaqMan ® Universal PCR Master Mix Applied Biosystems<br />
(PN 4304437)<br />
MicroAmp ® Optical 96-Well Reaction Plate Applied Biosystems<br />
(PN 4306757)<br />
Optical Adhesive Cover Applied Biosystems<br />
(PN 4311971)<br />
Labeled primers and probes from one of the<br />
following sources:<br />
Assays-on-Demand Gene Expression<br />
Products (predesigned primers and<br />
probes)<br />
Assays-by-Design service (predesigned<br />
primers and probes)<br />
Primer Express Software (customdesigned<br />
primers and probes)<br />
Applied Biosystems Web site<br />
Reagent tubes with caps, 10-mL Applied Biosystems<br />
(PN 4305932)<br />
Contact your Applied Biosystems Sales<br />
Representative<br />
PN 4330710 (1-user license)<br />
PN 4330709 (10-user license)<br />
PN 4330708 (50-user license)<br />
Centrifuge with adapter for 96-well plates Major laboratory supplier (MLS)<br />
Gloves MLS<br />
Microcentrifuge MLS<br />
Microcentrifuge tubes, sterile 1.5-mL MLS
Example RQ Experiment<br />
Notes<br />
Example RQ Experiment<br />
Overview<br />
Item Source<br />
Nuclease-free water MLS<br />
Pipette tips, with filter plugs MLS<br />
Pipettors, positive-displacement MLS<br />
Safety goggles MLS<br />
Vortexer MLS<br />
Overview To better illustrate how to design, perform, and analyze RQ experiments, this section<br />
<strong>guide</strong>s you through an example experiment. The example experiment represents a<br />
typical RQ experiment setup that you can use as a quick-start procedure to familiarize<br />
yourself with the RQ workflow. Detailed steps in the RQ workflow are described in the<br />
subsequent chapters of this <strong>guide</strong>. Also in the subsequent chapters are Example<br />
Experiment boxes that provide details for some of the related steps in the example<br />
experiment.<br />
Description The objective of the example RQ experiment is to compare the levels of expression of 23<br />
genes in the liver, kidney, and bladder tissue of an individual.<br />
The experiment is designed for singleplex PCR – samples and endogenous controls were<br />
amplified in separate wells. Glyceraldehyde-3-phosphate dehydrogenase (GAPDH)<br />
serves as the endogenous control. Four replicates of each sample and endogenous control<br />
are amplified. (In this experiment, an entire 96-well-plate is devoted to each tissue<br />
because the four replicates of each of the 23 genes plus the endogenous control require<br />
all 96 wells.)<br />
Predesigned and labeled primer/probe sets are selected from the Applied Biosystems<br />
Assays-on-Demand product line.<br />
Reactions are set up for two-step RT-PCR, where the High Capacity cDNA Archive Kit<br />
and the TaqMan ® Universal PCR Master Mix are used for reverse transcription and<br />
PCR, respectively.<br />
Data are generated by running three RQ plates, one for each tissue.<br />
All three plates are analyzed in an RQ study, with the liver samples serving as the<br />
calibrator.<br />
<strong>Relative</strong> Quantification Getting Started Guide for the 7300/7500 System 5<br />
1
Notes<br />
Chapter 1 Introduction and Example RQ Experiment<br />
Example RQ Experiment<br />
Example RQ Experiment Procedure<br />
1. Design the experiment, as explained in<br />
Chapter 2.<br />
a. Designate the targets, calibrator,<br />
endogenous control, and replicates.<br />
b. Order the reagents for TaqMan ® probebased<br />
chemistry.<br />
c. Order the appropriate Assays-on-Demand <br />
products, which provide predesigned<br />
primers and probes for the 23 genes.<br />
2. Isolate total RNA from liver, kidney, and bladder<br />
tissue, as explained in Chapter 3.<br />
3. Generate cDNA from total RNA using the High<br />
Capacity cDNA Archive Kit.<br />
a. Prepare the reverse transcription (RT)<br />
master mix as indicated in the table to the<br />
right.<br />
Additional <strong>guide</strong>lines are provided in the<br />
High Capacity cDNA Archive Kit Protocol.<br />
CHEMICAL HAZARD.<br />
10 × RT Buffer may cause eye, skin, and respiratory<br />
tract irritation. Read the MSDS, and follow the<br />
handling instructions. Wear appropriate protective<br />
eyewear, clothing, and gloves.<br />
b. Prepare the cDNA archive plate by pipetting<br />
into each well of the plate:<br />
• 50 µL RT master mix<br />
• 30 µL nuclease-free water<br />
• 20 µL RNA sample<br />
Make sure the amount of total RNA<br />
converted to cDNA is 10 to 100 ng in 5 µL<br />
for each 50-µL PCR reaction.<br />
RT Master Mix<br />
Component µL/Reaction<br />
10✕ Reverse<br />
Transcription Buffer<br />
µL/21<br />
reactions a<br />
10 210<br />
25✕ dNTPs 4 84<br />
10✕ random primers 10 210<br />
MultiScribe Reverse<br />
Transcriptase, 50 U/µL<br />
5 105<br />
Nuclease-free water 21 441<br />
Total 50 1050<br />
a. Each RT reaction is 100 µL (see step 3b). If you need 5 µL cDNA for<br />
each of 104 PCR reactions per tissue (see step 4), you need 6 RT<br />
reactions per tissue. Extra volume (enough for one additional RT<br />
reaction per tissue) is included to account for pipetting losses, as<br />
well as extra cDNA for archiving.<br />
Liver Kidney Bladder<br />
6 <strong>Relative</strong> Quantification Getting Started Guide for the 7300/7500 System<br />
GR2322
Notes<br />
c. Program the thermal cycler using the<br />
indicated parameter values for the RT step<br />
of the two-step RT-PCR method.<br />
Note: You have the option to use one-step<br />
RT-PCR, as explained in “Selecting One- or<br />
Two-Step RT-PCR” on page 16.<br />
d. Store the cDNA at −20 °C until use.<br />
4. Prepare the PCR master mix as indicated in the<br />
table to the right.<br />
See Chapter 4 for more information.<br />
Note: The reaction volumes for Assay-by-<br />
Design products are specified in the product<br />
insert; those for primers and probes designed<br />
with Primer Express software follow the<br />
universal assay conditions described in<br />
Chapter 4.<br />
CHEMICAL HAZARD.<br />
TaqMan Universal PCR Master Mix may cause eye<br />
and skin irritation. Exposure may cause discomfort if<br />
swallowed or inhaled. Read the MSDS, and follow<br />
the handling instructions. Wear appropriate protective<br />
eyewear, clothing, and gloves.<br />
5. Prepare the reaction plates.<br />
a. Label the reaction plates, ensuring that you<br />
include an endogenous control on each<br />
plate.<br />
b. Pipette 50 µL of the appropriate PCR<br />
master mix (containing cDNA) into each<br />
well of the plate.<br />
c. Keep the reaction plates on ice until you are<br />
ready to load them into the 7300/7500<br />
system.<br />
Example RQ Experiment<br />
Example RQ Experiment Procedure<br />
Step Type Time Temperature<br />
HOLD 10 min 25 °C<br />
HOLD 120 min 37 °C<br />
Reaction<br />
Component<br />
TaqMan Universal<br />
PCR Master Mix<br />
(2✕)<br />
20✕ Assays-on-<br />
Demand Gene<br />
Expression Assay<br />
Mix a<br />
PCR Master Mix<br />
µL/<br />
Sample<br />
µL/ 5<br />
Reactions b<br />
Final<br />
Concentration<br />
25.0 125.0 1✕<br />
2.5 12.5 1✕<br />
cDNA sample 5.0 25.0 10 to 100<br />
ng<br />
Nuclease-free water 17.5 87.5 —<br />
Total 50.0 250 —<br />
a. Contains forward and reverse primers and labeled probe.<br />
b. 24 master mixes are prepared, one for each of 23 genes plus the<br />
endogenous control. Volume for five reactions (4 replicates plus<br />
extra) to account for pipetting losses.<br />
GR2323<br />
Regulus<br />
Liver_96Plate.eps<br />
GR2324<br />
Regulus<br />
Kidney_96Plate.eps<br />
GR2325<br />
Regulus<br />
Bladder_96Plate.eps<br />
<strong>Relative</strong> Quantification Getting Started Guide for the 7300/7500 System 7<br />
GR2323<br />
GR2324<br />
GR2325<br />
Liver<br />
samples<br />
Endogenous<br />
controls (GAPDH)<br />
Kidney<br />
samples<br />
Endogenous<br />
controls (GAPDH)<br />
Bladder<br />
samples<br />
Endogenous<br />
controls (GAPDH)<br />
1
Notes<br />
Chapter 1 Introduction and Example RQ Experiment<br />
Example RQ Experiment<br />
6. Create an RQ Plate document as described in<br />
“Creating a <strong>Relative</strong> Quantification (RQ) Plate<br />
Document” on page 26. Briefly,<br />
a. Select File > New.<br />
b. Select <strong>Relative</strong> Quantification (ddCt)<br />
Plate in the Assay drop-down list, then<br />
click Next >.<br />
IMPORTANT! You cannot use AQ Plate<br />
documents for RQ assays and vice versa.<br />
The information stored in AQ and RQ Plate<br />
documents is not interchangeable.<br />
c. Add detectors to the plate document, then<br />
click Next >.<br />
d. Specify the detectors and tasks for each<br />
well, then click Finish.<br />
You cannot add RQ plates to RQ studies<br />
unless you have specified sample names, as<br />
indicated in the message shown to the right.<br />
Click OK.<br />
The SDS software displays the Well<br />
Inspector.<br />
7. Enter the sample names in the Well Inspector<br />
(View > Well Inspector).<br />
IMPORTANT! If your experiment does not use<br />
all the wells on a plate, do not omit the wells<br />
from use at this point. You can omit unused wells<br />
after the run is completed. For more information<br />
about omitting wells, refer to the Online Help.<br />
The figure on the right shows a completed plate<br />
set up.<br />
8 <strong>Relative</strong> Quantification Getting Started Guide for the 7300/7500 System
8. Start the RQ run.<br />
Notes<br />
a. Select the Instrument tab. By default, the<br />
standard PCR conditions for the PCR step<br />
of the two-step RT-PCR method are<br />
displayed.<br />
b. Select File > Save As, enter a name for the<br />
RQ Plate document, then click Save.<br />
c. Load the plate into the instrument.<br />
d. Click Start.<br />
After the run, a message indicates if the run is<br />
successful or if errors were encountered.<br />
9. Create an RQ Study document as described in<br />
“Creating an RQ Study Document” on page 36.<br />
Briefly,<br />
a. Select File > New.<br />
b. Select <strong>Relative</strong> Quantification (ddCt)<br />
Study in the Assay drop-down list, then<br />
click Next >.<br />
IMPORTANT! RQ Studies are an optional<br />
add-on for the 7300 instrument; they are<br />
built-in for the 7500 instrument.<br />
c. Click Add to add plates to the study, then<br />
click Open.<br />
Note: You can add up to 10 RQ plates to an<br />
RQ study.<br />
d. Click Finish.<br />
Example RQ Experiment<br />
Example RQ Experiment Procedure<br />
<strong>Relative</strong> Quantification Getting Started Guide for the 7300/7500 System 9<br />
1
Notes<br />
Chapter 1 Introduction and Example RQ Experiment<br />
Example RQ Experiment<br />
10. Analyze the RQ data, as explained in Chapter 5.<br />
a. Configure analysis settings ( ), using the<br />
Auto Ct option and analyze the data.<br />
If you know the optimal baseline and<br />
threshold settings for your experiment, you<br />
can use the Manual Ct and Manual Baseline<br />
options.<br />
b. If necessary, manually adjust the baseline<br />
and threshold.<br />
c. Click , or select Analysis > Analyze to<br />
reanalyze the data.<br />
d. View analysis results by clicking a tab in the<br />
RQ Results pane.<br />
e. If desired, save the RQ Study document.<br />
Conclusion<br />
Note: See “Configuring Analysis Settings”<br />
on page 38 for details.<br />
Note: See “Adjusting the Baseline and<br />
Threshold” on page 40.<br />
As shown in the figure on the right, expression levels<br />
of CCR2 are greater in the liver than in the kidney or<br />
bladder tissues of this individual.<br />
Baseline is set before<br />
amplification begins<br />
Threshold falls within<br />
geometric phase of curve<br />
10 <strong>Relative</strong> Quantification Getting Started Guide for the 7300/7500 System
Chapter 2<br />
Workflow<br />
Notes<br />
Primer Extended on mRNA<br />
5′<br />
Synthesis of 1st cDNA strand<br />
3′<br />
Designing an RQ Experiment<br />
Introduction<br />
and Sample<br />
RQ Experiment<br />
Designing<br />
an RQ<br />
Experiment<br />
Performing<br />
Reverse<br />
Transcription<br />
Generating<br />
Data from<br />
RQ Plates<br />
Performing<br />
an RQ Study<br />
Select the<br />
PCR method<br />
Specify the components<br />
of an RQ experiment<br />
Select the chemistry<br />
Select one-step or<br />
two-step RT-PCR<br />
Choose probes<br />
and primers<br />
See page 12<br />
See page 13<br />
See page 15<br />
See page 16<br />
See page 17<br />
Absolute Quantification Getting Started Guide for the 7300/7500 System 11<br />
2
Notes<br />
Chapter 2 Designing an RQ Experiment<br />
Selecting the PCR Method<br />
Selecting the PCR Method<br />
Types of PCR<br />
Methods<br />
PCR is performed as either of the following:<br />
• A singleplex reaction, where a single primer pair is present in the reaction tube or<br />
well. Only one target sequence or endogenous control can be amplified per reaction.<br />
• A multiplex reaction, where two or more primer pairs are present in the reaction.<br />
Each primer pair amplifies either a target sequence or an endogenous control.<br />
Selection Criteria Both methods give equivalent results for relative <strong>quantification</strong> experiments. To select a<br />
method, consider the:<br />
Example Experiment<br />
Singleplex PCR Multiplex PCR<br />
Target Primer Set<br />
Endogenous Control<br />
Primer Set<br />
cDNA<br />
• Type of chemistry you use to detect PCR products – Singleplex PCR can use either<br />
SYBR ® Green or TaqMan reagent-based chemistry. Multiplex PCR can use only<br />
TaqMan chemistry.<br />
• Amount of time you want to spend optimizing and validating your experiment –<br />
Amplifying target sequences and endogenous controls in separate reactions<br />
(singleplex PCR) requires less optimization and validation than multiplex PCR.<br />
Among the factors to consider in multiplex PCR are primer limitation, the relative<br />
abundance of the target and reference sequences (the endogenous control must be<br />
more abundant than the targets), and the number of targets in the study.<br />
Additionally, running multiple reactions in the same tube multiplex PCR increases<br />
throughput and reduces the effects of pipetting errors.<br />
For more information about multiplex and singleplex PCR, refer to the SDS Chemistry<br />
Guide (PN 4348358).<br />
12 Absolute Quantification Getting Started Guide for the 7300/7500 System<br />
GR2331<br />
IMPORTANT! As the number of gene targets increases, the singleplex format is<br />
typically more effective than the multiplex format because less optimization is<br />
required.<br />
The singleplex PCR method is used in the example experiment because:<br />
The number of targets to be amplified (23 genes, plus one endogenous control) is large<br />
Optimization and validation requirements are reduced for singleplex experiments
Notes<br />
Specifying the Components of an RQ Experiment<br />
Specifying the Components of an RQ Experiment<br />
After you decide to use the singleplex or multiplex method, you need to specify the<br />
required components of the RQ experiment for every sample:<br />
• A target – The nucleic acid sequence that you are studying.<br />
• A calibrator – The sample used as the basis for comparative results.<br />
• An endogenous control – A gene present at a consistent expression level in all<br />
experimental samples. By using an endogenous control as an active reference, you<br />
can normalize <strong>quantification</strong> of a cDNA target for differences in the amount of<br />
cDNA added to each reaction. Note that:<br />
– Each sample type (for example, each tissue in a study comparing multiple<br />
tissues) requires an endogenous control.<br />
– If samples are spread across multiple plates, each plate must have an endogenous<br />
control. Additionally, every plate must include an endogenous control for every<br />
sample type on the plate.<br />
Typically, housekeeping genes such as β-actin, glyceraldehyde-3-phosphate<br />
(GAPDH), and ribosomal RNA (rRNA), are used as endogenous controls, because<br />
their expression levels tend to be relatively stable.<br />
• Replicate wells – For relative <strong>quantification</strong> studies, Applied Biosystems<br />
recommends the use of three or more replicate reactions per sample and<br />
endogenous control to ensure statistical significance.<br />
For more information about these requirements, refer to the SDS Chemistry Guide.<br />
Absolute Quantification Getting Started Guide for the 7300/7500 System 13<br />
2
Notes<br />
Chapter 2 Designing an RQ Experiment<br />
Specifying the Components of an RQ Experiment<br />
Example Experiment<br />
In the example experiment, the objective is to compare the expression levels of several genes in the liver, kidney, and<br />
bladder tissue of an individual. The 23 genes of interest, including ACVR1, ACVR2, CCR2, CD3D, and FLT4, are the targets<br />
and the liver samples serve as the calibrator.<br />
The SDS software sets gene expression levels for the calibrator samples to 1. Consequently, if more ACRV1 is in the kidney<br />
than in the liver, the gene expression level of ACRV1 in the kidney is greater than 1. Similarly, if less CD3D is in the bladder<br />
than in the liver, the gene expression level of CD3D in the bladder is less than 1.<br />
Because RQ is based on PCR, the more template in a reaction, the more the PCR product and the greater the fluorescence.<br />
To adjust for possible differences in the amount of template added to the reaction, GAPDH serves as an endogenous<br />
control. (Expression levels of the endogenous control are subtracted from expression levels of target genes.) An<br />
endogenous control is prepared for each tissue.<br />
The experiment includes three sets of endogenous controls—one for each tissue. Also, the endogenous control for each<br />
tissue must be amplified on the same plate as the target sequences for that tissue. Finally, note that the experiment uses<br />
the singleplex PCR format, and therefore, the endogenous controls are amplified in wells different from the target wells.<br />
Four replicates of each sample and endogenous control are performed to ensure statistical significance (see below).<br />
Note: The example RQ experiment requires a separate plate for each of the three tissues because of the large number of<br />
genes being studied. Experiments can also be designed so that several samples are amplified on the same plate, as<br />
shown in the following table.<br />
In the example RQ experiment, each plate contains a<br />
single sample type (tissue). The endogenous control for<br />
each tissue is on the same plate as the targets for that<br />
tissue.<br />
GR2323<br />
Regulus<br />
Liver_96Plate.eps<br />
GR2324<br />
Regulus<br />
Kidney_96Plate.eps<br />
GR2325<br />
Regulus<br />
Bladder_96Plate.eps<br />
GR2323<br />
GR2324<br />
Liver<br />
samples<br />
Endogenous<br />
controls (GAPDH)<br />
Kidney<br />
samples<br />
Endogenous<br />
controls (GAPDH)<br />
Bladder<br />
samples<br />
Endogenous<br />
If the example experiment were run with multiple sample<br />
types on the same plate, an endogenous control for each<br />
sample type must also be included on the same plate, as<br />
shown here.<br />
Liver Kidney Bladder<br />
GR2322<br />
Regulus<br />
LivKidBladPlate.eps<br />
Endogenous<br />
controls (GAPDH)<br />
14 Absolute Quantification Getting Started Guide for the 7300/7500 System<br />
GR2322<br />
Samples
Selecting the Chemistry<br />
Notes<br />
About<br />
Chemistries<br />
Selecting the Chemistry<br />
About Chemistries<br />
Applied Biosystems offers two types of chemistries that you can use to detect PCR<br />
products on real-time instruments, as explained in the following table. Both TaqMan<br />
probe-based and SYBR Green I dye chemistries can be used for either one- or two-step<br />
RT-PCR. For more information about these chemistries, refer to the SDS Chemistry<br />
Guide.<br />
Chemistry Process<br />
TaqMan ® reagents or kits<br />
Description<br />
TaqMan reagent-based chemistry uses a<br />
fluorogenic probe to enable detection of a specific<br />
PCR product as it accumulates during PCR cycles.<br />
Advantages<br />
Increases specificity with a probe. Specific<br />
hybridization between probe and target<br />
generates fluorescence signal.<br />
Provides multiplex capability<br />
Optimized assays available<br />
Allows 5′-nuclease assay to be carried out<br />
during PCR<br />
SYBR ® Green I reagents<br />
Description<br />
Uses SYBR Green I dye, a double-stranded DNA<br />
binding dye, to detect PCR products as they<br />
accumulate during PCR cycles.<br />
Advantages<br />
Reduces cost (no probe needed)<br />
Amplifies all double-stranded DNA<br />
Yields a melting profile of distinct PCR runs<br />
Increases sensitivity for detecting amplification<br />
products relative to product length<br />
Limitations<br />
Binds nonspecifically to all double-stranded DNA<br />
sequences. To avoid false positive signals, check<br />
for nonspecific product formation using dissociation<br />
curve or gel analysis.<br />
Polymerization<br />
FORWARD<br />
PRIMER<br />
5′<br />
3′<br />
R PROBE<br />
Q R = REPORTER<br />
3′ Q = QUENCHER<br />
5′<br />
5′ 3′<br />
5′<br />
Absolute Quantification Getting Started Guide for the 7300/7500 System 15<br />
REVERSE<br />
PRIMER<br />
Step 1: A reporter (R) and a<br />
quencher (Q) are attached to the<br />
5' and 3' ends of a TaqMan<br />
probe.<br />
Cleavage<br />
5′<br />
3′<br />
R<br />
Q<br />
3′<br />
5′ 3′<br />
5′<br />
Step 2: During each extension<br />
cycle, the AmpliTaq Gold ® DNA<br />
polymerase cleaves the reporter<br />
dye from the probe.<br />
FORWARD<br />
PRIMER<br />
REVERSE<br />
PRIMER<br />
5′<br />
Strand Displacement<br />
5′<br />
3′<br />
R<br />
Q<br />
3′<br />
5′ 3′<br />
5′<br />
5′<br />
3′<br />
Step 1 continued: when both dyes<br />
are attached to the probe, reporter<br />
dye emission is quenched.<br />
Polymerization Completed<br />
Q<br />
3′<br />
5′ 3′<br />
5′<br />
Step 3: After being separated from<br />
the quencher, the reporter dye<br />
emits its characteristic<br />
fluorescence.<br />
Step 1: Reaction setup<br />
The SYBR ® Green I dye<br />
fluoresces when bound to<br />
double-stranded DNA.<br />
Step 2: Denaturation<br />
When the DNA is denatured,<br />
the SYBR ® Green I dye is<br />
released and the fluorescence<br />
is drastically reduced.<br />
Step 3: Polymerization<br />
During extension, primers<br />
anneal and PCR product<br />
is generated.<br />
Step 4: Polymerization completed<br />
SYBR® Green I dye binds to the<br />
double-stranded product,<br />
resulting in a net increase in<br />
fluorescence detected by the<br />
instrument.<br />
R<br />
5′<br />
5′<br />
2
Chapter 2 Designing an RQ Experiment<br />
Selecting One- or Two-Step RT-PCR<br />
Selecting One- or Two-Step RT-PCR<br />
When performing real-time PCR, you have the option<br />
of performing reverse transcription (RT) and PCR in a<br />
single reaction (one-step) or in separate reactions<br />
(two-step).The reagent configuration you use depends<br />
on whether you are performing one-step or two-step<br />
RT-PCR:<br />
• Two-step RT-PCR is performed in two separate<br />
reactions: first, total RNA is reverse transcribed<br />
into cDNA, then the cDNA is amplified by PCR.<br />
This method is useful for detecting multiple<br />
transcripts from a single cDNA template or for<br />
storing cDNA aliquots for later use. AmpErase ®<br />
UNG enzyme can be used to prevent carryover<br />
contamination.<br />
Notes<br />
IMPORTANT! This <strong>guide</strong> assumes that RQ<br />
experiments are designed using two-step RT-<br />
PCR. For additional options, refer to the SDS<br />
Chemistry Guide.<br />
• In one-step RT-PCR, RT and PCR take place in<br />
one buffer system, which provides the<br />
convenience of a single-tube preparation for RT<br />
and PCR amplification. However, you cannot use<br />
the carryover prevention enzyme, AmpErase ®<br />
UNG (uracil-N-glycosylase), with one-step RT-<br />
PCR. For more information about UNG, refer to<br />
the SDS Chemistry Guide.<br />
Two-Step RT-PCR<br />
RT Incubation<br />
PCR Amplification<br />
and Detection<br />
Sample RNA<br />
RT Master Mix<br />
PCR Master Mix<br />
16 Absolute Quantification Getting Started Guide for the 7300/7500 System<br />
Results<br />
Aliquot DNA<br />
One-Step RT-PCR<br />
RT<br />
Master Mix<br />
RT Incubation and<br />
PCR Amplification<br />
Sample RNA<br />
Results<br />
Archive<br />
PCR<br />
Master Mix<br />
GR2333
Choosing the Probes and Primers<br />
Notes<br />
Recommended Kits for Two-Step RT-PCR<br />
Choosing the Probes and Primers<br />
Chemistry Step Reagent Part Number<br />
TaqMan reagents or kits RT High Capacity cDNA Archive Kit 4322171<br />
PCR TaqMan Universal PCR Master Mix 4304437<br />
SYBR Green I reagents or kits RT High Capacity cDNA Archive Kit 4322171<br />
Example Experiment<br />
PCR SYBR Green Master Mix 4309155<br />
RT and PCR SYBR Green RT-PCR Reagents 4310179<br />
Premade probes and primers for all the genes of interest are available from the Assays-on-Demand product line, which<br />
uses TaqMan chemistry. Two-step RT-PCR is performed using the reagents recommended for TaqMan reagent- or kitbased<br />
chemistry in the table above.<br />
Choose probe and primer sets for both your target and endogenous control sequences.<br />
Applied Biosystems provides three options for choosing primers and probes:<br />
• Assays-on-Demand Gene Expression Products – Provide you with optimized,<br />
ready-to-use TaqMan 5′-nuclease assays for human, mouse, or rat transcripts. For<br />
information on available primer/probe sets, go to:<br />
http://www.allgenes.com<br />
• Assays-by-DesignSM Service – Designs, synthesizes, formulates, and delivers<br />
quality-controlled primer and probe sets. Use this service if the assay you need is<br />
not currently available. To place an order, contact your Applied Biosystems<br />
representative.<br />
• Primer Express ® Software – Helps you design primers and probes for your own<br />
<strong>quantification</strong> assays. For more information about using this software, refer to the<br />
Primer Express Software v2.0 User’s Manual (PN 4329500).<br />
Applied Biosystems provides assay design <strong>guide</strong>lines that have been developed<br />
specifically for <strong>quantification</strong> assays. When followed, these <strong>guide</strong>lines provide a<br />
reliable system for assay design and optimization. For information about the assay<br />
design <strong>guide</strong>lines, refer to the SDS Chemistry Guide.<br />
If you ordered Assays-on-Demand or Assays-by-Design products, probes are already<br />
labeled with a reporter dye. If you design your own assays, you need to specify a reporter<br />
dye for your custom probe(s). For singleplex experiments, you can use the same dye for<br />
targets and endogenous control(s). For multiplex experiments, the probe for the target is<br />
typically labeled with FAM dye and that for the endogenous control with VIC ® dye.<br />
Absolute Quantification Getting Started Guide for the 7300/7500 System 17<br />
2
Notes<br />
Chapter 2 Designing an RQ Experiment<br />
Choosing the Probes and Primers<br />
Example Experiment<br />
For the example experiment, primers and probes for all the genes being studied are obtained from Applied Biosystems<br />
Assays-on-Demand products. Each assay consists of two unlabeled PCR primers and a FAM dye-labeled TaqMan ®<br />
MGB probe, provided as a 20✕ assay mix.<br />
In the example experiment, all target probes are labeled with FAM dye; the endogenous control is also labeled with FAM<br />
dye.<br />
The following table provides the gene symbol, gene name, and Applied Biosystems Assay ID number (provided on the Web<br />
site) for five of the genes studied in the example experiment, plus the endogenous control.<br />
Gene Symbol Gene Name Assay ID #<br />
ACVR1 acrosomal vesicle protein I Hs00153836 m1<br />
ACVR2 activin A receptor, type II Hs00155658_m1<br />
CCR2 chemokine (C-C motif) receptor 2 Hs00174150_m1<br />
CD3D CD3D antigen, delta polypeptide (TiT3 complex) Hs00174158_m1<br />
FLT4 fms-related tyrosine kinase 4 Hs00176607 m1<br />
GAPDH glyceraldehyde-3-phosphate dehydrogenase Hs99999905 m1<br />
18 Absolute Quantification Getting Started Guide for the 7300/7500 System
Chapter<br />
3<br />
Workflow<br />
Notes<br />
Performing Reverse Transcription<br />
Primer Extended on mRNA<br />
5′ 3′<br />
5′ cDNA<br />
Reverse<br />
Primer<br />
Oligo d(T) or random hexamer<br />
Synthesis of 1st cDNA strand<br />
3′ 5′ cDNA<br />
Introduction<br />
and Sample<br />
RQ Experiment<br />
Designing<br />
an RQ<br />
Experiment<br />
Performing<br />
Reverse<br />
Transcription<br />
Generating<br />
Data from<br />
RQ Plates<br />
Performing<br />
an RQ Study<br />
Isolate total RNA<br />
Adjust RNA<br />
concentration<br />
Convert<br />
total RNA to cDNA<br />
See page 20<br />
See page 20<br />
See page 21<br />
Primer Extended on mRNA<br />
5′ 3′<br />
5′ cDNA<br />
Reverse<br />
Primer<br />
Oligo d(T) or random hexamer<br />
Synthesis of 1st cDNA strand<br />
3′ 5′ cDNA<br />
Absolute Quantification Getting Started Guide for the 7300/7500 System 19<br />
3
Primer Extended on mRNA<br />
5′ 3′<br />
5′ cDNA<br />
Reverse<br />
Primer<br />
Oligo d(T) or random hexamer<br />
Synthesis of 1st cDNA strand<br />
3′ 5′ cDNA<br />
Notes<br />
Chapter 3 Performing Reverse Transcription<br />
Guidelines for Preparing RNA<br />
Guidelines for Preparing RNA<br />
Isolating RNA Applied Biosystems supplies several instrument systems and chemistries for RNA<br />
isolation from a variety of starting materials, such as blood, tissue, cell cultures, and<br />
plant material.<br />
Quality of RNA The total RNA you use for RQ experiments should:<br />
Adjusting the<br />
Starting<br />
Concentration of<br />
Total RNA<br />
• Have an A260/280 greater than 1.9<br />
• Be intact when visualized by gel electrophoresis<br />
• Not contain RT or PCR inhibitors<br />
System Part Number<br />
ABI PRISM 6100 Nucleic Acid PrepStation 6100-01<br />
Total RNA Chemistry Reagents:<br />
Nucleic Acid Purification Elution Solution<br />
Nucleic Acid Purification Lysis Solution<br />
Nucleic Acid Purification Wash Solution I<br />
Nucleic Acid Purification Wash Solution II<br />
AbsoluteRNA Wash Solution (DNase treatment)<br />
Tempus Blood RNA Tubes<br />
(For collection, stabilization, and isolation of total RNA in whole blood<br />
for gene analysis using the 6100 PrepStation)<br />
Isolation of Total RNA from Whole Blood and from Cells Isolated from<br />
Whole Blood Protocol<br />
4305893<br />
4305895<br />
4305891<br />
4305890<br />
4305545<br />
4342972<br />
4332809<br />
Tempus Blood RNA Tube and Large Volume Consumables Protocol 4345218<br />
Tissue RNA Isolation: Isolation of Total RNA from Plant and Animal<br />
Tissue Protocol<br />
4330252<br />
The High Capacity cDNA Archive Kit Protocol (4312169) contains additional <strong>guide</strong>lines<br />
for preparing the RNA template.<br />
The High Capacity cDNA Archive Kit is optimized to convert 0.1 to 10 µg of total RNA<br />
to cDNA. Convert enough total RNA so that the final concentration of total RNA<br />
converted to cDNA is 10 to 100 ng in 5 µL for each 50-µL PCR reaction.<br />
20 Absolute Quantification Getting Started Guide for the 7300/7500 System
Converting Total RNA to cDNA<br />
Notes<br />
Using the High<br />
Capacity cDNA<br />
Archive Kit<br />
Thermal Profile<br />
Parameters for RT<br />
Converting Total RNA to cDNA<br />
Using the High Capacity cDNA Archive Kit<br />
Primer Extended on mRNA<br />
5′ 3′<br />
5′ cDNA<br />
Reverse<br />
Primer<br />
Oligo d(T) or random hexamer<br />
Synthesis of 1st cDNA strand<br />
3′ 5′ cDNA<br />
Use the High Capacity cDNA Archive Kit (PN 4322171) to perform the first step (RT)<br />
in the two-step RT-PCR method. Follow the manual method for converting total RNA<br />
into cDNA, as specified in the High Capacity cDNA Archive Kit Protocol (PN 4322169).<br />
IMPORTANT! The protocol is not shipped with the High Capacity cDNA Archive Kit.<br />
Download the protocol from<br />
http://docs.appliedbiosystems.com/search.taf<br />
To search for the document, select ABI PRISM 6100 Nucleic Acid PrepStation in the<br />
Product list box, then click Search at the bottom of the page. The protocol is listed under<br />
the Protocols heading.<br />
The High Capacity cDNA Archive Kit uses the following thermal profile parameters for<br />
the RT step.<br />
Step Type Time Temperature<br />
HOLD 10 min 25 °C<br />
HOLD 120 min 37 °C<br />
Note: Thermal cycling conditions for one-step RT-PCR are described on page 30.<br />
Absolute Quantification Getting Started Guide for the 7300/7500 System 21<br />
3
Primer Extended on mRNA<br />
5′ 3′<br />
5′ cDNA<br />
Reverse<br />
Primer<br />
Oligo d(T) or random hexamer<br />
Synthesis of 1st cDNA strand<br />
3′ 5′ cDNA<br />
Notes<br />
Chapter 3 Performing Reverse Transcription<br />
Converting Total RNA to cDNA<br />
Storing cDNA After cDNA conversion, store all cDNA samples at −15 to −25 °C. To minimize<br />
repeated freeze-thaw cycles of cDNA, store cDNA samples in aliquots.<br />
Example Experiment<br />
CHEMICAL HAZARD. 10 × RT Buffer may cause eye, skin, and<br />
respiratory tract irritation. Read the MSDS, and follow the handling instructions. Wear<br />
appropriate protective eyewear, clothing, and gloves.<br />
For the example experiment, RNA is extracted from the liver, bladder, and kidney tissues of an individual. RNA<br />
concentration is determined spectrophotometrically (using A260), and the RNA is diluted to a final concentration of 50 ng/µL.<br />
The RT master mix is prepared as follows, using <strong>guide</strong>lines from the High Capacity cDNA Archive Kit Protocol:<br />
Component µL/Reaction µL/21 Reactions a<br />
10✕ Reverse Transcription Buffer 10 210<br />
25✕ dNTPs 4 84<br />
10✕ random primers 10 210<br />
MultiScribe Reverse Transcriptase, 50<br />
U/µL<br />
5 105<br />
Nuclease-free water 21 441<br />
Total per reaction 50 1050<br />
a. Each RT reaction is 100 µL (see below). If you need 5 µL cDNA for each of 104 PCR reactions per tissue (see “Creating a<br />
<strong>Relative</strong> Quantification (RQ) Plate Document” on page 26), you need 6 RT reactions per tissue. Extra volume (enough for one<br />
additional RT reaction per tissue) is included to account for pipetting losses, as well as extra cDNA for archiving.<br />
The cDNA archive plate is then prepared by pipetting into each well:<br />
50 µL of the RT master mix<br />
30 µL of nuclease-free water<br />
20 µL of RNA sample (bringing the total starting amount of RNA to 1 µg per 100 µL reaction)<br />
Liver Kidney Bladder<br />
GR2322<br />
The RNA is then converted to cDNA using the thermal cycling parameters for two-step RT-PCR, as described in “Thermal<br />
Profile Parameters for RT” on page 21.<br />
The cDNA is stored at −20 °C until use.<br />
22 Absolute Quantification Getting Started Guide for the 7300/7500 System
Chapter 4<br />
Workflow<br />
Notes<br />
Generating Data from RQ Plates<br />
Primer Extended on mRNA<br />
5′ 3′<br />
5′ cDNA<br />
Reverse<br />
Primer<br />
Oligo d(T) or random hexamer<br />
Synthesis of 1st cDNA strand<br />
3′ 5′ cDNA<br />
Introduction<br />
and Sample<br />
RQ Experiment<br />
Designing<br />
an RQ<br />
Experiment<br />
Performing<br />
Reverse<br />
Transcription<br />
Generating<br />
Data from<br />
RQ Plates<br />
Performing<br />
an RQ Study<br />
Prepare the<br />
PCR Master Mix<br />
Create a new<br />
RQ Plate document<br />
Create detectors<br />
Program the<br />
thermal cycling conditions<br />
Save the<br />
RQ Plate document<br />
Start the run<br />
View RQ plate data<br />
See page 24<br />
See page 26<br />
See page 26<br />
See page 30<br />
See page 31<br />
See page 31<br />
Seepage32<br />
Absolute Quantification Getting Started Guide for the 7300/7500 System 23<br />
4
Chapter 4 Generating Data from RQ Plates<br />
Before You Begin<br />
Before You Begin<br />
Notes<br />
Check that background and pure-dye runs have been performed regularly to ensure<br />
optimal performance of the 7300/7500 system. For more information about calibrating<br />
the 7300/7500 system, refer to the Online Help.<br />
Preparing the PCR Master Mix<br />
The second step (PCR) in the two-step RT-PCR procedure is amplifying the cDNA,<br />
which you perform using the TaqMan ® Universal PCR Master Mix reagents.<br />
The TaqMan Universal PCR Master Mix Protocol (PN 4304449) explains how to use the<br />
reagents in the kit. The following table lists the universal assay conditions (volume and<br />
final concentration) for using the master mix.<br />
CHEMICAL HAZARD. TaqMan Universal PCR Master Mix<br />
may cause eye and skin irritation. Exposure may cause discomfort if swallowed or<br />
inhaled. Read the MSDS, and follow the handling instructions. Wear appropriate<br />
protective eyewear, clothing, and gloves.<br />
Reaction Component µL/ Sample Final Concentration<br />
TaqMan Universal PCR Master Mix (2✕) 25.0 1✕<br />
Forward primer 5.0 50 to 900 nM<br />
Reverse primer 5.0 50 to 900 nM<br />
TaqMan probe 5.0 50 to 250 nM<br />
cDNA sample 5.0 10 to 100 ng<br />
Nuclease-free water 5.0 —<br />
Total 50.0 —<br />
If you design probes and primers using Primer Express software, they must be optimized<br />
to work with the universal assay conditions, using the volumes listed in the table above.<br />
All Assays-by-Design and Assays-on-Demand products are formulated so that the final<br />
concentration of the primers and probes are within the recommended values.<br />
24 Absolute Quantification Getting Started Guide for the 7300/7500 System
Preparing the Reaction Plate<br />
Example Experiment<br />
Notes<br />
Preparing the Reaction Plate<br />
1. Label the reaction plates, ensuring that you include an endogenous control for each<br />
sample type (for example, each tissue in a study comparing multiple tissues). If<br />
samples are spread across multiple plates, each plate must have an endogenous<br />
control. Additionally, every plate must include an endogenous control for every<br />
sample type on the plate.<br />
2. Into each well of the reaction plate, add 50 µL of the appropriate PCR master mix.<br />
3. Keep the reaction plates on ice until you are ready to load them into the 7300/7500<br />
system.<br />
Primers and probes for the example RQ experiment are obtained from the Assays-on-Demand product line and are<br />
provided as a 20✕ Gene Expression Assay Mix. The PCR master mix is prepared as follows:<br />
Reaction Component<br />
µL/<br />
Sample<br />
µL/ 5 Reactions b<br />
Samples and endogenous controls are arranged on three plates as shown below. 50 µL of PCR master mix containing<br />
cDNA are added to each well.<br />
The reactions are kept on ice until the plates are loaded on the 7300/7500 system.<br />
Final Concentration<br />
TaqMan Universal PCR Master Mix (2✕) 25.0 125.0 1✕<br />
20✕ Assays-on-Demand Gene<br />
Expression Assay Mix a<br />
2.5 12.5 1✕<br />
cDNA sample 5.0 25.0 50 ng (for the 50-µL reaction)<br />
Nuclease-free water 17.5 87.5 —<br />
Total 50.0 250 —<br />
a. Contains forward and reverse primers and labeled probe.<br />
b. 24 master mixes are prepared, one for each of 23 genes plus the endogenous control. Volume for five reactions (4 replicates plus extra)<br />
to account for pipetting losses.<br />
GR2323<br />
Regulus<br />
Liver_96Plate.eps<br />
GR2324<br />
Regulus<br />
Kidney_96Plate.eps<br />
GR2323<br />
GR2324<br />
Liver<br />
samples<br />
Endogenous<br />
controls (GAPDH)<br />
Kidney<br />
samples<br />
Endogenous<br />
controls (GAPDH)<br />
GR2325<br />
Regulus<br />
Bladder_96Plate.eps<br />
Absolute Quantification Getting Started Guide for the 7300/7500 System 25<br />
GR2325<br />
Bladder<br />
samples<br />
Endogenous<br />
controls (GAPDH)<br />
4
Notes<br />
Chapter 4 Generating Data from RQ Plates<br />
Creating a <strong>Relative</strong> Quantification (RQ) Plate Document<br />
Creating a <strong>Relative</strong> Quantification (RQ) Plate Document<br />
Overview An RQ Plate document stores data collected from an RQ run for a single plate. There<br />
must be one RQ Plate document for every RQ plate. RQ Plate documents also store other<br />
information, including sample names and detectors.<br />
Run Setup<br />
Requirements<br />
For each RQ plate document that you create, specify detectors, endogenous controls, and<br />
detector tasks:<br />
• A detector is a virtual representation of a gene-specific nucleic acid probe reagent<br />
used in assays. You specify which detector to use for each target sequence.<br />
Appendix A explains how to create detectors.<br />
IMPORTANT! To conduct a comparative analysis of the data in a study, all the<br />
plates in the study must contain a common set of detectors.<br />
• An endogenous control(s) (as defined in “Specifying the Components of an RQ<br />
Experiment” on page 13). If your experiment consists of multiple plates, each plate<br />
must have at least one endogenous control with at least three replicates. If your<br />
experiment consists of a single plate with multiple samples, there must be an<br />
endogenous control for each sample. All plates in an RQ experiment must use the<br />
same endogenous control (for example, GAPDH).<br />
• A detector task specifies how the software uses the data collected from the well<br />
during analysis. You apply one of two tasks to each detector in each well of a plate<br />
document.<br />
Task Symbol Apply to detectors of...<br />
Target Wells that contain PCR reagents for the amplification of target<br />
sequences.<br />
Endogenous<br />
Control<br />
Wells that contain reagents for the amplification of the<br />
endogenous control sequence.<br />
26 Absolute Quantification Getting Started Guide for the 7300/7500 System
Creating an RQ Plate Document<br />
You can enter sample information into a new plate<br />
document, import sample information from existing<br />
plate documents, or use a template document to set up<br />
new plate documents. This section describes setting<br />
up new plate documents. Refer to the Online Help for<br />
information about importing sample information or<br />
using template documents.<br />
To create a new plate document:<br />
1. Select Start > Programs > Applied Biosystems<br />
7300/7500 > Applied Biosystems 7300/7500<br />
SDS Software ( ) to start the SDS software.<br />
2. Select File > New.<br />
3. In the Assay drop-down list of the New<br />
Document Wizard, select <strong>Relative</strong><br />
Quantification (ddCt) Plate. Accept the default<br />
settings for Container and Template<br />
(96-Well Clear and Blank Document).<br />
Notes<br />
IMPORTANT! You cannot use RQ Plate<br />
documents for AQ assays and vice versa. The<br />
information stored in AQ and RQ Plate<br />
documents is not interchangeable.<br />
4. Enter a name in the Default Plate Name field, or<br />
accept the default.<br />
5. Click Next >.<br />
6. Select detectors to add to the plate document.<br />
a. Click to select a detector. (Ctrl-click to<br />
select multiple detectors.) If no detectors are<br />
listed in the Detector Manager, create<br />
detectors as explained in Appendix A,<br />
“Creating Detectors.”<br />
b. Click Add>>. The detectors are added to<br />
the plate document.<br />
Note: To remove a detector from the<br />
Detectors in Document panel, select the<br />
detector, then click Remove.<br />
c. Click Next >.<br />
Creating a <strong>Relative</strong> Quantification (RQ) Plate Document<br />
Creating an RQ Plate Document<br />
Absolute Quantification Getting Started Guide for the 7300/7500 System 27<br />
6a<br />
6b<br />
6c<br />
4
Notes<br />
Chapter 4 Generating Data from RQ Plates<br />
Creating a <strong>Relative</strong> Quantification (RQ) Plate Document<br />
7. Specify the detectors and tasks for each well.<br />
a. Click a well (or group of wells, for<br />
replicates) to select it.<br />
b. Click to select the detector(s) for the well.<br />
c. Click under the Task column to assign the<br />
detector task.<br />
d. Select Use.<br />
e. Click Finish.<br />
You cannot add RQ plates to RQ studies<br />
unless you have specified sample names, as<br />
indicated in the message shown to the right.<br />
Click OK.<br />
The SDS software creates the plate<br />
document and displays the Well Inspector.<br />
8. Enter the sample names.<br />
a. In the Well Inspector, click a well or clickdrag<br />
to select replicate wells.<br />
b. Enter the sample name.<br />
c. If necessary, change the setting for the<br />
Passive Reference dye. (By default, the<br />
ROX dye is selected.)<br />
d. Repeat steps a through c until you specify<br />
sample names and passive reference dyes<br />
for all the wells on the plate.<br />
IMPORTANT! If your experiment does not<br />
use all the wells on a plate, do not omit the<br />
wells from use at this point. You can omit<br />
unused wells after the run. For information<br />
about omitting unused wells, refer to the<br />
Online Help.<br />
Note: You can change the sample setup<br />
information (sample name, detector, task)<br />
after a run is complete.<br />
e. Close the Well Inspector.<br />
7d 7a<br />
7e 7c<br />
8a 8b 8e 8c<br />
28 Absolute Quantification Getting Started Guide for the 7300/7500 System
9. Verify the information on each well in the Setup<br />
tab.<br />
Example Experiment<br />
Notes<br />
Creating a <strong>Relative</strong> Quantification (RQ) Plate Document<br />
Creating an RQ Plate Document<br />
In the example RQ experiment, the samples for each of the three tissues (liver, kidney, and bladder) are loaded on three<br />
separate plates. Consequently, three RQ Plate documents are created, one for each of the sample plates.<br />
Because the experiment is singleplex, there is only one sample—either a target or endogenous control—in each well. Each<br />
well is associated with a detector (indicated by the colored squares). Additionally, each well is assigned a detector task—T<br />
(target) or E (endogenous control).<br />
The figure below shows the example RQ Plate document after sample names, detectors, and detector tasks are assigned<br />
for each well in the liver plate.<br />
Sample name<br />
Detector task and<br />
color<br />
Absolute Quantification Getting Started Guide for the 7300/7500 System 29<br />
4
Chapter 4 Generating Data from RQ Plates<br />
Specifying Thermal Cycling Conditions and Starting the Run<br />
Specifying Thermal Cycling Conditions and Starting the Run<br />
Default Thermal Cycling Conditions for<br />
PCR<br />
If you selected the two-step RT-PCR method for your<br />
RQ experiment (recommended), you have already<br />
completed the RT step and are ready to PCR amplify<br />
cDNA.<br />
The default thermal cycling conditions for the PCR<br />
step of the procedure, shown in the following table,<br />
should appear in the Instrument tab.<br />
Notes<br />
1) RT Step<br />
2) PCR Step<br />
Thermal Cycling Conditions for One-Step<br />
RT-PCR<br />
If you select the one-step RT-PCR method, cDNA<br />
generation and amplification take place<br />
simultaneously at this point in the workflow.<br />
The following table shows the thermal cycling<br />
conditions for one-step RT-PCR experiments.<br />
Times and Temperatures (Two-step RT-PCR)<br />
HOLD HOLD * For reference only. RT is complete at this<br />
point.<br />
10 min @ 25 °C 120 min @ 37 °C<br />
AmpErase ® UNG<br />
Activation<br />
Initial Steps PCR (Each of 40 cycles)<br />
AmpliTaq Gold ® DNA<br />
Polymerase Activation<br />
HOLD HOLD CYCLE<br />
Melt Anneal/Extend<br />
2 min @ 50 °C 10 min @ 95 °C 15 sec @ 95 °C 1 min @ 60 °C<br />
Note: Refer to the Online Help for instructions on<br />
modifying thermal cycling parameters.<br />
Times and Temperatures (One-step RT-PCR)<br />
Initial Steps PCR (Each of 40 Cycles)<br />
Reverse Transcription AmpliTaq ® Gold DNA<br />
Polymerase Activation<br />
Melt Anneal/Extend<br />
HOLD HOLD CYCLE<br />
30 min @ 48 °C 10 min @ 95 °C 15 sec @ 95 °C 1 min @ 60 °C<br />
30 Absolute Quantification Getting Started Guide for the 7300/7500 System
To specify thermal cycling conditions and start the<br />
run:<br />
1. Select the Instrument tab.<br />
By default, the standard PCR conditions for the<br />
PCR step of the two-step RT-PCR method are<br />
displayed.<br />
2. Verify that:<br />
• For two-step RT-PCR, the default PCR<br />
thermal cycling conditions are set.<br />
• For one-step RT-PCR, you set the thermal<br />
cycling parameters as shown in “Thermal<br />
Cycling Conditions for One-Step RT-PCR”<br />
on page 30.<br />
• Sample volume is 50 µL.<br />
• 9600 Emulation is selected.<br />
3. Select File > Save As, enter a name for the RQ<br />
Plate document, then click Save.<br />
4. Load the plate into the instrument..<br />
5. Click Start.<br />
As the instrument performs the PCR run, it<br />
displays real-time status information in the<br />
Instrument tab and records the fluorescence<br />
emissions.<br />
After the run, a message indicates whether or not<br />
the run is successful.<br />
All data generated during the run are saved to the<br />
RQ Plate document that you specified in step 3.<br />
Notes<br />
Note: If you are using SYBR Green I<br />
chemistry and you want to determine if<br />
there is contamination or if you want to<br />
determine the dissociation temperature,<br />
create a separate Dissociation assay or<br />
template. Refer to the Online Help for more<br />
information.<br />
Note: In the 7300 instrument, the 9600<br />
Emulation feature is not available.<br />
Note: The A1 position is in the top-left side of<br />
the instrument tray.<br />
Specifying Thermal Cycling Conditions and Starting the Run<br />
Thermal Cycling Conditions for One-Step RT-PCR<br />
Well A1<br />
Keyed<br />
corner<br />
Absolute Quantification Getting Started Guide for the 7300/7500 System 31<br />
12<br />
4
Chapter 4 Generating Data from RQ Plates<br />
Analyzing and Viewing RQ Plate Data<br />
Analyzing and Viewing RQ Plate Data<br />
Starting the Analysis<br />
To analyze RQ Plate data after the run, click or<br />
select Analysis > Analyze. The SDS software<br />
mathematically transforms the raw fluorescence data<br />
to establish a comparative relationship between the<br />
spectral changes in the passive reference dye and<br />
those of the reporter dyes. Based on that comparison,<br />
the software generates four result views: Plate,<br />
Spectra, Component, and Amplification Plot.<br />
About the Results Tab<br />
In the Results tab, you can view the results of the run<br />
and change the parameters. For example, you can<br />
omit samples or manually set the baseline and<br />
threshold. If you change any parameters, you should<br />
reanalyze the data.<br />
The Results tab has four secondary tabs, each of<br />
which is described below. Details are provided in the<br />
Online Help.<br />
• To move between views, click a tab.<br />
• To select all 96 wells on a plate, click the upperleft<br />
corner of the plate.<br />
• To adjust graph settings, click the y- or x-axes of<br />
a plot to display the Graph Settings dialog. The<br />
adjustable settings depend on which plot you are<br />
viewing.<br />
Notes<br />
32 Absolute Quantification Getting Started Guide for the 7300/7500 System
Plate Tab<br />
Displays the results data of each well, including the:<br />
• Sample name and detector task and color for<br />
each well<br />
• Calculated Rn value<br />
Spectra Tab<br />
Displays the fluorescence spectra of selected wells.<br />
• The Cycles slider allows you to see the spectra<br />
for each cycle by dragging it with the pointer.<br />
• The Cycle # text box shows the current position<br />
of the slider.<br />
Component Tab<br />
Displays the complete spectral contribution of each<br />
dye in a selected well over the duration of the PCR<br />
run. Only the first selected well is shown at one time.<br />
Note: If you are using TaqMan ® products, three<br />
components (ROX ® dye, reporter dye, and TAMRA <br />
quencher) are displayed in the Component tab. If you<br />
are using TaqMan ® MGB products, only two<br />
components (ROX and reporter dyes) are displayed,<br />
as shown in the figure on the right.<br />
Amplification Plot Tab<br />
Displays a plot of R n as a function of cycle number for<br />
the selected detector and well(s).<br />
Notes<br />
Analyzing and Viewing RQ Plate Data<br />
Plate Tab<br />
Absolute Quantification Getting Started Guide for the 7300/7500 System 33<br />
4
Reanalyzing Data<br />
Notes<br />
Chapter 4 Generating Data from RQ Plates<br />
Exporting RQ Plate Data<br />
Raw fluorescence data (spectra), R n values, and well<br />
information (sample name, detector, and detector<br />
task) are saved in an RQ plate document.<br />
If you decide to omit wells or change well<br />
information after a run is complete, you must<br />
reanalyze the data.<br />
Note: After the software analyzes data, the Analyze<br />
button is disabled ( ). Whenever you change a<br />
setting that requires reanalysis, the Analyze button is<br />
enabled ( ).<br />
Exporting RQ Plate Data<br />
You can export numeric data from RQ plates into text<br />
files, which can then be imported into spreadsheet<br />
applications such as Microsoft Excel.<br />
1. Select File > Export, then select the data type to<br />
export:<br />
• Sample Setup (*.txt)<br />
• Calibration Data (*.csv)<br />
• Background Spectra (*.csv)<br />
• Component (*.csv)<br />
• Rn (*.csv)<br />
Typically, you export sample setup data for<br />
newly created and newly run plates; other data<br />
types are exported for existing plates.<br />
2. Enter a file name for the export file.<br />
Note: The name of the dialog box depends on<br />
the type of data you want to export.<br />
3. Click Save.<br />
34 Absolute Quantification Getting Started Guide for the 7300/7500 System
Chapter 5<br />
Workflow<br />
Notes<br />
Analyzing Data in an RQ Study<br />
Primer Extended on mRNA<br />
5′ 3′<br />
5′ cDNA<br />
Reverse<br />
Primer<br />
Oligo d(T) or random hexamer<br />
Synthesis of 1st cDNA strand<br />
3′ 5′ cDNA<br />
Introduction<br />
and Sample<br />
RQ Experiment<br />
Designing<br />
an RQ<br />
Experiment<br />
Performing<br />
Reverse<br />
Transcription<br />
Generating<br />
Data from<br />
RQ Plates<br />
Performing<br />
an RQ Study<br />
Create a new<br />
RQ Study document<br />
Configure<br />
analysis settings<br />
Adjust the<br />
baseline and threshold<br />
Analyze and view results<br />
If necessary,<br />
omit samples<br />
Export the RQ Study<br />
document, if desired<br />
See page 36<br />
See page 38<br />
See page 40<br />
See page 45<br />
See page 50<br />
Seepage52<br />
Absolute Quantification Getting Started Guide for the 7300/7500 System 35<br />
5
Notes<br />
Chapter 5 Analyzing Data in an RQ Study<br />
Creating an RQ Study Document<br />
Creating an RQ Study Document<br />
To conduct a comparative analysis of RQ plates in a<br />
study, you must first create an RQ Study document.<br />
IMPORTANT! RQ Study software is an optional<br />
package for the 7300 instrument but is standard for<br />
the 7500 instrument.<br />
The SDS software uses the comparative method<br />
(2 − ∆∆Ct ) of relative <strong>quantification</strong>. For more<br />
information about methods of calculating relative<br />
<strong>quantification</strong>, refer to ABI PRISM ® 7700 Sequence<br />
Detection System User Bulletin #2 (PN 4303859).<br />
To create a new RQ Study document:<br />
1. Select File> New.<br />
2. In the Assay drop-down list of the New<br />
Document Wizard, select <strong>Relative</strong><br />
Quantification (ddCt) Study. Accept the default<br />
settings for Container and Template<br />
(96-Well Clear and Blank Document).<br />
3. Enter a name in the Default Plate Name field, or<br />
accept the default.<br />
4. Click Next>.<br />
In an RQ study, you can... You cannot<br />
Select the endogenous control and the calibrator sample.<br />
Select the control type when applicable.<br />
Set baseline and threshold values and RQ Min/Max<br />
Confidence Levels.<br />
Omit individual wells or sample replicates.<br />
Create, add, or modify samples.<br />
Create, add, or modify detectors.<br />
Change detector tasks.<br />
(You can perform these operations in RQ Plate<br />
documents.)<br />
36 Absolute Quantification Getting Started Guide for the 7300/7500 System
5. Add RQ plates to the study.<br />
Notes<br />
a. Click Add Plates.<br />
Note: You can add up to 10 RQ plates to an<br />
RQ study.<br />
b. Select the plate(s) that you want to add to<br />
the study, then click Open.<br />
The selected plates are displayed.<br />
IMPORTANT! All plates added to a study<br />
must have identical thermal cycling<br />
parameters—the same number of steps,<br />
cycles, sample volume, emulation mode.<br />
The SDS software will reject a plate if it<br />
detects any differences. (The first plate<br />
added to the study serves as the reference<br />
plate against which other plates are<br />
compared.)<br />
6. Click Finish. If desired, save the RQ Study<br />
document when prompted.<br />
The SDS software opens a new RQ Study<br />
document and displays the RQ Study main view<br />
with its three panes:<br />
a. RQ Detector grid – Allows you to select<br />
detectors to associate with the loaded study.<br />
For each detector,Color, Detector name,<br />
Threshold value, Auto Ct, and Baseline are<br />
displayed.<br />
Note: At this point, all the values in the<br />
Threshold, Auto Ct, and Baseline columns<br />
are set to the default values (0.200000,<br />
Manual, and [6,15], respectively).<br />
b. RQ Sample grid – Displays the samples<br />
associated with the selected detector(s). The<br />
Sample Grid displays numerical results of<br />
RQ calculations and has two subtabs:<br />
Sample Summary and Well Information.<br />
Creating an RQ Study Document<br />
Absolute Quantification Getting Started Guide for the 7300/7500 System 37<br />
6a<br />
6b<br />
6c<br />
o<br />
5
Notes<br />
Chapter 5 Analyzing Data in an RQ Study<br />
Configuring Analysis Settings<br />
c. RQ Results panel – Contains the three<br />
results-based tabs: Plate (default),<br />
Amplification Plot, and Gene Expression.<br />
Note: You can save the RQ Study<br />
document now, or wait until after specifying<br />
analysis settings and analyzing the data.<br />
Configuring Analysis Settings<br />
After you create the RQ Study document, you must<br />
specify parameter values for the analysis.<br />
Unless you have already determined the optimal<br />
baseline and threshold settings for your experiment,<br />
use the automatic baseline and threshold feature of the<br />
SDS software (auto Ct), explained below. If the<br />
baseline and threshold were called correctly for each<br />
well, you can proceed to view the results. Otherwise,<br />
you must manually set the baseline and threshold as<br />
explained in “Manual Baseline and Threshold<br />
Determination” on page 40.<br />
To configure analysis settings:<br />
1. Click or select Analysis > Analysis Settings.<br />
2. In the Detector drop-down list, select All.<br />
3. Select Auto Ct. The SDS software automatically<br />
generates baseline and threshold values for each<br />
well.<br />
IMPORTANT! After analysis, you must verify<br />
that the baseline and threshold were called<br />
correctly for each well, as explained in<br />
“Adjusting the Baseline and Threshold” on<br />
page 40.<br />
Alternatively, you can select Manual Ct and<br />
specify the threshold and baseline manually.<br />
38 Absolute Quantification Getting Started Guide for the 7300/7500 System<br />
2<br />
3<br />
4<br />
5<br />
6<br />
7<br />
8
4. Select the Calibrator Sample.<br />
Notes<br />
Note: If your experiment uses only a single<br />
plate, there must be at least two different samples<br />
that have different names and have their own<br />
endogenous controls. (You can go back to a<br />
saved RQ Plate document and change the sample<br />
names, if necessary.)<br />
5. Select the Endogenous Control Detector.<br />
6. Select the Control Type if the study contains both<br />
multiplex and nonmultiplex reactions.<br />
Note: The Multiplexed or Non-Multiplexed<br />
options are active only if the plates loaded for<br />
analysis contain both multiplexed and<br />
nonmultiplexed reactions that share the same<br />
endogenous control.<br />
7. Select the RQ Min/Max Confidence level.<br />
Note: The SDS software uses this value to<br />
calculate error bars for gene expression levels, as<br />
explained in “Error Bars for Gene Expression<br />
Plots” on page 48.<br />
8. Optionally, select Remove Outliers to enable the<br />
SDS software to automatically identify and filter<br />
outliers for groups containing at least four<br />
replicates.<br />
Note: You can also remove outliers manually, as<br />
explained in “Omitting Samples from a Study”<br />
on page 50.<br />
9. Click OK & Reanalyze. The detector<br />
information appears in the RQ Detector grid.<br />
After analysis, the Threshold column displays<br />
the automatically calculated threshold values.<br />
The Auto Ct and Baseline columns are set to<br />
“Auto.”<br />
For more information about the settings in the<br />
Analysis Settings dialog box, refer to the Online<br />
Help.<br />
Configuring Analysis Settings<br />
Absolute Quantification Getting Started Guide for the 7300/7500 System 39<br />
5
Notes<br />
Chapter 5 Analyzing Data in an RQ Study<br />
Adjusting the Baseline and Threshold<br />
After the analysis, you must verify that the baseline<br />
and threshold were called correctly for each detector,<br />
as explained in the following section.<br />
Adjusting the Baseline and Threshold<br />
Automatic Baseline and Threshold<br />
Determination<br />
The SDS software calculates baseline and threshold<br />
values for a detector based on the assumption that the<br />
data exhibit the “typical” amplification curve.<br />
A typical amplification curve has a:<br />
• Plateau phase (a)<br />
• Linear phase (b)<br />
• Geometric phase (c)<br />
• Background (d)<br />
• Baseline (e)<br />
Experimental error (such as contamination, pipetting<br />
errors, and so on) can produce data that deviate<br />
significantly from data for typical amplification<br />
curves. Such atypical data cause the software<br />
algorithm to generate incorrect baseline and threshold<br />
values for the associated detector.<br />
Therefore, Applied Biosystems recommends<br />
reviewing all baseline and threshold values after<br />
analysis of the study data. If necessary, adjust the<br />
values manually as described on page 43.<br />
Manual Baseline and Threshold<br />
Determination<br />
If you set the baseline and threshold values manually<br />
for any detector in the study, you must perform the<br />
procedure on page 43 for each of the detectors.<br />
The following amplification plots show the effects of<br />
baseline and threshold settings.<br />
40 Absolute Quantification Getting Started Guide for the 7300/7500 System<br />
∆R n<br />
Threshold<br />
Cycle<br />
a<br />
b<br />
c<br />
d<br />
e
Baseline Set Correctly<br />
The amplification curve begins after the maximum<br />
baseline. No adjustment necessary.<br />
Baseline Set Too Low<br />
The amplification curve begins too far to the right of<br />
the maximum baseline. Increase the End Cycle value.<br />
Baseline Set Too High<br />
The amplification curve begins before the maximum<br />
baseline. Decrease the End Cycle value.<br />
Notes<br />
Adjusting the Baseline and Threshold<br />
Manual Baseline and Threshold Determination<br />
Absolute Quantification Getting Started Guide for the 7300/7500 System 41<br />
5
Chapter 5 Analyzing Data in an RQ Study<br />
Adjusting the Baseline and Threshold<br />
Threshold Set Correctly<br />
The threshold is set in the geometric phase of the<br />
amplification curve.<br />
Threshold settings above or below the optimum<br />
increase the standard error of the replicate groups.<br />
Threshold Set Too Low<br />
The threshold is set below the geometric phase of the<br />
amplification curve. The standard error is<br />
significantly higher than that for a plot where the<br />
threshold is set correctly. Drag the threshold bar up<br />
into the geometric phase of the curve.<br />
Threshold Set Too High<br />
The threshold is set above the geometric phase of the<br />
amplification curve. The standard error is<br />
significantly higher than that for a plot where the<br />
threshold is set correctly. Drag the threshold bar down<br />
into the geometric phase of the curve.<br />
Notes<br />
42 Absolute Quantification Getting Started Guide for the 7300/7500 System
To manually adjust the baseline and threshold:<br />
1. Select the Amplification Plot tab, then select<br />
Delta Rn vs. Cycle in the Data drop-down list.<br />
2. In the RQ Detector grid, select a detector.<br />
The SDS software displays the:<br />
• Associated samples (from all plates<br />
included in the study) in the RQ<br />
Sample grid.<br />
• Graph for the selected detector in the<br />
RQ Results panel.<br />
Notes<br />
Note: When manually adjusting baseline<br />
and threshold settings, you can select only<br />
one detector at a time. If you select multiple<br />
detectors, the Analysis Settings section and<br />
the threshold bar are disabled.<br />
3. Set the baseline for the detector.<br />
a. Under Analysis Settings, select Manual<br />
Baseline.<br />
Adjusting the Baseline and Threshold<br />
Manual Baseline and Threshold Determination<br />
Absolute Quantification Getting Started Guide for the 7300/7500 System 43<br />
1<br />
2<br />
Geometric<br />
phase of the<br />
amplification<br />
curve<br />
4b<br />
5
Notes<br />
Chapter 5 Analyzing Data in an RQ Study<br />
Adjusting the Baseline and Threshold<br />
b. Enter values in the Start Cycle and End<br />
Cycle fields, ensuring that the amplification<br />
curve growth begins at a cycle after the End<br />
Cycle value.<br />
Note: After you change a baseline or<br />
threshold setting for a detector, the Analyze<br />
button ( ) is enabled, indicating that you<br />
must reanalyze the data.<br />
4. Set the threshold for the detector.<br />
a. Under Analysis Settings, select Manual Ct.<br />
b. Drag the threshold setting bar so the<br />
threshold is:<br />
• Above the background<br />
• Below the plateaued and linear regions<br />
of the amplification curve<br />
• Within the geometric phase of the<br />
amplification curve<br />
The SDS software adjusts the theshold<br />
value and displays it in the Threshold field<br />
after reanalyzing.<br />
5. Repeat steps 2 through 3 to set the baseline and<br />
threshold values for all remaining detectors in<br />
the study.<br />
6. Click or select Analysis > Analyze to<br />
reanalyze the data using the adjusted baseline<br />
and threshold values.<br />
Click and drag the Threshold setting<br />
to adjust the threshold. The bar turns<br />
red, indicating that the threshold has<br />
been changed.<br />
44 Absolute Quantification Getting Started Guide for the 7300/7500 System
Notes<br />
Analyzing and Viewing the Results of the RQ Study<br />
Selecting Detectors to Include in Results Graphs<br />
Analyzing and Viewing the Results of the RQ Study<br />
Selecting Detectors to Include in Results<br />
Graphs<br />
In the RQ Detector Grid, select detectors to include in<br />
the result graphs by clicking a detector. (Ctrl-click to<br />
include multiple detectors; Click-drag to include<br />
multiple adjacent detectors.)<br />
The corresponding samples appear in the RQ Sample<br />
Grid. Depending on which tab you select in the RQ<br />
Results Panel (Plate, Amplification Plot, or Gene<br />
Expression), analysis results are displayed.<br />
To see information about a specific well, select the<br />
Well Information tab.<br />
Example Experiment<br />
Suppose that you want to view the comparative gene expression levels of the following genes when the liver tissue is used<br />
as the calibrator: ACVR1, ACVR2, CCR2, CD3D, and FLT4. Selecting the detectors in the RQ Detector grid (1) displays the<br />
sample information in the RQ Sample grid (2) and in a result graph in the RQ Results panel (3). Note that:<br />
The Gene Expression tab is selected, and the gene expression levels are sorted by detector.<br />
Gene expression levels for bladder samples are indicated by the green bar; those for kidney samples by the blue bar.<br />
These colors also indicate the samples in the RQ Sample Grid and the RQ Results Panel plots.<br />
Because liver samples are used as calibrators, the expression levels are set to 1. But because the gene expression levels<br />
were plotted as log10 values (and the log10 of 1 is 0), the expression level of the calibrator samples appear as 0 in the<br />
graph.<br />
Because the relative quantities of the targets are normalized against the relative quantities of the endogenous control,<br />
the expression level of the endogenous control is 0; there are no bars for GAPDH.<br />
Fold-expression changes are calculated using the equation 2−∆∆CT .<br />
1<br />
2<br />
Absolute Quantification Getting Started Guide for the 7300/7500 System 45<br />
3<br />
5
Amplification Plot<br />
Notes<br />
Chapter 5 Analyzing Data in an RQ Study<br />
Analyzing and Viewing the Results of the RQ Study<br />
The three Amplification Plots allow you to view postrun<br />
amplification of specific samples. The<br />
Amplification Plots display all samples for selected<br />
detectors.<br />
You can adjust graph settings by clicking the y- or xaxes<br />
of a plot to display the Graph Settings dialog, as<br />
shown on page 32.<br />
Rn vs. Cycle (Linear) View<br />
Displays normalized reporter dye fluorescence (R n ) as<br />
a function of cycle. You can use this plot to identify<br />
and examine irregular amplification.<br />
For more information about R n , refer to the SDS<br />
Chemistry Guide.<br />
∆Rn vs. Cycle (Log) View<br />
Displays dye fluorescence (∆R n ) as a function of<br />
cycle number. You can use this plot to identify and<br />
examine irregular amplification and to manually set<br />
the threshold and baseline parameters for the run.<br />
Ct vs. Well Position View<br />
Displays threshold cycle (C T ) as a function of well<br />
position. You can use this plot to locate outliers from<br />
detector data sets (see “Omitting Samples from a<br />
Study” on page 50 for more information).<br />
46 Absolute Quantification Getting Started Guide for the 7300/7500 System
Gene Expression Plot<br />
Gene Expression plots show the expression level or<br />
fold-difference of the target sample relative to the<br />
calibrator.<br />
Because the calibrator is compared to itself, the<br />
expression level for the calibrator is always 1.<br />
Adjusting Graph Settings<br />
You can adjust graph settings for gene expression<br />
plots in the Graph Settings dialog box, including:<br />
• Bar width<br />
• 3D bars<br />
• Autoscaling<br />
• Data display as Log10 RQ or Raw RQ<br />
Refer to the Online Help for more information about<br />
adjusting graph settings for gene expression plots.<br />
Gene Expression Plot Orientation: Detector<br />
Detectors are plotted on the x-axis, and each bar<br />
shows the detector value of a single sample.<br />
Notes<br />
Analyzing and Viewing the Results of the RQ Study<br />
Gene Expression Plot<br />
Absolute Quantification Getting Started Guide for the 7300/7500 System 47<br />
5
Chapter 5 Analyzing Data in an RQ Study<br />
Analyzing and Viewing the Results of the RQ Study<br />
Gene Expression Plot Orientation: Sample<br />
Samples are plotted on the x-axis, and each bar shows<br />
the set of sample values of a single detector.<br />
Error Bars for Gene Expression Plots<br />
The SDS software displays error bars for each column<br />
in the plot provided that the associated expression<br />
level was calculated from a group of two or more<br />
replicates. The error bars display the calculated<br />
maximum (RQMax) and minimum (RQMin)<br />
expression levels that represent standard error of the<br />
mean expression level (RQ value). Collectively, the<br />
upper and lower limits define the region of expression<br />
within which the true expression level value is likely<br />
to occur.<br />
The SDS software calculates the error bars based on<br />
the RQMin/Max Confidence Level in the Analysis<br />
Settings dialog box (see page 38).<br />
Notes<br />
48 Absolute Quantification Getting Started Guide for the 7300/7500 System
Reanalyzing an RQ Study<br />
If you change any of the analysis settings, you must<br />
reanalyze the data before you can view results. (You<br />
can switch between the variations of the<br />
Amplification and Gene Expression plots without<br />
having to reanalyze the data.)<br />
Suppose you select Liver as the calibrator, then<br />
perform an analysis. Next, you view the<br />
Amplification and Gene Expression plots. If you then<br />
want to use Kidney or Bladder as the calibrator, you<br />
need to reanalyze the data before viewing results.<br />
Similarly, if you want to change the baseline or<br />
threshold values, the endogenous control, the control<br />
type, or the RQ Min/Max parameters, you need to<br />
reanalyze your data.<br />
Notes<br />
Reanalyzing an RQ Study<br />
Calibrator Gene Expression Plot<br />
Absolute Quantification Getting Started Guide for the 7300/7500 System 49<br />
Liver<br />
Kidney<br />
Bladder<br />
5
Notes<br />
Chapter 5 Analyzing Data in an RQ Study<br />
Omitting Samples from a Study<br />
Omitting Samples from a Study<br />
Experimental error may cause some wells to amplify<br />
insufficiently or not at all. These wells typically<br />
produce C T values that differ significantly from the<br />
average for the associated replicate wells. If included<br />
in the calculations, these outlying wells (outliers) can<br />
result in erroneous measurements.<br />
To ensure precise relative <strong>quantification</strong>, you must<br />
carefully view replicate groups for outliers. You can<br />
remove outliers manually using the C T vs. Well<br />
Position Amplification Plot.<br />
To remove samples from an RQ Study:<br />
1. Select the Amplification Plot tab.<br />
2. In the Data drop-down list, select Ct vs. Well<br />
Position.<br />
3. In the RQ Detector grid, select a detector to<br />
examine. All samples that use this detector are<br />
displayed in the RQ Samples grid.<br />
4. In the RQ Samples grid, click to select the<br />
samples to display in the Amplification Plot.<br />
5. Verify the uniformity of each replicate<br />
population by comparing the groupings of C T<br />
values for the wells that make up the set.<br />
Good<br />
clustering<br />
of replicate<br />
data. No<br />
outliers.<br />
Potential<br />
outlier.<br />
50 Absolute Quantification Getting Started Guide for the 7300/7500 System<br />
1<br />
2<br />
3<br />
4
6. Do one of the following:<br />
• If outliers are present, select the Well<br />
Information tab, find the outlying sample,<br />
and select the Omit check box for the<br />
sample.<br />
• If outliers are not present, go to step 7.<br />
7. Repeat steps 5 and 6 to screen the remaining<br />
replicate groups.<br />
8. Select Analysis > Analyze ( ) to reanalyze the<br />
run without the outlying data.<br />
9. Repeat steps 3 to 8 for other detectors you want<br />
to screen.<br />
Notes<br />
Omitting Samples from a Study<br />
The Select outlier is<br />
removed Omit.<br />
during<br />
analysis.<br />
The The outlier is is<br />
removed<br />
during<br />
analysis.<br />
Absolute Quantification Getting Started Guide for the 7300/7500 System 51<br />
5
Notes<br />
Chapter 5 Analyzing Data in an RQ Study<br />
Exporting RQ Study Data<br />
Exporting RQ Study Data<br />
You can export numeric data from RQ studies into<br />
text files, which can then be imported into spreadsheet<br />
applications such as Excel.<br />
1. Select File > Export > Results, then select the<br />
data type to export:<br />
• Sample Summary (*.csv)<br />
• Well Information (*.csv)<br />
• Both (*.csv)<br />
Refer to the Online Help for information about<br />
the export file types.<br />
2. Enter a file name for the export file.<br />
Note: The name of the dialog box depends on<br />
the type of data you want to export.<br />
3. Click Save.<br />
52 Absolute Quantification Getting Started Guide for the 7300/7500 System
Before you can use a plate document to run a plate,<br />
you need to create and apply detectors for all samples<br />
on the plate. A detector is a virtual representation of a<br />
gene- or allele-specific nucleic acid probe reagent<br />
used for analyses performed on instruments.<br />
To create a detector:<br />
1. Select Tools > Detector Manager.<br />
Notes<br />
Note: A plate document (any type) must be open<br />
before you can access the Tools menu.<br />
2. Select File > New.<br />
3. In the New Detector dialog box, enter a name for<br />
the detector.<br />
IMPORTANT! The name of the detector must be<br />
unique and should reflect the target locus of the<br />
assay (such as GAPDH or RNase P). Do not use<br />
the same name for multiple detectors.<br />
4. Optionally, click the Description field, then<br />
enter a brief description of the detector.<br />
Creating Detectors<br />
A<br />
Absolute Quantification Getting Started Guide for the 7300/7500 System 53<br />
2<br />
3<br />
4<br />
5<br />
6<br />
7
Appendix A<br />
5. In the Reporter Dye and Quencher Dye dropdown<br />
lists, select the appropriate dyes for the<br />
detector.<br />
6. Click the Color box, select a color to represent<br />
the detector using the Color dialog box, then<br />
click OK.<br />
7. Optionally, click the Notes field, then enter any<br />
additional comments for the detector.<br />
8. Click OK to save the detector and return to the<br />
Detector Manager.<br />
9. Repeat steps 2 through 8 for the remaining<br />
detectors.<br />
10. In the Detector Manager, click Done when you<br />
finish adding detectors.<br />
g<br />
Notes<br />
Note: The dyes that appear on the Reporter and<br />
Quencher Dye lists are those that have been<br />
previously entered using the Dye Manager. If the<br />
dye that you want to use does not appear in a list,<br />
use the Dye Manager to add the dye and then<br />
return to this step in this procedure. Refer to the<br />
Online Help for more information.<br />
Note: Select TAMRA as the quencher for<br />
TaqMan probes and None for TaqMan MGB<br />
probes.<br />
Example Experiment<br />
In the example RQ experiment, a detector is created for each target gene and the endogenous control. 24 detectors are<br />
created: 23 for the target genes and 1 for the endogenous control, GAPDH.<br />
For example, the detector for the ACVR1 gene is named ACVR1 and assigned a yellow color. Because all Assays-on-<br />
Demand products have probes that are labeled with FAM dye, FAM was selected for the reporter dye. Additionally,<br />
Assays-on-Demand products use TaqMan MGB probes, which use nonfluorescent quenchers. No quencher dye is selected<br />
for the detector.<br />
Note: Assays-on-Demand products are shipped with an assay information file (AIF). This text-based file contains<br />
information about the assays that you ordered, including the Applied Biosystems Assay ID number, well-location<br />
of each assay, primer concentration, and primer sequence. The file also indicates the reporter dyes and quenchers<br />
(if applicable) that are used for each assay. When creating detectors, you use the reporter dye and quencher<br />
information (and optionally, the gene name or symbol for the sample name). You can view the contents of AIFs in<br />
a spreadsheet program, such as Microsoft Excel.<br />
54 Absolute Quantification Getting Started Guide for the 7300/7500 System
References<br />
Kwok, S. and Higuchi, R. 1989. Avoiding false positives with PCR. Nature<br />
339:237–238.<br />
Mullis, K.B. and Faloona, F.A. 1987. Specific synthesis of DNA in vitro via a<br />
polymerase-catalyzed chain reaction. Methods Enzymol. 155:335–350.<br />
Livak, K.J., and Schmittgen, T.D. 2001. Analysis of <strong>Relative</strong> Gene Expression Data<br />
Using Real-Time Quantitative PCR and the 2 –∆∆CT Method. Methods 25:402–408.<br />
Saiki, R.K., Scharf, S., Faloona, F., et al. 1985. Enzymatic amplification of β-globin<br />
genomic sequences and restriction site analysis for diagnosis of sickle cell anemia.<br />
Science 230:1350–1354.<br />
Absolute Quantification Getting Started Guide for the 7300/7500 System 55
References<br />
56 Absolute Quantification Getting Started Guide for the 7300/7500 System
Numerics<br />
3D bars 47<br />
5′-nuclease assay 15<br />
9600 Emulation Mode 31<br />
A<br />
AIF. See assay information files<br />
AmpErase UNG 16<br />
amplification curve 40<br />
amplification plots<br />
Amplification Plot view for RQ plates 33<br />
types of amplification plots for RQ studies 45<br />
appearance of graphs 32, 46, 47<br />
Applied Biosystems<br />
contacting viii<br />
customer feedback on documentation viii<br />
Services and Support viii<br />
Technical Communications viii<br />
Technical Support viii<br />
assay information files 54<br />
Assays-by-Design 17<br />
Assays-on-Demand 17<br />
autoscaling options 32, 46, 47<br />
B<br />
background in amplification curve 40<br />
bar width 47<br />
baseline<br />
adjusting 40<br />
defintion 3<br />
examples 41<br />
C<br />
calibrating the 7300/7500 instrument 24<br />
calibrator<br />
definition 13<br />
selecting in RQ studies 39<br />
CAUTION, description vii<br />
cDNA<br />
generating 21<br />
storing 22<br />
See also reverse transcription<br />
Chemistries 15<br />
comparative method of calculation 3, 36<br />
Component view 33<br />
concentration of RNA 20<br />
confidence levels 39<br />
conventions, text vii<br />
Ct. See threshold cycle<br />
curves<br />
amplification 40<br />
standard 2<br />
Index<br />
Absolute Quantification Getting Started Guide for the 7300/7500 System 57<br />
D<br />
data<br />
analyzing 32, 45<br />
exporting 34, 52<br />
generating PCR data from RQ plates 31<br />
importing 27<br />
omitting from a study 50<br />
delta Rn 3<br />
Delta Rn vs.Cycle view 46<br />
designing RQ experiments<br />
determining reagent configuration 15<br />
PCR method 12<br />
primers and probes 17<br />
selecting the chemistry 15<br />
Detector Manager dialog box 53<br />
detector tasks, definition 26<br />
detectors<br />
adding to RQ plates 27<br />
creating 53<br />
definition 53<br />
selecting for RQ studies 38<br />
deviation, standard 42<br />
display options 32, 46, 47<br />
documentation, feedback viii<br />
documents<br />
exporting 34, 52<br />
RQ Plate 26<br />
RQ Study 36<br />
templates 27<br />
dyes<br />
FAM 17, 54<br />
reporter 3<br />
ROX 28, 33
Index<br />
dyes (continued)<br />
SYBR Green I 15, 17<br />
TAMRA 33, 54<br />
E<br />
emulation mode, 9600 31<br />
endogenous controls<br />
associating with detectors 26<br />
definition 13<br />
for RQ plates 26<br />
selecting for RQ studies 39<br />
endpoint PCR 2<br />
equipment 4<br />
example RQ experiment<br />
components 14<br />
creating detectors 54<br />
description 5<br />
PCR master mix 25<br />
PCR method 12<br />
reverse transcription 22<br />
RQ Plate document, example 29<br />
RQ Study document, example 45<br />
exporting data<br />
RQ plates 34<br />
RQ studies 52<br />
F<br />
FAM dye 17, 54<br />
G<br />
Gene Expression plots 47<br />
geometric phase of amplification curve 40<br />
graph settings 32, 46, 47<br />
<strong>guide</strong>lines<br />
preparing RNA 20<br />
H<br />
High Capacity cDNA Archive kit 21<br />
I<br />
importing plate setup information 27<br />
Instrument tab 31<br />
L<br />
line width 32, 46, 47<br />
linear phase of amplification curve 40<br />
M<br />
master mix, PCR 24<br />
materials 4<br />
mode, emulation 31<br />
MSDSs,obtaining viii<br />
multiplex PCR 12<br />
N<br />
New Detector dialog box 53<br />
normalized reporter 3<br />
O<br />
options, display 32, 46, 47<br />
options, graph 32, 46, 47<br />
outliers 50<br />
P<br />
passive reference 3, 28<br />
PCR<br />
end-point 2<br />
master mix, preparing 24<br />
multiplex 12<br />
real-time 2<br />
selecting a method 12<br />
singleplex 12<br />
starting an RQ plate run 31<br />
phases of amplification curve 40<br />
Plate view 33<br />
plate, RQ. See RQ plates<br />
plateau phase of amplification curve 40<br />
plot appearance 32, 46, 47<br />
Primer Express Software 17<br />
primers 17<br />
probes 17, 54<br />
R<br />
reagent configurations 16<br />
real-time PCR assays 2<br />
reference sample.See calibrator<br />
reference, passive 3, 28<br />
relative <strong>quantification</strong><br />
comparative method of calculation 3<br />
definition 2<br />
example experiment 5<br />
experiments.See also RQ experiments 2<br />
real-time PCR 2<br />
references 2<br />
RQ plates 3<br />
RQ studies 3<br />
replicates 13<br />
reporter dye 3<br />
58 Absolute Quantification Getting Started Guide for the 7300/7500 System
Results tab 32<br />
results, RQ Study analysis 45<br />
reverse transcription<br />
<strong>guide</strong>lines for preparing RNA 20<br />
High Capacity cDNA Archive kit 21<br />
thermal cycling parameters 21<br />
Rn vs. Cycle view 46<br />
Rn. See normalized reporter<br />
RNA<br />
<strong>guide</strong>lines for preparing 20<br />
isolation 20<br />
starting concentration 20<br />
ROX dye 28, 33<br />
RQ Detector grid 39<br />
RQ experiments<br />
chemistries 15<br />
components 13<br />
probes and primers 17<br />
reagent configuration 15<br />
requirements 13<br />
workflow 2<br />
RQ Main Study view 37<br />
RQ plates<br />
adding to RQ studies 37<br />
Amplification Plot view 33<br />
analyzing 32<br />
Component view 33<br />
data types 34<br />
definition 3<br />
detectors, creating 53<br />
exporting data 34<br />
Plate view 33<br />
reanalyzing data 34<br />
results 32<br />
RQ Plate documents 26<br />
Spectra view 33<br />
starting a run 31<br />
RQ Results panel 45<br />
RQ Sample grid 45<br />
RQ studies<br />
adding RQ plates 37<br />
Amplification Plots 45<br />
confidence level 39<br />
control type 39<br />
data types 52<br />
definition 3<br />
exporting data 52<br />
Gene Expression plots 47<br />
omitting samples from 50<br />
orientation 47<br />
reanalyzing data 49<br />
results 45<br />
RQ Study documents 36<br />
RT-PCR<br />
one-step 16, 30<br />
two-step 16, 30<br />
Absolute Quantification Getting Started Guide for the 7300/7500 System 59<br />
S<br />
Services and Support, obtaining viii<br />
settings, graph 32, 46, 47<br />
Setup tab 29<br />
singleplex PCR 12<br />
Spectra view 33<br />
standard curves 2<br />
standard deviation, effect of threshold on 42<br />
starting an RQ plate run 31<br />
study, RQ. See RQ studies<br />
SYBR Green I dye chemistry 15<br />
T<br />
TAMRA dye 33, 54<br />
TaqMan chemistry 15<br />
TaqMan MGB probes 18, 54<br />
TaqMan Universal PCR Master Mix 24<br />
target<br />
associating with detectors 26<br />
definition 13<br />
tasks. See detector tasks<br />
Technical Communications, contacting viii<br />
Technical Support, contacting viii<br />
template documents 27<br />
text conventions vii<br />
thermal cycling conditions<br />
default for PCR 30<br />
one-step RT-PCR 30<br />
specifying 31<br />
two-step RT-PCR 30<br />
thermal cycling parameters<br />
for plates added to a study 37<br />
RT using High Capacity cDNA Archive kit 21<br />
threshold<br />
adjusting 40<br />
definition 3<br />
examples 42<br />
threshold cycle<br />
definition 3<br />
setting for RQ studies 38<br />
Training, obtaining information about viii<br />
U<br />
uracil-N-glycosylase 16<br />
Index
Index<br />
W<br />
WARNING, description vii<br />
Well Information tab 45<br />
wells, replicate 13<br />
width, bars 47<br />
width, lines 32, 46, 47<br />
workflow, RQ experiment overview 2<br />
X<br />
x-axis 32, 46, 47<br />
Y<br />
y-axis 32, 46, 47<br />
60 Absolute Quantification Getting Started Guide for the 7300/7500 System
Headquarters<br />
850 Lincoln Centre Drive<br />
Foster City, CA 94404 USA<br />
Phone: +1 650.638.5800<br />
Toll Free (In North America): +1 800.345.5224<br />
Fax: +1 650.638.5884<br />
Worldwide Sales and Support<br />
Applied Biosystems vast distribution and service<br />
network, composed of highly trained support and<br />
applications personnel, reaches 150 countries on six<br />
continents. For sales office locations and technical<br />
support, please call our local office or refer to our Web<br />
site at www.appliedbiosystems.com.<br />
Applera is committed to providing the world’s<br />
leading technology and information for life scientists.<br />
Applera Corporation consists of the Applied Biosystems<br />
and Celera Genomics businesses.<br />
Printed in the USA, 01/2004<br />
Part Number 4347824 Rev. A