Cyprus - European Agency for Safety and Health at Work - Europa
Cyprus - European Agency for Safety and Health at Work - Europa
Cyprus - European Agency for Safety and Health at Work - Europa

You also want an ePaper? Increase the reach of your titles
YUMPU automatically turns print PDFs into web optimized ePapers that Google loves.
OSH in figures - Occup<strong>at</strong>ional safety <strong>and</strong> health in the transport sector – an overview<br />
3 St<strong>at</strong>istical <strong>and</strong> analytical d<strong>at</strong>a collection on Transport<br />
The transport sector in this templ<strong>at</strong>e refers to the following NACE codes.<br />
NACE 60: L<strong>and</strong> transport; transport via pipelines<br />
601 Rail transport<br />
602 Road transport<br />
6021 + 6022 + 6023 = Transport of persons<br />
6024 = Freight transport by road<br />
603 Transport through pipes<br />
NACE 61: Transport over w<strong>at</strong>er<br />
611 Transport overseas<br />
612 Inl<strong>and</strong> navig<strong>at</strong>ion<br />
NACE 62: Air transport<br />
3.1 Contextual fe<strong>at</strong>ures<br />
3.1.1 General prevalence – Employment<br />
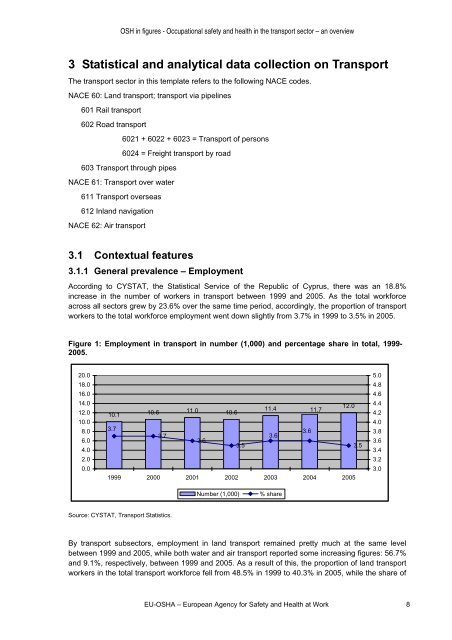
According to CYSTAT, the St<strong>at</strong>istical Service of the Republic of <strong>Cyprus</strong>, there was an 18.8%<br />
increase in the number of workers in transport between 1999 <strong>and</strong> 2005. As the total work<strong>for</strong>ce<br />
across all sectors grew by 23.6% over the same time period, accordingly, the proportion of transport<br />
workers to the total work<strong>for</strong>ce employment went down slightly from 3.7% in 1999 to 3.5% in 2005.<br />
Figure 1: Employment in transport in number (1,000) <strong>and</strong> percentage share in total, 1999-<br />
2005.<br />
20.0<br />
18.0<br />
16.0<br />
14.0<br />
12.0<br />
10.0<br />
8.0<br />
6.0<br />
4.0<br />
2.0<br />
0.0<br />
10.1 10.6 11.0 10.6<br />
3.7 3.6<br />
3.7<br />
3.6<br />
3.6<br />
3.5 3.5<br />
1999 2000 2001 2002 2003 2004 2005<br />
Source: CYSTAT, Transport St<strong>at</strong>istics.<br />
11.4<br />
Number (1,000) % share<br />
By transport subsectors, employment in l<strong>and</strong> transport remained pretty much <strong>at</strong> the same level<br />
between 1999 <strong>and</strong> 2005, while both w<strong>at</strong>er <strong>and</strong> air transport reported some increasing figures: 56.7%<br />
<strong>and</strong> 9.1%, respectively, between 1999 <strong>and</strong> 2005. As a result of this, the proportion of l<strong>and</strong> transport<br />
workers in the total transport work<strong>for</strong>ce fell from 48.5% in 1999 to 40.3% in 2005, while the share of<br />
EU-OSHA – <strong>European</strong> <strong>Agency</strong> <strong>for</strong> <strong>Safety</strong> <strong>and</strong> <strong>Health</strong> <strong>at</strong> <strong>Work</strong> 8<br />
11.7<br />
12.0<br />
5.0<br />
4.8<br />
4.6<br />
4.4<br />
4.2<br />
4.0<br />
3.8<br />
3.6<br />
3.4<br />
3.2<br />
3.0