Economic optimization of gas turbine air-cooling systems in ... - circe
Economic optimization of gas turbine air-cooling systems in ... - circe
Economic optimization of gas turbine air-cooling systems in ... - circe

You also want an ePaper? Increase the reach of your titles
YUMPU automatically turns print PDFs into web optimized ePapers that Google loves.
ECONOMIC OPTIMISATION OF GAS TURBINE INLET<br />
AIR – COOLING SYSTEMS IN COMBINED CYCLE APPLICATIONS<br />
Raquel Gareta, CIRCE<br />
Luis M. Romeo, CIRCE<br />
Antonia Gil, CIRCE<br />
CIRCE (Center for Power Plant Efficiency Research). University <strong>of</strong> Zaragoza.<br />
Centro Politécnico Superior, Maria de Luna, 3, 50015 Zaragoza (Spa<strong>in</strong>)<br />
ABSTRACT<br />
It is well-known the strong dependence <strong>of</strong><br />
climate conditions on <strong>gas</strong> <strong>turb<strong>in</strong>e</strong> (GT)<br />
behaviour. A proper solution to m<strong>in</strong>imise this<br />
negative effect is to reduce GT <strong>in</strong>let <strong>air</strong><br />
temperature by means <strong>of</strong> an <strong>air</strong> <strong>cool<strong>in</strong>g</strong><br />
system. The criteria to select the most suitable<br />
alternative among <strong>cool<strong>in</strong>g</strong> technologies and<br />
<strong>cool<strong>in</strong>g</strong> siz<strong>in</strong>g are complex.<br />
On one hand, bigger <strong>cool<strong>in</strong>g</strong> siz<strong>in</strong>g means an<br />
<strong>in</strong>crease <strong>in</strong> GT power output and, as a<br />
consequence, an improvement <strong>in</strong> money<br />
<strong>in</strong>comes. This option is generally adopted by<br />
manufacturers. Nevertheless, it should be<br />
considered carefully, because the size <strong>of</strong> the<br />
<strong>cool<strong>in</strong>g</strong> equipment <strong>in</strong>creases substantially<br />
without an important power augmentation <strong>in</strong><br />
certa<strong>in</strong> situations.<br />
On the other hand, another criteria could be<br />
selected <strong>in</strong> order to maximise comb<strong>in</strong>ed cycle<br />
efficiency or <strong>cool<strong>in</strong>g</strong> system pr<strong>of</strong>itability. The<br />
former leads to an optimum behaviour <strong>of</strong> the<br />
global system, m<strong>in</strong>imis<strong>in</strong>g the emissions per<br />
kilowatt and the cost <strong>of</strong> electricity. Due to the<br />
fact that money <strong>in</strong>comes directly depends on<br />
the cost <strong>of</strong> electricity and the power<br />
augmentation, the latter comb<strong>in</strong>es the<br />
advantage <strong>of</strong> tak<strong>in</strong>g <strong>in</strong>to account the power<br />
augmentation and the global system<br />
efficiency.<br />
This paper shows a comparison between all <strong>of</strong><br />
these criteria, optimis<strong>in</strong>g the size <strong>of</strong> a <strong>cool<strong>in</strong>g</strong><br />
system for a comb<strong>in</strong>ed cycle application <strong>in</strong><br />
order to achieve: (i) maximum power<br />
augmentation, (ii) maximum comb<strong>in</strong>ed cycle<br />
efficiency or (iii) maximum <strong>cool<strong>in</strong>g</strong> system<br />
pr<strong>of</strong>itability, and analys<strong>in</strong>g the key po<strong>in</strong>ts <strong>in</strong><br />
order to properly size the <strong>cool<strong>in</strong>g</strong> equipment.<br />
INTRODUCTION<br />
Comb<strong>in</strong>ed cycles (CC) based on <strong>gas</strong> <strong>turb<strong>in</strong>e</strong>s<br />
are a competitive alternative to produce<br />
electricity power. CC are high efficiency cycles<br />
with low production costs and emissions<br />
which are essential issues <strong>in</strong> the current<br />
economic and environmental framework.<br />
Despite their high efficiency, GT and also CC<br />
performance strongly depends on ambient <strong>air</strong><br />
temperature. Different <strong>air</strong> <strong>cool<strong>in</strong>g</strong> <strong>systems</strong><br />
have been developed to reduce this <strong>in</strong>fluence<br />
and to improve GT performance. A wide range<br />
<strong>of</strong> <strong>cool<strong>in</strong>g</strong> technologies can be selected.<br />
Evaporative coolers, mechanical and<br />
absorption chillers are potentially among the<br />
best <strong>cool<strong>in</strong>g</strong> technologies to <strong>in</strong>stall.<br />
Three different criteria can be adopted to<br />
select the most suitable siz<strong>in</strong>g and <strong>cool<strong>in</strong>g</strong><br />
technologies. Cool<strong>in</strong>g equipment manufacturers<br />
generally choose the system which<br />
maximise GT power output (or CC power<br />
output) <strong>in</strong> order to show the maximum benefits<br />
<strong>of</strong> an <strong>air</strong> <strong>cool<strong>in</strong>g</strong> system. In these cases, to
obta<strong>in</strong> the GT power output augmentation due<br />
to <strong>cool<strong>in</strong>g</strong>, m<strong>in</strong>imum <strong>cool<strong>in</strong>g</strong> temperature and<br />
maximum ambient temperature are selected.<br />
However, the latter is scarcely representative<br />
<strong>of</strong> climate conditions, hence <strong>cool<strong>in</strong>g</strong><br />
equipment is generally overestimated. The<br />
result <strong>of</strong> this criterion is to maximise the power<br />
output regardless the ambient temperature.<br />
In order to solve this limitation, a second<br />
criterion can be selected. Tak<strong>in</strong>g the<br />
environment <strong>in</strong>to account, the most suitable<br />
criteria is to achieve CC maximum efficiency.<br />
Given that the po<strong>in</strong>t <strong>of</strong> maximum efficiency is<br />
generally near the design temperature (10 –<br />
15ºC), the <strong>cool<strong>in</strong>g</strong> equipment selected are <strong>of</strong><br />
lower size as compared to the previous<br />
criteria. Although, CC power augmentation is<br />
also reduced, efficiency is maximised and<br />
generation cost are m<strong>in</strong>imised.<br />
F<strong>in</strong>ally, a third criterion could be adopted to<br />
maximise the <strong>cool<strong>in</strong>g</strong> system pr<strong>of</strong>itability. This<br />
criterion <strong>in</strong>cludes the effect <strong>of</strong> the <strong>cool<strong>in</strong>g</strong><br />
system <strong>in</strong> efficiency or <strong>in</strong> power augmentation<br />
and <strong>in</strong>tegrates all these variables with <strong>gas</strong> and<br />
electricity markets. The size <strong>of</strong> the <strong>cool<strong>in</strong>g</strong><br />
equipment is usually between those result<strong>in</strong>g<br />
from the first and the second criteria, although<br />
<strong>in</strong> certa<strong>in</strong> economic scenarios the same<br />
results are obta<strong>in</strong>ed.<br />
In the last case, the <strong>cool<strong>in</strong>g</strong> system not only<br />
depends on climate conditions or GT/CC type,<br />
but also on its coefficient <strong>of</strong> operation (COP),<br />
fuel and electricity prices and comb<strong>in</strong>ed cycle<br />
arrangement. These complex variables add<br />
new difficulties <strong>in</strong> the technical and<br />
economical assessment <strong>of</strong> <strong>cool<strong>in</strong>g</strong> <strong>systems</strong>.<br />
Some examples [1]-[4], [7], [8] and<br />
methodologies [8] have been developed <strong>in</strong><br />
order to evaluate these <strong>in</strong>fluences <strong>in</strong> a<br />
complex system as cogeneration or CC<br />
applications.<br />
The aim <strong>of</strong> this paper is to compare above<br />
criteria <strong>in</strong> order to size a mechanical chiller<br />
<strong>cool<strong>in</strong>g</strong> system <strong>in</strong> a CC application. The size<br />
<strong>of</strong> a <strong>cool<strong>in</strong>g</strong> system has been optimised to<br />
obta<strong>in</strong>: (i) maximum power augmentation, (ii)<br />
maximum comb<strong>in</strong>ed cycle efficiency or (iii)<br />
maximum <strong>cool<strong>in</strong>g</strong> system pr<strong>of</strong>itability. The key<br />
po<strong>in</strong>ts to size properly the <strong>cool<strong>in</strong>g</strong> equipment<br />
have been analysed.<br />
In a particular CC, an economical optimisation<br />
(based on <strong>cool<strong>in</strong>g</strong> system pr<strong>of</strong>itability) is<br />
achieved <strong>in</strong> different scenarios <strong>in</strong>fluenced by<br />
electricity and fuel prices.<br />
COMBINED CYCLE SIMULATION.<br />
To calculate power output improvements<br />
caused by the <strong>air</strong> <strong>cool<strong>in</strong>g</strong> and to quantify the<br />
CC efficiency and <strong>cool<strong>in</strong>g</strong> system pr<strong>of</strong>itability,<br />
a simulation <strong>of</strong> a CC has been carried out.<br />
Simulation <strong>in</strong>puts are: ambient conditions<br />
(relative humidity and temperature), <strong>cool<strong>in</strong>g</strong><br />
system COP, <strong>gas</strong> and electricity prices.<br />
Variables obta<strong>in</strong>ed as results are: CC<br />
efficiency and power output (<strong>gas</strong> and steam<br />
<strong>turb<strong>in</strong>e</strong>s), <strong>air</strong> conditions at GT <strong>in</strong>let, cost <strong>of</strong><br />
electricity, <strong>cool<strong>in</strong>g</strong> pr<strong>of</strong>itability (hourly <strong>in</strong>comes<br />
<strong>in</strong>clud<strong>in</strong>g system amortisation) and properties<br />
<strong>of</strong> different CC po<strong>in</strong>ts.<br />
Three CC optimisations have been carried<br />
out: (i) CC power augmentation, (ii) CC global<br />
efficiency and (iii) CC hourly <strong>in</strong>comes (<strong>cool<strong>in</strong>g</strong><br />
pr<strong>of</strong>itability), with the temperature <strong>of</strong> GT <strong>in</strong>let<br />
(size <strong>of</strong> the <strong>cool<strong>in</strong>g</strong> system) as the<br />
<strong>in</strong>dependent variable.<br />
A three-level steam pressure comb<strong>in</strong>ed cycle<br />
has been chosen for the analysis. It is based<br />
on three 52.8 MW <strong>in</strong>dustrial GT and a 67.4<br />
MW steam <strong>turb<strong>in</strong>e</strong> [9]-[10]. Both <strong>gas</strong> and<br />
steam cycles have been simulated <strong>in</strong> order to<br />
study the <strong>in</strong>fluence <strong>of</strong> climatic data and GT<br />
<strong>in</strong>let <strong>air</strong>-<strong>cool<strong>in</strong>g</strong> <strong>in</strong>stallation.<br />
GT corrections for power output, heat rate,<br />
mass flow rate and exhaust <strong>gas</strong>es<br />
temperature at different ambient tem-<br />
peratures, as well as <strong>in</strong>let and outlet pressure<br />
drop parameters have been calculated by<br />
means <strong>of</strong> performance curves. The variation<br />
<strong>of</strong> exhaust <strong>gas</strong>es properties has been<br />
considered, due to its relevant <strong>in</strong>fluence on<br />
the temperature pr<strong>of</strong>ile <strong>of</strong> the Heat Recovery<br />
Steam Generator (HRSG). Additional GT <strong>in</strong>let<br />
and outlet pressure drops have been taken<br />
<strong>in</strong>to account because <strong>of</strong> the <strong>in</strong>fluence <strong>of</strong><br />
<strong>cool<strong>in</strong>g</strong> coils and HRSG. Ambient conditions<br />
are <strong>in</strong>put variables for this model. Output
variables are GT efficiency and power output<br />
and exhaust <strong>gas</strong>es properties. The HRSG and<br />
the steam <strong>turb<strong>in</strong>e</strong> have been simulated with<br />
usual equations and strategies [7].<br />
Although there are different <strong>cool<strong>in</strong>g</strong><br />
techniques <strong>in</strong> order to improve the GT and CC<br />
performance, only mechanical chillers have<br />
been considered for the optimisation. A<br />
mechanical chiller refrigerates the <strong>air</strong> stream<br />
by means <strong>of</strong> a cold refrigerant circuit. This<br />
refrigerant is cooled with a mechanical<br />
compressor system. In the simulation, the<br />
refrigerant cycle is not relevant, s<strong>in</strong>ce<br />
electricity consumption <strong>in</strong> electrically driven<br />
chillers ma<strong>in</strong>ly depends on the coefficient <strong>of</strong><br />
performance (COP), and variations <strong>in</strong> this<br />
parameter at different operation loads have<br />
not been considered. The COP is a function <strong>of</strong><br />
the refrigerant type and technology selected<br />
([1]-[4]). The model pays special attention to<br />
analyse changes <strong>in</strong> <strong>air</strong>-water mixture<br />
properties. Cool<strong>in</strong>g <strong>of</strong> the humid <strong>air</strong> causes<br />
saturation at the dew temperature, fixed by<br />
the <strong>in</strong>itial humid <strong>air</strong> properties. If the f<strong>in</strong>al <strong>air</strong><br />
temperature is below the dew temperature,<br />
water content <strong>in</strong> the mixture condenses. This<br />
process has an important chill<strong>in</strong>g energy cost,<br />
s<strong>in</strong>ce the energy to produce the phasechange<br />
is necessary to be transferred. In<br />
consequence, these <strong>systems</strong> allow the<br />
temperature to be reduced at the desired<br />
level, but subject to high <strong>cool<strong>in</strong>g</strong> power<br />
consumption. It is assumed that this <strong>cool<strong>in</strong>g</strong><br />
system causes a pressure drop <strong>of</strong> 0.3kPa at<br />
GT <strong>in</strong>let duct. The m<strong>in</strong>imum <strong>air</strong> temperature<br />
achieved is around 5ºC, because lower <strong>air</strong><br />
temperatures may damage the compressor<br />
blades.<br />
RESULTS OF THE OPTIMISATION<br />
As it is aforementioned, it is possible to select<br />
three different criteria to select or to operate<br />
the <strong>in</strong>let <strong>air</strong>-<strong>cool<strong>in</strong>g</strong> <strong>systems</strong> <strong>in</strong>tegrated <strong>in</strong> a<br />
comb<strong>in</strong>ed cycle. The first criterion is to design<br />
the <strong>cool<strong>in</strong>g</strong> system <strong>in</strong> order to obta<strong>in</strong> the<br />
highest power output improvement. To reach<br />
this operation po<strong>in</strong>t, the m<strong>in</strong>imum <strong>in</strong>let<br />
temperature must be reached. This m<strong>in</strong>imum<br />
temperature is fixed by technological issues to<br />
5ºC.<br />
Results obta<strong>in</strong>ed with the first assumption are<br />
shown <strong>in</strong> Table 1. The power output <strong>in</strong>crease<br />
is high, but the energy cost <strong>of</strong> this<br />
improvement is also high, due to the efficiency<br />
loss. High temperatures and high relative<br />
humidity implies the use <strong>of</strong> powerful chillers.<br />
The efficiency loss is caused by the high<br />
electricity consumption <strong>of</strong> the chillers. The<br />
high <strong>in</strong>vestment <strong>of</strong> a 38 000 kW <strong>cool<strong>in</strong>g</strong> power<br />
system probably makes unfeasible its<br />
<strong>in</strong>stallation. The cost <strong>of</strong> the electricity<br />
production and hourly <strong>in</strong>comes are blank<br />
because the power output maximisation is<br />
<strong>in</strong>dependent <strong>of</strong> the energy market framework,<br />
and it is not possible to evaluate this cost<br />
without an energy market framework.<br />
Amb. Temp. Rel. Hum. Inlet Temp. M. C. P. a ∆Power Efficiency Prod. Cost Incomes<br />
(ºC) (%) (ºC) (kW) (kW) (%) (cent/kW) (€/hour)<br />
5,0 60 5,0 0 0 44,69 - -<br />
15,0 60 5,0 6 917 10 294 44,24 - -<br />
25,0 60 5,0 19 957 19 596 43,14 - -<br />
35,0 60 5,0 38 005 29 392 41,69 - -<br />
15,0 40 5,0 5 620 10 618 44,30 - -<br />
15,0 60 5,0 6 917 10 294 44,24 - -<br />
15,0 80 5,0 25 232 9 575 44,10 - -<br />
Table 1. Cool<strong>in</strong>g results when the performance criteria is maximise the power improvement<br />
( a M. C. P. means Mechanical Chiller Power)
Amb. Temp. Rel. Hum. Inlet Temp. M. C. P. ∆ Power Efficiency Prod. Cost Incomes<br />
(ºC) (%) (ºC) (kW) (kW) (%) (cent/kW) (€/hour)<br />
5,0 60 5,0 0 0 44,69 - -<br />
15,0 60 11,7 1 813 3 550 44,35 - -<br />
25,0 60 16,7 4 550 9 341 43,55 - -<br />
35,0 60 26,1 4 808 10 520 42,13 - -<br />
15,0 40 11,7 1 822 3 583 44,35 - -<br />
15,0 60 11,7 1 813 3 550 44,35 - -<br />
15,0 80 11,8 1 766 3 446 44,35 - -<br />
Table 2. Cool<strong>in</strong>g results when the performance criteria is to maximise efficiency<br />
The second possibility is optimis<strong>in</strong>g CC<br />
efficiency. With this option, the power output<br />
improvement is reduced <strong>in</strong> order to reach the<br />
po<strong>in</strong>t <strong>of</strong> lowest fuel consumption per kilowatt.<br />
This efficiency is calculated consider<strong>in</strong>g the<br />
chiller consumption. As shown <strong>in</strong> Table 1,<br />
s<strong>in</strong>ce high power improvement is obta<strong>in</strong>ed,<br />
efficiency loss appears as a result <strong>of</strong> the high<br />
chiller consumption. Consequently, with this<br />
criterion the optimum <strong>in</strong>let <strong>air</strong>-<strong>cool<strong>in</strong>g</strong> system<br />
is obta<strong>in</strong>ed by reduc<strong>in</strong>g slightly <strong>in</strong>let <strong>air</strong><br />
temperature without modify the efficiency <strong>of</strong><br />
the global system (work<strong>in</strong>g both comb<strong>in</strong>ed<br />
cycle and chiller).<br />
The results <strong>of</strong> the second criteria are<br />
presented <strong>in</strong> Table 2. The most remarkable<br />
aspect is the reduction <strong>of</strong> the chiller size. As a<br />
result <strong>of</strong> that, the power improvement is also<br />
extremely reduced. That means that a<br />
reduced cost <strong>of</strong> the chill<strong>in</strong>g equipment allows<br />
the efficiency to be optimised but prevents the<br />
power from the highest improvements.<br />
The last criterion is to optimise the hourly<br />
<strong>in</strong>comes. In this study, the hourly <strong>in</strong>comes are<br />
considered <strong>in</strong> a simplified way, as the<br />
difference between the electricity sale and the<br />
fuel payment. Obviously, to select an<br />
economic parameter for the optimisation<br />
<strong>in</strong>volves the knowledge <strong>of</strong> the market<br />
framework.<br />
In consequence, three energy market<br />
situations are considered: (i) a favourable<br />
energy market, where electricity price is<br />
clearly higher than the electricity production<br />
cost; (ii) a non-favourable energy market,<br />
where the electricity production cost is clearly<br />
higher than the electricity price; and f<strong>in</strong>ally, (iii)<br />
an <strong>in</strong>termediate situation, where the electricity<br />
production cost is slightly lower than the<br />
electricity price.<br />
Amb. Temp. Rel. Hum. Inlet Temp. M. C. P. ∆ Power Efficiency Prod. Cost Incomes<br />
(ºC) (%) (ºC) (kW) (kW) (%) (cent/kW) (€/hour)<br />
5,0 60 5,0 0 0 44,69 2,90 4 568,56<br />
15,0 60 5,0 6 916 10 293 44,24 2,93 4 451,45<br />
25,0 60 5,0 19 957 19 596 43,14 3,00 4 167,83<br />
35,0 60 5,0 38 005 29 392 41,69 3,11 3 785,01<br />
15,0 40 5,0 5 620 10 617 44,30 2,92 4 467,16<br />
15,0 60 5,0 6 916 10 293 44,24 2,93 4 451,45<br />
15,0 80 5,0 9 789 9 575 44,10 2,93 4 416,54<br />
Table 3. Cool<strong>in</strong>g results when the performance criteria is to optimise hourly <strong>in</strong>comes <strong>in</strong> a favourable<br />
energy market framework<br />
(Electricity price: 4,81 cent €/kW; natural <strong>gas</strong> price: 1,50 cent €/therm)
Amb. Temp. Rel. Hum. Inlet Temp. M. C. P. ∆ Power Efficiency Prod. Cost Incomes<br />
(ºC) (%) (ºC) (kW) (kW) (%) (cent/kW) (€/hour)<br />
5,0 60 5,0 - - 44,69 2,90 -1 174,26<br />
15,0 60 15,0 - - 44,34 2,92 -1 163,41<br />
25,0 60 25,0 - - 43,36 2,99 -1 224,05<br />
35,0 60 35,0 - - 41,79 3,10 -1 340,31<br />
15,0 40 15,0 - - 44,34 2,92 -1 163,41<br />
15,0 60 15,0 - - 44,34 2,92 -1 163,41<br />
15,0 80 15,0 - - 44,34 2,92 -1 163,41<br />
Table 4. Cool<strong>in</strong>g results when the performance criteria is optimis<strong>in</strong>g the hourly <strong>in</strong>comes <strong>in</strong> a nonfavourable<br />
energy market framework<br />
(Electricity price: 2,40 cent/kW; natural <strong>gas</strong> price: 1,50 cent/therm)<br />
Amb. Temp. Rel. Hum. Inlet Temp. M. C. P. ∆ Power Efficiency Prod. Cost Incomes<br />
(ºC) (%) (ºC) (kW) (kW) (%) (cent/kW) (€/hour)<br />
5,0 60 5,0 0 0 44,69 2,90 1 697,15<br />
15,0 60 6,8 4 885 8 665 44,31 2,92 1 609,58<br />
25,0 60 11,2 12 351 14 127 43,36 2,99 1 398,82<br />
35,0 60 20,0 16 301 16 642 42,11 3,07 1 125,28<br />
15,0 40 5,0 5 620 10 618 44,30 2,92 1 621,04<br />
15,0 60 6,8 4 885 8 665 44,31 2,92 1 609,58<br />
15,0 80 7,5 6 931 7 330 44,20 2,93 1 583,62<br />
Table 5. Cool<strong>in</strong>g results when the performance criteria is optimis<strong>in</strong>g the hourly <strong>in</strong>comes <strong>in</strong> an<br />
<strong>in</strong>termediate energy market framework<br />
(Electricity price: 6,61 cent/kW; natural <strong>gas</strong> price: 1,50 cent/therm)<br />
The results <strong>of</strong> the third criterion are shown <strong>in</strong><br />
Table 3. As the sold electricity implies an<br />
important benefit, the ma<strong>in</strong> result obta<strong>in</strong>ed<br />
from optimisation is to reduce the <strong>in</strong>let<br />
temperature as possible <strong>in</strong> order to maximise<br />
the power improvement (first criterion).<br />
Therefore, despite the <strong>in</strong>itial <strong>in</strong>vestment or the<br />
operation costs, <strong>in</strong> a good energy market the<br />
<strong>in</strong>stallation <strong>of</strong> a big chiller is justified.<br />
The results <strong>in</strong> a non-favourable energy market<br />
framework are presented <strong>in</strong> Table 4. When<br />
costs are higher than benefits, the advice is to<br />
produce only the obligatory electricity quantity<br />
(set by technological or strategic purposes).<br />
From the optimisation results, it is<br />
recommended not to cool the <strong>in</strong>let <strong>air</strong> s<strong>in</strong>ce<br />
any improvement is penalised.<br />
The situation could be less clear as <strong>in</strong> the<br />
former assumptions, as shown <strong>in</strong> Table 5. In<br />
this case, the optimisation results are<br />
<strong>in</strong>termediate between power improvement and<br />
efficiency maximisation. The chiller sizes are<br />
also <strong>in</strong>termediate. It is remarkable that high<br />
temperatures and relative humidity <strong>in</strong>volve a<br />
result near to an efficiency optimisation, while<br />
an <strong>in</strong>termediate ambient temperature allows<br />
the power output to be maximised.<br />
F<strong>in</strong>ally, Tables 6 and 7 show the <strong>in</strong>fluence <strong>of</strong><br />
the above operation criteria <strong>in</strong> the comb<strong>in</strong>ed<br />
cycle and chiller system. As expected, the<br />
third criteria allows average results to be<br />
obta<strong>in</strong>ed<br />
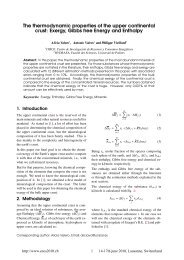
In Figure 1, data obta<strong>in</strong>ed for the different<br />
operation criteria are presented. S<strong>in</strong>ce an<br />
<strong>in</strong>termediate market situation has been<br />
assumed, the results for the <strong>in</strong>comes<br />
optimisation are located between the other<br />
two cases, namely, near to the maximum<br />
power at low temperatures and close to the<br />
maximum efficiency at high temperatures.
Amb. Temp. Rel. Hum. Inlet Temp. M. C. P. ∆ Power Efficiency Prod. Cost Incomes<br />
(ºC) (%) (ºC) (kW) (kW) (%) (cent/kW) (€/hour)<br />
A 15,0 60 5,0 6 917 10 294 44,24 2,93 1 609,22<br />
B 15,0 60 11,7 1 813 3 550 44,35 2,91 1 581,31<br />
C 15,0 60 6,8 4 885 8 665 44,31 2,92 1 609,58<br />
Table 6. Comparison <strong>of</strong> the all criteria results given a climate situation (temperature: 15ºC and<br />
relative humidity: 60%)<br />
(A: highest power improvement; B: best efficiency; C: highest hourly <strong>in</strong>come)<br />
Amb. Temp. Rel. Hum. Inlet Temp. M. C. P. ∆ Power Efficiency Prod. Cost Incomes<br />
(ºC) (%) (ºC) (kW) (Kw) (%) (cent/kW) (€/hour)<br />
A 25,0 60 5,0 19 957 19 596 43,14 3,00 1 395,79<br />
B 25,0 60 16,7 4 550 9 341 43,55 2,97 1 397,86<br />
C 25,0 60 11,2 12 351 14 127 43,36 2,99 1 398,82<br />
Table 7. Comparison <strong>of</strong> the three criteria result <strong>in</strong> a giv<strong>in</strong>g climate situation (temperature: 25ºC and<br />
relative humidity: 60%)<br />
(A: highest power improvement; B: best efficiency; C: highest hourly <strong>in</strong>come)<br />
Inlet temperature (ºC)<br />
Power output (kW))<br />
30<br />
25<br />
20<br />
15<br />
10<br />
5<br />
0<br />
0 10 20 30 40<br />
245000<br />
240000<br />
235000<br />
230000<br />
225000<br />
220000<br />
215000<br />
210000<br />
205000<br />
Ambient temperature (ºC)<br />
Max. efficiency Max. Pow er output Max. Incomes<br />
(a) Inlet temperatures<br />
200000<br />
0 10 20 30 40<br />
Ambient temperature (ºC)<br />
Max. efficiency Max. Pow er output Max. Incomes<br />
(b) Power output <strong>in</strong>crease<br />
Incomes (€/hour)<br />
1700<br />
1600<br />
1500<br />
1400<br />
1300<br />
1200<br />
1100<br />
0 10 20 30 40<br />
Ambient temperature (ºC)<br />
Max. efficiency Max. Pow er output Max. Incomes<br />
(c) Incomes<br />
Figure 1. Results <strong>of</strong> the three criteria (maximum<br />
efficiency, maximum power output and<br />
maximum hourly <strong>in</strong>comes) for different<br />
temperatures and 60% Relative Humidity<br />
(Electricity price: 6,61 cent/kW; natural <strong>gas</strong><br />
price: 1,50 cent/therm)<br />
CONCLUSIONS<br />
The selection and siz<strong>in</strong>g <strong>of</strong> a <strong>cool<strong>in</strong>g</strong> system<br />
to be <strong>in</strong>tegrated <strong>in</strong> a CC or other power<br />
production system based <strong>in</strong> GT is a critical<br />
aspect. Due to this, it must not be considered<br />
as a secondary question. The criterion to set<br />
both <strong>of</strong> the previous characteristics must be<br />
seriously balanced.
In this paper, three optimis<strong>in</strong>g criteria have<br />
been compared: (a) The power output<br />
improvement; (b) The efficiency <strong>of</strong> the global<br />
system; (c) The economical results depend<strong>in</strong>g<br />
on the electricity and the fuel prices.<br />
The (a) and (b) criteria lead to extreme<br />
results. The former implies the use <strong>of</strong><br />
extremely big <strong>cool<strong>in</strong>g</strong> <strong>systems</strong>, if the<br />
maximum improvement are wanted to be held<br />
<strong>in</strong> adverse climatic situations. The second<br />
reduce the size <strong>of</strong> the <strong>cool<strong>in</strong>g</strong> <strong>systems</strong>, but the<br />
power improvements are slight, and the<br />
problem is only partially mitigated. However,<br />
this operation or siz<strong>in</strong>g criterion is<br />
environmentally friendly, because the fuel<br />
consumption per electricity kilowatt is<br />
reduced.<br />
The third criterion is proposed <strong>in</strong> order to<br />
<strong>in</strong>clude economical aspects <strong>in</strong> the electricity<br />
generators operation. This option allows better<br />
and more sensible results to be obta<strong>in</strong>ed. That<br />
means medium <strong>cool<strong>in</strong>g</strong> system size, efficiency<br />
near to optimum efficiency and the highest<br />
hourly <strong>in</strong>comes. Obviously, the results are<br />
adapted to the market situation, allow<strong>in</strong>g the<br />
best <strong>in</strong>vestment pay back to be reached.<br />
Therefore, an economic optimisation criteria is<br />
adviced.<br />
REFERENCES<br />
[1]. M. De Lucia, R. Bronconi, E. Carnevale.<br />
Performance and economic enhancement <strong>of</strong><br />
cogeneration <strong>gas</strong> <strong>turb<strong>in</strong>e</strong>s through<br />
compressor <strong>in</strong>let <strong>air</strong> <strong>cool<strong>in</strong>g</strong>. Journal <strong>of</strong><br />
Eng<strong>in</strong>eer<strong>in</strong>g for Gas Turb<strong>in</strong>es and Power,<br />
Transactions <strong>of</strong> the ASME v116, n2 Apr 1994:<br />
360-365c, 1994.<br />
[2]. M. De Lucia, E. Carnevale, M. Falchetti, A.<br />
Tesei. Performance improvements <strong>of</strong> a natural<br />
<strong>gas</strong> <strong>in</strong>jection station us<strong>in</strong>g <strong>gas</strong> <strong>turb<strong>in</strong>e</strong> <strong>in</strong>let <strong>air</strong><br />
<strong>cool<strong>in</strong>g</strong>. Proceed<strong>in</strong>gs <strong>of</strong> the 1997 International<br />
Gas Turb<strong>in</strong>e & Aeroeng<strong>in</strong>e Congress &<br />
Exposition. ASME Paper 97-GT-508: 1-6,<br />
1997.<br />
[3]. S. Jolly, D. Sheperd, J. Nitzken, D.<br />
Sheperd. Inlet Air Cool<strong>in</strong>g for a Frame based<br />
Comb<strong>in</strong>ed Cycle Power Plant, Power–Gen<br />
International, December, pp. 1-12. , 1997.<br />
[4]. M. De Lucia, C. Lanfranchi, V. Boggio.<br />
Benefits <strong>of</strong> compressor <strong>in</strong>let <strong>air</strong> <strong>cool<strong>in</strong>g</strong> for <strong>gas</strong><br />
<strong>turb<strong>in</strong>e</strong> cogeneration plants. Proceed<strong>in</strong>gs <strong>of</strong><br />
International Gas Turb<strong>in</strong>e and Aeroeng<strong>in</strong>e<br />
Congress and Exposition, ASME Paper 95-<br />
GT-311: 1-7, 1995.<br />
[5]. R. Bettocchi, P.R. Sp<strong>in</strong>a, F. Maberti. Gas<br />
<strong>turb<strong>in</strong>e</strong> <strong>in</strong>let <strong>air</strong> <strong>cool<strong>in</strong>g</strong> us<strong>in</strong>g non-adiabatic<br />
saturation process, Proceed<strong>in</strong>gs <strong>of</strong> the 1995<br />
ASME Cogen-Turbo Power Conference.<br />
ASME Paper 95-CTP-49: 1-10, 1995.<br />
[6]. C. White, S. Raghu, G. Giannotti, H.<br />
Giannotti. Power boost <strong>of</strong> <strong>gas</strong> <strong>turb<strong>in</strong>e</strong>s by <strong>in</strong>let<br />
<strong>air</strong> <strong>cool<strong>in</strong>g</strong>, 31st. Proceed<strong>in</strong>gs <strong>of</strong> the<br />
Intersociety Energy Conversion Eng<strong>in</strong>eer<strong>in</strong>g<br />
Conference, v. 2. IEEE, Piscataway, NJ,<br />
USA,: 725-729, 1996.<br />
[7]. R. Gareta, L. M. Romeo, A. Gil. The effect<br />
<strong>of</strong> <strong>air</strong> <strong>cool<strong>in</strong>g</strong> <strong>systems</strong> <strong>in</strong> comb<strong>in</strong>ed cycle<br />
performance. Presented at Power Gen 2001,<br />
Brussels.<br />
[8]. R. Gareta, L. M. Romeo, A. Gil.<br />
Methodology for the economic evaluation <strong>of</strong><br />
<strong>gas</strong> <strong>turb<strong>in</strong>e</strong> <strong>air</strong>-<strong>cool<strong>in</strong>g</strong> <strong>systems</strong> <strong>in</strong> comb<strong>in</strong>ed<br />
cycle applications, submitted to Energy.<br />
[9]. ABB technical paper. The ABB Gas<br />
Turb<strong>in</strong>e range overview.<br />
[10]. ABB technical paper. The GT8C <strong>gas</strong><br />
<strong>turb<strong>in</strong>e</strong>.