the american freshman: national norms fall 2011 - Higher Education ...
the american freshman: national norms fall 2011 - Higher Education ...
the american freshman: national norms fall 2011 - Higher Education ...

Create successful ePaper yourself
Turn your PDF publications into a flip-book with our unique Google optimized e-Paper software.
most important reason to attend college (88.3%<br />
vs. 91.7%, respectively). Wanting to learn about<br />
things that interest <strong>the</strong>m is <strong>the</strong> top priority for<br />
students intending to major in <strong>the</strong> social sciences<br />
(84.9%) or in humanities (89.6%), although for<br />
future social science majors, this reason is also<br />
close to wanting a better job (83.0%).<br />
Business majors are <strong>the</strong> most likely to attend<br />
college with an eye towards making more<br />
money, as 84.0% report that this is “very important,”<br />
much more than <strong>the</strong> 72.3% of STEM<br />
majors, <strong>the</strong> 65.4% of social science majors, and<br />
<strong>the</strong> 55.6% of humanities majors.<br />
The most striking differences in reasons to<br />
attend college are between probable business and<br />
humanities majors. Whereas wanting a better<br />
job was first for business majors, it ranks fourth<br />
among those planning to major in humanities,<br />
with just 73.3% indicating “very important.”<br />
Gaining a general education and appreciation<br />
for ideas is second for humanities majors<br />
(74.7%), but in fifth place for business majors<br />
(69.9%). And, while<br />
being able to make more<br />
money is second in<br />
importance for business<br />
majors, it is second to last<br />
100<br />
in importance as a reason<br />
90<br />
to attend college for those<br />
80<br />
planning to major in <strong>the</strong><br />
70<br />
humanities. These differ-<br />
60<br />
ences in importance for<br />
50<br />
attending college clearly<br />
40<br />
show that <strong>the</strong>se two<br />
30<br />
groups of entering<br />
20<br />
students want and appre-<br />
10<br />
ciate different aspects of<br />
0<br />
<strong>the</strong> experience and<br />
outcomes of college.<br />
% of Students<br />
78.4<br />
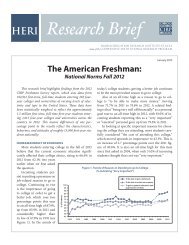
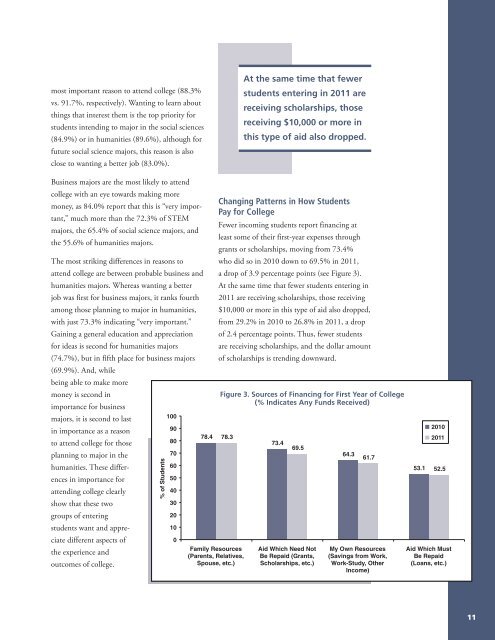
Changing Patterns in How Students<br />
Pay for College<br />
Fewer incoming students report financing at<br />
least some of <strong>the</strong>ir first-year expenses through<br />
grants or scholarships, moving from 73.4%<br />
who did so in 2010 down to 69.5% in <strong>2011</strong>,<br />
a drop of 3.9 percentage points (see Figure 3).<br />
At <strong>the</strong> same time that fewer students entering in<br />
<strong>2011</strong> are receiving scholarships, those receiving<br />
$10,000 or more in this type of aid also dropped,<br />
from 29.2% in 2010 to 26.8% in <strong>2011</strong>, a drop<br />
of 2.4 percentage points. Thus, fewer students<br />
are receiving scholarships, and <strong>the</strong> dollar amount<br />
of scholarships is trending downward.<br />
78.3<br />
Family Resources<br />
(Parents, Relatives,<br />
Spouse, etc.)<br />
At <strong>the</strong> same time that fewer<br />
students entering in <strong>2011</strong> are<br />
receiving scholarships, those<br />
receiving $10,000 or more in<br />
this type of aid also dropped.<br />
Figure 3. Sources of Financing for First Year of College<br />
(% Indicates Any Funds Received)<br />
73.4<br />
69.5<br />
Aid Which Need Not<br />
Be Repaid (Grants,<br />
Scholarships, etc.)<br />
64.3<br />
61.7<br />
My Own Resources<br />
(Savings from Work,<br />
Work-Study, O<strong>the</strong>r<br />
Income)<br />
53.1<br />
2010<br />
<strong>2011</strong><br />
52.5<br />
Aid Which Must<br />
Be Repaid<br />
(Loans, etc.)<br />
11