Legislative Reference Bureau
Legislative Reference Bureau
Legislative Reference Bureau
Create successful ePaper yourself
Turn your PDF publications into a flip-book with our unique Google optimized e-Paper software.
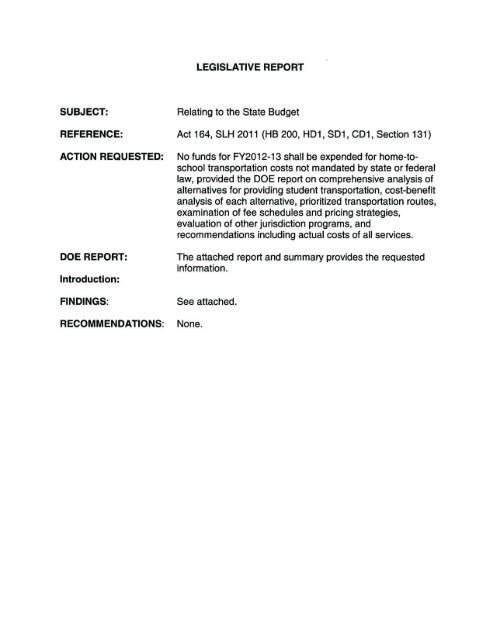
LEGISLATIVE REPORT<br />
SUBJECT: Relating to the State Budget<br />
REFERENCE: Act 164, SLH 2011 (HB 200, HD1, SD1 , CD1, Section 131)<br />
ACTION REQUESTED: No funds for FY2012-13 shall be expended for home-toschool<br />
transportation costs not mandated by state or federal<br />
law, provided the DOE report on comprehensive analysis of<br />
alternatives for providing student transportation, cost-benefit<br />
analysis of each alternative, prioritized transportation routes,<br />
examination of fee schedules and pricing strategies,<br />
evaluation of other jurisdiction programs, and<br />
recommendations including actual costs of all services.<br />
DOE REPORT: The attached report and summary provides the requested<br />
information.<br />
Introduction:<br />
FINDINGS: See attached.<br />
RECOMMENDATIONS: None.
DEPARTMENT OF EDUCATION'S REPORT TO THE 2012 HAWAII STATE LEGISLATURE<br />
Pursuant to Section 131 of Act 164 of the 2011 Regular Session<br />
This report is organized in the order that Items (1) through (7) are listed in Section 131 of Act 16412011. The proviso<br />
language is in bold face. The DOE's report is presented in normal text.<br />
Section 131. Provided that of the general fund appropriation for the department of<br />
education (department), excluding charter schools, no funds for fiscal year 2012-2013<br />
shall be expended for home-to-school transportation costs not mandated by state or<br />
federal law; provided further that the department shall prepare a report that shall include:<br />
(1) A comprehensive analysis of alternatives for providing student transportation,<br />
including but not limited to the elimination of transportation services not mandated<br />
by law, route consolidation and reduction scenarios, methods of reducing contracted<br />
costs, implementation of transportation services with state personnel and/or buses,<br />
partnerships with county agencies, and the use of tripper services.<br />
• Elimination of transportation services not mandated by law - The complete elimination of<br />
school transportation services not mandated by law would effectively end public school<br />
bussing services for general education students except for those affected by the Federal<br />
No Child Left Behind Act (i.e. students who transfer from under-achieving schools) and<br />
the McKinney-Vento Act (i.e. students who are homeless).<br />
• Route consolidations - The department already uses "route consolidations" as a costcutting<br />
tool. The department will continue to seek further route consolidation<br />
opportunities.<br />
• Route reduction scenarios - Other than by route consolidation, reducing the overall<br />
number of bus routes can be accomplished by reducing the overall number of "qualified"<br />
student passengers or by discontinuing service. Reducing the number of qualified<br />
student passengers would require stiffer qualification criteria, but such an action would<br />
place hardships on families who rely on the public school bus service. Discontinuing<br />
service would mean eliminating certain routes in specific geographic locations based on<br />
criteria that would include but not be limited to the availability of public transportation, the<br />
percentage of students qualified for free or reduced price lunch, the compactness of the<br />
student population, and the topography of surrounding roads and sidewalks.<br />
• Methods of reducing contracted costs - Bus contracting costs are driven by the<br />
prevailing market place. Robust competitive bidding among service providers - or the<br />
lack thereof - substantially influences the market place's response to bus contract<br />
solicitations. The department is committed to expanding its pool of potential service<br />
providers by inviting participation from non-school bus operators as well as mainlandbased<br />
companies.<br />
The department continues to explore short-term and long-term alternatives for reducing<br />
contracted costs, such as:<br />
o Allowing contractors to park buses on school campuses,<br />
o Extending the usable life of school bus vehicles,<br />
o Reducing the number of standby vehicles contractors must provide,<br />
o Revising price adjustment provisions (i.e. fuel, wage and CPI cost adjustments),<br />
o Repealing the wage certificate requirement,<br />
1
o Clarifying the department's responsibility to contractors if it exercises its right to<br />
terminate the contracts with 30 days notice,<br />
o Allowing contractors to determine the routes, bus sizes, and number of buses,<br />
o Increasing the number of buses per bid package,<br />
o Increasing the contract term,<br />
o Providing buses to contractors, and<br />
o Providing baseyards to contractors.<br />
These measures can be incorporated into future contracts, but existing contracts require<br />
amendment through negotiation. The wage certificate is statutory; repealing it would<br />
require legislation.<br />
Cost saving measures that do not require amending contract agreements include:<br />
o Staggering school hours in order to maximize usage of hired vehicles.<br />
o Coordinating school waiver days to reduce the overall number of operating days.<br />
o Eliminating free bus service (fare-free ridership) in order to reduce ridership while<br />
increasing bus fare revenue.<br />
o Combining age groups (elementary, middle, high) on the same bus.<br />
o Instituting 4-day school weeks while increasing school hours from 6 hours per<br />
day to 7.5 hours per day. This action would reduce the overall number of service<br />
days by 20% without compromising student instructional hours.<br />
o Increasing the school bus fare in order to increase bus fare revenue and reduce<br />
the demand for bus transportation.<br />
o Increasing the distance from school that students must live to qualify for bus<br />
service.<br />
o Consolidating all school bus operations into a single contract<br />
Implementing some of these measures would require either legislation or amendments<br />
to Chapter 8-27 ("Transportation of Students"), Hawaii Administrative Rules.<br />
• Implementation of transportation services with state personnel and/or buses - Since<br />
2005, the department has operated a limited number of general education buses in<br />
Kailua-Kona utilizing state personnel on state-leased school bus vehicles. The<br />
department has since determined that private contractors can furnish public school<br />
bussing services at no greater expense and with fewer challenges than the department<br />
can with public employees.<br />
• Partnerships with county agencies using tripper services - School trippers are extra<br />
services provided by municipal bus operators to protect against overcrowding on<br />
municipal bus routes serving schools. There are federal regulations (49 CFR Part 605)<br />
directed at protecting the private sector against unfair competition and ensuring that<br />
federal funding for municipal services is focused on providing services that meet the<br />
needs of the "general public". School tripper services may be operated if they meet the<br />
following criteria:<br />
o There is sufficient demand to warrant the operation of a tripper;<br />
o There are sufficient resources to operate a tripper;<br />
o The school tripper will not result in significant increase in travel time for regular<br />
customers; and<br />
2
o The school tripper is operated as part of the regularly scheduled public<br />
transportation service.<br />
The City and County of Honolulu has provided tripper service to certain schools<br />
for many years. The City transportation officials have resisted shifting significant<br />
numbers of students from school bus to City bus service because their resources<br />
are incapable of absorbing the increased ridership.<br />
(2) A cost benefit analysis of each alternative identified (above);<br />
• Elimination of transportation services not mandated by law - This would save $40 million<br />
or more annually, subject however to the costs associated with cancelling existing<br />
contracts. The cost of cancelling existing contracts would need to be negotiated, but<br />
should not exceed $20 million. A determination of the cost to parents and the community<br />
for terminating public school transportation services not mandated by law requires<br />
subjective assumptions that include the net increase in the cost to parents for getting<br />
their children to and from school, the increase in casualties when students shift to other<br />
modes of transportation, the cost of increased absenteeism and school drop outs, and<br />
the increased community carbon footprint.<br />
• Route consolidations - The savings from route consolidations already implemented is<br />
$605,000 in FY 2012. Additional route consolidations would increase cost savings.<br />
• Route reduction scenarios - The savings from reducing bus routes would be dependent<br />
upon the number of routes that are eliminated. The current average price of a general<br />
education school bus is approximately $400 per day. Each reduced bus requires a ''fixed<br />
cost" payment to the contractor of $100 per day through the end of the contract period.<br />
Therefore, the immediate realized cost savings for each reduced bus is approximately<br />
$300 per day.<br />
The savings from reducing routes in parcels by eliminating certain routes in specific<br />
geographic locations is as follows:<br />
o Eliminating HIGH SCHOOL bus service on Oahu Island - Approximately $6.12<br />
million per year before the one-time termination cost that should not exceed $3<br />
million.<br />
o Eliminating HIGH SCHOOL and MIDDLE SCHOOL bus service on Oahu Island<br />
Approximately $13.18 million per year before the one-time termination cost that<br />
should not exceed $6.6 million.<br />
o Eliminating ALL bus service on Oahu Island except for all schools in deSignated<br />
"Zones of School Innovation" (ZSI) - Approximately $14.6 million per year before<br />
the one-time termination cost that should not exceed $7.3 million.<br />
• Methods of reducing contracted costs - The savings from contractors voluntarily<br />
reducing their existing contract prices is indeterminate. The department remains<br />
optimistic that it may be able to reduce some its transportation costs through<br />
negotiations.<br />
Cost saving measures that do not require amending contract agreements include:<br />
3
1. Staggering school hours - Staggered school hours enables the ability to assign<br />
vehicles to multiple trips at multiple campuses, thereby reducing the overall<br />
number of required vehicles. However, the savings from using staggered school<br />
hours is indeterminate because school participation and the spacing of school<br />
hours will influence its effectiveness. The department is discussing formulating a<br />
mandate on staggered school hours in areas where savings could be achieved.<br />
2. Coordinating school waiver days - The department has already made significant<br />
progress in this area, and there are no school waiver days that affect students in<br />
the current school year. The cost savings of fully coordinated school waiver days<br />
is estimated to be less than 1 % annually.<br />
3. Eliminating free bus service (fare-free ridership) - The net savings (made up of<br />
increased revenue and lower costs because fewer buses would be required) of<br />
eliminating free bus service could reach $14 million annually, assuming half the<br />
free riders choose to continue riding the bus once they have to pay, and before<br />
considering the one-time cost of reducing the number of buses, which is<br />
estimated not to exceed $4 million. If only 25% of the free riders choose to<br />
continue riding the bus once they have to pay, the savings could reach $18<br />
million annually before considering the one-time cost of reducing the number of<br />
buses, which is estimated not to exceed $6 million.<br />
4. Combining age groups on the same bus - The department has already made<br />
significant progress in this area. However, more opportunities remain. The cost<br />
savings will be minimal.<br />
5. Instituting 4-day school weeks - The savings from this option could be<br />
significant. The direct benefit to transportation costs is a savings of 20%, or about<br />
$8 million before considering a 20% reduction in bus pass revenue due to the<br />
reduction in the number of service days, which is estimated to be about $0.6<br />
million. Closing school campuses on what would otherwise be normal school<br />
days could result in additional cost savings to the DOE. This change has<br />
ramifications beyond student transportation and would require legislation to<br />
implement.<br />
6. Increasing the school bus fare - The current school bus fare is equivalent to the<br />
current youth fare on City & County of Honolulu buses, and the department does<br />
not believe it is equitable to charge school bus riders more than the equivalent<br />
"youth" fare on City & County of Honolulu buses.<br />
7. Increasing the distance from school that students must live to qualify for bus<br />
service - Increasing the qualifying distance from 1 mile to 1.5 miles for students<br />
in grades K-5 and from 1.5 to 2 miles for students in grades 6-12 would decrease<br />
both revenue and ridership, with a net reduction in costs estimated at $4 million.<br />
8. Consolidating all bus operations into a single contract - More than one party has<br />
expressed interest in bidding for such a contract with indications that potentially<br />
significant savings to the department may be achievable.<br />
4
• Implementation of transportation services with state personnel and/or buses - The<br />
department has determined that in-sourcing student transportation services is not<br />
beneficial to the state.<br />
• Partnerships with County agencies and use of tripper services - The savings from<br />
discontinuing certain school bus routes on Oahu is estimated at $714,000 for FY 2012.<br />
(3) A prioritized listing of student transportation routes, the reason the route is a priority,<br />
the projected number of students serviced, and the projected cost of providing<br />
transportation service for the route;<br />
This report includes Appendixes A through F (see attachments) which lists the following<br />
data:<br />
A. Current regular education contracts by district on Oahu Island<br />
B. Current regular education contracts by district on Neighbor Islands<br />
C. Current special education contracts by district on Oahu Island<br />
D. Current special education contracts by district on Neighbor Islands<br />
E. Current cost savings from route consolidations (idling buses)<br />
F. The number of contracts and buses that are scheduled to expire in each of the next 6<br />
years<br />
The following table is a prioritized listing of student transportation routes that the department<br />
intends to target for continuance in case of insufficient funding:<br />
Projected Estimated Annual<br />
Students Number of Students Cost of<br />
Prioritll ComQlex Reason for Prioritll Serviced Non-Mandated Services<br />
1. Ka'u-Keaau-Pahoa lSI; High Poverty (93% ride free) 2,940 $ 3.07 million (37 buses)<br />
2. Nanakuli-Waianae lSI; High Poverty (87% ride free) 1,821 $ 1.67 million (23 buses)<br />
3. Hana High Poverty (85% ride free) 198 $ 405,000 (5 buses)<br />
4. Molokai Island High Poverty (78% ride free) 852 $ 1.19 million (21 buses)<br />
5. Hilo-Laupahoehoe-Waiakea High Poverty (75% ride free) 1,422 $ 1.42 million (17 buses)<br />
6. Lahaina High Poverty (67% ride free) 454 $ 842,400 (13 buses)<br />
7. Castle-Kahuku High Poverty (63% ride free) 1,340 $ 2.08 million (30 buses)<br />
• Cost estimates are based on current contract prices for each region, and are based on 180 school days per year<br />
(4) An examination of fee schedules and evaluation of projected cost of providing<br />
transportation service for various pricing strategies<br />
5
The recent history of bus fares is shown in the table below:<br />
Bus Pass Type ThrouQh 12131/2009 1/1/10 to 6/30/11 Current<br />
One-way Bus $ 0.35 $ 0.75 $ 1.25<br />
Coupons<br />
Quarterly Round $ 31.50 $ 60.00 $ 72.00<br />
Trip<br />
Annual Round Trip $ 119.70 $ 225.00 $ 270.00<br />
The total student bus fare collections for SY 2009-2010 were $ 2,075,000.<br />
(The total cost of general education bus contracts for SY 2009-2010 was $35,762,000)<br />
The total student bus fare collections for SY 2010-2011 were $ 2,651,000.<br />
(The total cost of general education bus contracts for SY 2010-2011 was $39,417,000)<br />
The total student bus fare collections for SY 2011-2012 are $ 1,921,000 (to date)<br />
(Student bus fare collections for SY 2011-2012 are projected to reach $ 2,568,000 by year's end<br />
The total cost of general education bus contracts for SY 2011-2012 is projected to be $41,484,000)<br />
Currently, a student is eligible for free bus service if he/she qualifies for one of the following<br />
criteria, as provided in Chapter 8-27, HAR:<br />
• Receives free meal<br />
• Is a foster child<br />
• Is directed by the DOE to attend a school other than the child's home school<br />
• Has 3 or more older siblings who pay for their bus pass<br />
• Is homeless<br />
• Has transferred from his/her neighborhood school that was "In Status" to a school<br />
"Not In Status". "In Status" is a No Child left Behind (NClB) designation for schools<br />
that have not made adequate yearly progress for two or more consecutive years.<br />
I n school year 2009-2010, there were 18,111 registered free bus riders<br />
(This represents an estimated $2,244,000 in lost student bus fare revenue for 2009-2010)<br />
In school year 2010-2011, there were 19,999 registered free bus riders<br />
(This represents an estimated $4,500,000 in lost student bus fare revenue for 2010-2011)<br />
So far in school year 2011-2012, there are 20,514 registered free bus riders<br />
(This represents an estimated $5,539,000 in lost student bus fare revenue for 2011-2012)<br />
The cost of providing student transportation service using "various" pricing strategies is<br />
heavily dependent on the overall number of paying riders in each student fare price point.<br />
The table below illustrates FOUR of an infinite number of pricing scenarios:<br />
6
Subject: Now No.1 No.2 No.3 No.4<br />
Annual fare $270 $270 $270 $540 $540<br />
Some riders ride free? Yes No No Yes No<br />
% of free riders who ride if they must pay NA 50% 25% NA 10%<br />
% of fare-paying riders who continue riding NA 100% 100% 40% 40%<br />
Number of paying riders 16,000 26,000 21,000 6,400 8,400<br />
Number of fare-free riders 20,000 None None 20,000 None<br />
Total number of bus riders 36,000 26,000 21,000 6,400 8,400<br />
Total cost (millions) $40 $29 $23 $29 $9<br />
Cost per rider $1,100 $1,100 $1,100 $1,100 $1,100<br />
Total Revenue (millions) $4 $7 $6 $3 $5<br />
Net Cost (millions) $36 $22 $17 $26 $4<br />
NOTE: Assumes expenses can be reduced proportionately to ridership reduction. In reality, this will result in<br />
unacceptably poor service.<br />
(5) An evaluation of how student transportation is administered, and how costs are<br />
managed and paid for, in other jurisdictions;<br />
For this exercise, the department selected one urban jurisdiction from each of the four<br />
continental United States time zones for best comparison purposes. They are:<br />
Jurisdiction Transportation Administered By Costs Are Paid For By<br />
Services<br />
Furnished By<br />
Washington Pupil Transportation in Washington <strong>Legislative</strong> appropriation provides Contractor and<br />
State State is a section within the Office of funding for five regional transportation District<br />
the Superintendent of Public coordinators. The coordinators assist<br />
Instruction (OSPI). The school districts in preparing funding<br />
Superintendent of Public Instruction is reports, provide local program review<br />
one of nine statewide elected officials. for school district operations, and<br />
The Director of Pupil Transportation is participate in all aspects of statewide<br />
under the Assistant Superintendent for pupil transportation programs. The<br />
Student Support and Operations. District does NOT charge students a<br />
fare.<br />
Indiana The Director of the Office of School All school bus transportation District<br />
State Transportation is under the Indiana operations and school bus purchases<br />
Department of Education. are funded on an individual school<br />
district basis completely through local<br />
property taxes. The District does NOT<br />
charge students a fare.<br />
Louisiana The Director of the Division of Student Revenue is generated by each district. District<br />
State and School Learning Support, School City school board provides free<br />
Bus Transportation Program transportation for any student<br />
attending a school of suitable grade<br />
and approved by the State Board of<br />
Elementary and Secondary Education.<br />
The District does NOT charge students<br />
a fare.<br />
Maryland The Pupil Transportation Director is The State Comptroller shall pay from District<br />
under the Division of Business the General State School Fund the<br />
Services of the Maryland DOE annual appropriation for Student<br />
Transportation. The District does NOT<br />
charge a student fare.<br />
7
(6) Recommendations on the options identified in the report;<br />
• Elimination of services not mandated by law - This option would render immediate and<br />
significant cost relief of $40 million or more. However, such an action would place a<br />
substantial burden on families who currently utilize public school bussing services as<br />
their only means of getting their children to and from school, and has other undesirable<br />
consequences (see discussion on Page 1 under this same heading). Therefore, the<br />
department does not recommend this as a cost-saving measure.<br />
• Route consolidations - The department is committed to seeking additional route<br />
consolidation opportunities in order to further reduce school bus transportation costs.<br />
• Route reduction scenarios - Although the department is not in favor of reducing general<br />
education bussing services to any degree since it would place undue hardship on<br />
students who depend on public school bus services, we agree that it is probably the only<br />
"effective" way of immediately and significantly reducing transportation costs. To that<br />
end, the department recommends that eliminating bus service in parcels, beginning with<br />
Oahu riders because of the availability of city bussing services, would be the best<br />
approach.<br />
• Reducing contracted costs - The department is committed to continuing its pursuit of<br />
reducing the cost of existing contract agreements through one-on-one negotiations. The<br />
department's recommendations on cost-saving measures that do not require negotiation<br />
are as follows:<br />
1. Staggering school hours - The department is in favor of staggering school hours as<br />
a means of reducing its transportation costs and is exploring scheduling options in<br />
complexes where such a change would reduce school bus costs.<br />
2. Coordinating school waiver days - The department is discussing a mandate of this to<br />
reduce its transportation costs.<br />
3. Eliminating free bus service - Most school bus riders qualify for free bus service,<br />
which effectively increases ridership while simultaneously reduces bus pass<br />
revenue. Eliminating free bus service will increase bus revenue and reduce ridership<br />
at the same time (assuming that many free riders would find alternative methods of<br />
transportation rather than pay for a bus pass). Whether certain students should<br />
receive free bus service or not is a policy decision; the department does not<br />
recommend eliminating free bus service at this time for the reasons stated above.<br />
4. Combining age groups on the same bus - Although the cost benefit of combining<br />
age groups on the same bus would be minimal, the department will implement this<br />
as part of a comprehensive cost cutting plan.<br />
5. Deploying 4-day school weeks - Despite the fact that the cost benefit of 4-day school<br />
weeks could be significant (up to 20% annually), the department does not<br />
recommend it as a viable option, as it believes that such a proposal would meet with<br />
stiff public resistance. It would also require an amendment to the state statute that<br />
mandates 180 days of instruction.<br />
8
Provided further that the department shall submit the report to the legislature no later<br />
than forty days prior to the convening of the 2012 regular session; and provided<br />
further that the legislature may appropriate funds for student transportation services<br />
not mandated by state or federal law upon receipt and evaluation of the report.<br />
10
2<br />
3<br />
4<br />
5<br />
6<br />
7<br />
8<br />
9<br />
2<br />
3<br />
2<br />
3<br />
4<br />
5<br />
6<br />
2<br />
3<br />
4<br />
Contract<br />
Number<br />
60136<br />
60137<br />
60176<br />
70232<br />
70233<br />
70234<br />
80137<br />
80138<br />
90130<br />
60135<br />
10182<br />
10088<br />
70235<br />
80134<br />
80135<br />
80136<br />
90131<br />
90132<br />
70236<br />
70237<br />
80111<br />
80139<br />
Company<br />
Ground<br />
Ground<br />
Yamaguchi<br />
Ground<br />
Ground<br />
Gomes<br />
Robert's<br />
Robert's<br />
Tomasa<br />
Ground<br />
Robert's<br />
Ground<br />
Ground<br />
Robert's<br />
Robert's<br />
Robert's<br />
Tomasa<br />
Tomasa<br />
Gomes<br />
Gomes<br />
Gomes<br />
Robert's<br />
2011-12 SCHOOL BUS CONTRACTS BY DISTRICT<br />
Regular Education - Oahu Island<br />
District Start Date End Date No. of Dally Miles<br />
Buses<br />
Central 7/1/06 6/30/14 10 145<br />
Central 7/1/06 6/30/14 7 83<br />
Central 7/1/06 6/30/14 27 605<br />
Central 7/1/07 6/30/13 21 682<br />
Central 7/1/07 6/30/13 6 188<br />
Central 7/1/07 6/30/13 15 210<br />
Central 7/1/08 6/30/14 16 396<br />
Central 7/1/08 6/30/14 4 106<br />
Central 7/1/09 6/30/19 5<br />
111<br />
90<br />
Honolulu 7/1/06 6/30/14 1 41<br />
Honolulu 7/1/11 6/30/15 1 22<br />
Honolulu 7/1/10 6/30/14 4<br />
6<br />
232<br />
Leeward 7/1/07 6/30/13 7 136<br />
Leeward 7/1/08 6/30/14 14 559<br />
Leeward 7/1/08 6/30/14 17 1024<br />
Leeward 7/1/08 6/30/14 16 435<br />
Leeward 7/1/09 6/30/19 15 916<br />
Leeward 7/1/09 6/30/19 8<br />
77<br />
386<br />
Windward 7/1/07 6/30/13 6 132<br />
Windward 7/1/07 6/30/13 14 264<br />
Windward 7/1/08 6/30/14 10 226<br />
Windward 7/1/08 6/30/14 13<br />
43<br />
446<br />
Contract Cost Per<br />
Day<br />
$ 3,250.61<br />
$ 2,276.35<br />
$ 10,347.06<br />
$ 5,583.22<br />
$ 1,595.37<br />
$ 4,566.82<br />
$ 8,497.95<br />
$ 2,124.17<br />
$ 1,960.97<br />
$ 40,202.52<br />
$ 364.38<br />
$ 325.00<br />
$ 1,639.31<br />
$ 2,328.69<br />
$ 2,177.37<br />
$ 7,425.87<br />
$ 9,001.15<br />
$ 8,496.14<br />
$ 5,313.20<br />
$ 2,836.22<br />
$ 35,249.95<br />
$ 1,978.95<br />
$ 4,518.90<br />
$ 3,548.97<br />
$ 6,908.47<br />
$ 16,955.29<br />
Cumulative Cost of REGED Bus Contracts on Oahu PER DAY: I $ 94,736.45 I<br />
Gross Cost of REG ED Bus Contracts on Oahu (180 school days): I $ 17 .. 052,561.02 I<br />
Appendix A<br />
Cost Per Bus<br />
Per Day<br />
$ 325.061<br />
$ 325.192<br />
$ 383.225<br />
$ 265.868<br />
$ 265.895<br />
$ 304.455<br />
$ 531.122<br />
$ 531.041<br />
$ 392.195<br />
$ 364.378<br />
$ 325.000<br />
$ 409.828<br />
$ 311.053<br />
$ 530.419<br />
$ 529.480<br />
$ 531.008<br />
$ 354.214<br />
$ 354.527<br />
$ 329.825<br />
$ 322.778<br />
$ 354.897<br />
$ 531.421
2<br />
3<br />
4<br />
5<br />
6<br />
7<br />
8<br />
9<br />
10<br />
11<br />
12<br />
13<br />
14<br />
2<br />
3<br />
4<br />
5<br />
6<br />
2<br />
3<br />
4<br />
5<br />
6<br />
7<br />
8<br />
9<br />
10<br />
11<br />
12<br />
ContnK:t<br />
Number<br />
60174<br />
10183<br />
70238<br />
80112<br />
80123<br />
80140<br />
90114<br />
90115<br />
90120<br />
90121<br />
90122<br />
90123<br />
90124<br />
90125<br />
02024<br />
80113<br />
80125<br />
90126<br />
90127<br />
90128<br />
50066<br />
50068<br />
50070<br />
50070<br />
50071<br />
50071<br />
50072<br />
50073<br />
50073<br />
10185<br />
70032<br />
70239<br />
1 50059<br />
2 50059<br />
3 50065<br />
4 60175<br />
5 10184<br />
6 10186<br />
7 70240<br />
8 70241<br />
9 70242<br />
10 70243<br />
1 70244<br />
12 70245<br />
13 70246<br />
14 70247<br />
15 70248<br />
16 70249<br />
17 10081<br />
Compllny<br />
Akita<br />
Robert's<br />
Robert's<br />
Akita<br />
Akita<br />
Robert's<br />
Akita<br />
Akita<br />
Robert's<br />
Robert's<br />
Robert's<br />
Robert's<br />
Robert's<br />
Robert's<br />
Robert's<br />
Yamaguchi<br />
Robert's<br />
Robert's<br />
Robert's<br />
Robert's<br />
Yamaguchi<br />
Yamaguchi<br />
Yamaguchi<br />
Yamaguchi<br />
Akita<br />
Akita<br />
Akita<br />
Akita<br />
Akita<br />
Robert's<br />
Akita<br />
Yamaguchi<br />
Dudoit<br />
Dudoit<br />
Akita<br />
Akita<br />
Robert's<br />
Spencer<br />
Robert's<br />
Robert's<br />
Akina<br />
Robert's<br />
Robert's<br />
Robert's<br />
Robert's<br />
Robert's<br />
Robert's<br />
Molokai Trans<br />
Akina<br />
2011-2012 SCHOOL BUS CONTRACTS BY OISTRICT<br />
Regular Education - Neighbor Islands<br />
DJatrict SlartDa18 End Dille<br />
No. of<br />
DaIIyMJI ..<br />
Bus ..<br />
East Hawaii 7/1/06 6130112 2 95<br />
East Hawaii 7/1/11 6/30/17 8 342<br />
East Hawaii 7/1/07 6/30/13 3 162<br />
East Hawaii 7/1/08 6/30/14 6 342<br />
East Hawaii 7/1/08 6/30/14 3 96<br />
East Hawaii 7/1/08 6/30/14 20 1353<br />
East Hawaii 7/1/09 6/30/19 5 192<br />
East Hawaii 7/1/09 6/30/19 4 234<br />
East Hawaii 7/1/09 6/30/19 2 51<br />
East Hawaii 7/1/09 6/30/19 1 22<br />
East Hawaii 7/1/09 6/30/19 2 48<br />
East Hawaii 711/09 6/30/19 4 167<br />
East Hawaii 7/1/09 6/30/19 3 127<br />
East Hawaii 7/1/09 6/30/19 6<br />
69<br />
270<br />
West Hawaii 7/14/06 6130112 12 250<br />
West Hawaii 7/1/08 6/30/14 14 581<br />
West Hawaii 711108 6/30/14 6 180<br />
West Hawaii 711109 6/30/19 16 859<br />
West Hawaii 7/1/09 6/30/19 2 60<br />
West Hawaii 7/1/09 6/30/19 2<br />
52<br />
139<br />
Kauai 7/1/11 6/30/13 1 42<br />
Kauai 7/1/11 6/30113 2 116<br />
Kauai 7/1/11 6/30/13 2 35<br />
Kauai 7/1/11 6/30/13 1 18<br />
Kauai 7/1/11 6/30/13 10 306<br />
Kauai 7/1/11 6/30/13 3 127<br />
Kauai 7/1/11 6/30/13 1 50<br />
Kauai 7/1/11 6/30/13 13 554<br />
Kauai 7/1/11 6/30/13 1 20<br />
Kauai 7/1/11 6/30/17 19 unavailable<br />
Kauai 7/1/07 6/30/13 1 128<br />
Kauai 7/1/07 6/30/13 1<br />
55<br />
74<br />
Maui 7/1/11 6/30/13 6 210<br />
Maui 7/1/11 6/30/13 1 27<br />
Maui 7/1/11 6/30/13 3 64<br />
Maui 7/1/06 6/30/14 5 185<br />
Maui 7/1/11 6/30/17 43 unavailable<br />
Maui 7/1/11 6/30/17 7 unavailabla<br />
Maui 7/1/07 6/30/13 2 40<br />
Maui 7/1/07 6/30/13 3 75<br />
Maui 7/1/07 6/30/13 3 62<br />
Maui 7/1/07 6/30/13 6 214<br />
Maui 7/1/07 6/30/13 8 327<br />
Maui 7/1/07 6/30/13 5 96<br />
Maui 7/1/07 6/30/13 3 112<br />
Maui 7/1/07 6/30/13 3 112<br />
Maui 7/1/07 6/30/13 2 58<br />
Maui 7/1/07 6/30/13 4 104<br />
Maui 7/1/10 6/30/20 3<br />
107<br />
169<br />
2011-2012 Cost<br />
Pero.v<br />
$ 718.10<br />
$ 3,710.00<br />
$ 1,224.16<br />
$ 2,454.37<br />
$ 1,106.42<br />
$ 10,565.21<br />
$ 1,973.96<br />
$ 1,577.20<br />
$ 1,192.50<br />
$ 427.00<br />
$ 853.91<br />
$ 2,383.39<br />
$ 1,787.50<br />
$ 3,574.60<br />
$ 33,548.33<br />
$ 5,635.34<br />
$ 7,152.89<br />
$ 3,189.14<br />
$ 9,528.85<br />
$ 1,192.28<br />
$ 1,190.33<br />
$ 27,888.84<br />
$ 329.83<br />
$ 652.82<br />
$ 621.20<br />
$ 311.69<br />
$ 3,280.56<br />
$ 987.93<br />
$ 327.66<br />
$ 4,328.94<br />
$ 336.20<br />
$ 8,850.00<br />
$ 490.44<br />
$ 411.69<br />
$ 20,928.96<br />
$ 1,936.27<br />
$ 326.04<br />
$ 1,012.23<br />
$ 2,246.87<br />
$ 19,365.00<br />
$ 2,100.00<br />
$ 597.35<br />
$ 1,130.33<br />
$ 1,028.79<br />
$ 1,986.23<br />
$ 2,465.46<br />
$ 1,527.34<br />
$ 1,208.06<br />
$ 1,208.06<br />
$ 658.68<br />
$ 1,331 .84<br />
$ 1,362.61<br />
$ 41,491.15<br />
Cumulative Cost of REG ED Bus Contracts on Neighbor Islands PER DAY: I .. :;.$_.....:1:;:2"'3,0.:8.:.57"'.:;:2.:.9..J1<br />
Gross Cost of REGED Bus Contracts on Neighbor Islands (180 school days): 1 $ 22,294,311.741<br />
Appendix B<br />
Coat Per Bua<br />
Per Day<br />
$ 359.051<br />
$ 463.750<br />
$ 408.053<br />
$ 409.062<br />
$ 368.807<br />
$ 528.261<br />
$ 394.792<br />
$ 394.300<br />
$ 596.249<br />
$ 427.004<br />
$ 426.954<br />
$ 595.848<br />
$ 595.833<br />
$ 595.767<br />
$ 469.612<br />
$ 510.921<br />
$ 531.523<br />
$ 595.553<br />
$ 596.140<br />
$ 595.166<br />
$ 329.830<br />
$ 326.411<br />
$ 310.602<br />
$ 311.689<br />
$ 328.056<br />
$ 329.310<br />
$ 327.662<br />
$ 332.996<br />
$ 336.196<br />
$ 465.789<br />
$ 490.442<br />
$ 411.685<br />
$ 322.712<br />
$ 326.042<br />
$ 337.412<br />
$ 449.374<br />
$ 450.349<br />
$ 300.000<br />
$ 298.674<br />
$ 376.776<br />
$ 342.929<br />
$ 331.038<br />
$ 308.183<br />
$ 305.468<br />
$ 402.686<br />
$ 402.686<br />
$ 329.342<br />
$ 332.959<br />
$ 454.202
2<br />
3<br />
4<br />
5<br />
2<br />
3<br />
1<br />
2<br />
3<br />
4<br />
1<br />
2<br />
3<br />
4<br />
Contract<br />
Number<br />
60140<br />
70325<br />
70326<br />
80114<br />
90118<br />
60138<br />
60138AC<br />
60139<br />
70327<br />
70328<br />
80126<br />
90119<br />
70329<br />
70330<br />
70331<br />
80115<br />
Company<br />
RHSB<br />
RHSB<br />
Yamaguchi<br />
RHSB<br />
Ground<br />
RHSB<br />
RHSB<br />
RHSB<br />
RHSB<br />
Ground<br />
Tomasa<br />
Ground<br />
Tomasa<br />
Gomes<br />
Gomes<br />
Tomasa<br />
2011-2012 SCHOOL BUS CONTRACTS BY DISTRICT<br />
Special Education (Curb-to-Curb only) - Oahu Island<br />
District Start Date End Date<br />
No. of<br />
Buses<br />
Dally Miles<br />
Central 7/1/06 6/30/12 26 895<br />
Central 7/1/07 6/30/13 3 148<br />
Central 7/1/07 6/30/13 3 128<br />
Central 7/1/08 6/30/14 3 254<br />
Central 7/1/09 6/30/19 20<br />
55<br />
1257<br />
Honolulu 7/1/06 6/30/12 19 857<br />
Honolulu 7/1/06 6/30/12 2 90<br />
Honolulu 7/1/06 6/30/12 20<br />
41<br />
1276<br />
Leeward 7/1/07 6/30/13 3 250<br />
Leeward 7/1/07 6/30/13 22 823<br />
Leeward 7/1/08 6/30/14 9 517<br />
Leeward 7/1/09 6/30/19 31<br />
65<br />
1319<br />
Windward 7/1/07 6/30/13 2 110<br />
Windward 7/1/07 6/30/13 13 411<br />
Windward 7/1/07 6/30/13 12 447<br />
Windward 7/1/08 6/30/14 6<br />
33<br />
134<br />
2011-2012 Cost<br />
Per Day<br />
$ 8,894.09<br />
$ 1,690.56<br />
$ 1,638.89<br />
$ 1,840.31<br />
$ 9,913.07<br />
$ 23,976.93<br />
$ 5,810.25<br />
$ 730.Q1<br />
$ 6,326.15<br />
$ 12,866.41<br />
$ 1,778.20<br />
$ 10,243.66<br />
$ 3,195.95<br />
$ 15,530.69<br />
$ 30,748.51<br />
$ 912.70<br />
$ 5,159.54<br />
$ 4,759.22<br />
$ 2,190.01<br />
$ 13,021.48<br />
Cumulative Cost of SPED Bus Contracts on Oahu PER DAY: 1 .... $.:....-_8_0....:,,_61_3_.3_2---11<br />
Gross Cost of SPED Bus Contracts on Oahu (210 school days): 1 $16,928,797.751<br />
Appendix C<br />
Cost Per Bus<br />
Per Day<br />
$ 342.081<br />
$ 563.520<br />
$ 546.296<br />
$ 613.438<br />
$ 495.654<br />
$ 305.802<br />
$ 365.005<br />
$ 316.308<br />
$ 592.734<br />
$ 465.621<br />
$ 355.106<br />
$ 500.990<br />
$ 456.351<br />
$ 396.888<br />
$ 396.602<br />
$ 365.002
2<br />
3<br />
4<br />
5<br />
2<br />
3<br />
4<br />
5<br />
2 1<br />
2<br />
3<br />
4<br />
5<br />
6<br />
7<br />
8<br />
I<br />
Contract<br />
Number<br />
70332<br />
70333<br />
70334<br />
70335<br />
90116<br />
02027<br />
60134<br />
70336<br />
80124<br />
80141<br />
50077 I<br />
90117 1<br />
10181<br />
70337<br />
70338<br />
70339<br />
70340<br />
70341<br />
80116<br />
90129<br />
Company<br />
RHSB<br />
RHSB<br />
RHSB<br />
RHSB<br />
Akita<br />
RHSB<br />
Akita<br />
RHSB<br />
Akita<br />
RHSB<br />
Akita I<br />
Akita 1<br />
RHSB<br />
RHSB<br />
RHSB<br />
RHSB<br />
Spencer<br />
Dudoit<br />
Akita<br />
RHSB<br />
2011-2012 SCHOOl BUS CONTRACTS BY DISTRICT<br />
Special Education (Curb-to-Curb only) - Neighbor Islands<br />
District Start Date End Date No. of Buses<br />
Dally Miles<br />
2011·2012 Cost Per<br />
Day<br />
East Hawaii 7/1/07 6/30/13 8 312 $ 4,434.71<br />
East Hawaii 7/1/07 6/30/13 8 312 $ 4,565.94<br />
East Hawaii 7/1/07 6/30/13 9 351 $ 4,989.06<br />
East Hawaii 7/1/07 6/30/13 1 39 $ 554.34<br />
East Hawaii 7/1/09 6/30/19 3 313 $ 1,435.43<br />
29 $ 15,979.48<br />
Kauai I 7/1/11 I 6/30/13 4 122 $ 1,674.80<br />
Kauai 1 7/1/09 1 6/30/19 9 816 $ 3,107.82<br />
13 $ 4,782.62<br />
Cumulative Cost of SPED Bus Contracts on Neighbor Islands PER DAY: I $ 51,517.81 I<br />
Gross Cost of SPED Bus Contracts on Oahu (210 school days): I $ 10,818,740.03 I<br />
Appendix D<br />
Cost Per Bus<br />
Per Day<br />
$ 554.339<br />
$ 570.742<br />
$ 554.340<br />
$ 554.343<br />
$ 478.476<br />
West Hawaii 7/14/06 6/30112 4 121 $ 1,934.84 $ 483.709<br />
West Hawaii 7/1/06 6/30/12 2 188 $ 783.10 $ 391.552<br />
West Hawaii 7/1/07 6/30/13 6 360 $ 3,319.56 $ 553.260<br />
West Hawaii 7/1/08 6/30/14 1 40 $ 560.87 $ 560.868<br />
West Hawaii 7/1/08 6/30/14 4 120 $ 2,465.21 $ 616.301<br />
17 $ 9,063.58<br />
$ 418.701 I<br />
$ 345.3131<br />
Maui 7/1/11 6/30/17 18 unavailable $ 7,542.00 $ 419.000<br />
Maui 7/1/07 6/30/13 4 55 $ 2,132.78 $ 533.194<br />
Maui 7/1/07 6/30/13 6 168 $ 3,329.39 $ 554.898<br />
Maui 7/1/07 6/30/13 5 133 $ 2,887.01 $ 577.402<br />
Maui 7/1/07 6/30/13 3 202 $ 1,103.37 $ 367.789<br />
Maui 7/1/07 6/30/13 2 44 $ 749.56 $ 374.782<br />
Maui 7/1/08 6/30/14 1 4 $ 410.65 $ 410.646<br />
Maui 7/1/09 6/30/19 6 200 $ 3,537.38 $ 589.564<br />
45 $ 21,692.13
2<br />
3<br />
4<br />
5<br />
6<br />
7<br />
8<br />
2<br />
3<br />
4<br />
5<br />
6<br />
7<br />
8<br />
9<br />
10<br />
11<br />
12<br />
13<br />
14<br />
15<br />
16<br />
17<br />
18<br />
19<br />
20<br />
21<br />
22<br />
23<br />
24<br />
25<br />
26<br />
27<br />
28<br />
29<br />
30<br />
31<br />
32<br />
33<br />
34<br />
35<br />
36<br />
37<br />
38<br />
39<br />
40<br />
41<br />
42<br />
43<br />
44<br />
45<br />
DI.trlct<br />
Central Oahu<br />
East Hawaii<br />
Honolulu<br />
Honolulu<br />
Honolulu<br />
West Hawaii<br />
West Hawaii<br />
West Hawaii<br />
Central Oahu<br />
Central Oahu<br />
Central Oahu<br />
Central Oahu<br />
Central Oahu<br />
East Hawaii<br />
East Hawaii<br />
East Hawaii<br />
East Hawaii<br />
East Hawaii<br />
Kauai<br />
Kauai<br />
Kauai<br />
Kauai<br />
Kauai<br />
Kauai<br />
Kauai<br />
Kauai<br />
Kauai<br />
Leeward Oahu<br />
Leeward Oahu<br />
Leeward Oahu<br />
Maui<br />
Maui<br />
Maui<br />
Maui<br />
Maui<br />
Maui<br />
Maui<br />
Maui<br />
Maui<br />
Maui<br />
Maui<br />
Maui<br />
Maui<br />
Maui<br />
Maui<br />
Maui<br />
Maui<br />
West Hawaii<br />
Windward Oahu<br />
Windward Oahu<br />
Windward Oahu<br />
Windward Oahu<br />
Windward Oahu<br />
Expl ....<br />
On<br />
6/30/12<br />
6/30/12<br />
6/30/12<br />
6/30/12<br />
6/30/12<br />
6/30/12<br />
6/30/12<br />
6/30/12<br />
6/30/13<br />
6/30/13<br />
6/30/13<br />
6/30/13<br />
6/30/13<br />
6/30/13<br />
6/30/13<br />
6/30/13<br />
6/30/13<br />
6/30/13<br />
6/30/13<br />
6/30/13<br />
6/30/13<br />
6/30/13<br />
6/30/13<br />
6/30/13<br />
6/30/13<br />
6/30/13<br />
6/30/13<br />
6/30/13<br />
6/30/13<br />
6/30/13<br />
6/30/13<br />
6/30/13<br />
6/30/13<br />
6/30/13<br />
6/30/13<br />
6/30/13<br />
6/30/13<br />
6/30/13<br />
6/30/13<br />
6/30/13<br />
6/30/13<br />
6/30/13<br />
6/30/13<br />
6/30/13<br />
6/30/13<br />
6/30/13<br />
6/30/13<br />
6/30/13<br />
6/30/13<br />
6/30/13<br />
6/30/13<br />
6/30/13<br />
6/30/13<br />
CUMULATIVE NUMBER OF CONTRACTS AND BUSES EXPIRING BY DATE<br />
Regular Education and Special Education<br />
No. of 2011·2012 Cost<br />
Bu ••• Per Bus/Day<br />
26 $ 342.081<br />
2 $ 359.051<br />
19 $ 305.802<br />
2 $ 365.005<br />
20 $ 316.308<br />
12 $ 469.612<br />
4 $ 483.709<br />
2<br />
87<br />
$ 391.552<br />
21 $ 265.868<br />
6 $ 265.895<br />
15 $ 304.455<br />
3 $ 563.520<br />
3 $ 546.296<br />
3 $ 408.053<br />
8 $ 554.339<br />
8 $ 570.742<br />
9 $ 554.340<br />
1 $ 554.343<br />
1 $ 329.830<br />
2 $ 326.411<br />
2 S 310.602<br />
10 $ 328.056<br />
1 $ 327.662<br />
13 $ 332.996<br />
1 $ 490.442<br />
1 $ 411.685<br />
4 $ 418.701<br />
7 $ 311.053<br />
3 $ 592.734<br />
22 $ 465.621<br />
6 $ 322.712<br />
3 $ 337.412<br />
2 $ 298.674<br />
3 $ 376.776<br />
3 $ 342.929<br />
6 S 331.038<br />
8 $ 308.183<br />
5 $ 305.468<br />
3 $ 402.686<br />
3 $ 402.686<br />
2 $ 329.342<br />
4 $ 332.959<br />
4 S 533.194<br />
6 $ 554.898<br />
5 $ 577.402<br />
3 $ 367.789<br />
2 $ 374.782<br />
6 $ 553.260<br />
6 $ 329.825<br />
14 $ 322.778<br />
2 $ 456.351<br />
13 $ 396.888<br />
12<br />
265<br />
$ 396.602<br />
Contract<br />
Type<br />
SPED<br />
REGED<br />
SPED<br />
SPED<br />
SPED<br />
REGED<br />
SPED<br />
SPED<br />
REGED<br />
REGED<br />
REGED<br />
SPED<br />
SPED<br />
REGED<br />
SPED<br />
SPED<br />
SPED<br />
SPED<br />
REGED<br />
REGED<br />
REGED<br />
REGED<br />
REGED<br />
REGED<br />
REGED<br />
REGED<br />
SPED<br />
REGED<br />
SPED<br />
SPED<br />
REGED<br />
REGED<br />
REGED<br />
REGED<br />
REGED<br />
REGED<br />
REGED<br />
REGED<br />
REGED<br />
REGED<br />
REGED<br />
REGED<br />
SPED<br />
SPED<br />
SPED<br />
SPED<br />
SPED<br />
SPED<br />
REGED<br />
REGED<br />
SPED<br />
SPED<br />
SPED<br />
Appendix F<br />
District<br />
expires<br />
On<br />
1 Central Oahu 6/30/14<br />
2 Central Oahu 6/30/14<br />
3 Central Oahu 6/30/14<br />
4 Central Oahu 6/30/14<br />
5 Central Oahu 6/30/14<br />
6 Central Oahu 6/30/14<br />
7 East Hawaii 6/30/14<br />
8 East Hawaii 6/30/14<br />
9 East Hawaii 6/30/14<br />
10 Honolulu 6/30/14<br />
11 Honolulu 6/30/14<br />
12 Leeward Oahu 6/30/14<br />
13 Leeward Oahu 6/30/14<br />
14 Leeward Oahu 6/30/14<br />
15 Leeward Oahu 6/30/14<br />
16 Maui 6/30/14<br />
17 Maui 6/30/14<br />
18 West Hawaii 6/30/14<br />
19 West Hawaii 6/30/14<br />
20 West Hawaii 6/30/14<br />
21 West Hawaii 6/30/14<br />
22 Windward Oahu 6/30/14<br />
23 Windward Oahu 6/30/14<br />
24 Windward Oahu 6/30/14<br />
11<br />
01<br />
1<br />
2<br />
3<br />
4<br />
5<br />
Honolulu 6/30/15<br />
6/30/16<br />
East Hawaii 6/30/17<br />
Kauai 6/30/17<br />
Maui 6/30/17<br />
Maui 6/30/17<br />
Maui 6/30/17<br />
No. of 2011·2012 Cost Contract<br />
Bus .. Per Bus/Day Type<br />
10 $ 325.061 REG ED<br />
7 $ 325.192 REG ED<br />
27 $ 383.225 REG ED<br />
16 $ 531.122 REG ED<br />
4 $ 531.041 REG ED<br />
3 $ 613.438 SPED<br />
6 $ 409.062 REG ED<br />
3 $ 368.807 REG ED<br />
20 $ 528.261 REG ED<br />
1 $ 364.378 REGED<br />
4 $ 409.828 REGED<br />
14 $ 530.419 REGED<br />
17 $ 529.480 REGED<br />
16 $ 531.008 REGED<br />
9 $ 355.106 SPED<br />
5 $ 449.374 REGED<br />
1 $ 410.646 SPED<br />
14 $ 510.921 REG ED<br />
6 S 531.523 REG ED<br />
1 S 560.868 SPED<br />
4 $ 616.301 SPED<br />
10 $ 354.897 REGED<br />
13 $ 531.421 REG ED<br />
6 $ 365.002 SPED<br />
217<br />
1<br />
1<br />
0<br />
0<br />
1$<br />
I<br />
325.000 1 REG ED<br />
8 $ 463.750 REGED<br />
19 $ 465.789 REGED<br />
43 $ 450.349 REGED<br />
7 $ 300.000 REGED<br />
18 $ 419.000 SPED<br />
95


