Full Paper in pdf - MISRC - University of Minnesota
Full Paper in pdf - MISRC - University of Minnesota
Full Paper in pdf - MISRC - University of Minnesota

Create successful ePaper yourself
Turn your PDF publications into a flip-book with our unique Google optimized e-Paper software.
DO INFORMATION TECHNOLOGY INDUSTRIES IN INDIVIDUAL STATES<br />
RESPOND TO NATIONAL SHOCKS?<br />
Robert J. Kauffman<br />
Director, MIS Research Center, and Pr<strong>of</strong>essor and Chair<br />
rkauffman@csom.umn.edu<br />
Ajay Kumar<br />
Doctoral Program<br />
akumar2@csom.umn.edu<br />
Information and Decision Sciences Department<br />
Carlson School <strong>of</strong> Management, <strong>University</strong> <strong>of</strong> M<strong>in</strong>nesota<br />
M<strong>in</strong>neapolis, MN 55455<br />
Last revised: October 2, 2006<br />
_____________________________________________________________________________<br />
ABSTRACT<br />
Different states <strong>in</strong> the United States have reacted differently to the boom and bust period <strong>in</strong> the<br />
<strong>in</strong>formation technology (IT) sector. We analyze the state-wise trends <strong>of</strong> employment <strong>in</strong> two IT<br />
manufactur<strong>in</strong>g sectors (the computer and peripheral manufactur<strong>in</strong>g <strong>in</strong>dustry, and the<br />
semiconductor and other electronic components manufactur<strong>in</strong>g <strong>in</strong>dustries), and one IT service<br />
<strong>in</strong>dustry (the s<strong>of</strong>tware publish<strong>in</strong>g <strong>in</strong>dustry) over the period 1994 to 2003. We use near vector<br />
autoregression (NVAR) analysis to study the co-movement <strong>of</strong> employment patterns <strong>in</strong> these<br />
<strong>in</strong>dustries at the national and state levels, and estimate the related contagion effects based on the<br />
extent to which a national shock <strong>in</strong>fluences the state growth pattern for the <strong>in</strong>dustry. We f<strong>in</strong>d that<br />
the IT manufactur<strong>in</strong>g <strong>in</strong>dustries have significantly higher contagion effects as compared to IT<br />
services <strong>in</strong>dustries. We also f<strong>in</strong>d that the larger IT-produc<strong>in</strong>g states tend to have larger contagion<br />
effects. We explore the factors that characterize this long-term relationship between the whole <strong>of</strong><br />
United States and its <strong>in</strong>dividual states, and f<strong>in</strong>d that per capita state gross product, export base <strong>of</strong><br />
the state, average firm size, new economy <strong>in</strong>dex, venture capital are among the factors which<br />
<strong>in</strong>fluence the contagion effects between states. We also note that their <strong>in</strong>fluence varies for<br />
different IT <strong>in</strong>dustries.<br />
Keywords and phrases: Aggregate analysis, co-movement, contagion effects, empirical<br />
analysis, IT <strong>in</strong>dustries, IT supply, macroeconomy, near vector autoregression, shock analysis.<br />
______________________________________________________________________________<br />
Acknowledgments. The authors wish to thank our bus<strong>in</strong>ess school librarian, Van Houlson, and<br />
the M<strong>in</strong>nesota Center for Population Studies for assistance with the data for this project. Ajay<br />
Kumar acknowledges the Graduate School <strong>of</strong> the <strong>University</strong> <strong>of</strong> M<strong>in</strong>nesota for ongo<strong>in</strong>g<br />
fellowship support, and Rob Kauffman wishes to thank the MIS Research Center <strong>of</strong> the<br />
<strong>University</strong> <strong>of</strong> M<strong>in</strong>nesota for partial support, as well as Donna Sarppo, Assistant Director, for<br />
assistance.
INTRODUCTION<br />
Employment <strong>in</strong> the computer and peripheral equipment manufactur<strong>in</strong>g <strong>in</strong>dustry fell by nearly<br />
22% between 1994 and 2003 <strong>in</strong> the United States. The decl<strong>in</strong>e <strong>in</strong> this sector’s employment is<br />
commonly attributed to the <strong>in</strong>creas<strong>in</strong>g <strong>of</strong>fshor<strong>in</strong>g <strong>of</strong> manufactur<strong>in</strong>g and the dotcom bubble. Both<br />
these shocks occurred at the national level and were experienced by all states with<strong>in</strong> the U.S.<br />
However, the extent to which the shocks <strong>in</strong>fluenced the different states is different. Dur<strong>in</strong>g the<br />
past decade, some states experienced tremendous IT <strong>in</strong>dustry growth and while others had to<br />
deal with stagger<strong>in</strong>g decl<strong>in</strong>es <strong>in</strong> growth. For example, from 1994 to 2003, employment <strong>in</strong> the<br />
computer and peripheral equipment manufactur<strong>in</strong>g <strong>in</strong>dustry fell by 46% <strong>in</strong> California, but grew<br />
by over 93% <strong>in</strong> Texas— a ―m iracle,‖ <strong>in</strong> the view <strong>of</strong> some observers (e.g., Virmani and Brown,<br />
2005). The prior literature has not looked at this <strong>in</strong>terest<strong>in</strong>g phenomenon <strong>of</strong> different responses<br />
by states to national level IT shocks. The diagnosis <strong>of</strong> how different states responded to shocks<br />
<strong>in</strong> IT sector dur<strong>in</strong>g the last decade is <strong>in</strong>terest<strong>in</strong>g because <strong>of</strong> the variations <strong>in</strong> the responses. It is<br />
also relevant as it may provide <strong>in</strong>sights about how other states might be able to duplicate Texas’<br />
experience.<br />
Regional economists and macroeconomists generally believe that there is long-term<br />
underly<strong>in</strong>g relationship between the national and regional economies <strong>of</strong> a country (Sherwood-<br />
Call, 1988; Brewer, 1985; Kort, 1981). IT is an important sector <strong>in</strong> the new economy and an<br />
understand<strong>in</strong>g <strong>of</strong> the regional and national relationships <strong>in</strong> this sector is <strong>of</strong> <strong>in</strong>terest to policy<br />
planners the world over. Among not very different metropolitan areas <strong>in</strong> the U.S., the growth <strong>in</strong><br />
the high-tech <strong>in</strong>dustry expla<strong>in</strong>s nearly 70% <strong>of</strong> the variation <strong>in</strong> relative economic growth (DeVol,<br />
1999). Understand<strong>in</strong>g how a regional IT <strong>in</strong>dustry is affected by external shocks also has<br />
important implications for forecast<strong>in</strong>g the future <strong>of</strong> the <strong>in</strong>dustry <strong>in</strong> the state and its overall impact<br />
1
on the economy. Such analysis also has the potential to provide an understand<strong>in</strong>g <strong>of</strong> the <strong>in</strong>herent<br />
strengths <strong>of</strong> a region to play host to the development <strong>of</strong> IT <strong>in</strong>dustries. So the exploration <strong>of</strong><br />
factors which may expla<strong>in</strong> such strengths are likely to help policy makers to address concerns<br />
relat<strong>in</strong>g to the success <strong>of</strong> IT <strong>in</strong>dustries.<br />
High-level growth trends may not always reflect the long-term relationship between regional<br />
and state economies because <strong>in</strong>dustries <strong>of</strong>ten are <strong>in</strong>fluenced by unexpected local and national<br />
factors. Local shocks occur <strong>in</strong> different forms. One occurs when a major unit <strong>of</strong> a firm <strong>in</strong> the IT<br />
<strong>in</strong>dustry comes onto the scene, like Micros<strong>of</strong>t Research <strong>in</strong> Beij<strong>in</strong>g (Wang, 1998), which may<br />
spur the growth <strong>of</strong> related IT <strong>in</strong>dustries <strong>in</strong> the region irrespective <strong>of</strong> any other <strong>in</strong>fluences. Arthur<br />
(1990) also refers to such a possibility, argu<strong>in</strong>g that locations that are <strong>in</strong>herently <strong>in</strong>ferior may<br />
emerge as w<strong>in</strong>ners if, by accident or path dependence, they accumulate an early critical mass <strong>of</strong><br />
firms <strong>in</strong> an <strong>in</strong>dustry. Subsidies by local governments also may spur an <strong>in</strong>dustry <strong>in</strong> a region to<br />
grow.<br />
To effectively study growth trends for IT <strong>in</strong>dustries, we must capture the overall effect <strong>of</strong><br />
various <strong>in</strong>fluences, both local and national. But merely look<strong>in</strong>g at time trends may not convey<br />
whether they are occurr<strong>in</strong>g due to local forces or national forces. For example, although the<br />
computer and other peripheral manufactur<strong>in</strong>g <strong>in</strong>dustry has grown <strong>in</strong> Texas <strong>in</strong> the past fifteen<br />
years while the national trend has been on decl<strong>in</strong>e, nevertheless it would be hard to conclude that<br />
Texas was less impacted by national factors, such as <strong>of</strong>fshor<strong>in</strong>g and the dotcom bubble, than<br />
other states. It is possible that Texas actually was equally or even more <strong>in</strong>fluenced than<br />
California was, but s<strong>in</strong>ce the local factors were stronger the overall trend shows an <strong>in</strong>cl<strong>in</strong>e.<br />
Thus, time trend alone may not signify the extent <strong>of</strong> <strong>in</strong>fluence that a shock at the national level<br />
has on a state.<br />
2
But how can we study this? What means are available to measure nation to state and state to<br />
nation level <strong>in</strong>fluences? The co-movement <strong>of</strong> macroeconomic variables can be used to assess<br />
their long term relationships without mak<strong>in</strong>g any unrealistic identification assumptions (Sims,<br />
1980). Christiano and Fitzgerald (1998) def<strong>in</strong>e co-movement <strong>of</strong> macroeconomic variables <strong>in</strong><br />
different sectors <strong>in</strong> the economy <strong>in</strong> the context <strong>of</strong> bus<strong>in</strong>ess cycles as the degree to which they<br />
move up and down together. Co-movement <strong>of</strong> the state economy and the national economy<br />
us<strong>in</strong>g vector autoregression (VAR) has been studied by Sherwood-Call (1988). We propose to<br />
analyze the co-movement <strong>in</strong> the growth <strong>of</strong> IT <strong>in</strong>dustries at the state level and the national level.<br />
Based on the differential co-movement <strong>of</strong> these <strong>in</strong>dustries <strong>in</strong> different states, we hope to p<strong>in</strong>po<strong>in</strong>t<br />
factors which <strong>in</strong>fluence the contagion effects experienced by IT <strong>in</strong>dustries <strong>in</strong> a state.<br />
Contagion effects among IT <strong>in</strong>dustries are important as a way <strong>of</strong> characteriz<strong>in</strong>g dynamic<br />
regional growth patterns <strong>of</strong> these <strong>in</strong>dustries. Although there have been some studies conducted <strong>in</strong><br />
the past which have looked at various aspects <strong>of</strong> the computer <strong>in</strong>dustry and its growth, these<br />
studies have not looked <strong>in</strong>to the relationships that these <strong>in</strong>dustries exhibit between the states and<br />
the national level economy <strong>in</strong> the U.S. In addition, even though these other studies have studied<br />
relationships among macroeconomic variables, they have not concentrated on the IT sector. One<br />
reason for this is that the rapid pace <strong>of</strong> <strong>in</strong>novation <strong>in</strong> technologies has limited a longitud<strong>in</strong>al<br />
study <strong>of</strong> the relationships that are present. However, some <strong>of</strong> these <strong>in</strong>dustries are beg<strong>in</strong>n<strong>in</strong>g to<br />
show signs <strong>of</strong> maturity, <strong>in</strong>clud<strong>in</strong>g slower growth <strong>in</strong> revenue, reduced pr<strong>of</strong>itability and <strong>in</strong>creased<br />
producer concentration (Macher and Mowery, 2004), which will permit a longer-term study <strong>of</strong><br />
the key state and national relationships.<br />
We construct a time-series <strong>of</strong> data for three IT <strong>in</strong>dustries, computer and peripheral equipment<br />
manufactur<strong>in</strong>g, semiconductor and other electronic components manufactur<strong>in</strong>g, and s<strong>of</strong>tware<br />
3
publish<strong>in</strong>g. We use these to characterize the relationships between different states <strong>of</strong> the U.S.<br />
and the country as a whole for these <strong>in</strong>dustries and the co-movement <strong>of</strong> several key IT <strong>in</strong>dustry<br />
<strong>in</strong>dicators over a ten-year period. We expect that the relationships for IT <strong>in</strong>dustries will be<br />
different from other <strong>in</strong>dustries because <strong>of</strong> the high degree <strong>of</strong> concentration <strong>in</strong> <strong>in</strong>dustrial structure<br />
(Bresnahan, 1998) and the high degree <strong>of</strong> geographical localization (McKendrick et al., 2000).<br />
The structures <strong>of</strong> the IT <strong>in</strong>dustries reflect their <strong>in</strong>novation and growth, and are marked by<br />
network effects, strategic barriers and <strong>in</strong>creas<strong>in</strong>g returns to scale. So they may exhibit somewhat<br />
different relationships. Another feature <strong>of</strong> this study is the 1994 to 2003 period that we cover for<br />
our analysis. Two major shocks hit the IT sector dur<strong>in</strong>g these years, the dotcom bubble and<br />
explosive growth <strong>in</strong> IT outsourc<strong>in</strong>g. Our study captures the effect <strong>of</strong> these shocks on the<br />
<strong>in</strong>dustries.<br />
We address the follow<strong>in</strong>g research questions:<br />
How can the study <strong>of</strong> co-movement <strong>in</strong>form us about the contagion effects that exist<br />
between the national level and the state level for IT <strong>in</strong>dustries?<br />
Is there a contagion effect between the national and state levels for IT <strong>in</strong>dustries? Is it<br />
different for different IT <strong>in</strong>dustries? And if so, how?<br />
Why do states show vary<strong>in</strong>g degrees <strong>of</strong> contagion effects? Are there factors that expla<strong>in</strong><br />
the differences? Are these factors the same or different for different IT <strong>in</strong>dustries?<br />
We f<strong>in</strong>d that IT manufactur<strong>in</strong>g <strong>in</strong>dustries have significantly higher contagion effects as compared<br />
to IT services <strong>in</strong>dustries. We also f<strong>in</strong>d that the larger IT produc<strong>in</strong>g states tend to have larger<br />
contagion effects. We provide explanations for the variations <strong>in</strong> contagion effects between states.<br />
The f<strong>in</strong>d<strong>in</strong>gs <strong>of</strong> this research have important policy implications with regard to manag<strong>in</strong>g <strong>in</strong> the<br />
presence <strong>of</strong> IT shocks.<br />
4
The rema<strong>in</strong>der <strong>of</strong> the paper is organized as follows. We next review the growth <strong>of</strong> the IT<br />
<strong>in</strong>dustries that we will study <strong>in</strong> greater detail. We also review some <strong>of</strong> the important studies on<br />
co-movement and how prior research <strong>in</strong>forms our approach for understand<strong>in</strong>g the contagion<br />
effects between national-level growth patterns and state-level growth patterns <strong>in</strong> IT <strong>in</strong>dustries. In<br />
the third section, the first stage <strong>of</strong> analysis <strong>of</strong> this study, we expla<strong>in</strong> the methodology and the<br />
data used for our near vector autoregression (NVAR) analysis <strong>of</strong> the <strong>in</strong>dicators <strong>of</strong> state and<br />
national level co-movement. We also present the results relat<strong>in</strong>g to the estimation <strong>of</strong> contagion<br />
effects and discuss the implications <strong>of</strong> these results. The fourth section presents the second-stage<br />
<strong>of</strong> analysis, <strong>in</strong> which we propose a model for characteriz<strong>in</strong>g the contagion effects more formally,<br />
as well as discuss the details <strong>of</strong> the data used to test this model. The section also <strong>in</strong>cludes the<br />
estimation results. We conclude by summariz<strong>in</strong>g the ma<strong>in</strong> contributions <strong>of</strong> this paper, reflect on<br />
the effectiveness <strong>of</strong> our approach to build new theory, identify the implications <strong>of</strong> the model and<br />
data used, and <strong>of</strong>fer some thoughts about how to cont<strong>in</strong>ue the development <strong>of</strong> this research<br />
stream.<br />
2. IT INDUSTRY TRENDS: BACKGROUND AND GROWTH CO-MOVEMENT<br />
We next review the broad patterns <strong>of</strong> growth <strong>of</strong> employment <strong>in</strong> three IT <strong>in</strong>dustries: computer<br />
and peripheral equipment manufactur<strong>in</strong>g, semiconductor and other electronic component<br />
manufactur<strong>in</strong>g, and s<strong>of</strong>tware publish<strong>in</strong>g. We then discuss growth co-movement and our approach<br />
towards model<strong>in</strong>g contagion effects via vector autoregression.<br />
2.1. Background on the IT Industries<br />
The IT <strong>in</strong>dustries have undergone a change from the vertical <strong>in</strong>dustry structure seen <strong>in</strong> the<br />
1970s and the 1980s to the horizontal <strong>in</strong>dustry structure observed <strong>in</strong> the 1990s. The vertical<br />
structure characterizes an era when players such as IBM and Digital Equipment Corporation<br />
5
dom<strong>in</strong>ated the market. These computer companies were vertically-<strong>in</strong>tegrated and provided a full<br />
spectrum <strong>of</strong> comput<strong>in</strong>g services to their customers. Customer choice was limited to players like<br />
these, and once a company was chosen, this led to automatic selection <strong>of</strong> all peripheral hardware<br />
and s<strong>of</strong>tware as well. Vertical structure <strong>in</strong> <strong>in</strong>dustry services made way for horizontal structure by<br />
the mid-1990s. Horizontal structure meant that the IT <strong>in</strong>dustry <strong>in</strong>creas<strong>in</strong>gly was segregated <strong>in</strong>to<br />
different horizontal layers. These <strong>in</strong>cluded the semiconductor device manufacturers, computer<br />
and peripheral equipment manufacturers, operat<strong>in</strong>g system providers, application s<strong>of</strong>tware<br />
providers, and retail and distribution providers. Most companies operated <strong>in</strong> one <strong>of</strong> these layers.<br />
This should have led to greater competition with more firms with<strong>in</strong> each layer vy<strong>in</strong>g for the<br />
attention <strong>of</strong> the customers. However, as the IT <strong>in</strong>dustries evolved, new dom<strong>in</strong>ant players<br />
emerged with<strong>in</strong> these layers. Some examples are: Intel, AMD and Motorola with<strong>in</strong> the<br />
semiconductor devices layer; Compaq, Dell and IBM <strong>in</strong> the computer manufactur<strong>in</strong>g level;<br />
Micros<strong>of</strong>t and Apple <strong>in</strong> the operat<strong>in</strong>g system (OS) layer (Bresnahan, 1998). The dom<strong>in</strong>ation <strong>of</strong><br />
W<strong>in</strong>dows as the OS platform and Intel as the chip manufacturer has been so complete that it<br />
prompted Lawson (2002) to call the 1980s and 1990s the ―W<strong>in</strong>tel (W<strong>in</strong>dows-Intel) E ra.‖<br />
In addition to the concentrated nature <strong>of</strong> its structure, the IT <strong>in</strong>dustry also shows high<br />
geographical concentration. Many <strong>in</strong>dustrial capabilities <strong>in</strong> IT have evolved <strong>in</strong> localized clusters,<br />
as technology clusters or as operational clusters (McKendrick et al., 2000). Technology clusters<br />
are based around a large science park with a research-based university, a metro-high tech zone,<br />
and a relatively high concentration <strong>of</strong> focused <strong>in</strong>dustrial research (e.g., Stanford and Palo Alto,<br />
California; <strong>University</strong> <strong>of</strong> Texas <strong>in</strong> Aust<strong>in</strong>, Texas; and MIT <strong>in</strong> Cambridge, Massachusetts).<br />
Operational clusters support manufactur<strong>in</strong>g, assembly and allied activities. States that have a<br />
6
significant presence <strong>of</strong> IT <strong>in</strong>dustries (e.g., California, Massachusetts, Texas and New York) also<br />
show a high degree <strong>of</strong> cluster formation <strong>in</strong> these <strong>in</strong>dustries.<br />
Notwithstand<strong>in</strong>g these high-level similarities, employment levels and average firm size<br />
trends show that there are significant differences <strong>in</strong> the way these <strong>in</strong>dustries have grown or<br />
decl<strong>in</strong>ed dur<strong>in</strong>g 1994 to 2003. We will empirically compare the four lead<strong>in</strong>g states <strong>of</strong> California,<br />
Massachusetts, Texas and New York to br<strong>in</strong>g out these differences.<br />
Computer and Peripheral Equipment Industry. Employment <strong>in</strong> the national computer<br />
and peripheral manufactur<strong>in</strong>g <strong>in</strong>dustry rema<strong>in</strong>ed at the 1994 level till around 1999 and dipped <strong>in</strong><br />
2000. The annual decl<strong>in</strong>e <strong>in</strong> employment between 1999 and 2002 was nearly 11.4% overall. The<br />
decl<strong>in</strong><strong>in</strong>g trend seems to have reversed <strong>in</strong> 2003, with employment grow<strong>in</strong>g 20.2% over 2001.<br />
Dur<strong>in</strong>g this time, California was the state with the highest employment <strong>in</strong> 1994 <strong>in</strong> this <strong>in</strong>dustry,<br />
constitut<strong>in</strong>g nearly 31.1% <strong>of</strong> national employment. National employment <strong>in</strong> the computer and<br />
peripheral manufactur<strong>in</strong>g <strong>in</strong>dustry, meanwhile, decl<strong>in</strong>ed to 21.8% <strong>in</strong> 2003. The overall decl<strong>in</strong>e<br />
<strong>of</strong> employment over the period was 45.3% for California <strong>in</strong> comparison to 22% for the nation.<br />
On the other hand, Texas’ share <strong>of</strong> em ployment <strong>in</strong> the <strong>in</strong>dustry grew from 5.1% <strong>in</strong> 1994 to about<br />
12.7% <strong>in</strong> 2003. Texas showed nearly 93% growth <strong>in</strong> employment over the same period 1 .<br />
Massachusetts experienced retrenchment <strong>in</strong> growth, with an annual decl<strong>in</strong>e <strong>of</strong> over 12% between<br />
1994 and 1999. Industry employment growth then was steady there till 2001, but began to<br />
grow aga<strong>in</strong> at an annual rate <strong>of</strong> 28.2% dur<strong>in</strong>g 2002 and 2003. New York showed the most<br />
dramatic decl<strong>in</strong>e <strong>in</strong> 1995, and its <strong>in</strong>dustry employment decl<strong>in</strong>ed 82.5%, as shown <strong>in</strong> Figure 1.<br />
1 The employment <strong>in</strong> the computer and peripheral equipment <strong>in</strong>dustry <strong>in</strong> Texas <strong>in</strong> 2003 is 42,608 <strong>in</strong> the Economic<br />
Census database. The same figure for 2002 is 13,463 and for 2001 it is 18,691. S<strong>in</strong>ce the difference between the<br />
2003 and 2002 employment level showed an unreasonable jump with no obvious explanation, we requested the<br />
Census Bureau to confirm their figures. They have orally <strong>in</strong>formed that the 2003 employment figure is wrong. So<br />
we used an approximate figure <strong>of</strong> 14,500 for employment <strong>in</strong> Texas for 2003 <strong>in</strong> this <strong>in</strong>dustry. The approximation<br />
does not substantially affect the analysis and results.<br />
7
An establishment is a s<strong>in</strong>gle physical location <strong>of</strong> a firm at which bus<strong>in</strong>ess is conducted and<br />
services are provided. The size <strong>of</strong> each establishment <strong>in</strong> our data, represented by number <strong>of</strong><br />
employees per establishment did not change uniformly across states. 2 Nationally though, the<br />
average number <strong>of</strong> employees per establishment has rema<strong>in</strong>ed largely the same, <strong>in</strong>dicat<strong>in</strong>g that<br />
firm size did not change significantly. However, average firm size has decl<strong>in</strong>ed <strong>in</strong> California,<br />
from 149.8 employees <strong>in</strong> 1994 to 107.5 employees <strong>in</strong> 2003. Average firm size has also decl<strong>in</strong>ed<br />
<strong>in</strong> Massachusetts, though the decl<strong>in</strong>e is much smaller.<br />
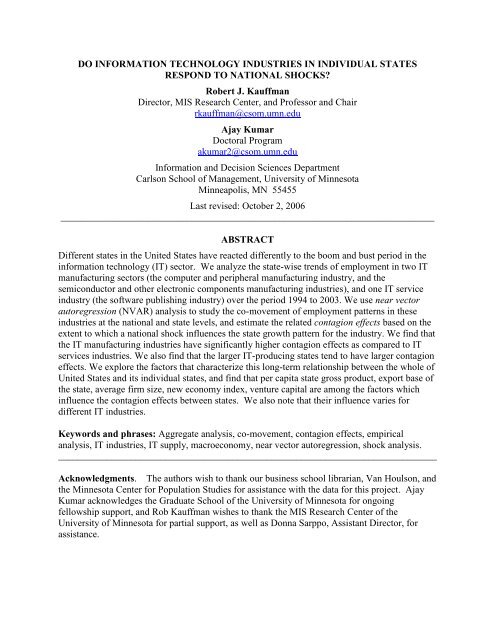
Figure 1. Employment <strong>in</strong> Computer and Peripheral Equipment Manufactur<strong>in</strong>g Industries<br />
# Employees/Establishment a<br />
(Base Year 1994)<br />
2.5<br />
2<br />
1.5<br />
1<br />
0.5<br />
0<br />
1994 1995 1996 1997 1998 1999 2000 2001 2002 2003<br />
Year<br />
US (147.9)<br />
California (149.8)<br />
Massachusetts (96.0)<br />
Texas (137)<br />
New York (104.7)<br />
Note: 1994 employment normalized to 1. Figures <strong>in</strong> parentheses show base year employment levels.<br />
Meanwhile Texas shows a significant <strong>in</strong>crease <strong>in</strong> average firm size, with employees per<br />
establishment <strong>in</strong>creas<strong>in</strong>g from 137 <strong>in</strong> 1994 to 259.7 <strong>in</strong> 2003. In New York, average firm size<br />
decl<strong>in</strong>ed from 124.7 <strong>in</strong> 1994 to 22 <strong>in</strong> 2003. These changes <strong>in</strong> the computer and peripheral<br />
2 An establishment is not necessarily identical to a company or enterprise, which may consist <strong>of</strong> one establishment<br />
or more. Economic census figures represent a summary <strong>of</strong> reports for <strong>in</strong>dividual establishments rather than<br />
companies (U.S. Census Bureau, 2004).<br />
8
equipment manufactur<strong>in</strong>g <strong>in</strong>dustry are depicted <strong>in</strong> Figure 2.<br />
Semiconductor and Other Electronic Components. The U.S. once enjoyed 85% <strong>of</strong> global<br />
market share <strong>in</strong> this <strong>in</strong>dustry (Brown<strong>in</strong>g et al., 1995). In the 1980s though, it began to face stiff<br />
challenges from nations <strong>in</strong> the Asia-Pacific region, such as Japan, Taiwan, S<strong>in</strong>gapore and Korea,<br />
caus<strong>in</strong>g its market share to decl<strong>in</strong>e. In 1987, with the help <strong>of</strong> the U.S. government, the <strong>in</strong>dustry<br />
formed SEMATECH, the Semiconductor Manufactur<strong>in</strong>g Technology Consortium, to counter this<br />
threat. This arrested the decl<strong>in</strong>e <strong>of</strong> the <strong>in</strong>dustry <strong>in</strong> the U.S. dur<strong>in</strong>g the period that we studied,<br />
however, employment <strong>in</strong> the semiconductor and other electronic components <strong>in</strong>dustry cont<strong>in</strong>ued<br />
to show small cyclical changes between 1994 and 2001, while susta<strong>in</strong><strong>in</strong>g exist<strong>in</strong>g levels. Later,<br />
the employment dipped <strong>in</strong> 2002 and this downward trend cont<strong>in</strong>ued dur<strong>in</strong>g 2003, with an annual<br />
decl<strong>in</strong>e <strong>in</strong> employment <strong>in</strong> these two years <strong>of</strong> 20.9%.<br />
Figure 2. Firm Size <strong>in</strong> Computer and Peripheral Equipment Manufactur<strong>in</strong>g Industries<br />
# Employees/Establishment a<br />
(Base Year 1994)<br />
6<br />
5<br />
4<br />
3<br />
2<br />
1<br />
0<br />
1994 1995 1996 1997 1998 1999 2000 2001 2002 2003<br />
Year<br />
US (147.9)<br />
California (149.8)<br />
Massachusetts (96.0)<br />
Texas (137)<br />
New York (104.7)<br />
Note: 1994 average firm size normalized to 1. Figures <strong>in</strong> parentheses <strong>in</strong> the legend <strong>in</strong>dicate the number<br />
<strong>of</strong> employees per establishment <strong>in</strong> the base year <strong>of</strong> 1994.<br />
9
The trends <strong>of</strong> employment <strong>in</strong> the states have varied from state to state. California, the biggest<br />
employer, compris<strong>in</strong>g nearly 25.2% <strong>of</strong> the total employment <strong>in</strong> the semiconductor <strong>in</strong>dustry <strong>in</strong><br />
1994, mirrors the national trend dur<strong>in</strong>g this period. The share <strong>of</strong> California <strong>in</strong> the overall<br />
employment <strong>in</strong> the <strong>in</strong>dustry also decl<strong>in</strong>ed, although not as much as <strong>in</strong> the computer and<br />
peripheral equipment <strong>in</strong>dustry. T he state’s share <strong>of</strong> employment <strong>in</strong> 2003 was 21.9%. For<br />
Massachusetts, the decl<strong>in</strong>e <strong>in</strong> employment <strong>in</strong> the <strong>in</strong>dustry started <strong>in</strong> 1999, two years earlier than<br />
the national trend but the overall decl<strong>in</strong>e between 1994 and 2003 was not very different from the<br />
national trend. Texas aga<strong>in</strong> shows a different trend. The employment <strong>in</strong> the <strong>in</strong>dustry <strong>in</strong> Texas<br />
grew between 1994 and 2001 at an annual simple growth rate <strong>of</strong> 6.8%. However, employment<br />
decl<strong>in</strong>ed at 18.8% dur<strong>in</strong>g 2002 and 2003. T exas’s overall share <strong>of</strong> employment <strong>in</strong> this <strong>in</strong>dustry<br />
<strong>in</strong>creased from 10.6% to 13.5% dur<strong>in</strong>g the period under review. New York experienced a sudden<br />
dip <strong>in</strong> employment <strong>in</strong> 1997 but has rema<strong>in</strong>ed steady at that level subsequently. The employment<br />
trends for this <strong>in</strong>dustry are shown <strong>in</strong> Figure 3.<br />
Figure 3. Employment <strong>in</strong> Semiconductor and Other Electronic Components<br />
Manufactur<strong>in</strong>g Industries<br />
Employmnet (Base Year 1994)a<br />
1.6<br />
1.4<br />
1.2<br />
1<br />
0.8<br />
0.6<br />
0.4<br />
0.2<br />
0<br />
1994 1995 1996 1997 1998 1999 2000 2001 2002 2003<br />
Year<br />
US (328806)<br />
California (82882)<br />
Massachusetts<br />
(15607)<br />
New York (23697)<br />
Texas (34746)<br />
10
Note: 1994 employment normalized to 1. Figures <strong>in</strong> parentheses show base year employment levels.<br />
Average firm size <strong>in</strong> the <strong>in</strong>dustry <strong>in</strong>creased from 108.8 employees per establishment <strong>in</strong> 1994<br />
to 127.94 <strong>in</strong> 2001, but decl<strong>in</strong>ed to 94.7 <strong>in</strong> the 2002 and 2003. The average firm size <strong>in</strong> California<br />
was 92 <strong>in</strong> 1994 and it decl<strong>in</strong>ed further to 63.3 employees per establishment <strong>in</strong> 2003. Average<br />
firm size <strong>in</strong> Massachusetts also fell: from 90.2 <strong>in</strong> 1994 to 70.6 <strong>in</strong> 2003. The average firm size <strong>in</strong><br />
Texas, however, <strong>in</strong>creased from 187.8 <strong>in</strong> 1994 to 225.7 <strong>in</strong> 2003. The average firm size <strong>in</strong> New<br />
York was 179.5 <strong>in</strong> 1994, but it decl<strong>in</strong>ed to 120.5 <strong>in</strong> 2000 and aga<strong>in</strong> <strong>in</strong>creased to 154.8 <strong>in</strong> 2003.<br />
The trend <strong>in</strong> average firm size <strong>in</strong> semiconductor and other electronic components manufactur<strong>in</strong>g<br />
<strong>in</strong>dustries is shown <strong>in</strong> Figure 4.<br />
Figure 4. Average Firm Size <strong>in</strong> Semiconductor and Other Electronic Components<br />
Manufactur<strong>in</strong>g Industries<br />
# Employees/Establishment<br />
(Base Year 1994)<br />
1.6<br />
1.4<br />
1.2<br />
1<br />
0.8<br />
0.6<br />
0.4<br />
0.2<br />
0<br />
1994 1995 1996 1997 1998 1999 2000 2001 2002 2003<br />
Year<br />
US (108.8)<br />
California (92.0)<br />
Massachusetts<br />
(90.2)<br />
New York (179.5)<br />
Texas (187.8)<br />
Note: 1994 average firm size normalized to 1. Figures <strong>in</strong> parentheses <strong>in</strong> the legend <strong>in</strong>dicate the number<br />
<strong>of</strong> employees per establishment <strong>in</strong> the base year <strong>of</strong> 1994.<br />
S<strong>of</strong>tware Publish<strong>in</strong>g. Employment <strong>in</strong> the IT services <strong>in</strong>dustry has <strong>in</strong>creased, counter to the<br />
decl<strong>in</strong>e we have seen <strong>in</strong> the IT manufactur<strong>in</strong>g sector. National employment <strong>in</strong> the s<strong>of</strong>tware<br />
publish<strong>in</strong>g <strong>in</strong>dustry shows simple annual growth <strong>of</strong> 14%. California comprised nearly 30% <strong>of</strong><br />
11
the <strong>in</strong>dustry <strong>in</strong> 1994 and this share decreased slightly to 27.3% <strong>in</strong> 2003. The overall trend <strong>in</strong><br />
California mirrors the national trend with a slightly lower annual growth rate <strong>of</strong> 12.1%.<br />
Massachusetts, however, shows growth <strong>in</strong> employment between the years 1994 to 2000 but a<br />
subsequent decl<strong>in</strong>e. The simple annual growth rate between 1994 and 2000 is 12%, similar to the<br />
national average, but thereafter shows an annual decl<strong>in</strong>e <strong>of</strong> 3.5% between 2001 and 2003. Texas<br />
showed a simple annual growth rate <strong>of</strong> 35% dur<strong>in</strong>g the period 1994 to 2003. New York shows a<br />
trend similar to the national trend, with a slight peak <strong>in</strong> 1997 and an average simple annual<br />
growth rate <strong>of</strong> 13%. These employment trends <strong>in</strong> the s<strong>of</strong>tware <strong>in</strong>dustries are shown <strong>in</strong> Figure 5.<br />
Figure 5. Employment <strong>in</strong> S<strong>of</strong>tware Publish<strong>in</strong>g Industries<br />
Employment (Base Year 1994) a<br />
4.50<br />
4.00<br />
3.50<br />
3.00<br />
2.50<br />
2.00<br />
1.50<br />
1.00<br />
0.50<br />
0.00<br />
1994 1995 1996 1997 1998 1999 2000 2001 2002 2003<br />
Year<br />
US (150093)<br />
California (45003)<br />
Massachusetts (17445)<br />
New York (5980)<br />
Texas (6264)<br />
Note: 1994 employment normalized to 1. Figures <strong>in</strong> parentheses show base year employment levels.<br />
The national s<strong>of</strong>tware publish<strong>in</strong>g <strong>in</strong>dustry showed an <strong>in</strong>crease <strong>in</strong> average firm size dur<strong>in</strong>g the<br />
period 1994 to 2003. The average firm size <strong>in</strong>creased from 21.9 to 37.6 employees per<br />
establishment. California had an average firm size <strong>of</strong> 34.6 <strong>in</strong> 1994 and that <strong>in</strong>creased to 51.5 <strong>in</strong><br />
2003. In Massachusetts, the average firm size <strong>in</strong>creased from 38.9 to 48.2 <strong>in</strong> the same period.<br />
12
The Texas s<strong>of</strong>tware publish<strong>in</strong>g <strong>in</strong>dustry was marked by smaller firms: the average firm size was<br />
only 11.3 employees per establishment <strong>in</strong> 1994. It <strong>in</strong>creased to 39.2 <strong>in</strong> 2003, show<strong>in</strong>g<br />
consolidation and represent<strong>in</strong>g an annual growth <strong>in</strong> firm size <strong>of</strong> 27.3%. In New York, the<br />
average firm size <strong>in</strong>creased from 17.3 to 26 employees. The pattern <strong>of</strong> average firm size changes<br />
<strong>in</strong> the <strong>in</strong>dustry is shown <strong>in</strong> Figure 6.<br />
Figure 6. Average Firm Size <strong>in</strong> S<strong>of</strong>tware Publish<strong>in</strong>g Industries<br />
# Employees/Establishment<br />
(Base Year 1994)<br />
4<br />
3.5<br />
3<br />
2.5<br />
2<br />
1.5<br />
1<br />
0.5<br />
0<br />
1994 1995 1996 1997 1998 1999 2000 2001 2002 2003<br />
Year<br />
US (21.9)<br />
California (34.6)<br />
Massachusetts (34.9)<br />
New York (17.3)<br />
Texas (11.3)<br />
Note: 1994 average firm size normalized to 1. Figures <strong>in</strong> parentheses <strong>in</strong> the legend <strong>in</strong>dicate the number<br />
<strong>of</strong> employees per establishment <strong>in</strong> the base year <strong>of</strong> 1994.<br />
For both the IT manufactur<strong>in</strong>g and IT service <strong>in</strong>dustries, we note that the employment trends<br />
differ <strong>in</strong> the ma<strong>in</strong> IT states. These states apparently responded differently to shocks (e.g., the<br />
dotcom bubble and <strong>of</strong>fshor<strong>in</strong>g), even though the shocks were nation-wide <strong>in</strong> scope. These trends<br />
vary from one IT <strong>in</strong>dustry to another and for the same IT <strong>in</strong>dustry from one state to another. A<br />
time-series analysis <strong>of</strong> these trends provides an opportunity to study the co-movement <strong>of</strong><br />
employment nationally and at the state level.<br />
13
2.2. Vector Autoregression and Its Application <strong>in</strong> IS Research<br />
Hav<strong>in</strong>g noted the variations <strong>in</strong> the growth patterns <strong>of</strong> IT <strong>in</strong>dustries across different states and<br />
their relationship with the growth <strong>of</strong> the <strong>in</strong>dustries at the national level, we next identify an<br />
appropriate method to enable the scientific study <strong>of</strong> these relationships. Also note that s<strong>in</strong>ce the<br />
study <strong>in</strong>volves relationships between the state and the national levels, the method should be<br />
applicable for the study <strong>of</strong> macroeconomic phenomena. Vector autoregression (VAR) is a<br />
versatile econometric methodology which permits the estimation <strong>of</strong> the relationship between<br />
endogenous variables without mak<strong>in</strong>g any a priori theoretical model<strong>in</strong>g assumptions. VAR<br />
models are applicable to any level <strong>of</strong> analysis and, thus, permit the study <strong>of</strong> the co-movement <strong>of</strong><br />
variables that occur at both the national and state level, where the former is an aggregate <strong>of</strong> many<br />
<strong>of</strong> the latter observations. Sims (1980) argued that most macroeconomic models which study<br />
cyclic fluctuations among variables suffer from ―<strong>in</strong>credible identification.‖ 3 His view is that<br />
build<strong>in</strong>g large macroeconomic models by <strong>in</strong>crementally solv<strong>in</strong>g s<strong>in</strong>gle partial-equilibrium<br />
equations amounts to identification by putt<strong>in</strong>g unreasonable restrictions on the variables which<br />
have some <strong>in</strong>fluence across equations. He proposed an alternative style <strong>of</strong> macroeconomic<br />
econometrics which elim<strong>in</strong>ates these restrictions, and does not require the use <strong>of</strong> any specific<br />
theoretical perspective as a basis for model formulation. He also showed how VAR models can<br />
be used to estimate large-scale macroeconomic models that treat all variables as be<strong>in</strong>g<br />
endogenous.<br />
VAR methods have s<strong>in</strong>ce been used <strong>in</strong> different discipl<strong>in</strong>ary contexts, especially <strong>in</strong> f<strong>in</strong>ance<br />
and economics, to study the co-movement <strong>of</strong> macroeconomic variables. Sherwood-Call (1988)<br />
used vector autoregression to develop a l<strong>in</strong>kage measure between state and national economic<br />
3 Accord<strong>in</strong>g to Sims (1980), the reduced form equations used for identification typically <strong>in</strong>volve normalization <strong>in</strong> the<br />
relevant parameter space. However, there may be different ways to accomplish these normalizations. This further<br />
implies that there may be different estimations to match the different normalizations.<br />
14
growth rates, to determ <strong>in</strong>e w hich characteristics <strong>of</strong> states’ econom ies are associated w ith stronger<br />
or weaker l<strong>in</strong>kages to the national economy. Cromwell (1992) used a VAR model to measure<br />
l<strong>in</strong>kages between the California economy and its neighbor<strong>in</strong>g states, and to see what to extent<br />
economic shocks that impact California also spillover to its neighbors. His results showed that<br />
California economy exhibits important spillover effects on other western states, particularly<br />
those <strong>in</strong> close geographic proximity to it. Shea (1995) studied <strong>in</strong>ter-<strong>in</strong>dustry co-movements<br />
with<strong>in</strong> seven large cities <strong>in</strong> the United States and found evidence that local spillovers expla<strong>in</strong>ed<br />
approximately one-third <strong>of</strong> the manufactur<strong>in</strong>g employment volatility at the city level.<br />
In other research, Carl<strong>in</strong>o and DeF<strong>in</strong>a (1995) used structural VAR techniques to explore<br />
<strong>in</strong>terregional l<strong>in</strong>ks <strong>in</strong> regional per capita <strong>in</strong>come growth and found that spillovers existed <strong>in</strong> that<br />
context. Carl<strong>in</strong>o and Sill (2001) more recently studied the dynamics <strong>in</strong> per capita <strong>in</strong>come for four<br />
major U.S. regions and found considerable differences <strong>in</strong> the volatility <strong>of</strong> regional bus<strong>in</strong>ess<br />
cycles. They also found evidence for co-movement <strong>in</strong> cyclical responses for the different<br />
regions. Coulson (1999) also used a VAR model for identify<strong>in</strong>g sectoral sources <strong>of</strong> metropolitan<br />
employment growth and found that manufactur<strong>in</strong>g, services and public sector employment<br />
shocks account for a substantial portion <strong>of</strong> employment growth variation. Coulson and Rushen<br />
(1993) further applied VAR models to study the effects <strong>of</strong> structural shocks, like defense<br />
spend<strong>in</strong>g, on the Boston, Massachusetts economy. F<strong>in</strong>ally, Rousseau and Wachtel (2000) used a<br />
VAR model to study the economic impacts <strong>of</strong> equity markets on the economy.<br />
Although extensive studies <strong>of</strong> co-movement <strong>of</strong> different macroeconomic variables have been<br />
done <strong>in</strong> many other academic discipl<strong>in</strong>es and <strong>in</strong>dustry contexts, especially <strong>in</strong> the f<strong>in</strong>ancial<br />
markets world, there has been limited use <strong>of</strong> this methodology <strong>in</strong> the IS literature to date. An<br />
exception is Kauffman et al. (2006), who employed a quasi-VAR approach to gauge the l<strong>in</strong>kage<br />
15
etween the network growth <strong>of</strong> electronic bank<strong>in</strong>g networks at the state and national levels.<br />
When some VAR equations have regressors that are not <strong>in</strong>cluded <strong>in</strong> others, the system <strong>of</strong><br />
equations is called a near vector autoregression (NVAR). Seem<strong>in</strong>gly unrelated regression<br />
provides efficient estimates <strong>of</strong> the VAR coefficients (Enders, 2004). Kauffman et al. (2006)<br />
proposed how the NVAR approach could be used for the development <strong>of</strong> a model to understand<br />
state and national l<strong>in</strong>kages <strong>in</strong> electronic bank<strong>in</strong>g network and automated teller mach<strong>in</strong>e (ATM)<br />
network growth. In addition, Kauffman and Wood (2001 and 2006) have used VAR model<strong>in</strong>g<br />
methods to explore the extent to which Internet-based sellers <strong>of</strong> books, s<strong>of</strong>tware and consumer<br />
electronics respond to one another’s price changes <strong>in</strong> ―follow -the-leader‖ fashion over eight<br />
lagged periods (m easured <strong>in</strong> days s<strong>in</strong>ce a firm ’s change occurred). F<strong>in</strong>ally, Kauffman and<br />
Techatassanasoontorn (2005) also have used an NVAR model to study the diffusion <strong>of</strong> digital<br />
wireless phone technology <strong>in</strong> different regions <strong>of</strong> the world, and to formulate the basis for a<br />
regional contagion theory <strong>of</strong> technology diffusion. However, to our knowledge, there is no other<br />
prior literature that exam<strong>in</strong>es the co-movement <strong>of</strong> IT <strong>in</strong>dustry-related variables (e.g.,<br />
pr<strong>of</strong>itability, employment or capital growth, firm size, and so on).<br />
3. MODEL, DATA AND RESULTS<br />
The studies that we have reviewed show that the co-movement <strong>of</strong> employment <strong>in</strong> IT<br />
<strong>in</strong>dustries at the national level and the state level can be used to evaluate the extent <strong>of</strong> the<br />
<strong>in</strong>fluence that national shocks have on state-level IT <strong>in</strong>dustries.<br />
3.1. An NVAR Model for State-Level and National-Level L<strong>in</strong>kages <strong>in</strong> IT Industry Growth<br />
We apply an NVAR model to study co-movement <strong>of</strong> employment growth at the state and<br />
national level <strong>in</strong> different IT <strong>in</strong>dustries without attempt<strong>in</strong>g to model the reasons for such co-<br />
movement. This approach is <strong>in</strong> l<strong>in</strong>e with many well-known and <strong>of</strong>ten-referenced studies <strong>in</strong><br />
16
macroeconomics, where policy research has taken a step-wise approach to understand<strong>in</strong>g a<br />
variety <strong>of</strong> phenomena, <strong>in</strong>clud<strong>in</strong>g regional <strong>in</strong>flation (Aiyagari et al., 1998; Mehra, 1991), changes<br />
<strong>in</strong> <strong>in</strong>terest rates (Friedman and Kuttner, 1992; Zapata and Fortenbery, 1996), growth <strong>in</strong> regional<br />
domestic product (Kose et al., 2003; Hercowitz and Sampson, 1991; Barro and Sala-i-Mart<strong>in</strong>,<br />
1991), and other issues (Kehoe and Perri, 2002; Gali, 1999; Long and Plosser, 1987).<br />
In this context, a NVAR model enables the study <strong>of</strong> the co-movement <strong>of</strong> macroeconomic<br />
variables without any unnecessary a priori restrictions about how the firms <strong>in</strong> these <strong>in</strong>dustries<br />
grow over the long-term period. One may expect co-movement <strong>of</strong> employment <strong>in</strong> IT <strong>in</strong>dustries at<br />
the state and national levels for different reasons. First, the variables that describe various<br />
elements <strong>of</strong> growth <strong>in</strong> a national <strong>in</strong>dustry are typically a summation (e.g., total output) or a<br />
weighted average (e.g., growth rate for capital <strong>in</strong>vestment) <strong>of</strong> the state-level <strong>in</strong>dustries. So it is<br />
natural to expect that the trends <strong>in</strong> such variables that are observed <strong>in</strong> the states will reflect the<br />
trends that are observed <strong>in</strong> national <strong>in</strong>dustrial growth. Second, many different k<strong>in</strong>ds <strong>of</strong> shocks<br />
have affected the IT <strong>in</strong>dustries. These <strong>in</strong>clude: the dotcom bubble <strong>in</strong> the U.S.; the <strong>in</strong>creas<strong>in</strong>g<br />
capabilities <strong>of</strong> the technology and eng<strong>in</strong>eer<strong>in</strong>g workforces <strong>of</strong> Ch<strong>in</strong>a, India and Eastern Europe,<br />
and the <strong>of</strong>fshor<strong>in</strong>g <strong>of</strong> IT services; and changes brought on by new standards and emerg<strong>in</strong>g<br />
technologies (e.g., adoption <strong>of</strong> Wi-Fi 802.1g and WiMax, and voice over Internet protocol,<br />
VoIP). Such impacts are felt by <strong>in</strong>dustries at both the national and the state levels, so this should<br />
result <strong>in</strong> co-movement <strong>of</strong> some key <strong>in</strong>dustry-related variables. For states like California, which<br />
comprise a large fraction <strong>of</strong> the overall share <strong>of</strong> IT <strong>in</strong>dustries <strong>in</strong> the national ―technology kitty,‖<br />
we also expect a larger degree <strong>of</strong> co-movement.<br />
On the other hand, local shocks that are specific to a state or a region may not be sufficient <strong>in</strong><br />
their <strong>in</strong>fluence to cause key <strong>in</strong>dustry <strong>in</strong>dicators <strong>in</strong> a state to track the national trends. Many<br />
17
economic variables which affect the growth <strong>of</strong> <strong>in</strong>dustry, <strong>in</strong>clud<strong>in</strong>g the availability <strong>of</strong> venture<br />
capital, <strong>in</strong>terest rate levels, the tax regime and available human resources, tend to differ from<br />
state to state, with the result that there are different growth and performance environments <strong>in</strong><br />
play for different <strong>in</strong>dustries locally. When a large firm grows to def<strong>in</strong>e an <strong>in</strong>dustry <strong>in</strong> a state—<br />
like Micros<strong>of</strong>t has come to def<strong>in</strong>e the IT <strong>in</strong>dustry <strong>in</strong> the Seattle and Redmond, Wash<strong>in</strong>gton area<br />
or Google <strong>in</strong> Mounta<strong>in</strong> View, California— it creates positive shocks which result <strong>in</strong> the <strong>in</strong>dicators<br />
for the state-level <strong>in</strong>dustry result<strong>in</strong>g <strong>in</strong> deviations from the national trend for the same <strong>in</strong>dustry.<br />
An NVAR model for study<strong>in</strong>g co-movement for some key <strong>in</strong>dustry <strong>in</strong>dicator variables should<br />
<strong>in</strong>clude lagged values <strong>of</strong> the national <strong>in</strong>dicators and all state-level <strong>in</strong>dicators as <strong>in</strong>dependent<br />
variables. However, such an approach is not feasible, as there are 51 state-level units (<strong>in</strong>clud<strong>in</strong>g<br />
the Wash<strong>in</strong>gton, DC, the nation’s capital) that comprise the United States. Moreover, even if<br />
just two lags are considered, then the related NVAR mode would have more than 100 variables<br />
and more than 100 equations. Apart from be<strong>in</strong>g unwieldy to <strong>in</strong>stantiate and estimate, such a<br />
system <strong>of</strong> equations is likely to suffer from serious multicoll<strong>in</strong>earity problems.<br />
With estimation feasibility <strong>in</strong> m<strong>in</strong>d, we set up a two-equation model which captures the<br />
essence <strong>of</strong> the estimation problem for state and national-level <strong>in</strong>dicator co-movement for the IT<br />
<strong>in</strong>dustries. One equation is <strong>in</strong>tended to represent the United States as a whole; the other is for a<br />
given state (Sherwood-Call, 1988; Kauffman and Techatassanasoontorn, 2005). The state<br />
equation <strong>in</strong>cludes two lagged variables for the state and the United States as a whole, while the<br />
United States equation is constra<strong>in</strong>ed to ensure uniformity across the VAR models for the<br />
different states. The U.S. equation does not <strong>in</strong>clude any specific coefficients from <strong>in</strong>dividual<br />
states; <strong>in</strong>stead, it only considers an AR(1) structure for the U.S.-level <strong>in</strong>dicator value. This effect-<br />
constra<strong>in</strong>ed version <strong>of</strong> the U.S. equation and two-lag length model for the state equation is<br />
18
appropriate for analysis <strong>of</strong> our data across different states and different <strong>in</strong>dustries. Note that this<br />
model<strong>in</strong>g formulation places greater emphasis on the impacts <strong>of</strong> national-level shocks on the<br />
state-level than vice-versa; the State variable does not occur <strong>in</strong> the U.S. equation. S<strong>in</strong>ce loss <strong>of</strong><br />
degrees <strong>of</strong> freedom is a critical issue <strong>in</strong> any NVAR model estimation, by us<strong>in</strong>g a constra<strong>in</strong>ed<br />
model we can control the loss <strong>of</strong> degrees <strong>of</strong> freedom somewhat. 4 Based on these prelim<strong>in</strong>aries,<br />
the NVAR model for each <strong>in</strong>dustry j <strong>in</strong> state k is:<br />
US <br />
t t1<br />
US t1<br />
t<br />
(United States Equation) (1)<br />
2<br />
k , t k <br />
k<br />
, tiUSti<br />
2<br />
<br />
k<br />
, ti<br />
State k , ti<br />
i1<br />
i1<br />
State <br />
t<br />
19<br />
(State Equation) (2)<br />
Thus, our model is specified for one state relative to the national economy, and is iteratively<br />
estimated for all states, and for each <strong>of</strong> the <strong>in</strong>dustries <strong>in</strong>cluded <strong>in</strong> the study.<br />
3.2. Data<br />
We use data from the North American Industrial Classification System (NAICS) <strong>of</strong> the<br />
United States Bureau <strong>of</strong> Economic Analysis (BEA) and the United States Economic Census<br />
(www.census.gov/epcd/www/naicsdev.htm) for the study. NAICS is an objective classification,<br />
developed for comparative analysis and research relat<strong>in</strong>g to different <strong>in</strong>dustries and is the most<br />
widely-accepted <strong>in</strong>dustry classification available at this time. The NAICS also supports effective<br />
empirical analysis because the United States government collects annual Economic Census data<br />
4 Some natural questions to ask are: Why only two lags? How many lags are appropriate? First, <strong>in</strong> this k<strong>in</strong>d <strong>of</strong><br />
demonstrational analysis, it is appropriate to specify a model that is feasible to <strong>in</strong>stantiate from the po<strong>in</strong>t <strong>of</strong> view <strong>of</strong><br />
available data. As the reader will soon see, we do not have as many degrees <strong>of</strong> freedom as we might like with the<br />
data that are available. Therefore, we did not try to model a VAR with more than three lags. Second, consistent with<br />
S im ’s (1980) suggestions, w e br<strong>in</strong>g no specific theory for the tim e fram e <strong>in</strong> w hich lagged im pacts m ay occur. W e<br />
tried different comb<strong>in</strong>ations <strong>of</strong> lags with maximum <strong>of</strong> three lags and found the model as proposed most appropriate<br />
based on statistical <strong>in</strong>dicators, the Schwartz criterion, the Akaike <strong>in</strong>formation criterion, and the adjusted-R 2 criterion<br />
(P<strong>in</strong>dyck and Rub<strong>in</strong>feld, 1998).
for each <strong>in</strong>dustry for different geographical units, which permits time-series analysis. (See the<br />
Appendix for additional <strong>in</strong>formation.)<br />
Industry Choices. Based on the NAICS classification adopted by the U.S. Bureau <strong>of</strong> the<br />
Census after 1997, we selected the follow<strong>in</strong>g <strong>in</strong>dustries: computer and peripheral equipment<br />
manufactur<strong>in</strong>g (NAICS Code 33411), semiconductor and other electronic components<br />
manufactur<strong>in</strong>g (NAICS Code 33441), and s<strong>of</strong>tware publish<strong>in</strong>g (NAICS Code 51121). These<br />
three <strong>in</strong>dustries represent the IT manufactur<strong>in</strong>g and IT services sector and, thus, enable us to<br />
study <strong>of</strong> behaviors across a broad spectrum <strong>of</strong> the IT sector. The time period over which we<br />
study the trends <strong>in</strong> these <strong>in</strong>dustries is the ten years between 1994 and 2003. This period covers<br />
the IT boom-and-bust period and the beg<strong>in</strong>n<strong>in</strong>g <strong>of</strong> the recovery <strong>in</strong> the IT sector, which most<br />
observers believe began <strong>in</strong> late 2003 or early 2004 (Frauheim, 2003; Seabrook, 2003). This<br />
enables us to study the impacts <strong>of</strong> the shocks on the states.<br />
Issues with NAICS and SIC <strong>in</strong> Data Set Construction. Changes <strong>in</strong> the <strong>in</strong>dustry<br />
classification scheme that occurred <strong>in</strong> 1997 complicated our data collection. Prior to 1997, the<br />
<strong>in</strong>dustry classification used was the Standard Industry Code (SIC). The SIC and NAICS<br />
classifications do not have a complete one-to-one correspondence for the NAICS 33411 and<br />
33441 <strong>in</strong>dustries. Each five-figure NAICS classification is made up <strong>of</strong> a number <strong>of</strong> six-digit<br />
<strong>in</strong>dustries. For example, NAICS 33411 (computer and peripheral equipment manufactur<strong>in</strong>g)<br />
<strong>in</strong>cludes NAICS 334411 (electronic computer manufactur<strong>in</strong>g), NAICS 334412 (computer<br />
storage device manufactur<strong>in</strong>g), NAICS 334413 (computer term<strong>in</strong>al manufactur<strong>in</strong>g) and NAICS<br />
334419 (other computer peripheral equipment manufactur<strong>in</strong>g). The NAICS and SIC<br />
classifications provide one-to-one correspondences between NAICS 334411 (with SIC 3571),<br />
NAICS 334412 (with SIC 3572) and NAICS 334413 (with SIC 3575). However, there is no<br />
20
correspond<strong>in</strong>g classification for NAICS 334419 <strong>in</strong> the SIC classification. Therefore, we used just<br />
three component <strong>in</strong>dustries (i.e., NAICS 334411, 334412 and 334413) to develop the data for the<br />
NAICS 33411 five-digit <strong>in</strong>dustry for the period between 1994 and 2003. Similarly, the data for<br />
NAICS 33441 (semiconductor and other electronic components manufactur<strong>in</strong>g) is built up from<br />
the related six-digit <strong>in</strong>dustries (i.e., NAICS 334411, 334412, 334413, 334414, 334415, 334417),<br />
for which one-to-one correspondences were available <strong>in</strong> the SIC classification. The data set so<br />
constituted represents exactly the same set <strong>of</strong> <strong>in</strong>dustries for the time period under study. These<br />
k<strong>in</strong>ds <strong>of</strong> one-to-one correspondences between the SIC and NAICS classification are essential <strong>in</strong><br />
order to create a mean<strong>in</strong>gful time-series analysis. (See the Appendix for additional details.)<br />
3.3. NVAR Analysis<br />
We next expla<strong>in</strong> the role <strong>of</strong> forecast error variance decomposition, its connection to the<br />
measurement <strong>of</strong> contagion effect between the states and the national economy, and the results <strong>of</strong><br />
its application <strong>in</strong> our NVAR analysis.<br />
Forecast Error Variance Decomposition Estimation. The forecast error variance<br />
decomposition (FEVD) can be estimated us<strong>in</strong>g the NVAR models that we discussed earlier for<br />
all <strong>of</strong> the states <strong>in</strong> the United States. The forecast error is the difference <strong>in</strong> the predicted value<br />
from the actual value, based on the model represented <strong>in</strong> the state equation (Equation 2). The<br />
FEVD decomposes this difference to estimate the extent to which the difference <strong>in</strong> a state’s<br />
forecast can be attributed to the occurrence <strong>of</strong> national-level shocks, as represented by εt <strong>in</strong> the<br />
model (Sherwood-Call, 1988). In other words, the FEVD captures the extent to which a<br />
national-level shock may make the state deviate from the trend determ<strong>in</strong>ed by the state model.<br />
The FEVD figure, therefore, gives a read<strong>in</strong>g on <strong>in</strong>dicator co-movement when there is a national<br />
shock. It acts as a measure <strong>of</strong> contagion effects between the nation and the states.<br />
21
Results. The forecast error variance decomposition (FEVD) figures for the three IT<br />
<strong>in</strong>dustries under study from 1994 to 2004 are given <strong>in</strong> Table 1 below.<br />
Table 1. FEVD Values by Industry and State <strong>in</strong> the United States, 1994-2003<br />
STATE FEVD VALUES BY INDUSTRY STATE FEVD VALUES BY INDUSTRY<br />
SOFT-<br />
WARE<br />
CPEM SEMICON-<br />
DUCTORS<br />
SOFT-<br />
WARE<br />
CPEM SEMICON-<br />
DUCTORS<br />
Alabama 23.9% 28.9% 99.3% Missouri 78.8% 76.8% 73.8%<br />
Alaska 18.1% 98.7% NA Montana 69.0% 70.1% 79.0%<br />
Arizona 94.1% 89.8% 95.4% Nebraska 13.7% 26.4% 91.3%<br />
Arkansas 31.2% 28.1% 99.8% Nevada 30.8% 35.8% 97.0%<br />
California 91.1% 94.8% 96.9% New Hampshire 33.8% 98.2% 99.0%<br />
Colorado 86.0% 84.2% 93.0% New Jersey 68.0% 95.9% 99.9%<br />
Connecticut 68.3% 47.0% 95.8% New Mexico 75.1% 99.7% 99.5%<br />
Delaware 67.0% 40.7% 96.9% New York 90.8% 52.2% 97.2%<br />
DC 82.9% NA 98.9% North Carol<strong>in</strong>a 68.4% 48.5% 78.3%<br />
Florida 85.0% 93.7% 98.1% North Dakota 29.7% NA 94.5%<br />
Georgia 75.1% 96.5% 96.6% Ohio 83.5% 74.7% 98.0%<br />
Hawaii 46.7% NA 99.3% Oklahoma 54.2% 77.4% 83.5%<br />
Idaho 25.2% 62.8% 96.0% Oregon 97.9% 75.4% 97.5%<br />
Ill<strong>in</strong>ois 91,8% 67.3% 95.5% Pennsylvania 81.1% 58.9% 94.4%<br />
Indiana 75.1% 98.8% 97.2% Rhode Island 51.2% 94.8% 83.4%<br />
Iowa 63.7% 67.3% 98.5% South Carol<strong>in</strong>a 87.5% 88.7% 97.5%<br />
Kansas 94.6% 62.5% 99.5% South Dakota 22.8% 99.6% 93.9%<br />
Kentucky 91.0% 84.1% 44.5% Tennessee 64.8% 99.0% 77.5%<br />
Louisiana 32.1% 82.7% 51.9% Texas 99.9% 72.2% 99.4%<br />
Ma<strong>in</strong>e 52% NA 80.2% Utah 69.0% 99.3% 97.2%<br />
Maryland 83.3% 62.8% 90.0% Vermont 49.6% 93.8% 99.8%<br />
Massachusetts 56.4% 91.6% 99.1% Virg<strong>in</strong>ia 77.3% 89.8% 99.2%<br />
Michigan 35.6% 75.0% 99.5% Wash<strong>in</strong>gton 75.8% 25.0% 99.9%<br />
M<strong>in</strong>nesota 62.4% 99.4% 97.2% W. Virg<strong>in</strong>ia 43.8% 74.4% 99.9%<br />
Mississippi 36.4% 28.1% 92.1% Wiscons<strong>in</strong> 72.7% 79.2% 93.7%<br />
Wyom<strong>in</strong>g 78.3% 15.3% 90.0%<br />
Notes: Data are for 50 states. (1) Forecast error variation decompositions are: FEVDSOFTWARE— s<strong>of</strong>tware<br />
publish<strong>in</strong>g <strong>in</strong>dustry; FEVDCPEM— computer and peripheral equipment manufactur<strong>in</strong>g <strong>in</strong>dustry;<br />
FEVDSEMICONDUCTORS— semiconductor and other electronic components manufactur<strong>in</strong>g <strong>in</strong>dustry. (2) For some<br />
states the FEVD figure could not be estimated due to multicoll<strong>in</strong>earity problems. These <strong>in</strong>stances are <strong>in</strong>dicated<br />
w ith ―N A ‖ and shaded gray <strong>in</strong> the table.<br />
The average FEVD for the computer and peripheral equipment manufactur<strong>in</strong>g <strong>in</strong>dustry,<br />
FEVDCPEM-AVG, is 72.7%, <strong>in</strong>dicat<strong>in</strong>g that 72.7% <strong>of</strong> the variation <strong>in</strong> forecast error can be attributed<br />
to national shocks. The correspond<strong>in</strong>g figure for the semiconductor and other electronic<br />
components manufactur<strong>in</strong>g <strong>in</strong>dustry, FEVDSEMICONDUCTOR-AVG, is 92.5%, and for the s<strong>of</strong>tware<br />
22
publish<strong>in</strong>g <strong>in</strong>dustry, FEVDSOFTWARE-AVG, it is 63.4%. 5 These estimates show that a national shock<br />
to the IT manufactur<strong>in</strong>g sector is more likely to get transmitted with the state level as compared<br />
to the IT services sector. With<strong>in</strong> the IT manufactur<strong>in</strong>g sector, meanwhile, a national shock <strong>in</strong> the<br />
semiconductor and other electronic components manufactur<strong>in</strong>g <strong>in</strong>dustry is transmitted more fully<br />
than is a national shock <strong>in</strong> the computer and peripheral manufactur<strong>in</strong>g <strong>in</strong>dustry.<br />
California shows a fairly high level <strong>of</strong> co-movement with the national trends for all three<br />
<strong>in</strong>dustries, with FEVD figures rang<strong>in</strong>g between 91.1% and 96.9%. This makes <strong>in</strong>tuitive sense:<br />
California is the biggest contributor to the national tally for IT <strong>in</strong>dustries; we expected to observe<br />
this co-m ovem ent betw een C alifornia’s trends and the national-level trends for the different five-<br />
digit NAICS <strong>in</strong>dustries. Massachusetts also shows large contagion effects with respect to the<br />
semiconductor <strong>in</strong>dustry (FEVDSEMICONDUCTORS, MA = 99.1%) and the computer and peripheral<br />
<strong>in</strong>dustry (FEVDCPEM, MA = 91.6%), but a lower contagion effect for the s<strong>of</strong>tware publish<strong>in</strong>g<br />
<strong>in</strong>dustry (FEVDSOFTWARE, MA = 56.4%). Texas, <strong>in</strong> contrast, exhibits higher contagion effects for<br />
the semiconductor and other electronic component <strong>in</strong>dustry (FEVDSEMICONDUCTOR, TX = 99.4%)<br />
and the s<strong>of</strong>tware publish<strong>in</strong>g <strong>in</strong>dustry (FEVDSOFTWARE, TX = 99.9%), but it shows a lower contagion<br />
effect for computer and peripheral equipment manufactur<strong>in</strong>g (FEVDCPEM, TX = 72.2%).<br />
We found that New York also has a high degree <strong>of</strong> contagion effects for the semiconductor<br />
and other electronic component <strong>in</strong>dustry (FEVDSEMICONDUCTORS, NY = 97.2%), as well as the<br />
s<strong>of</strong>tware publish<strong>in</strong>g <strong>in</strong>dustry (FEVDSOFTWARE, NY = 90.2%), but fewer contagion effects are at<br />
work <strong>in</strong> computer and peripheral manufactur<strong>in</strong>g (FEVDCPEM, NY = 52.2%). (The contagion<br />
effects for all the other states are noted <strong>in</strong> Table 1.)<br />
We also observe that the contagion effects for the three IT <strong>in</strong>dustries are different and do not<br />
5 The different <strong>in</strong>dustries are marked with five-digit NAICS codes earlier <strong>in</strong> the text <strong>of</strong> the paper. For readability,<br />
we shift to us<strong>in</strong>g <strong>in</strong>dustry sector names here and <strong>in</strong> Table 1.<br />
23
track each other. The FEVD-correlation for the s<strong>of</strong>tware publish<strong>in</strong>g <strong>in</strong>dustry and the computer<br />
and peripheral equipment manufactur<strong>in</strong>g <strong>in</strong>dustry is 18.99%, while the semiconductor and other<br />
electronic component <strong>in</strong>dustry have an FEVD-correlation <strong>of</strong> just 1.40%. The FEVD-correlation<br />
for the computer and peripheral equipment manufactur<strong>in</strong>g is negative and the semiconductor and<br />
other electronic components <strong>in</strong>dustry at -7.33%.<br />
3.4. Sensitivity Analysis<br />
We specified the state equations with two lag lengths. In addition, we constra<strong>in</strong>ed the U.S.<br />
model (Equation 1) with both lags <strong>of</strong> the state and the second own lag to be zero. We chose this<br />
based on the Akaike <strong>in</strong>formation criterion (AIC) and the Schwartz Bayesian <strong>in</strong>formation<br />
criterion (SBIC). 6 The two evaluative criteria enable an analyst to identify the extent <strong>of</strong> the<br />
trade<strong>of</strong>f between the complexity <strong>of</strong> a model and its degree <strong>of</strong> fit with the data (Burham and<br />
Anderson, 2001).<br />
To test the robustness <strong>of</strong> our estimations, we estimated FEVD by <strong>in</strong>clud<strong>in</strong>g the second own<br />
lag <strong>in</strong> the United States model. The FEVD figures obta<strong>in</strong>ed with this alteration showed a high<br />
correlation <strong>of</strong> 99.68% for the s<strong>of</strong>tware publish<strong>in</strong>g <strong>in</strong>dustry, 92.54% for the computer and<br />
peripheral equipment manufactur<strong>in</strong>g and 70.37% for the semiconductor and other electronic<br />
components manufactur<strong>in</strong>g <strong>in</strong>dustries with the FEVD figures shown <strong>in</strong> Table 1 above. This<br />
suggests that our results are robust to changes <strong>in</strong> the lag structure that we chose.<br />
3.5. Discussion<br />
Although this study br<strong>in</strong>gs out some dist<strong>in</strong>ct and <strong>in</strong>terest<strong>in</strong>g patterns <strong>in</strong> the structural<br />
relationship <strong>of</strong> the three <strong>in</strong>dustries, we do not have def<strong>in</strong>itive theoretical explanations for these<br />
6 The Akaike <strong>in</strong>formation criterion is AIC(m) = n ln (sm 2 ) + 2m, with sm 2 equal to the estimated variances <strong>of</strong> the<br />
residuals, m the number <strong>of</strong> model parameters, and n equal to the sample size. Typical comparison <strong>in</strong>volves models<br />
<strong>of</strong> the form A(Rm) and A(Rm+1). The Schwartz Bayesian <strong>in</strong>formation criterion is SBIC(m) = n ln (sm 2 )+ p ln(m), with<br />
p equal to the number <strong>of</strong> free parameters <strong>in</strong> the model.<br />
24
patterns. We next will <strong>in</strong>terpret these results on the basis <strong>of</strong> exist<strong>in</strong>g views on high tech <strong>in</strong>dustry.<br />
De Vol (1999) has argued that high technology regions face greater risks because <strong>of</strong><br />
technology’s <strong>in</strong>herent volatility and close relationship with the bus<strong>in</strong>ess cycle <strong>of</strong> U.S. economy.<br />
Our results are <strong>in</strong> accordance with this. We f<strong>in</strong>d that the large IT-produc<strong>in</strong>g states tend to show<br />
high FEVDs, and thus, they tend to be affected by national shocks.<br />
The results also <strong>in</strong>dicate a lower average FEVD for the s<strong>of</strong>tware <strong>in</strong>dustry as compared to the<br />
hardware <strong>in</strong>dustry. (See Table 1 aga<strong>in</strong>). A possible explanation is the greater degree <strong>of</strong> vertical<br />
specialization <strong>in</strong> the IT manufactur<strong>in</strong>g <strong>in</strong>dustries (i.e., computer and peripheral equipment<br />
manufactur<strong>in</strong>g and semiconductor and other electronic components manufactur<strong>in</strong>g) (Macher and<br />
Mowery, 2004). The semiconductor <strong>in</strong>dustry has become <strong>in</strong>creas<strong>in</strong>gly specialized <strong>in</strong> product<br />
design and manufactur<strong>in</strong>g, while the computer <strong>in</strong>dustry has become specialized <strong>in</strong> various<br />
horizontal layers, <strong>in</strong>clud<strong>in</strong>g components, computer assembly, operat<strong>in</strong>g systems, and<br />
applications s<strong>of</strong>tware (Bresnahan, 1998). This may reflect <strong>in</strong>herent differences <strong>in</strong> the services<br />
sector and the manufactur<strong>in</strong>g processes. Consistent with the results, it may be the case that states<br />
with more service economy-led growth factors tend to be more <strong>in</strong>sulated to national shocks and,<br />
thus, they may be <strong>in</strong> a better position to chart their own course as compared to manufactur<strong>in</strong>g<br />
economy-dom<strong>in</strong>ated states.<br />
The FEVD for the semiconductor and other electronic component <strong>in</strong>dustry shows high values<br />
for most states. This suggests a very high l<strong>in</strong>kage between the states and the national <strong>in</strong>dustry<br />
structure for this <strong>in</strong>dustry. A possible explanation may be that the semi-conductor <strong>in</strong>dustry <strong>in</strong><br />
U.S. is <strong>in</strong>creas<strong>in</strong>gly specialized <strong>in</strong>to two different functions. One is the design part <strong>of</strong><br />
semiconductor manufactur<strong>in</strong>g, and many activities <strong>in</strong> this area are still occurr<strong>in</strong>g <strong>in</strong> the U.S.<br />
economy. The other is the manufactur<strong>in</strong>g part, which now is mostly carried out <strong>of</strong>fshore <strong>in</strong><br />
25
countries such as Taiwan, Japan and Korea. S<strong>in</strong>ce <strong>of</strong>fshor<strong>in</strong>g is a nation-wide phenomenon <strong>in</strong><br />
the semiconductor <strong>in</strong>dustry, the <strong>in</strong>dustry’s grow th obviously will be closely tied to national<br />
shocks.<br />
Though the impression created by the bus<strong>in</strong>ess press has been that the national tech sector<br />
decl<strong>in</strong>e had a lesser impact on the computer and peripheral equipment manufactur<strong>in</strong>g <strong>in</strong>dustry <strong>in</strong><br />
Texas, our NVAR analysis shows someth<strong>in</strong>g different. Texas, based on the results shown from<br />
our data, exhibited a considerable degree <strong>of</strong> contagion effects from the nation (FEVDCPEM_TX =<br />
99.4%), such that the national shock was practically fully transmitted to the state economy.<br />
However, the state had a strong growth pattern <strong>of</strong> its own which overwhelmed the national<br />
shocks. If the national shocks had not been there, our estimates would <strong>in</strong>dicate that even<br />
stronger growth <strong>of</strong> the <strong>in</strong>dustry <strong>in</strong> Texas should have occurred. We also note that Texas<br />
contributes nearly 11% <strong>of</strong> the computer and electronic production and 12% <strong>of</strong> the exports to the<br />
national economy, nearly twice its 7.5% contribution to national GDP. This reflects a relatively<br />
large IT contribution from Texas to the national economy.<br />
The contagion effect for the large IT-produc<strong>in</strong>g states for the s<strong>of</strong>tware publish<strong>in</strong>g <strong>in</strong>dustry is<br />
much higher than the national average. This <strong>in</strong>dicates that a national shock or <strong>in</strong>novation <strong>in</strong> the<br />
s<strong>of</strong>tware publish<strong>in</strong>g <strong>in</strong>dustry flows through to these IT-produc<strong>in</strong>g states almost completely, while<br />
it has a lesser impact on the smaller IT-produc<strong>in</strong>g states. This result matches our <strong>in</strong>tuition that<br />
the dotcom bubble and <strong>of</strong>fshor<strong>in</strong>g <strong>of</strong> s<strong>of</strong>tware development are likely to hurt these states more<br />
than others. We next characterize possible factors which may <strong>in</strong>fluence differences <strong>in</strong> the extent<br />
<strong>of</strong> the contagion effects.<br />
4. CHARACTERIZING THE FACTORS INFLUENCING CONTAGION EFFECTS<br />
The heterogeneity <strong>of</strong> bus<strong>in</strong>ess cycles with<strong>in</strong> the United States has been recognized <strong>in</strong><br />
26
previous research (e.g., Coulson and Rushen, 1993; Stock and Watson, 1998; Cambell, 1998). In<br />
this second stage <strong>of</strong> the analysis, we try to identify contextual factors which can have <strong>in</strong>fluence<br />
on the variation <strong>in</strong> contagion effects among states. The variation may be due to differences <strong>in</strong><br />
responses to common shocks, like the dotcom bubble, which was felt all over the U.S., or due to<br />
idiosyncratic factors for each state. S<strong>in</strong>ce there is no obvious theoretical basis to suggest which<br />
factors may expla<strong>in</strong> the differences <strong>in</strong> contagion effects, we will use prior research literature to<br />
guide our discovery.<br />
4.1. Factors Driv<strong>in</strong>g the Contagion Effects<br />
As our econometric analysis suggests, different IT <strong>in</strong>dustries show different contagion effects<br />
and these effects vary from state to state. S<strong>in</strong>ce IT is a general purpose technology used by all<br />
other <strong>in</strong>dustries (David and Wright, 2003; Jovanovic and Rousseau, 2003), a general<br />
recessionary trend <strong>in</strong> the economy may lead to reduced demand for IT products and services<br />
(Cragg and K<strong>in</strong>g, 1993). This suggests that the contagion effects may be related to the gross<br />
domestic product (GDP) <strong>of</strong> the state. Wong (1998) studied the growth <strong>of</strong> <strong>in</strong>formation and<br />
communication technologies (ICTs) <strong>in</strong> S<strong>in</strong>gapore and suggested that the growth <strong>of</strong> <strong>in</strong>formation<br />
economy is related to four components, one <strong>of</strong> which is the production and distribution <strong>of</strong> ICT<br />
goods and appliances. 7 This <strong>in</strong>dicates that the size <strong>of</strong> the IT sectors <strong>in</strong> the economy may also<br />
impact the degree to which a state may exhibit a contagion effect. A state-level economy with a<br />
higher dependence on the IT sectors is likely to be affected more by national level shocks <strong>in</strong> the<br />
IT sectors.<br />
Another factor which may <strong>in</strong>fluence the degree <strong>of</strong> the contagion effects is the level <strong>of</strong><br />
<strong>in</strong>vestment <strong>of</strong> venture capital <strong>in</strong> the state. Venture capital <strong>in</strong>vestment represents assessment by<br />
the venture capitalist <strong>of</strong> a new venture’s likelihood <strong>of</strong> survival. These decisions are based on<br />
7 The other three components are content <strong>in</strong>dustry, network <strong>in</strong>frastructure, and <strong>in</strong>formatization.<br />
27
factors such as the nature <strong>of</strong> the markets, competition, and regulatory environment <strong>in</strong> which the<br />
venture exists (Shepherd, 1999). A state with higher venture capital <strong>in</strong>vestments represents an<br />
assessment that a given <strong>in</strong>dustry <strong>in</strong> the state has higher likelihood <strong>of</strong> survival, ceteris paribus.<br />
Keuschnigg (2004) posits that venture capitalists not only f<strong>in</strong>ance but also advise start-up<br />
entrepreneurs and thereby add value to new firms. He shows how a productive and active venture<br />
capital <strong>in</strong>dustry boosts <strong>in</strong>novation-based growth. De Vol (1999) also argues that without venture<br />
capital <strong>in</strong>frastructure, a region’s technology cluster m ay not flourish. These studies suggest that a<br />
state with a higher level <strong>of</strong> venture capital <strong>in</strong>vestment is less likely to be affected by national<br />
shocks.<br />
The idea that an export base is essential for regional economic growth is widely accepted by<br />
economists. Lewis (1972) says that the ability to develop an export base is a critical determ<strong>in</strong>ant<br />
<strong>of</strong> regional growth. Moosa (1996) studied time-series data on exports and output <strong>in</strong> the United<br />
K<strong>in</strong>gdom dur<strong>in</strong>g the period from 1885 to 1993 and found a causal relationship between exports<br />
and growth. Smirnov (2002) studied which factors affect self-susta<strong>in</strong>ability <strong>of</strong> regional<br />
economic development and found that export base is an important determ<strong>in</strong>ant. Further,<br />
Cuaresma and Worz (2005) found that high-tech exports have greater externalities and, therefore,<br />
have a greater impact on output growth. These studies suggest that states with well-developed<br />
export bases can withstand national shocks better and will exhibit lesser contagion effects.<br />
Another factor which may <strong>in</strong>fluence the extent <strong>of</strong> contagion effects from the nation to a state<br />
is the size <strong>of</strong> the state’s firms. Prior research shows that smaller firms tend to be more <strong>in</strong>novative<br />
and <strong>in</strong>novation leads to growth. For IT <strong>in</strong>dustries, both large and small firms have shown<br />
<strong>in</strong>novation, albeit <strong>of</strong> different types. For example, <strong>in</strong> the computer <strong>in</strong>dustry, complex<br />
28
architectural type <strong>in</strong>novations, 8 <strong>in</strong>volv<strong>in</strong>g greater complexity and requir<strong>in</strong>g greater capital<br />
<strong>in</strong>volvement, have occurred <strong>in</strong> larger firms like IBM, whereas smaller design-oriented <strong>in</strong>novation<br />
has occurred <strong>in</strong> smaller firms (Bresnahan and Greenste<strong>in</strong>, 1999). Thore (1996) studied return <strong>of</strong><br />
scale <strong>in</strong> the U.S. computer <strong>in</strong>dustry for the period 1981 to 1991. He found that the computer<br />
<strong>in</strong>dustry can be divided <strong>in</strong>to two camps: a few large mature corporations with decreas<strong>in</strong>g returns<br />
to scale, and many small start-up companies with advanced technology exhibit<strong>in</strong>g <strong>in</strong>creas<strong>in</strong>g<br />
returns to scale. Brunner (1991) studied the role <strong>of</strong> small firms <strong>in</strong> India's computer <strong>in</strong>dustry and<br />
found that successful <strong>in</strong>novator firms have grown larger. Wagner (1995) explored the<br />
relationships between exports and firm size and how they affect firm growth for 7,000<br />
manufactur<strong>in</strong>g firms <strong>in</strong> Germany. He found that firm growth and export performance are<br />
positively related. His study <strong>in</strong>dicates that larger firm sizes support growth <strong>in</strong> exports which, <strong>in</strong><br />
turn, support economic growth. This large firm-led theory <strong>of</strong> export growth runs counter to the<br />
perspective that smaller firms promote economic growth. Hence, although firm size has been<br />
found to be significant <strong>in</strong> different studies, the results have been mixed. So the <strong>in</strong>fluence <strong>of</strong><br />
average firm size on the contagion effect could be <strong>in</strong> either direction.<br />
A number <strong>of</strong> studies at the regional and <strong>in</strong>ternational level suggest that a society’s ability to<br />
make use <strong>of</strong> ICTs depends on its level <strong>of</strong> e-read<strong>in</strong>ess. Various <strong>in</strong>dices have been developed to<br />
measure e-read<strong>in</strong>ess <strong>of</strong> countries by the different <strong>in</strong>ternational agencies. They <strong>in</strong>clude the<br />
International T elecom m unication U nion’s ―D igital A ccess Index‖ (D A I), the United Nations<br />
Development Programme’s ―T echnology A chievem ent Index‖ (T A I), and the World Bank’s<br />
―K now ledge E conom y Index‖ (K E I), am ong others. Societies which exhibit higher e-read<strong>in</strong>ess<br />
are also more dependent on IT products and applications and, therefore, are more likely to be<br />
8 Henderson and Clark (1990) dist<strong>in</strong>guish between the product and components <strong>of</strong> the product and def<strong>in</strong>e<br />
architectural <strong>in</strong>novation as the <strong>in</strong>novation that changes the architecture <strong>of</strong> a product without chang<strong>in</strong>g its<br />
components.<br />
29
affected by national shocks and aggregate-level <strong>in</strong>novations. Hence, we expect high e-read<strong>in</strong>ess<br />
to be positively correlated to the observation <strong>of</strong> contagion effects.<br />
The related factors can be chosen to expla<strong>in</strong> the variation across different states <strong>in</strong> their<br />
response to national shocks. We have not considered those factors which we expect to be same<br />
across different states; they may not have explanatory power with respect to variations among<br />
states. For example, Bresnahan and Greenste<strong>in</strong> (1999) posit that the computer <strong>in</strong>dustry structure<br />
is based on computer platforms. However, this is a factor which is common across all states, so it<br />
is not possible for us to <strong>in</strong>clude it as one <strong>of</strong> the <strong>in</strong>dependent variables.<br />
4.2. Variables and Data<br />
We use gross product <strong>of</strong> the state (STATE-GDP) as a measure <strong>of</strong> economic activity <strong>in</strong> the<br />
state. To account for population differences among the states, we also take state-level GDP per<br />
capita (STATE-GDP/POP) <strong>in</strong>to consideration. We used data from the Bureau <strong>of</strong> Economic<br />
Analysis (BEA) <strong>of</strong> the U.S. Department <strong>of</strong> Commerce STATE-GDP and Census Bureau data is<br />
used for population (POP) <strong>of</strong> the states for the per capita GDP adjustment. BEA data do not<br />
capture the details <strong>of</strong> the contribution <strong>of</strong> computer and peripheral equipment manufactur<strong>in</strong>g<br />
<strong>in</strong>dustries, but provides <strong>in</strong>formation about computer and other electronic product manufactur<strong>in</strong>g.<br />
We will code this as COEP-GDP (<strong>in</strong> contrast to our earlier use <strong>of</strong> CPEM computer and<br />
peripheral equipment manufactur<strong>in</strong>g). COEP-GDP is a mean<strong>in</strong>gful <strong>in</strong>dicator <strong>of</strong> IT<br />
manufactur<strong>in</strong>g <strong>in</strong>dustries <strong>in</strong> the state. Similarly, BEA data do not provide <strong>in</strong>formation about<br />
s<strong>of</strong>tware publish<strong>in</strong>g <strong>in</strong>dustry alone, but <strong>in</strong>stead recognize the contribution <strong>of</strong> publish<strong>in</strong>g<br />
<strong>in</strong>dustries <strong>in</strong> general, <strong>in</strong>clud<strong>in</strong>g s<strong>of</strong>tware publish<strong>in</strong>g (PUBL-GDP). So we use PUBL-GDP as an<br />
<strong>in</strong>dicator <strong>of</strong> the activities <strong>of</strong> the s<strong>of</strong>tware publish<strong>in</strong>g <strong>in</strong>dustry relative to STATE-GDP. 9<br />
9 S<strong>in</strong>ce the pr<strong>in</strong>t media <strong>in</strong>dustry is very strong, the s<strong>of</strong>tware publish<strong>in</strong>g <strong>in</strong>dustry may only be a fraction <strong>of</strong> the PUBL-<br />
GDP variable. Thus we conclude that the variable which captures the effect <strong>of</strong> s<strong>of</strong>tware publish<strong>in</strong>g <strong>in</strong>dustry may be<br />
30
We constructed the average firm size data constructed based on U.S. Census Bureau data for<br />
number <strong>of</strong> employees and number <strong>of</strong> firms <strong>in</strong> the <strong>in</strong>dustry for 1999, with similar logic for the<br />
choice <strong>of</strong> base year that we discussed before. For state-level venture capital <strong>in</strong>vestments (VCAP-<br />
INV), we use data from the Pricewaterhouse Coopers-Thomson Venture Economics-National<br />
Venture Capital Association MoneyTree survey (available at www.ventureeconomics.com/vec/<br />
statshome.htm). For state-level merchandise exports share <strong>of</strong> the national total (EXPORT-<br />
SHARE), segregated for the different <strong>in</strong>dustries, we used state-level export data from the<br />
Economic Census <strong>of</strong> the U.S. Census Bureau. 10 F<strong>in</strong>ally, for a state-level measure <strong>of</strong> e-read<strong>in</strong>ess,<br />
we use the state-level ―N ew Economy Index‖ (NEI), as developed by the Progressive Policy<br />
Institute and described <strong>in</strong> Atk<strong>in</strong>son (2002). In all these <strong>in</strong>stances, the figures used are for the<br />
basel<strong>in</strong>e year <strong>of</strong> 1999, which is roughly at the midpo<strong>in</strong>t <strong>of</strong> the overall period <strong>of</strong> this longitud<strong>in</strong>al<br />
study— a reasonable start<strong>in</strong>g po<strong>in</strong>t <strong>in</strong> our analysis. We also will do a sensitivity analysis to<br />
determ<strong>in</strong>e if the choice <strong>of</strong> year will significantly affect the results.<br />
4.3. Results<br />
We conjecture that some <strong>of</strong> the factors discussed <strong>in</strong> the prior subsection may <strong>in</strong>fluence the<br />
contagion effects for IT <strong>in</strong>dustries. We also ran a simple l<strong>in</strong>ear regression with these factors as<br />
<strong>in</strong>dependent variables with the FEVD results, as estimated earlier, as the dependent variable for<br />
each IT <strong>in</strong>dustry. We checked for the presence <strong>of</strong> known-source heteroskedasticity <strong>in</strong> our data<br />
set w ith W hite’s (1980) test and the p-values for significance are shown <strong>in</strong> Table 2 below. We do<br />
not f<strong>in</strong>d significant heterskedasticity for our data set. We also tested for normality us<strong>in</strong>g the<br />
noisy.<br />
10 The State Export Data Series <strong>of</strong> the Economic Census has observations that are self-filed by qualified exporters,<br />
forwarders, and carriers. The data specify the state <strong>of</strong> orig<strong>in</strong> <strong>of</strong> movement <strong>of</strong> the export goods. The data have two<br />
limitations. First, as with all self-reported data, it is likely to be noisier than if a more formal data collection<br />
methodology were used to capture the same data. Second, <strong>in</strong> certa<strong>in</strong> cases, the orig<strong>in</strong> <strong>of</strong> movement is not the state <strong>of</strong><br />
orig<strong>in</strong> <strong>of</strong> transportation. For example, whenever shipments are consolidated, the state <strong>of</strong> orig<strong>in</strong> <strong>of</strong> movement will<br />
reflect the state <strong>of</strong> location at which the shipments are consolidated.<br />
31
SKTEST procedure <strong>of</strong> STATA 8.0, which performs the Jarque-Bera test (Spanos, 1993), based<br />
on skewness and kurtosis for each <strong>of</strong> the variables <strong>in</strong> the data set. Our results showed that the<br />
assumption <strong>of</strong> a normal distribution cannot be rejected for the variables <strong>in</strong> the data set. The<br />
correspond<strong>in</strong>g p-values for each <strong>of</strong> the estimated models are presented <strong>in</strong> Table 2.<br />
Instead <strong>of</strong> presuppos<strong>in</strong>g a theoretical model <strong>in</strong> which to <strong>in</strong>stantiate the <strong>in</strong>dependent variables<br />
that we have discussed to this po<strong>in</strong>t, we aga<strong>in</strong> used the Akaike <strong>in</strong>formation criterion (AIC) and<br />
the Schwartz Bayesian <strong>in</strong>formation criterion (SBIC) via the ICOMP model selection function <strong>of</strong><br />
STATA 8.0 to provide a basis for efficient variable choices. This additional analysis permitted<br />
us to reduce the number <strong>of</strong> <strong>in</strong>dependent variables and to obta<strong>in</strong> parsimonious models for each <strong>of</strong><br />
the <strong>in</strong>dustries. The results for the full model and most appropriate reduced model for each <strong>of</strong> the<br />
<strong>in</strong>dustries are shown <strong>in</strong> Table 2.<br />
Table 2. Factors Characteriz<strong>in</strong>g Contagion Effects <strong>in</strong> Three IT Industries<br />
CANDIDATE<br />
FACTORS<br />
51121<br />
FULL<br />
MODEL<br />
(1)<br />
51121<br />
REDUCED<br />
MODEL<br />
(2)<br />
33411<br />
FULL<br />
MODEL<br />
(3)<br />
33411<br />
REDUCED<br />
MODEL<br />
(4)<br />
33441<br />
FULL<br />
MODEL<br />
(5)<br />
32<br />
33441<br />
REDUCED<br />
MODEL<br />
(6)<br />
EXPORT-SHARE -0.0553 -0.0567 0.0359 0.025 * -0.02<br />
PUBL-GDP -1.5e-07 -3.84e-05 *** -2.89e-05 *** 2.04e-06<br />
COEP-GDP 3.02e-05 * 3.31e-05 ** -2.61e-05 1.02e-05<br />
STATE-GDP 0.0013 *** 0.0013 *** 3.97e-04 2.57e-04<br />
VCAP-INV -9.12e-05 *** -9.6e-05 *** 3.22e-05 -2.43e-05<br />
STATE-GDP/POP -5.048 -24.71 *** -17.05 ** 2.79<br />
NEI 0.0068 * 5.27e-03 ** 0.017 *** 0.0137 *** 0.0016 0.003 **<br />
AVG-FIRM-SIZE -0.0022 1.15e-04 * 8.76e-05 8.58e-05<br />
R 2 0.4682 0.4479 0.4044 0.3559 0.1771 0.0941<br />
Adjusted-R 2 0.3562 0.3806 0.2682 0.2754 0.0748<br />
Heterosced. (p-value) 0.4631 0.7059 0.429 0.1751 0.4995 0.1604<br />
Skewness (p > 2) 0.8763 0.3171 0.1851 0.7392 0.0000 0.7126<br />
Notes. Models: full and reduced models, determ<strong>in</strong>ed on the basis <strong>of</strong> Akaike <strong>in</strong>formation criterion and Schwartz<br />
Bayesian <strong>in</strong>formation criterion, us<strong>in</strong>g STATA 8.0. Gray cells <strong>in</strong> the table <strong>in</strong>dicate <strong>in</strong>stances where no estimate <strong>of</strong> a<br />
parameter was made to achieve a parsimonious model. Industries: 51121 = s<strong>of</strong>tware publish<strong>in</strong>g; 33411 = computer<br />
and peripheral equipment manufactur<strong>in</strong>g; 33441 = semiconductor and other electronic components manufactur<strong>in</strong>g.<br />
The follow<strong>in</strong>g variables reflect 1999 data: EXPORT-SHARE, PUBL-GDP, COEP-GDP, STATE-GDP, VCAP,<br />
STATE-GDP/POP. New Economy Index (NEI) is for 2002. Significance: * = p < .10; ** = p
The results <strong>in</strong> Table 2 are generally consistent with our expectations. The R 2 values for the<br />
models are 46.82% for s<strong>of</strong>tware publish<strong>in</strong>g and 40.44% for computer and peripheral<br />
manufactur<strong>in</strong>g <strong>in</strong>dustries, which suggest that the <strong>in</strong>dependent variables <strong>in</strong>cluded have reasonable<br />
explanatory power for the contagion effect. For the s<strong>of</strong>tware publish<strong>in</strong>g <strong>in</strong>dustry, the contagion<br />
effects are positively correlated with state-level GDP (STATE-GDP), the size <strong>of</strong> state-level GDP<br />
for the computer and other electronic products <strong>in</strong>dustry (COEP-GDP) <strong>in</strong> state GDP, and the<br />
overall level <strong>of</strong> e-read<strong>in</strong>ess as represented by the New Economy Index (NEI). It is negatively<br />
correlated to the venture capital <strong>in</strong>vestment <strong>in</strong> the state. For the computer and electronic product<br />
manufactur<strong>in</strong>g <strong>in</strong>dustry (COEP-GDP), the contagion effects are positively correlated with the<br />
New Economy Index (NEI) but negatively correlated with state GDP per capita (STATE-<br />
GDP/POP) and the size <strong>of</strong> publish<strong>in</strong>g <strong>in</strong>dustry <strong>in</strong>clud<strong>in</strong>g s<strong>of</strong>tware publish<strong>in</strong>g (PUBL-GDP). For<br />
the semiconductor and other electronic components <strong>in</strong>dustry, the contagion effects also are<br />
positively correlated with the New Economy Index (NEI).<br />
4.4. Sensitivity Analysis<br />
We ran a regression for 1999, the middle year <strong>of</strong> the period for which we estimated the<br />
contagion effects. Cross-sectional analysis may suffer if there is a sudden shock which changes<br />
one or more <strong>of</strong> the <strong>in</strong>dependent variables. In the period under study, the stock market boom and<br />
the subsequent crash are events which may have affected the results <strong>of</strong> this cross-sectional<br />
analysis. To test whether there were any shocks which significantly affected our estimates <strong>in</strong> the<br />
second-stage regression, we carried out the same estimations for 1997 and 2003, the beg<strong>in</strong>n<strong>in</strong>g<br />
and the end <strong>of</strong> data <strong>in</strong> this longitud<strong>in</strong>al study. Though there still may be biases, this should<br />
provide a reasonable check for the robustness <strong>of</strong> our variable selection. For both these years, it<br />
turns out, the regression results are similar. The significant variables are consistent across the<br />
33
different regressions and the R 2 values are very close to the values we previously reported <strong>in</strong><br />
Table 2. This suggests that the correlations <strong>of</strong> factors are robust, and consistent and not transient.<br />
4.5. Discussion<br />
The New Economy Index (NEI) was positively correlated with the FEVDs for all three<br />
<strong>in</strong>dustries. This signifies that states which have more advanced ITs tend to exhibit a greater<br />
degree <strong>of</strong> contagion effects relative to the national level for IT <strong>in</strong>dustries. This result supports<br />
our earlier assertion that the relationships between IT <strong>in</strong>dustries may be unique from other<br />
sectors <strong>of</strong> economy. The s<strong>of</strong>tware <strong>in</strong>dustry shows a positive correlation between the size <strong>of</strong><br />
economy <strong>of</strong> the state and the size <strong>of</strong> computer and electronic equipment <strong>in</strong>dustry. This implies<br />
that states which have bigger economies tend to move <strong>in</strong> the same direction as the nation when a<br />
national shock occurs. The state also shows negative correlation with venture capital <strong>in</strong>vestment,<br />
which <strong>in</strong>dicates that the presence <strong>of</strong> strong venture capital contributes to isolat<strong>in</strong>g the state from<br />
national shocks <strong>in</strong> the s<strong>of</strong>tware <strong>in</strong>dustry. Venture capital seems to act as some k<strong>in</strong>d <strong>of</strong> ―shock<br />
absorber‖ for the s<strong>of</strong>tware <strong>in</strong>dustry. We should note, however, that this story may not be true for<br />
all the <strong>in</strong>dustries that we studied; for example, venture capital is not significant for the hardware<br />
<strong>in</strong>dustries. The GDP variables <strong>in</strong>dicate the <strong>in</strong>fluence <strong>of</strong> scale economies on contagion effects.<br />
We found this variable to be consistently significant for all <strong>of</strong> our estimations.<br />
Although our analysis provides some <strong>in</strong>itial understand<strong>in</strong>g <strong>of</strong> the factors which may<br />
<strong>in</strong>fluence the relationships that IT <strong>in</strong>dustries exhibit, we must caution the reader about the<br />
limitations <strong>of</strong> this estimation. In this two-stage estimation approach, our first stage <strong>in</strong>volves<br />
NVAR estimation <strong>of</strong> contagion effects. The second stage <strong>in</strong>volves regression <strong>of</strong> contextual<br />
variables with FEVD as the dependent variable. Econometric estimation <strong>of</strong> FEVD via the related<br />
contextual factors assumes that the data-generat<strong>in</strong>g process for the dependent variable satisfies<br />
34
the conditions for l<strong>in</strong>ear regression. This regression may not yield consistent estimators if the<br />
assumptions for l<strong>in</strong>ear regressions are not fully satisfied. While a detailed exposition <strong>of</strong> the<br />
issues is beyond the scope <strong>of</strong> this paper, we still should po<strong>in</strong>t out some areas <strong>of</strong> concern. For<br />
example, we expect that the residuals <strong>of</strong> the estimated model for a given state may be correlated<br />
with the model residuals for contiguous states due to spatial <strong>in</strong>terdependencies. A related<br />
possible issue is endogeneity. In particular, we cannot assert that the data-generat<strong>in</strong>g process for<br />
the model is strictly exogenous with respect to the process that generates the residuals. Here<br />
aga<strong>in</strong>, a possible source <strong>of</strong> bias may be spatial <strong>in</strong>terdependencies. In addition, some other<br />
unobserved variables may be correlated with our explanatory variables. The results also may be<br />
biased due to measurement error <strong>in</strong> the <strong>in</strong>dependent variables. Macroeconomic variables are<br />
<strong>of</strong>ten measured with error. The direction <strong>of</strong> the bias may depend on the nature <strong>of</strong> correlation<br />
between the variables and the correlation between the variables and the measurement error.<br />
5. CONCLUSIONS<br />
We analyze the growth <strong>of</strong> IT <strong>in</strong>dustries <strong>in</strong> the U.S. and show the existence <strong>of</strong> co-movement<br />
between national-level and state-level <strong>in</strong>dicators with respect to IT <strong>in</strong>dustries <strong>in</strong> the United<br />
States. We also provide evidence that the contagion effects vary from state to state and are also<br />
different for different <strong>in</strong>dustries. We further identify some factors which <strong>in</strong>fluence the degree <strong>of</strong><br />
the l<strong>in</strong>kage relationship between states and the nation. Our study f<strong>in</strong>ds that that IT manufactur<strong>in</strong>g<br />
<strong>in</strong>dustries are more susceptible to contagion effects than IT service <strong>in</strong>dustries. We also show that<br />
states with higher IT production tend to exhibit stronger contagion effects. We also f<strong>in</strong>d that per<br />
capita state gross product, the export share <strong>of</strong> the state relative to the nation, the average firm<br />
size, the degree <strong>of</strong> a state’s e-read<strong>in</strong>ess, and venture capital <strong>in</strong>vestments are among the factors<br />
which <strong>in</strong>fluence the contagion effects between states and the nation, though their <strong>in</strong>fluence varies<br />
35
etween IT manufactur<strong>in</strong>g and service sector. This research reflects a new attempt towards<br />
understand<strong>in</strong>g the underly<strong>in</strong>g relationships among IT <strong>in</strong>dustries. Given the limitations <strong>of</strong> data for<br />
an aggregate analysis <strong>of</strong> this nature, we have performed various tests to ensure that the results are<br />
consistent and robust.<br />
Although our results show these trends, we recognize that more research is required to fully<br />
understand the nature <strong>of</strong> the contagion effects that we report between the nation and the states for<br />
growth <strong>in</strong> IT <strong>in</strong>dustries we have considered. We recognize that there may be a number <strong>of</strong><br />
limitations to this research <strong>in</strong> its present form. A larger number <strong>of</strong> observations over a longer<br />
time period would be useful for strengthen<strong>in</strong>g the case that we make, for example. The IT sector<br />
has been experienc<strong>in</strong>g renewed growth s<strong>in</strong>ce late 2003, so lengthen<strong>in</strong>g our time-series to <strong>in</strong>clude<br />
2004 and 2005 makes sense to try to understand the new shocks that are at work via our NVAR<br />
models. Similarly, other variables that might be helpful <strong>in</strong> expla<strong>in</strong><strong>in</strong>g the contagion effects may<br />
also be appropriate to add. These <strong>in</strong>clude such variables as the distance <strong>of</strong> a given state from<br />
other large IT-produc<strong>in</strong>g states (where the knowledge spillovers may be greater, lead<strong>in</strong>g to a<br />
greater tendency for co-movement), the export shares for each <strong>of</strong> the IT sectors, and so on. In<br />
our future research, we will be consider<strong>in</strong>g the <strong>in</strong>clusion <strong>of</strong> these and other potentially relevant<br />
variables.<br />
REFERENCES<br />
A iyagari, S .R ., B raun, R . A ., and E ckste<strong>in</strong>, Z . (1998) ―T ransaction S ervices, Inflation and<br />
Welfare.‖ Journal <strong>of</strong> Political Economy, 106(6), 1274-1301.<br />
Arthur, W. B. (1990) ―Silicon Valley Locational Clusters: When Do Increas<strong>in</strong>g Returns Imply<br />
M onopoly?‖ Mathematical Social Sciences, 19(3), 235-251.<br />
Atk<strong>in</strong>son, R. D. (2002) ―T he 2002 S tate N ew E conom y Index.‖ A vailable at<br />
www.neweconomy<strong>in</strong>dex.org/states/2002/<strong>in</strong>dex.html. Last accessed June 11, 2006.<br />
Brewer, H. L. (1985) ―M easures <strong>of</strong> D iversification: P redictors <strong>of</strong> R egional E conom ic<br />
Instability.‖ Journal <strong>of</strong> Regional Science, 25(3), 463-470.<br />
36
Barro, R. and Sala-i-M art<strong>in</strong>, X . (1991) ―C onvergence across States and Regions.‖ Brook<strong>in</strong>gs<br />
<strong>Paper</strong>s on Economic Activity, 1, 107-158.<br />
B resnahan, T . F . (1998) ―N ew M odes <strong>of</strong> C om petition: Im plications for the F uture S tructure <strong>of</strong><br />
the Computer Industry.‖ In J. Eisenach and T. Lenard (Eds.) Competition, Innovation and the<br />
Micros<strong>of</strong>t Monopoly: Antitrust <strong>in</strong> the Digital Marketplace, The Progress and Freedom<br />
Foundation, Kluwer Academic Publishers, Boston, MA.<br />
B resnahan, T . F ., and G reenste<strong>in</strong>, S . (1999) ―T echnological C om petition and the S tructure <strong>of</strong> the<br />
Computer Industry.‖ Journal <strong>of</strong> Industrial Economics, 47(1), 1-40.<br />
Brown<strong>in</strong>g, L. D., Beyer, J. M., and Shettler, J. C. (1995) ―B uild<strong>in</strong>g C ooperation <strong>in</strong> a C om petitive<br />
Industry: SEMATECH and the Semiconductor Industry.‖ Academy <strong>of</strong> Management Journal,<br />
38(1), 113-151.<br />
B runner, H . (1991) ―S m all-Scale Industry and Technology <strong>in</strong> India: The Case <strong>of</strong> the Computer<br />
Industry.‖ Small Bus<strong>in</strong>ess Economics, 3(2), 121-129.<br />
Burnham, K. P., and D. R. Anderson. (2002) Model Selection and Multimodel Inference: A<br />
Practical Information-Theoretic Approach, 2nd Edition. Spr<strong>in</strong>ger-Verlag, New York, NY.<br />
C am pbell, J. (1998) ―Asset Prices, Consumption, and the Bus<strong>in</strong>ess Cycle.‖ Work<strong>in</strong>g <strong>Paper</strong> No.<br />
W6485, National Bureau <strong>of</strong> Economic Research, Cambridge, MA.<br />
Carl<strong>in</strong>o, G., and DeF<strong>in</strong>a, R. (1995) ―R egional Income Dynamics.‖ Journal <strong>of</strong> Urban Economics,<br />
37(1), 88-106.<br />
Carl<strong>in</strong>o, G., and Sill, K. (2001) ―R egional Incom e F luctuations: Common Trends and Common<br />
Cycles.‖ Review <strong>of</strong> Economics and Statistics, 83(3), 446-456.<br />
Christiano, L. J. and Fitzgerald, T. J. (1998) ―T he B us<strong>in</strong>ess C ycle: It’s S till a P uzzle.‖ Federal<br />
Reserve Bank <strong>of</strong> Chicago Economic Perspectives, 22(4), 56-83.<br />
Coulson, N.E. (1999) ―S ectoral Sources <strong>of</strong> Metropolitan Growth.‖ Regional Science and Urban<br />
Economics, 29(6), 723-743.<br />
Coulson, N.E., and Rushen, S.F. (1993) ―S ources <strong>of</strong> F luctuations <strong>in</strong> the B oston E conom y.‖<br />
Journal <strong>of</strong> Urban Economics, 38(1), 74-93.<br />
Cragg, P. B., and K<strong>in</strong>g, M. (1993) ―S m all-Firm Comput<strong>in</strong>g: Motivators and Inhibitors.‖ MIS<br />
Quarterly, 17(1), 47-60.<br />
Cromwell, B.A. (November 1992) ―D oes C alifornia D rive the W est? A n E conom ic Investigation<br />
<strong>of</strong> Regional Spillovers.‖ Economic Review, Federal Reserve Bank <strong>of</strong> San Francisco, CA, 13-23.<br />
Cuaresma, J. C., and Worz, J. (2005) ―O n E xport Composition and Growth.‖ Review <strong>of</strong> World<br />
Economics, 141(1), 33-49.<br />
D avid, P . A ., and W right, G . (2003) ―General Purpose Technologies and Productivity Surges:<br />
Historical Reflections on the Future <strong>of</strong> the ICT Revolution.‖ In P. A. David and M. Thomas<br />
(Eds.), The Economic Future <strong>in</strong> Historical Perspective, Oxford <strong>University</strong> Press, London, UK,<br />
Also available on the Internet as Work<strong>in</strong>g <strong>Paper</strong> No. 0502002, Economics Work<strong>in</strong>g <strong>Paper</strong><br />
Archive, Economic History, at econwpa.wustl.edu:80/eps/eh/papers/0502/0502002.<strong>pdf</strong>. Last<br />
accessed on June 11, 2006.<br />
D eV ol, R . (1999) ―A m erica’s H igh T ech E conom y: G row th, D evelopm ent, and R isks for<br />
37
Metropolitan Areas.‖ Milken Institute Forum, August 11, 1999. Also available on the Internet<br />
via www.milken<strong>in</strong>stitute.org/<strong>pdf</strong>/forum_990811.<strong>pdf</strong>. Last accessed on June 11, 2006.<br />
Ellison, G., and Glaeser, E.L. (1997) ―G eographic C oncentration <strong>in</strong> U .S . M anufactur<strong>in</strong>g<br />
Industries: A Dartboard Approach.‖ Journal <strong>of</strong> Political Economy, 105(5), 889-927.<br />
Enders, W. (2004) Applied Econometric Time Series. John Wiley and Sons, New York, NY.<br />
F rauheim , W . (M arch 27, 2003) ―ID C P redicts K eys to IT R ecovery.‖ C netN ews.com, March<br />
27, 2003. Available on the Internet at news.com.com/IDC+predicts+keys+to+IT+recovery/2100-<br />
1014_3-994447.html. Last accessed on June 11, 2006.<br />
Friedman, B. M. and Kuttner, K. N. (1992) ―Money, Income, Prices and Interest Rates.‖<br />
American Economic Review, 82(3), 472-492.<br />
G ali, J. (1999) ―T echnology, E m ploym ent and the B us<strong>in</strong>ess C ycle: D o T echnology S hocks<br />
Expla<strong>in</strong> Aggregate Fluctuations?‖ American Economic Review, 89(1), 249-271.<br />
Han, K., Kauffman, R. J., and Nault, B. R. (2005) ―Does IT Outsourc<strong>in</strong>g Pay Off? Evidence<br />
from Industry-Level Data.‖ Presented at the 2005 Workshop on IS and Economics (WISE),<br />
<strong>University</strong> <strong>of</strong> California, Irv<strong>in</strong>e, CA.<br />
Henderson, R.M., and C lark, K .B . (1990) ―Architectural Innovation: The Reconfiguration <strong>of</strong><br />
Exist<strong>in</strong>g Product Technologies and the Failure <strong>of</strong> Established Firms.‖ Adm<strong>in</strong>istrative Science<br />
Quarterly, 35(1), 9-30.<br />
H ercow itz, Z ., and S am pson, M . (1991) ―O utput G row th, the R eal W age, and Employment<br />
Fluctuations.‖ American Economic Review, 81(5), 1215-1237.<br />
Jovanavic, B., and Rousseau, P. L. (2003) ―General Purpose T echnologies.‖ W ork<strong>in</strong>g paper,<br />
Economics Department, New York <strong>University</strong>, New York, NY.<br />
Kauffman, R.J., and Techatassanasoontorn, A.A. (2005) ―Is There a Global Digital Divide for<br />
Digital Wireless Phone Technologies?‖ Journal <strong>of</strong> the Association for Information Systems, 6,<br />
12, 1-46.<br />
Kauffman, R.J., Kumar, A., and Techatassanasoontorn, A. (2006) ―S tate and N ational L<strong>in</strong>kages<br />
<strong>in</strong> N etw ork G row th.‖ Work<strong>in</strong>g paper, MIS Research Center, Carlson School <strong>of</strong> Management,<br />
<strong>University</strong> <strong>of</strong> M<strong>in</strong>nesota, M<strong>in</strong>neapolis, MN.<br />
K ehoe, P . J. and P erri, F . (2002) ―International B us<strong>in</strong>ess C ycles w ith E ndogenous Incom plete<br />
Cycles.‖ Econometrica, 70(3), 907-928.<br />
Keuschnigg, C. (2004) ―V enture C apital B acked G row th.‖ Journal <strong>of</strong> Economic Growth, 9(2),<br />
239-261.<br />
Kort, J. R. (1981) ―R egional E conom ic Instability and Industrial D iversification <strong>in</strong> the U .S.‖<br />
Land Economics, 57(4), 596-608.<br />
Kose, M. A., Otrok, C ., and W hitem an, C . H . (2003) ―International B us<strong>in</strong>ess C ycles: World,<br />
Region and Country-Specific Factors.‖ American Economic Review, 93(4), 1216-1239.<br />
L aw son, H . W . (2002). ―R ebirth <strong>of</strong> the C om puter Industry.‖ Communications <strong>of</strong> the ACM, 45(6),<br />
25-29.<br />
Lewis, W. C. (1972) A Critical Exam<strong>in</strong>ation <strong>of</strong> the Export-Base Theory <strong>of</strong> Urban-Regional<br />
38
Growth.‖ Annals <strong>of</strong> Regional Science, 6(2), 15-25.<br />
L ong, J. B . and P losser, C . I. (1987) ―S ectoral vs. Aggregate Shocks <strong>in</strong> the Bus<strong>in</strong>ess Cycles.‖<br />
American Economic Review, 77(2), 333-336.<br />
M acher, J.T . and D .C . M ow ery (2004) ―V ertical S pecialization and Industry S tructure <strong>in</strong> H igh<br />
T echnology Industries.‖ In J.A .C . B aum and A .M . M cG ahan (eds.), Bus<strong>in</strong>ess Strategy over the<br />
Industry Lifecycle – Advances <strong>in</strong> Strategic Management, 21, 317-356.<br />
McKendrick, D. G., Doner, R. F., and Haggard, S. (2000) From Silicon Valley to S<strong>in</strong>gapore:<br />
Location and Competitive Advantage <strong>in</strong> the Hard Disk Drive Industry. Stanford <strong>University</strong> Press,<br />
Stanford, CA.<br />
M ehra, Y . P . (1991) ―W age G row th and the Inflation Process: An Empirical Note.‖ American<br />
Economic Review, 81(4), 931-937.<br />
Moosa, I. A. (1996) ―T he C yclical R elationship B etw een E xports and O utput <strong>in</strong> the U .K .: 1885 -<br />
1993.‖ The Economist, 144(4), 635-647.<br />
P<strong>in</strong>dyck, R. S., and Rub<strong>in</strong>feld, D. L. (1998), Econometric Models and Economic Forecasts,<br />
Irw<strong>in</strong> McGraw-Hill, New York, NY.<br />
Rousseau, P., and Wachtel, P. (2000) ―E quity M arket and G row th: C ross-Country Evidence on<br />
Tim<strong>in</strong>g and Outcomes, 1980-1995.‖ Journal <strong>of</strong> Bank<strong>in</strong>g and F<strong>in</strong>ance, 24(12), 1933-1957.<br />
Saxenian, A. (1996) Regional Advantage: Culture and Competition <strong>in</strong> Silicon Valley and Route<br />
128. Harvard <strong>University</strong> Press, Cambridge, MA.<br />
S eabrook, D . (N ovem ber 7, 2003) ―D ram atic C hanges W ill F ollow IT R ecovery.‖ G artner<br />
Symposium ITXpo, Cannes, France.<br />
Shea, J. (1995) ―C o-Movement <strong>in</strong> Cities.‖ Work<strong>in</strong>g <strong>Paper</strong> No. 5304, National Bureau <strong>of</strong><br />
Economic Research, Cambridge, MA. Available at www.nber.org/papers/w5304.<strong>pdf</strong>. Last<br />
accessed on June 11, 2006.<br />
Shepherd, D. (1999) ―V enture C apitalists’ A ssessment <strong>of</strong> New Venture Survival.‖ Management<br />
Science, 45(5), 621-632.<br />
Sherwood-Call, C. (Summer 1988) ―E xplor<strong>in</strong>g the R elationships betw een N ational and Regional<br />
Economic Fluctuations.‖ Economic Review, 3, Federal Reserve Bank <strong>of</strong> San Francisco, 15-25.<br />
Sims, C. (1980) ―M acroeconom ics and R eality.‖ Econometrica, 48(1), 1- 48.<br />
Smirnov, O. (2002) ―M easur<strong>in</strong>g S elf-Susta<strong>in</strong>ability <strong>of</strong> Economic Development at the County<br />
Level.‖ Annals <strong>of</strong> Regional Science, 36(4), 683-696.<br />
Spanos, A. (1993) Statistical Foundations <strong>of</strong> Econometric Model<strong>in</strong>g. Cambridge <strong>University</strong><br />
Press, London, UK.<br />
S tock, J.H ., and W atson, M .W . (1998) ―Bus<strong>in</strong>ess Cycle Fluctuations <strong>in</strong> U.S. Macroeconomic<br />
Time Series.” Work<strong>in</strong>g <strong>Paper</strong> No. W6528, National Bureau <strong>of</strong> Economic Research, Cambridge,<br />
MA.<br />
Thore, S. (1996) ―Economies <strong>of</strong> Scale <strong>in</strong> the U.S. Computer Industry: An Empirical<br />
Investigation Us<strong>in</strong>g Data Envelopment Analysis.‖ Stochastic Hydrology and Hydraulics, 6(2),<br />
199-216.<br />
39
United States Census Bureau. (2004) ―S <strong>of</strong>tw are P ublishers 2002.‖ 2002 Economic Census<br />
Information Industry Series, United States Department <strong>of</strong> Commerce, Economics and Statistics<br />
Adm<strong>in</strong>istration. www.census.gov/prod/ec02/ec0251i06.<strong>pdf</strong>. Accessed on February 21, 2006.<br />
V irm ani, R ., and B row n, S . P . A . (2005) ―T exas F <strong>in</strong>d<strong>in</strong>g G row th <strong>in</strong> S eem <strong>in</strong>g D isadvantage.‖ The<br />
Southwest Economy, Federal Reserve Bank <strong>of</strong> Dallas, 3, 10-13. Available on the Internet via<br />
dallasfed.org/research/swe/2005/swe0503c.html. Last accessed on June 11, 2006.<br />
W agner, J. (1995) ―E xports, F irm S ize, and F irm D ynam ics.‖ Small Bus<strong>in</strong>ess Economics, 7(1),<br />
29-39.<br />
Wang, J. (1998) ―M icros<strong>of</strong>t Picks Beij<strong>in</strong>g for New R&D Lab.‖ Science 13, 282 (5392), 1998,<br />
1235–1237. Available at www.sciencemag.org/cgi/content/summary/282/5392/1235b. Last<br />
accessed on June 11, 2006.<br />
White, H. (1980) ―A Heteroskedasticity-Consistent Covariance Matrix and a Direct Test for<br />
Heteroskedasticity.‖ Econometrica, 48, 817-838.<br />
Wong, P. (1998) ―L everag<strong>in</strong>g the Global Information Revolution for Economic Development:<br />
S <strong>in</strong>gapore’s E volv<strong>in</strong>g Information Industry Strategy.‖ Information Systems Research, 9(4), 323-<br />
341.<br />
Z apata, H . O . and F ortenbery, T . R . (1996) ―S tochastic Interest R ates and Price Discovery <strong>in</strong><br />
Select Commodity Markets.‖ Review <strong>of</strong> Agricultural Economics, 18(3), 643-654.<br />
40
Appendix A. NAICS Industry Classifications<br />
NAICS<br />
CODE<br />
6-DIGIT<br />
CODE<br />
SIC<br />
CODE<br />
33411 334411 3571 Computer and<br />
334412 3572<br />
334413 3575<br />
334419<br />
INDUSTRY DESCRIPTION<br />
peripheral<br />
equipment<br />
manufactur<strong>in</strong>g<br />
33441 334411 3671 Semiconductor<br />
334412 3672 and other<br />
334413 3674 components<br />
334414 3675 manufactur<strong>in</strong>g<br />
334415<br />
334416<br />
3676<br />
334417<br />
334418<br />
334419<br />
3678<br />
51121 7372 S<strong>of</strong>tware<br />
publishers<br />
Manufactur<strong>in</strong>g and/or assembl<strong>in</strong>g electronic<br />
computers (ma<strong>in</strong>frames, personal computers,<br />
workstations, laptops, computer servers) and<br />
computer peripheral equipment (storage devices,<br />
pr<strong>in</strong>ters, monitors, <strong>in</strong>put/output devices, term<strong>in</strong>als).<br />
Manufactur<strong>in</strong>g semiconductors, capacitors, resistors,<br />
microprocessors, bare and loaded pr<strong>in</strong>ted circuit<br />
boards, electron tubes, electronic connectors,<br />
modems, etc.<br />
Computer s<strong>of</strong>tware publish<strong>in</strong>g or publish<strong>in</strong>g and<br />
reproduction. Carry out operations necessary for<br />
produc<strong>in</strong>g and distribut<strong>in</strong>g computer s<strong>of</strong>tware<br />
(design, documentation, <strong>in</strong>stallation, s<strong>of</strong>tware<br />
purchase help). May design/publish or publish only.<br />
Note: Classification systems used are (1) the North American Industrial Classification System (NAICS) <strong>of</strong> the<br />
United States Bureau <strong>of</strong> Economic Analysis (BEA), and (2) the Standard Industry Classification (SIC) <strong>of</strong> the same<br />
agency. NAICS codes replaced SIC codes after 1997. Gray cells <strong>in</strong> the table <strong>in</strong>dicate <strong>in</strong>stances where the data<br />
from the SIC and NAICS codes do not have a one-to-one correspondence for six-digit <strong>in</strong>dustry codes. This places<br />
some restrictions on the comparisons that can be made with data for different <strong>in</strong>dustries across the two classification<br />
systems. In this research, we made tactical decisions regard<strong>in</strong>g our six-digit <strong>in</strong>dustry selections so as to ensure that<br />
there were valid one-to-one correspondences between the earlier SIC and the later NAICS data. For another<br />
discussion <strong>of</strong> the issue <strong>of</strong> cross-classification systems comparability <strong>of</strong> BEA data, the <strong>in</strong>terested reader should see<br />
Han et al. (2005).<br />
41