White Pine Decline in Maine - The University of Maine - School of ...
White Pine Decline in Maine - The University of Maine - School of ...
White Pine Decline in Maine - The University of Maine - School of ...

You also want an ePaper? Increase the reach of your titles
YUMPU automatically turns print PDFs into web optimized ePapers that Google loves.
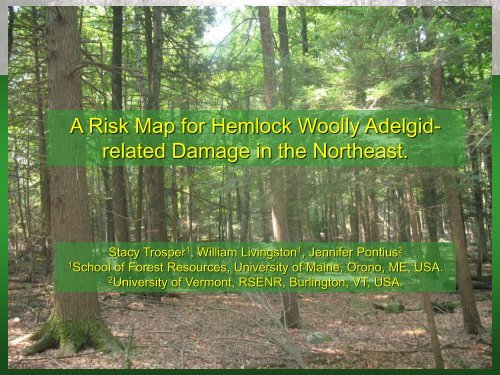
A Risk Map for Hemlock Woolly Adelgidrelated<br />
Damage <strong>in</strong> the Northeast.<br />
Stacy Trosper 1 , William Liv<strong>in</strong>gston 1 , Jennifer Pontius 2<br />
1 <strong>School</strong> <strong>of</strong> Forest Resources, <strong>University</strong> <strong>of</strong> Ma<strong>in</strong>e, Orono, ME, USA.<br />
2 <strong>University</strong> <strong>of</strong> Vermont, RSENR, Burl<strong>in</strong>gton, VT, USA.
Need for HWA Risk Map<br />
• Hemlock Woolly Adelgid<br />
(HWA, Adelges tsugae)<br />
<strong>in</strong>festations appeared <strong>in</strong><br />
Ma<strong>in</strong>e dur<strong>in</strong>g 2000’s<br />
• Future <strong>of</strong> hemlock<br />
uncerta<strong>in</strong><br />
• Provide some guidance<br />
on what is at risk
HWA Impacted by Cold Temperatures<br />
Hemlock Impacted by Drought<br />
Kathleen S. Shields and Carole A. S-J. Cheah.<br />
USDA Forest Service, Hamden, CT<br />
Connecticut Agricultural Experiment Station, W<strong>in</strong>dsor, CT<br />
Drought results <strong>in</strong> mortality spike<br />
Number <strong>of</strong> -25C events <strong>in</strong> Sanford, ME<br />
20<br />
190<br />
15<br />
10<br />
5<br />
Sanford<br />
180<br />
170<br />
160<br />
150<br />
0<br />
1900 1910 1920 1930 1940 1950 1960 1970 1980 1990 2000<br />
140<br />
2010
January M<strong>in</strong>imum Temperature<br />
Related to Range
Hypotheses<br />
• Cold temperatures and<br />
site factors related to<br />
drought stress<br />
determ<strong>in</strong><strong>in</strong>g factors <strong>in</strong><br />
HWA <strong>in</strong>cited decl<strong>in</strong>e<br />
• Tree r<strong>in</strong>g growth<br />
trends can be used to<br />
quantify HWA <strong>in</strong>cited<br />
decl<strong>in</strong>e
Sampl<strong>in</strong>g Plots Along Edge <strong>of</strong><br />
Infestation<br />
Calibration Plots Validation Plots<br />
Infested Non-<strong>in</strong>fest Infested<br />
Region Region Region<br />
41 (276) 7 (45) 15 (103)
• Composite score<br />
– % new growth<br />
– % transparency<br />
– % f<strong>in</strong>e twig dieback<br />
– Live crown ratio<br />
Crown Health Rat<strong>in</strong>g<br />
• Scale <strong>of</strong> 1 (no damage)<br />
to 10 (dead)<br />
• Related to % HWA<br />
<strong>in</strong>festation on twigs<br />
(r=0.87)
Quanify<strong>in</strong>g Increment Growth Trends:<br />
t-score and Percent <strong>Decl<strong>in</strong>e</strong><br />
• Percent <strong>Decl<strong>in</strong>e</strong><br />
(PD) is<br />
100 X (Initial_BAI-<br />
Narrowest_BAI)/<br />
Initial_BAI.<br />
• Related to %HWA<br />
<strong>in</strong>festation (r=0.77)<br />
• Related to CDR<br />
(r=0.86)<br />
• Not related to years<br />
<strong>of</strong> <strong>in</strong>festation<br />
(r=0.47)<br />
BAI<br />
t-score<br />
BAI<br />
(3 Year Runn<strong>in</strong>g Means)<br />
5 10 15 20 25 30<br />
-2 0 2 4 6 8 10<br />
5 10 15 20 25<br />
3 year w<strong>in</strong>dows<br />
used to calculate<br />
t-scores<br />
1985 1990 1995 2000 2005<br />
1985 1990 1995 2000 2005<br />
Bavg<br />
Tmax<br />
1985 1990 1995 2000 2005<br />
year<br />
year<br />
Bm<strong>in</strong><br />
Rmax
Decl<strong>in</strong><strong>in</strong>g Trees Require High Levels <strong>of</strong><br />
Damage
High Crown Damage Related to HWA<br />
Infestation > 10%
• Calculates probability<br />
<strong>of</strong> location be<strong>in</strong>g a<br />
decl<strong>in</strong>e site<br />
• Uses stepwise<br />
procedures<br />
• Selected<br />
– January M<strong>in</strong>imum<br />
Temperature (avg)<br />
– Slope<br />
– Hillshade<br />
Logistical Regression<br />
Predicted Actual<br />
<strong>Decl<strong>in</strong>e</strong><br />
Actual<br />
Nondecl<strong>in</strong>e<br />
Actual<br />
Total<br />
<strong>Decl<strong>in</strong>e</strong> 19.00000 1.00000 20.00000<br />
Non- 1.00000 20.00000 21.00000<br />
decl<strong>in</strong>e<br />
Predicted 20.00000 21.00000 41.00000<br />
Total<br />
Correct 0.95000 0.95238<br />
Total Correct = 0.95122%
Validation Plots<br />
• 15 plots <strong>in</strong> central<br />
Massachusetts<br />
• Percent <strong>Decl<strong>in</strong>e</strong><br />
measured<br />
• Used cluster groups<br />
from calibration plots<br />
– PD47% = <strong>Decl<strong>in</strong>e</strong><br />
Coefficients<br />
Used<br />
50 th<br />
percentile<br />
95 th<br />
percentile<br />
Logistic Model Coefficients and<br />
Prediction Success<br />
<strong>Decl<strong>in</strong>e</strong><br />
Plots<br />
Nondecl<strong>in</strong>e<br />
Plots<br />
4 (3) 6 (0) 2<br />
7 (0) 2 (4) 2<br />
Correct (Incorrect)<br />
Uncerta<strong>in</strong>
Non-decl<strong>in</strong><strong>in</strong>g hemlock stands<br />
not likely outside <strong>of</strong> blue area<br />
HWA <strong>in</strong>cited decl<strong>in</strong>e not<br />
likely <strong>in</strong> blue areas<br />
HWA Probability<br />
<strong>of</strong> <strong>Decl<strong>in</strong>e</strong>
Risk Map Consistent with Recent<br />
Observations
Thanks To:<br />
Conclusions<br />
•Northern spread <strong>of</strong> HWA will be limited by<br />
cold temperatures<br />
•Increment trends calculated as Percent<br />
<strong>Decl<strong>in</strong>e</strong> can quantify HWA damage<br />
•Hemlock grow<strong>in</strong>g on steep slopes with high<br />
solar exposure are more vulnerable to<br />
decl<strong>in</strong>e<br />
• US Forest Service STDP<br />
• Massachusetts Department <strong>of</strong> Conservation<br />
and Recreation