Photocatalytic Water Oxidation with Nonsensitized IrO2 ... - UC Davis
Photocatalytic Water Oxidation with Nonsensitized IrO2 ... - UC Davis
Photocatalytic Water Oxidation with Nonsensitized IrO2 ... - UC Davis

You also want an ePaper? Increase the reach of your titles
YUMPU automatically turns print PDFs into web optimized ePapers that Google loves.
COMMUNICATION<br />
pubs.acs.org/JACS<br />
<strong>Photocatalytic</strong> <strong>Water</strong> <strong>Oxidation</strong> <strong>with</strong> <strong>Nonsensitized</strong> IrO 2 Nanocrystals<br />
under Visible and UV Light<br />
F. Andrew Frame, † Troy K. Townsend, † Rachel L. Chamousis, † Erwin M. Sabio, † Th. Dittrich, ‡<br />
Nigel D. Browning, § and Frank E. Osterloh* ,†<br />
† Department of Chemistry, University of California, <strong>Davis</strong>, One Shields Ave, <strong>Davis</strong>, California 95616, United States<br />
‡ Helmholtz-Zentrum Berlin f€ur Materialien und Energie, Hahn Meitner Platz 1, D-14109 Berlin, Germany<br />
§ Department of Chemical Engineering and Materials Science, University of California, <strong>Davis</strong>, One Shields Avenue, <strong>Davis</strong>,<br />
California 95616, United States<br />
Lawrence Livermore National Laboratory, 7000 East Avenue, Livermore, California 94550, United States<br />
bS Supporting Information<br />
ABSTRACT: Rutile <strong>IrO2</strong> is known as being among the best<br />
electrocatalysts for water oxidation. Here we report on the<br />
unexpected photocatalytic water oxidation activity of<br />
1.98 nm ( 0.11 nm succinic acid-stabilized <strong>IrO2</strong> nanocrystals.<br />
From aqueous persulfate and silver nitrate solution the<br />
nonsensitized particles evolve oxygen <strong>with</strong> initial rates up to<br />
0.96 μmol min 1 , and <strong>with</strong> a quantum efficiency of at least<br />
0.19% (measured at 530 nm). The catalytic process is driven<br />
by visible excitations from the Ir-d(t2g) to the Ir-d(eg) band<br />
(1.5 2.75 eV) and by ultraviolet excitations from the O-p<br />
band to the Ir-d(eg) (>3.0 eV) band. The formation of the<br />
photogenerated charge carriers can be directly observed<br />
<strong>with</strong> surface photovoltage spectroscopy. The results shed<br />
new light on the role of <strong>IrO2</strong> in dye- and semiconductorsensitized<br />
water splitting systems.<br />
Because <strong>IrO2</strong> has a very low electrochemical overpotential for<br />
water oxidation, 1 6 it is widely used in commercial water<br />
electrolyzers and as a cocatalyst in photochemical water splitting<br />
devices. In these systems, which convert abundant solar energy<br />
into renewable hydrogen fuel, <strong>IrO2</strong> is usually connected to a light<br />
absorber, e.g. an inorganic semiconductor 7 10 or a molecular<br />
dye. 4,11 15 Upon optical excitation, the light absorber funnels<br />
holes to the <strong>IrO2</strong> component to facilitate water oxidation, whereas<br />
electrons are absorbed by an electrode or by a sacrificial acceptor.<br />
Here, we report the unexpected finding that ∼2.00-nm succinatestabilized<br />
<strong>IrO2</strong> nanocrystals photocatalyze oxygen formation from<br />
aqueous solutions of sacrificial electron acceptors, <strong>with</strong>out the use<br />
of an external light absorber. Using surface photovoltage spectroscopy,<br />
we show that photochemical charge carriers are formed<br />
when electrons are excited from the Ir-d(t2g) to the Ir-d(eg) band<br />
(1.5 2.75 eV) or from the O-p to the Ir-d(eg) band (>3.0 eV).<br />
Such a photocatalytic function has not been previously observed<br />
for <strong>IrO2</strong>. Succinate-capped <strong>IrO2</strong> nanocrystals were synthesized by hydrolysis<br />
of an aqueous potassium hexachloroiridate (IV) solution<br />
according to the procedure by Hoertz et al. 15 TEM measurements<br />
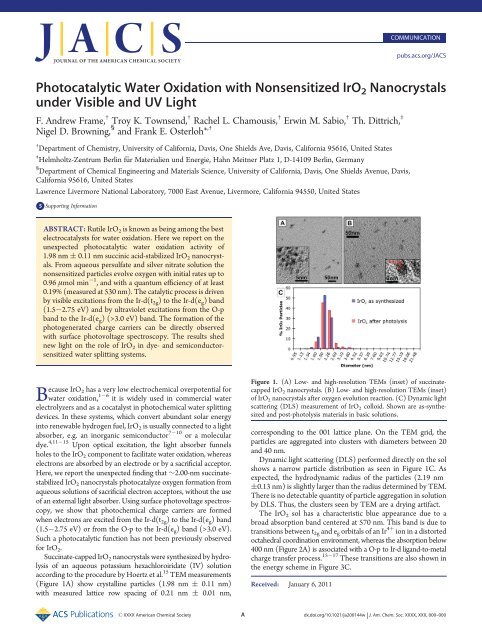
(Figure 1A) show crystalline particles (1.98 nm ( 0.11 nm)<br />
<strong>with</strong> measured lattice row spacing of 0.21 nm ( 0.01 nm,<br />
Figure 1. (A) Low- and high-resolution TEMs (inset) of succinatecapped<br />
<strong>IrO2</strong> nanocrystals. (B) Low- and high-resolution TEMs (inset)<br />
of <strong>IrO2</strong> nanocrystals after oxygen evolution reaction. (C) Dynamic light<br />
scattering (DLS) measurement of <strong>IrO2</strong> colloid. Shown are as-synthesized<br />
and post-photolysis materials in basic solutions.<br />
corresponding to the 001 lattice plane. On the TEM grid, the<br />
particles are aggregated into clusters <strong>with</strong> diameters between 20<br />
and 40 nm.<br />
Dynamic light scattering (DLS) performed directly on the sol<br />
shows a narrow particle distribution as seen in Figure 1C. As<br />
expected, the hydrodynamic radius of the particles (2.19 nm<br />
(0.13 nm) is slightly larger than the radius determined by TEM.<br />
There is no detectable quantity of particle aggregation in solution<br />
by DLS. Thus, the clusters seen by TEM are a drying artifact.<br />
The IrO 2 sol has a characteristic blue appearance due to a<br />
broad absorption band centered at 570 nm. This band is due to<br />
transitions between t2g and eg orbitals of an Ir 4þ ion in a distorted<br />
octahedral coordination environment, whereas the absorption below<br />
400 nm (Figure 2A) is associated <strong>with</strong> a O-p to Ir-d ligand-to-metal<br />
charge transfer process. 15 17 These transitions are also shown in<br />
the energy scheme in Figure 3C.<br />
Received: January 6, 2011<br />
r XXXX American Chemical Society A dx.doi.org/10.1021/ja200144w | J. Am. Chem. Soc. XXXX, XXX, 000–000
Journal of the American Chemical Society COMMUNICATION<br />
Figure 2. (A) UV vis spectra of <strong>IrO2</strong> colloid as synthesized and after<br />
oxygen evolution reaction in sodium persulfate solution. Also shown is<br />
the spectrum of the 530 nm LED used for quantum efficiency measurements.<br />
(B) Surface photovoltage spectrum of <strong>IrO2</strong> nanoparticle film on<br />
Au substrate <strong>with</strong> illumination from Xe lamp (upper spectrum) and<br />
optical absorbance vs photon energy (lower spectrum).<br />
Figure 3. (A) O2 evolution data for <strong>IrO2</strong> nanocrystals (3.7 mg)<br />
suspended in the 100 mL of solutions of sacrificial electron acceptors<br />
under visible (λ > 400 nm) irradiation (300 W Xe lamp). (1) light on,<br />
water (2) light off, 49.2 μmol Na2S2O8(aq) added; (3) light on; (4) light<br />
off, evacuated and backfilled <strong>with</strong> Ar, 98.4 μmol Na2S2O8(aq) added; (5)<br />
light on. (B) O 2 evolution from 10.8 mM Na 2S 2O 8 (λ>400 nm) and<br />
from 10.2 mM AgNO3 (full spectrum). (C) Energy scheme for <strong>IrO2</strong>,<br />
showing optical transitions and electron transfer processes. Reduction<br />
potentials E* are calculated for 1.0 mM Na 2S 2O 8 and for 10.0 mM<br />
AgNO 3.<br />
Surface photovoltage spectroscopy (SPV) gives information<br />
about electronic transitions from which charge separation can<br />
occur. 18 In SPV, a light-induced change of the contact potential of<br />
a sample is recorded as a function of the irradiation wavelength/<br />
energy. This allows one to observe the generation and separation<br />
of photochemical charge carriers in inorganic semiconductors. 19,20<br />
The spectrum obtained for a <strong>IrO2</strong> nanocrystal film on a Au<br />
substrate is shown in Figure 2B (upper diagram). The initial<br />
contact potential is solely determined by the difference of work<br />
functions between the gold reference electrode and the IrO 2 film.<br />
A light-induced change of the contact potential difference<br />
(ΔCPD) sets on at photon energies between 2 and 2.5 eV. The<br />
sign of ΔCPD is positive, which indicates that holes are separated<br />
preferentially toward the Au substrate, leading to negative charge<br />
accumulation in the IrO 2 film (for diagram see inset in Figure 2B).<br />
As the photon energy is increased above 3.0 eV, the contact<br />
potential increases first slowly, and then more strongly. Comparison<br />
<strong>with</strong> the optical absorbance data of the IrO 2 film (bottom<br />
diagram) reveals that the low-energy SPV signal correlates <strong>with</strong><br />
the d d transition at 1.50 2.75 eV. The signal above 3.0 eV<br />
correlates <strong>with</strong> the absorption edge at 3.0 eV, which is due to a<br />
ligand-to-metal charge transfer (MLCT) transition from the O-p<br />
band to the Ir-eg band. These transitions are also shown in the<br />
energy scheme in Figure 3C. In order to produce a SPV signal,<br />
charge carriers need to diffuse to the <strong>IrO2</strong> Au interface, so they<br />
can get separated. According to recent calculations, the <strong>IrO2</strong><br />
valence band has contributions from oxygen 2s, 2p, and iridium<br />
5d states, and the conduction band is made of iridium 5d orbitals. 17<br />
Thus, there exist two separate paths for transport of charge carriers<br />
to the nanocrystal surface.<br />
To probe if the photochemical charge carriers are able to drive a<br />
chemical reaction on the surface of the <strong>IrO2</strong> particles, irradiation<br />
tests were performed on aqueous IrO 2 sols in the presence of<br />
sodium persulfate and silver nitrate as sacrificial electron acceptors<br />
(for reaction details see Supporting Information [SI]). In the first<br />
experiment, an argon sparged and degassed IrO 2 sol(3.7mgof<br />
<strong>IrO2</strong>) at pH 10 was placed in the photoreactor. When the mixture<br />
was irradiated <strong>with</strong> visible light (point 1 in Figure 3A), no oxygen<br />
is produced. A 10 mL aliquot of degassed 4.92 mM Na 2S 2O 8(aq)<br />
(49.2 μmol S2O8 2 ) was then added, and the mixture was kept in<br />
the dark for 30 min to confirm that no O2 evolution took place<br />
(point 2). At point 3, light (>400 nm) was turned on to induce O 2<br />
formation at an initial rate of 0.39 μmol O2 min 1 .Theratethen<br />
declines to zero after 3.5 h. At that point the <strong>IrO2</strong> turnover number<br />
(TON) equals 1.12, and 75.0% of the persulfate has been consumed.<br />
To confirm that the <strong>IrO2</strong> is still catalytically active, the<br />
oxygen was removed in vacuum and another 20.0 mL aliquot of<br />
degassed 4.92 mM Na2S2O8(aq) (98.4 μmol) was added at point 4<br />
<strong>with</strong> stirring, upon which no O2 evolution took place for 30 min. At<br />
point 5 the lamp was turned on again, and O 2 was evolved at a rate of<br />
0.69 μmol O2 min 1 , nearly twice the previous rate. After 2 h the<br />
rate then decreased to almost zero, <strong>with</strong> the <strong>IrO2</strong> reaching TON =<br />
1.76 after 7.0 h total experiment time (310 min total irradiation<br />
time). At that time, the pH was 7.9, and 59.2% of the added<br />
persulfate had been consumed.<br />
To test the influence of the persulfate concentration, a third<br />
irradiation was performed on a fresh batch of <strong>IrO2</strong> in the<br />
presence of 10.8 mmol L 1 of persulfate adjusted <strong>with</strong> 0.1 M<br />
NaOH to an initial pH of 10 (Figure 3B). Even though the<br />
persulfate concentration was ∼10 times higher than in the<br />
previous test, O2 was evolved at 0.75 μmol min 1 , i.e. just<br />
slightly above the rate from before. This shows that the rate of O2<br />
evolution is not limited by the availability of sacrificial acceptor.<br />
When the irradiation was repeated using fresh catalyst under<br />
similar conditions using a high power LED (530 nm, 15.0 mW/<br />
cm 2 , emission spectrum in Figure 2A), an apparent quantum<br />
efficiency of 0.19% was determined. This value represents a<br />
minimum estimate, because of the low absorption coefficient<br />
(at 530 nm) of IrO 2 and the low concentration of the sol.<br />
Inspection of the irradiated <strong>IrO2</strong> sol <strong>with</strong> electron microscopy<br />
and dynamic light scattering revealed no significant changes in<br />
crystallinity and size (Figure 1B/C), or in the optical properties<br />
B dx.doi.org/10.1021/ja200144w |J. Am. Chem. Soc. XXXX, XXX, 000–000
Journal of the American Chemical Society COMMUNICATION<br />
(UV vis spectrum in Figure 2A). These observations support a<br />
catalytic role of the material.<br />
To determine the activity of the sol under UV light, additional<br />
irradiations (Figure 3B) were performed using silver nitrate as<br />
electron acceptor (sodium persulfate is unstable under UV<br />
irradiation). Again, no O2 was evolved in the dark, but in the<br />
presence of UV/visible light, oxygen was evolved at an initial rate<br />
of 0.96 μmol of O2 min 1 , even greater than the rate <strong>with</strong><br />
persulfate (see Figure 3B). However, after 10 min the rate quickly<br />
declined to reach nearly zero after 2 h. At the end of the<br />
experiment the pH was 3.4, and the turnover number was 0.79.<br />
The fast rate decline and the low turnover number are attributed<br />
to the deposition of silver metal onto the surface of the <strong>IrO2</strong><br />
nanocrystals, leading to blockage of sites involved in light<br />
absorption and redox reactions. 21<br />
To obtain insight into the energetics of catalytic oxygen<br />
evolution, electrochemical and photoelectrochemical experiments<br />
were conducted on films of electroflocculated IrO 2<br />
nanocrystals. Dark scans (Figure S2A, SI) on <strong>IrO2</strong> films on an<br />
indium tin oxide electrode reveal an onset potential for water<br />
oxidation at þ1.19 V (pH = 10, 0.5 mA cm 2 ), corresponding to<br />
an overpotential of η ox = þ0.55 V (using E(O 2/OHh)=þ0.64 V<br />
at pH = 10 as a reference). Thus, the succinate-capped <strong>IrO2</strong><br />
nanocrystals appear slightly less effective than similarly made<br />
surfactant-free IrO 2 particles (η ox = 0.25 V), 3 which is a likely<br />
consequence of succinate blocking active sites. Using anodic<br />
scans under chopped irradiation (Figure S2B, SI), the photoonset<br />
potential of IrO 2 is found at þ0.35 V (NHE). This<br />
potential is an estimate for the conduction band edge ECB in<br />
<strong>IrO2</strong>. 7,22,23 It is in reasonable agreement <strong>with</strong> the estimated value<br />
of ECB = þ 0.51 V (NHE) according to the method of Butler and<br />
Ginley (SI). 24,25<br />
The <strong>IrO2</strong> conduction band edge potential can be used to<br />
construct the energy scheme in Figure 3C (compare also Sorantin<br />
et al. 26 ). Here the positions of the valence band edge E VB and of<br />
the metal t2g band edge follow from the optical bandgaps of 3.0 and<br />
1.5 eV respectively. Values for the oxygen reduction potential and<br />
for silver ion and persulfate reduction potentials 27 are also listed,<br />
after correction for pH and concentrations. It can be seen that EVB<br />
and the edge potential of the Ir-t2gband are sufficiently positive to<br />
oxidize water and E CB is sufficiently negative to reduce the<br />
sacrifical acceptors. Thus, photocatalytic O2 evolution can proceed<br />
either by visible excitation of electrons from the Ir-d (t2g)bandor<br />
by UV excitation of electrons from the O-p band into the metal Ird(e<br />
g) band. The greater oxidation potential of the O-p band<br />
suggests that water oxidation under UV irradiation should be faster<br />
than under visible irradiation. This is indeed observed experimentally<br />
during the initial minutes of irradiation (Figure 3B). On the<br />
other hand, the greater rate might also be attributed to the more<br />
positive reduction potential of AgNO3 compared to that of<br />
persulfate (see below). Because at 1.0 mM concentration, the<br />
reduction potential for silver ion (þ0.68 V) is at almost same<br />
position as the water oxidation potential at pH 10 (þ0.64 V),<br />
oxygen formation <strong>with</strong> silver nitrate is nearly thermoneutral.<br />
Under these conditions <strong>IrO2</strong> acts as a photochemical diode that<br />
moves electrons from water to the electron acceptor. When<br />
persulfate is used as electron acceptor, the situation is more<br />
complicated. For persulfate a thermodynamic reduction potential<br />
of 2.01 V is tabulated in the literature. 27 However, persulfate accepts<br />
two electrons at two separate potentials. 28 The first reaction<br />
proceeds at þ0.6 V, producing sulfate and a SO 4 radical. The<br />
relatively low reduction potential for this reduction step is the<br />
reason why mixtures of sodium persulfate and <strong>IrO2</strong> particles do<br />
not spontaneously evolve O2 in the dark, as we observe (Figure S1,<br />
4,7 15<br />
SI, and dark periods in Figure 3A) and as others have noted.<br />
The formed SO4 radical, on the other hand, is a strongly oxidizing<br />
agent (E 0 = þ3.4 V) that could oxidize water <strong>with</strong> or <strong>with</strong>out<br />
participation of <strong>IrO2</strong>. While it is possible that direct water<br />
oxidation by SO4 contributes to the observed O2, itisnot<br />
required as a necessary step to explain O2 evolution in the system.<br />
This is what the results <strong>with</strong> silver nitrate show.<br />
In conclusion we have demonstrated that nonsensitized<br />
succinate-stabilized <strong>IrO2</strong> nanocrystals are active for photocatalytic<br />
O2 evolution from aqueous persulfate and silver nitrate<br />
solutions <strong>with</strong> a quantum efficiency of at least 0.19% (at 530 nm)<br />
and turnover numbers above unity. The process is driven by<br />
visible excitations among Ir-d (t2g) and the Ir-d(eg) bands and by<br />
ultraviolet excitations from the O-p band into the Ir-d(eg) band.<br />
<strong>Photocatalytic</strong> oxygen evolution is aided by low-lying valence<br />
bands at þ3.35 V and þ1.85 V and by a low overpotential for<br />
water oxidation (þ0.55 V at 0.5 mA cm 2 ). The photocatalytic<br />
activity of nano-<strong>IrO2</strong> is unusual, considering the metal-like<br />
electronic structure of this compound. 17 Even though the activity<br />
is very low, it should be considered in the design of water splitting<br />
systems that employ <strong>IrO2</strong> together <strong>with</strong> a sensitizer. Lastly, the<br />
results on nano-<strong>IrO2</strong> suggest that similar photocatalytic activity<br />
may also be found in nanocrystals of other transition metal<br />
oxides, whose valence and conduction band energies are comparable<br />
to those of <strong>IrO2</strong>.<br />
’ ASSOCIATED CONTENT<br />
bS Supporting Information. Full experimental details, background<br />
oxygen evolution data, electrochemical data, and calculation<br />
of the flat band potential. This material is available free of<br />
charge via the Internet at http://pubs.acs.org.<br />
’ AUTHOR INFORMATION<br />
Corresponding Author<br />
fosterloh@ucdavis.edu<br />
’ ACKNOWLEDGMENT<br />
We thank Stephanie R. Dungan (<strong>UC</strong> <strong>Davis</strong>) for use of their<br />
DLS instrument and the National Science Foundation (Grant<br />
0829142) and the U.S. Department of Energy (Grant FG02-<br />
03ER46057) for financial support of this work. FEO thanks the<br />
DAAD (German Academic Exchange Service) for a Faculty<br />
Research Visit Grant.<br />
’ REFERENCES<br />
(1) Yagi, M.; Tomita, E.; Kuwabara, T. J. Electroanal. Chem. 2005,<br />
579 (1), 83.<br />
(2) Hackwood, S.; Schiavone, L. M.; Dautremontsmith, W. C.; Beni,<br />
G. J. Electrochem. Soc. 1981, 128 (12), 2569.<br />
(3) Nakagawa, T.; Beasley, C. A.; Murray, R. W. J. Phys. Chem. C<br />
2009, 113 (30), 12958.<br />
(4) Harriman, A.; Thomas, J. M.; Millward, G. R. New J. Chem. 1987,<br />
11, 757.<br />
(5) Mills, A.; Russell, T. J. Chem. Soc., Faraday Trans. 1991, 87 (8),<br />
1245.<br />
(6) Morris, N. D.; Mallouk, T. E. J. Am. Chem. Soc. 2002, 124 (37),<br />
11114.<br />
C dx.doi.org/10.1021/ja200144w |J. Am. Chem. Soc. XXXX, XXX, 000–000
Journal of the American Chemical Society COMMUNICATION<br />
(7) Ishikawa, A.; Takata, T.; Kondo, J. N.; Hara, M.; Kobayashi, H.;<br />
Domen, K. J. Am. Chem. Soc. 2002, 124 (45), 13547.<br />
(8) Kasahara, A.; Nukumizu, K.; Hitoki, G.; Takata, T.; Kondo, J. N.;<br />
Hara, M.; Kobayashi, H.; Domen, K. J. Phys. Chem. A 2002, 106 (29),<br />
6750.<br />
(9) Iwase, A.; Kato, H.; Kudo, A. Chem. Lett. 2005, 34 (7), 946.<br />
(10) Youngblood, W. J.; Lee, S. H. A.; Kobayashi, Y.; Hernandez-<br />
Pagan, E. A.; Hoertz, P. G.; Moore, T. A.; Moore, A. L.; Gust, D.;<br />
Mallouk, T. E. J. Am. Chem. Soc. 2009, 131 (3), 926.<br />
(11) Harriman, A.; Pickering, I. J.; Thomas, J. M.; Christensen, P. A.<br />
J. Chem. Soc., Faraday Trans. I 1988, 84, 2795.<br />
(12) Harriman, A.; Nahor, G. S.; Mosseri, S.; Neta, P. J. Chem. Soc.,<br />
Faraday Trans. I 1988, 84, 2821.<br />
(13) Hara, M.; Mallouk, T. E. Chem. Commun. 2000, 19, 1903.<br />
(14) Hara, M.; Waraksa, C. C.; Lean, J. T.; Lewis, B. A.; Mallouk,<br />
T. E. J. Phys. Chem. A 2000, 104 (22), 5275.<br />
(15) Hoertz, P. G.; Kim, Y. I.; Youngblood, W. J.; Mallouk, T. E.<br />
J. Phys. Chem. B 2007, 111 (24), 6845.<br />
(16) Goel, A. K.; Skorinko, G.; Pollak, F. H. Phys. Rev. B 1981,<br />
24 (12), 7342.<br />
(17) de Almeida, J. S.; Ahuja, R. Phys. Rev. B 2006, 73 (16), 165102.<br />
(18) Kronik, L.; Shapira, Y. Surf. Sci. Rep. 1999, 37 (1 5), 1.<br />
(19) Gross, D.; Mora-Sero, I.; Dittrich, T.; Belaidi, A.; Mauser, C.;<br />
Houtepen, A. J.; Da Como, E.; Rogach, A. L.; Feldmann, J. J. Am. Chem.<br />
Soc. 2010, 132 (17), 5981.<br />
(20) Mora-Sero, I.; Bisquert, J.; Dittrich, T.; Belaidi, A.; Susha, A. S.;<br />
Rogach, A. L. J. Phys. Chem. C 2007, 111 (40), 14889.<br />
(21) Sabio, E. M.; Chi, M.; Browning, N. D.; Osterloh, F. E.<br />
Langmuir 2010, 26 (10), 7254.<br />
(22) Bard, A. J.; Faulkner, L. R. Electrochemical Methods: Fundamentals<br />
and Applications, 2nd ed.; John Wiley: New York, 2001; p 754.<br />
(23) Akatsuka, K.; Takanashi, G.; Ebina, Y.; Sakai, N.; Haga, M.;<br />
Sasaki, T. J. Phys. Chem. Solids 2008, 69 (5 6), 1288.<br />
(24) Butler, M. A.; Ginley, D. S. J. Electrochem. Soc. 1978, 125 (2),<br />
228.<br />
(25) Xu, Y.; Schoonen, M. A. A. Am. Mineral. 2000, 85 (3 4), 543.<br />
(26) Sorantin, P. I.; Schwarz, K. Inorg. Chem. 1992, 31 (4), 567.<br />
(27) Vanysek, P. CRC Handbook of Chemistry and Physics, 88th<br />
(Internet Version 2008) ed.; Lide, D. R., Ed.; Electrochemical Series,<br />
CRC Press/Taylor and Francis: Boca Raton, FL, 2008.<br />
(28) Memming, R. J. Electrochem. Soc. 1969, 116 (6), 785.<br />
D dx.doi.org/10.1021/ja200144w |J. Am. Chem. Soc. XXXX, XXX, 000–000