the estimation of air pollution from road traffic by transport modeling
the estimation of air pollution from road traffic by transport modeling
the estimation of air pollution from road traffic by transport modeling

You also want an ePaper? Increase the reach of your titles
YUMPU automatically turns print PDFs into web optimized ePapers that Google loves.
intersections. The formalization <strong>of</strong> <strong>the</strong> network is achieved <strong>by</strong> a<br />
planar graph with arcs and nodes, in which <strong>the</strong> <strong>road</strong>s are represented<br />
<strong>by</strong> oriented arcs and <strong>the</strong> junction points <strong>by</strong> nodes. Arcs can be<br />
linked to features such as: direction, length, <strong>traffic</strong> capacity, number<br />
<strong>of</strong> lanes with <strong>the</strong>ir width, impedance. Nodes are associated with<br />
characteristics specific to intersections, such as: <strong>traffic</strong> direction, <strong>the</strong><br />
type signaling, <strong>the</strong> <strong>traffic</strong> light cycle lasting, in <strong>the</strong> case <strong>of</strong><br />
intersections with <strong>traffic</strong> lights.<br />
The demand for <strong>transport</strong> services has a high degree <strong>of</strong> quality<br />
and differentiation [9], [10].<br />
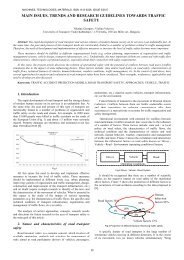
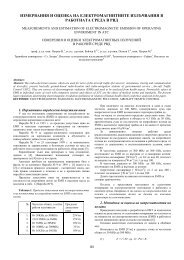
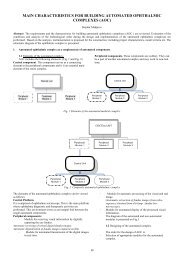
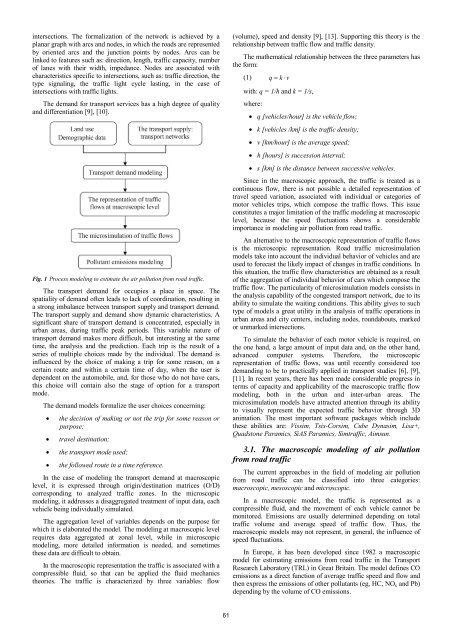
Fig. 1 Process <strong>modeling</strong> to estimate <strong>the</strong> <strong>air</strong> <strong>pollution</strong> <strong>from</strong> <strong>road</strong> <strong>traffic</strong>.<br />
The <strong>transport</strong> demand for occupies a place in space. The<br />
spatiality <strong>of</strong> demand <strong>of</strong>ten leads to lack <strong>of</strong> coordination, resulting in<br />
a strong imbalance between <strong>transport</strong> supply and <strong>transport</strong> demand.<br />
The <strong>transport</strong> supply and demand show dynamic characteristics. A<br />
significant share <strong>of</strong> <strong>transport</strong> demand is concentrated, especially in<br />
urban areas, during <strong>traffic</strong> peak periods. This variable nature <strong>of</strong><br />
<strong>transport</strong> demand makes more difficult, but interesting at <strong>the</strong> same<br />
time, <strong>the</strong> analysis and <strong>the</strong> prediction. Each trip is <strong>the</strong> result <strong>of</strong> a<br />
series <strong>of</strong> multiple choices made <strong>by</strong> <strong>the</strong> individual. The demand is<br />
influenced <strong>by</strong> <strong>the</strong> choice <strong>of</strong> making a trip for some reason, on a<br />
certain route and within a certain time <strong>of</strong> day, when <strong>the</strong> user is<br />
dependent on <strong>the</strong> automobile, and, for those who do not have cars,<br />
this choice will contain also <strong>the</strong> stage <strong>of</strong> option for a <strong>transport</strong><br />
mode.<br />
The demand models formalize <strong>the</strong> user choices concerning:<br />
<strong>the</strong> decision <strong>of</strong> making or not <strong>the</strong> trip for some reason or<br />
purpose;<br />
travel destination;<br />
<strong>the</strong> <strong>transport</strong> mode used;<br />
<strong>the</strong> followed route in a time reference.<br />
In <strong>the</strong> case <strong>of</strong> <strong>modeling</strong> <strong>the</strong> <strong>transport</strong> demand at macroscopic<br />
level, it is expressed through origin/destination matrices (O/D)<br />
corresponding to analyzed <strong>traffic</strong> zones. In <strong>the</strong> microscopic<br />
<strong>modeling</strong>, it addresses a disaggregated treatment <strong>of</strong> input data, each<br />
vehicle being individually simulated.<br />
The aggregation level <strong>of</strong> variables depends on <strong>the</strong> purpose for<br />
which it is elaborated <strong>the</strong> model. The <strong>modeling</strong> at macroscopic level<br />
requires data aggregated at zonal level, while in microscopic<br />
<strong>modeling</strong>, more detailed information is needed, and sometimes<br />
<strong>the</strong>se data are difficult to obtain.<br />
In <strong>the</strong> macroscopic representation <strong>the</strong> <strong>traffic</strong> is associated with a<br />
compressible fluid, so that can be applied <strong>the</strong> fluid mechanics<br />
<strong>the</strong>ories. The <strong>traffic</strong> is characterized <strong>by</strong> three variables: flow<br />
61<br />
(volume), speed and density [9], [13]. Supporting this <strong>the</strong>ory is <strong>the</strong><br />
relationship between <strong>traffic</strong> flow and <strong>traffic</strong> density.<br />
The ma<strong>the</strong>matical relationship between <strong>the</strong> three parameters has<br />
<strong>the</strong> form:<br />
(1) q k v<br />
with: q = 1/h and k = 1/s,<br />
where:<br />
q [vehicles/hour] is <strong>the</strong> vehicle flow;<br />
k [vehicles /km] is <strong>the</strong> <strong>traffic</strong> density;<br />
v [km/hour] is <strong>the</strong> average speed;<br />
h [hours] is succession interval;<br />
s [km] is <strong>the</strong> distance between successive vehicles.<br />
Since in <strong>the</strong> macroscopic approach, <strong>the</strong> <strong>traffic</strong> is treated as a<br />
continuous flow, <strong>the</strong>re is not possible a detailed representation <strong>of</strong><br />
travel speed variation, associated with individual or categories <strong>of</strong><br />
motor vehicles trips, which compose <strong>the</strong> <strong>traffic</strong> flows. This issue<br />
constitutes a major limitation <strong>of</strong> <strong>the</strong> <strong>traffic</strong> <strong>modeling</strong> at macroscopic<br />
level, because <strong>the</strong> speed fluctuations shows a considerable<br />
importance in <strong>modeling</strong> <strong>air</strong> <strong>pollution</strong> <strong>from</strong> <strong>road</strong> <strong>traffic</strong>.<br />
An alternative to <strong>the</strong> macroscopic representation <strong>of</strong> <strong>traffic</strong> flows<br />
is <strong>the</strong> microscopic representation. Road <strong>traffic</strong> microsimulation<br />
models take into account <strong>the</strong> individual behavior <strong>of</strong> vehicles and are<br />
used to forecast <strong>the</strong> likely impact <strong>of</strong> changes in <strong>traffic</strong> conditions. In<br />
this situation, <strong>the</strong> <strong>traffic</strong> flow characteristics are obtained as a result<br />
<strong>of</strong> <strong>the</strong> aggregation <strong>of</strong> individual behavior <strong>of</strong> cars which compose <strong>the</strong><br />
<strong>traffic</strong> flow. The particularity <strong>of</strong> microsimulation models consists in<br />
<strong>the</strong> analysis capability <strong>of</strong> <strong>the</strong> congested <strong>transport</strong> network, due to its<br />
ability to simulate <strong>the</strong> waiting conditions. This ability gives to such<br />
type <strong>of</strong> models a great utility in <strong>the</strong> analysis <strong>of</strong> <strong>traffic</strong> operations in<br />
urban areas and city centers, including nodes, roundabouts, marked<br />
or unmarked intersections.<br />
To simulate <strong>the</strong> behavior <strong>of</strong> each motor vehicle is required, on<br />
<strong>the</strong> one hand, a large amount <strong>of</strong> input data and, on <strong>the</strong> o<strong>the</strong>r hand,<br />
advanced computer systems. Therefore, <strong>the</strong> microscopic<br />
representation <strong>of</strong> <strong>traffic</strong> flows, was until recently considered too<br />
demanding to be to practically applied in <strong>transport</strong> studies [6], [9],<br />
[11]. In recent years, <strong>the</strong>re has been made considerable progress in<br />
terms <strong>of</strong> capacity and applicability <strong>of</strong> <strong>the</strong> macroscopic <strong>traffic</strong> flow<br />
<strong>modeling</strong>, both in <strong>the</strong> urban and inter-urban areas. The<br />
microsimulation models have attracted attention through its ability<br />
to visually represent <strong>the</strong> expected <strong>traffic</strong> behavior through 3D<br />
animation. The most important s<strong>of</strong>tware packages which include<br />
<strong>the</strong>se abilities are: Vissim, Tsis-Corsim, Cube Dynasim, Lisa+,<br />
Quadstone Paramics, SiAS Paramics, Sim<strong>traffic</strong>, Aimsun.<br />
3.1. The macroscopic <strong>modeling</strong> <strong>of</strong> <strong>air</strong> <strong>pollution</strong><br />
<strong>from</strong> <strong>road</strong> <strong>traffic</strong><br />
The current approaches in <strong>the</strong> field <strong>of</strong> <strong>modeling</strong> <strong>air</strong> <strong>pollution</strong><br />
<strong>from</strong> <strong>road</strong> <strong>traffic</strong> can be classified into three categories:<br />
macroscopic, mesoscopic and microscopic.<br />
In a macroscopic model, <strong>the</strong> <strong>traffic</strong> is represented as a<br />
compressible fluid, and <strong>the</strong> movement <strong>of</strong> each vehicle cannot be<br />
monitored. Emissions are usually determined depending on total<br />
<strong>traffic</strong> volume and average speed <strong>of</strong> <strong>traffic</strong> flow. Thus, <strong>the</strong><br />
macroscopic models may not represent, in general, <strong>the</strong> influence <strong>of</strong><br />
speed fluctuations.<br />
In Europe, it has been developed since 1982 a macroscopic<br />
model for estimating emissions <strong>from</strong> <strong>road</strong> <strong>traffic</strong> in <strong>the</strong> Transport<br />
Research Laboratory (TRL) in Great Britain. The model defines CO<br />
emissions as a direct function <strong>of</strong> average <strong>traffic</strong> speed and flow and<br />
<strong>the</strong>n express <strong>the</strong> emissions <strong>of</strong> o<strong>the</strong>r pollutants (eg, HC, NOx and Pb)<br />
depending <strong>by</strong> <strong>the</strong> volume <strong>of</strong> CO emissions.