The Impact of Innovative Activity in Economic Performance: An ...
The Impact of Innovative Activity in Economic Performance: An ...
The Impact of Innovative Activity in Economic Performance: An ...

Create successful ePaper yourself
Turn your PDF publications into a flip-book with our unique Google optimized e-Paper software.
598 International Conference on Applied <strong>Economic</strong>s – ICOAE 2008<br />
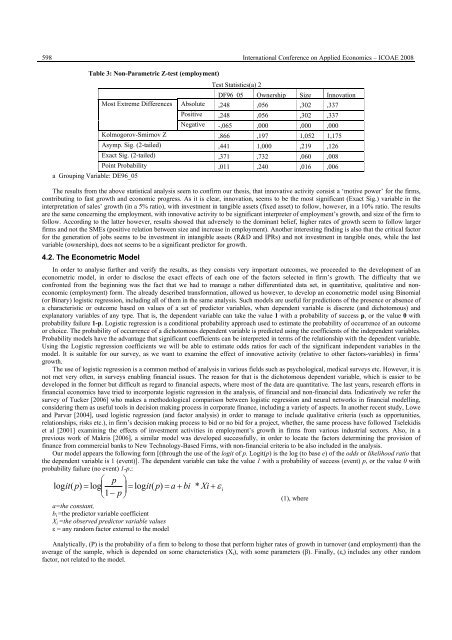
Table 3: Non-Parametric Z-test (employment)<br />
a Group<strong>in</strong>g Variable: DE96_05<br />
Test Statistics(a) 2<br />
DF96_05 Ownership Size Innovation<br />
Most Extreme Differences Absolute ,248 ,056 ,302 ,337<br />
Positive ,248 ,056 ,302 ,337<br />
Negative -,065 ,000 ,000 ,000<br />
Kolmogorov-Smirnov Z ,866 ,197 1,052 1,175<br />
Asymp. Sig. (2-tailed) ,441 1,000 ,219 ,126<br />
Exact Sig. (2-tailed) ,371 ,732 ,060 ,008<br />
Po<strong>in</strong>t Probability ,011 ,240 ,016 ,006<br />
<strong>The</strong> results from the above statistical analysis seem to confirm our thesis, that <strong>in</strong>novative activity consist a ‘motive power’ for the firms,<br />
contribut<strong>in</strong>g to fast growth and economic progress. As it is clear, <strong>in</strong>novation, seems to be the most significant (Exact Sig.) variable <strong>in</strong> the<br />
<strong>in</strong>terpretation <strong>of</strong> sales’ growth (<strong>in</strong> a 5% ratio), with <strong>in</strong>vestment <strong>in</strong> tangible assets (fixed asset) to follow, however, <strong>in</strong> a 10% ratio. <strong>The</strong> results<br />
are the same concern<strong>in</strong>g the employment, with <strong>in</strong>novative activity to be significant <strong>in</strong>terpreter <strong>of</strong> employment’s growth, and size <strong>of</strong> the firm to<br />
follow. Accord<strong>in</strong>g to the latter however, results showed that adversely to the dom<strong>in</strong>ant belief, higher rates <strong>of</strong> growth seem to follow larger<br />
firms and not the SMEs (positive relation between size and <strong>in</strong>crease <strong>in</strong> employment). <strong>An</strong>other <strong>in</strong>terest<strong>in</strong>g f<strong>in</strong>d<strong>in</strong>g is also that the critical factor<br />
for the generation <strong>of</strong> jobs seems to be <strong>in</strong>vestment <strong>in</strong> <strong>in</strong>tangible assets (R&D and IPRs) and not <strong>in</strong>vestment <strong>in</strong> tangible ones, while the last<br />
variable (ownership), does not seems to be a significant predictor for growth.<br />
4.2. <strong>The</strong> Econometric Model<br />
In order to analyse further and verify the results, as they consists very important outcomes, we proceeded to the development <strong>of</strong> an<br />
econometric model, <strong>in</strong> order to disclose the exact effects <strong>of</strong> each one <strong>of</strong> the factors selected <strong>in</strong> firm’s growth. <strong>The</strong> difficulty that we<br />
confronted from the beg<strong>in</strong>n<strong>in</strong>g was the fact that we had to manage a rather differentiated data set, <strong>in</strong> quantitative, qualitative and noneconomic<br />
(employment) form. <strong>The</strong> already described transformation, allowed us however, to develop an econometric model us<strong>in</strong>g B<strong>in</strong>omial<br />
(or B<strong>in</strong>ary) logistic regression, <strong>in</strong>clud<strong>in</strong>g all <strong>of</strong> them <strong>in</strong> the same analysis. Such models are useful for predictions <strong>of</strong> the presence or absence <strong>of</strong><br />
a characteristic or outcome based on values <strong>of</strong> a set <strong>of</strong> predictor variables, when dependent variable is discrete (and dichotomous) and<br />
explanatory variables <strong>of</strong> any type. That is, the dependent variable can take the value 1 with a probability <strong>of</strong> success p, or the value 0 with<br />
probability failure 1-p. Logistic regression is a conditional probability approach used to estimate the probability <strong>of</strong> occurrence <strong>of</strong> an outcome<br />
or choice. <strong>The</strong> probability <strong>of</strong> occurrence <strong>of</strong> a dichotomous dependent variable is predicted us<strong>in</strong>g the coefficients <strong>of</strong> the <strong>in</strong>dependent variables.<br />
Probability models have the advantage that significant coefficients can be <strong>in</strong>terpreted <strong>in</strong> terms <strong>of</strong> the relationship with the dependent variable.<br />
Us<strong>in</strong>g the Logistic regression coefficients we will be able to estimate odds ratios for each <strong>of</strong> the significant <strong>in</strong>dependent variables <strong>in</strong> the<br />
model. It is suitable for our survey, as we want to exam<strong>in</strong>e the effect <strong>of</strong> <strong>in</strong>novative activity (relative to other factors-variables) <strong>in</strong> firms’<br />
growth.<br />
<strong>The</strong> use <strong>of</strong> logistic regression is a common method <strong>of</strong> analysis <strong>in</strong> various fields such as psychological, medical surveys etc. However, it is<br />
not met very <strong>of</strong>ten, <strong>in</strong> surveys enabl<strong>in</strong>g f<strong>in</strong>ancial issues. <strong>The</strong> reason for that is the dichotomous dependent variable, which is easier to be<br />
developed <strong>in</strong> the former but difficult as regard to f<strong>in</strong>ancial aspects, where most <strong>of</strong> the data are quantitative. <strong>The</strong> last years, research efforts <strong>in</strong><br />
f<strong>in</strong>ancial economics have tried to <strong>in</strong>corporate logistic regression <strong>in</strong> the analysis, <strong>of</strong> f<strong>in</strong>ancial and non-f<strong>in</strong>ancial data. Indicatively we refer the<br />
survey <strong>of</strong> Tucker [2006] who makes a methodological comparison between logistic regression and neural networks <strong>in</strong> f<strong>in</strong>ancial modell<strong>in</strong>g,<br />
consider<strong>in</strong>g them as useful tools <strong>in</strong> decision mak<strong>in</strong>g process <strong>in</strong> corporate f<strong>in</strong>ance, <strong>in</strong>clud<strong>in</strong>g a variety <strong>of</strong> aspects. In another recent study, Lowe<br />
and Parvar [2004], used logistic regression (and factor analysis) <strong>in</strong> order to manage to <strong>in</strong>clude qualitative criteria (such as opportunities,<br />
relationships, risks etc.), <strong>in</strong> firm’s decision mak<strong>in</strong>g process to bid or no bid for a project, whether, the same process have followed Tselekidis<br />
et al [2001] exam<strong>in</strong><strong>in</strong>g the effects <strong>of</strong> <strong>in</strong>vestment activities <strong>in</strong> employment’s growth <strong>in</strong> firms from various <strong>in</strong>dustrial sectors. Also, <strong>in</strong> a<br />
previous work <strong>of</strong> Makris [2006], a similar model was developed successfully, <strong>in</strong> order to locate the factors determ<strong>in</strong><strong>in</strong>g the provision <strong>of</strong><br />
f<strong>in</strong>ance from commercial banks to New Technology-Based Firms, with non-f<strong>in</strong>ancial criteria to be also <strong>in</strong>cluded <strong>in</strong> the analysis.<br />
Our model appears the follow<strong>in</strong>g form [(through the use <strong>of</strong> the logit <strong>of</strong> p. Logit(p) is the log (to base e) <strong>of</strong> the odds or likelihood ratio that<br />
the dependent variable is 1 (event)]. <strong>The</strong> dependent variable can take the value 1 with a probability <strong>of</strong> success (event) p, or the value 0 with<br />
probability failure (no event) 1-p.:<br />
⎛ p ⎞<br />
logit( p)<br />
= log⎜<br />
⎟ = logit(<br />
p)<br />
= a + bi * Xi + ε i<br />
⎝1−<br />
p ⎠<br />
a=the constant,<br />
bi =the predictor variable coefficient<br />
X i =the observed predictor variable values<br />
ε = any random factor external to the model<br />
(1), where<br />
<strong>An</strong>alytically, (P) is the probability <strong>of</strong> a firm to belong to those that perform higher rates <strong>of</strong> growth <strong>in</strong> turnover (and employment) than the<br />
average <strong>of</strong> the sample, which is depended on some characteristics (X i), with some parameters (β). F<strong>in</strong>ally, (ε ι) <strong>in</strong>cludes any other random<br />
factor, not related to the model.