Non-Resident International Arrivals at California Ports of Entry ...
Non-Resident International Arrivals at California Ports of Entry ...
Non-Resident International Arrivals at California Ports of Entry ...

Create successful ePaper yourself
Turn your PDF publications into a flip-book with our unique Google optimized e-Paper software.
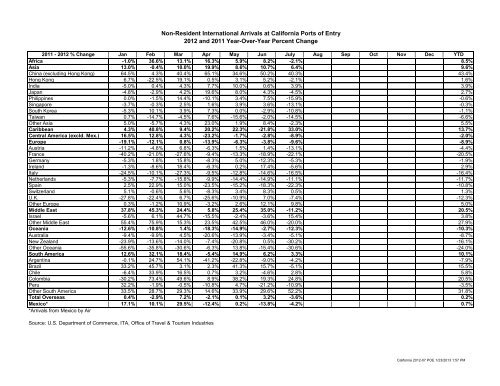
2011 - 2012 % Change Jan Feb Mar Apr May Jun July Aug Sep Oct Nov Dec YTD<br />
Africa -1.0% 36.6% 13.1% 16.3% 5.9% 8.2% -2.1% 8.5%<br />
Asia 13.0% -0.4% 10.0% 19.9% 8.6% 10.7% 6.4% 9.6%<br />
China (excluding Hong Kong) 64.5% 4.3% 40.4% 65.1% 34.6% 50.2% 40.3% 43.4%<br />
Hong Kong 6.7% -22.5% 19.1% 0.5% 3.1% 5.2% -2.1% 1.6%<br />
India -5.0% 0.4% 4.3% 7.7% 10.0% 0.6% 3.9% 3.9%<br />
Japan -4.8% -2.9% 4.2% 19.6% 8.0% 4.3% -4.5% 2.7%<br />
Philippines 0.0% -1.5% 14.4% -10.1% 3.4% 7.5% -15.9% -0.6%<br />
Singapore -3.7% -0.3% 2.5% 1.6% 3.9% 3.6% -13.1% -0.3%<br />
South Korea -5.3% 10.1% 3.9% 7.3% 0.0% -2.9% -10.8% -1.1%<br />
Taiwan 0.7% -14.7% -4.5% 7.6% -15.6% -2.0% -14.5% -6.6%<br />
Other Asia 5.0% -5.7% 4.3% 23.0% 1.9% 8.4% -2.3% 5.5%<br />
Caribbean 4.3% 40.8% 9.4% 20.2% 22.3% -21.8% 33.0% 13.7%<br />
Central America (excld. Mex.) 16.5% 12.8% 4.3% -23.2% -1.7% -2.8% -8.9% -2.0%<br />
Europe -19.1% -12.1% 0.8% -13.9% -6.3% -3.8% -9.6% -8.9%<br />
Austria -11.2% -4.8% 6.8% -6.3% 1.5% 1.4% -13.1% -4.4%<br />
France -40.2% -21.0% -27.6% -9.4% -13.3% -18.9% -22.1% -20.5%<br />
Germany -5.3% 1.8% 15.8% -8.3% 5.0% -12.3% -5.3% -1.9%<br />
Ireland -1.3% -8.6% 18.4% -6.3% 0.2% 17.4% -5.6% 2.9%<br />
Italy -24.5% -10.1% -27.3% -9.5% -12.8% -14.6% -16.5% -16.4%<br />
Netherlands -5.3% -7.7% -15.8% -9.9% -14.4% -14.9% -11.1% -11.7%<br />
Spain 2.5% 22.9% 15.0% -23.5% -15.2% -18.3% -22.3% -10.8%<br />
Switzerland 5.1% -0.6% 5.6% -8.3% 3.4% 8.3% 0.5% 1.3%<br />
U.K. -27.8% -22.4% 6.7% -25.6% -10.9% 7.0% -7.4% -12.3%<br />
Other Europe 0.3% -1.2% 10.9% -3.2% 2.6% 12.1% 9.8% 5.0%<br />
Middle East 37.8% 45.3% 24.4% 5.8% 25.4% 35.0% -11.2% 20.5%<br />
Israel -5.6% 6.1% 44.7% -15.5% -2.4% -3.6% 15.4% 3.8%<br />
Other Middle East 55.4% 75.9% 15.3% 23.5% 42.5% 46.0% -20.0% 27.9%<br />
Oceania -12.6% -10.8% 1.4% -18.3% -14.9% -2.7% -12.3% -10.3%<br />
Australia -9.4% -9.9% 4.5% -20.6% -13.9% -3.4% -5.1% -8.7%<br />
New Zealand -23.9% -13.6% -14.0% -7.4% -20.8% 0.5% -30.2% -16.1%<br />
Other Oceania -55.6% -35.8% -30.6% -6.3% 13.8% -15.4% -30.6% -24.0%<br />
South America 12.6% 32.1% 18.4% -5.4% 14.9% 6.2% 3.3% 10.1%<br />
Argentina -0.1% 24.7% 54.1% -41.2% -22.8% -9.0% -4.2% -7.9%<br />
Brazil 33.2% 45.7% 3.1% 2.3% 41.3% 15.7% -5.1% 15.5%<br />
Chile -6.4% 33.9% 16.5% 0.7% 3.2% -4.6% 2.8% 5.8%<br />
Colombia -30.2% 73.4% 49.6% 8.9% 38.2% 19.3% 24.8% 20.5%<br />
Peru 32.2% -1.9% -0.5% -10.8% 4.7% -21.2% -10.9% -3.5%<br />
Other South America 33.5% 28.7% 29.3% 14.6% 33.9% 29.6% 52.2% 31.8%<br />
Total Overseas 0.4% -2.9% 7.2% -2.1% 0.1% 3.2% -3.6% 0.2%<br />
Mexico* 17.1% 10.1% 29.5% -12.4% 0.2% -13.8% -4.2% 0.7%<br />
*<strong>Arrivals</strong> from Mexico by Air<br />
Source: U.S. Department <strong>of</strong> Commerce, ITA, Office <strong>of</strong> Travel & Tourism Industries<br />
<strong>Non</strong>-<strong>Resident</strong> <strong>Intern<strong>at</strong>ional</strong> <strong>Arrivals</strong> <strong>at</strong> <strong>California</strong> <strong>Ports</strong> <strong>of</strong> <strong>Entry</strong><br />
2012 and 2011 Year-Over-Year Percent Change<br />
<strong>California</strong> 2012-07 POE 1/23/2013 1:57 PM