Identification and Quantification of Estrogen Receptor Agonists in ...
Identification and Quantification of Estrogen Receptor Agonists in ...
Identification and Quantification of Estrogen Receptor Agonists in ...

Create successful ePaper yourself
Turn your PDF publications into a flip-book with our unique Google optimized e-Paper software.
TABLE 1. Extract Concentrations <strong>and</strong> 17-Estradiol Equivalents (EEQs) (ng/mL) c<br />
location date NP OP NPE E2 EE2 NP/OP-EEQ a E2/EE2-EEQ b<br />
LV Wash 4/30/97 4560 172<br />
Lake Mead<br />
36000 10.70 1.92 0.061 10.9<br />
LV Bay 4/30/97 3000 108 19400 8.84 2.08 0.040 9.05<br />
9/5/97 640 ND 12710 0.752 1.01 0.008 0.86<br />
LV Mar<strong>in</strong>a 9/5/97 ND ND ND 1.08 ND NA 1.08<br />
Saddle Isl<strong>and</strong> 4/30/97 ND ND ND ND ND NA NA<br />
Callville Bay 9/5/97 ND ND ND<br />
Trenton Channel<br />
ND ND NA NA<br />
WWTP 8/30/97 1916 20 21600 4.26 ND 0.024 4.26<br />
Chem. 8/30/97 3450 60 29200 3.64 ND 0.044 3.64<br />
B. Lagoon 8/30/97 3740 264 34700 5.18 1.44 0.052 5.30<br />
M. Creek 8/30/97 4740 324 71260<br />
WWTPs<br />
4.24 ND 0.066 4.25<br />
BV-upstream 10/8/97 ND ND ND 2.50 ND NA 2.50<br />
BV-effluent 10/8/97 148000 2350 1160000 14.6 3.04 1.90 14.9<br />
MA-upstream 10/8/97 ND ND ND ND ND NA NA<br />
MA-effluent 10/8/97 2065 64 19400 3.62 1.43 0.027 3.77<br />
ER-upstream 10/8/97 ND ND ND ND ND NA NA<br />
ER-effluent 10/8/97 680 ND ND 1.90 ND 0.009 1.90<br />
a Nonylphenol <strong>and</strong> octylphenol-derived 17-estradiol equivalents. NP/OP-EEQ ) (NPrelative potency(REP) × NPconcentration) + (OPREP × OPconcentration).<br />
NPREP ) 1.25 × 10 -5 .OPREP ) 1.9 × 10 -5 . A REP estimate was not available for NPE; therefore, it was not considered when deriv<strong>in</strong>g EEQ estimates.<br />
b Estradiol <strong>and</strong> ethynylestradiol-derived 17-estradiol equivalents. E2/EE2-EEQ ) (E2REP × E2concentratration) + (EE2REP × EE2concentration). E2REP ) 1.0.<br />
EE2REP ) 0.10. c ND ) not detectable; NA ) not applicable<br />
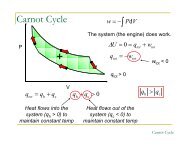
FIGURE 3. F<strong>in</strong>e fractionation <strong>of</strong> LV Bay, Lake Mead (April), F3 extract<br />
us<strong>in</strong>g RP-HPLC with fluorescence detection followed by luciferase<br />
<strong>in</strong>duction <strong>in</strong> the MVLN cell bioassay (estrogen responsive) by the<br />
correspond<strong>in</strong>g fractions. Response magnitude presented as percentage<br />
<strong>of</strong> the average maximum response observed for a 1000 pM<br />
17-estradiol st<strong>and</strong>ard (%-E2-max). Horizontal l<strong>in</strong>es represent ( 3<br />
SD from the mean solvent control response (set to 0%-E2-max).<br />
the samples (Tables 1 <strong>and</strong> 2). The ER agonist potency <strong>of</strong> EE2<br />
relative to E2 for luciferase <strong>in</strong>duction <strong>in</strong> the MVLN assay<br />
previously has been reported to be approximately 0.1 (25).<br />
Based on the concentrations <strong>of</strong> E2 <strong>and</strong> EE2, <strong>and</strong> their<br />
correspond<strong>in</strong>g relative potencies, samples collected from LV<br />
Wash <strong>and</strong> LV Bay <strong>in</strong> April 1997 were estimated to conta<strong>in</strong><br />
10.9 <strong>and</strong> 9.05 ng E2/EE2-derived EEQ/mL, respectively. These<br />
concentrations should have yielded doses <strong>of</strong> approximately<br />
50 <strong>and</strong> 41 fmol EEQ/well <strong>in</strong> the MVLN bioassay. Based on<br />
regression aga<strong>in</strong>st an E2 st<strong>and</strong>ard curve, such doses would<br />
be expected to yield responses <strong>of</strong> approximately 92% <strong>and</strong><br />
88% E2-max, respectively. Based on the range <strong>of</strong> uncerta<strong>in</strong>ty<br />
<strong>in</strong> the predicted responses (Table 2) <strong>and</strong> the variability <strong>of</strong> the<br />
observed bioassay responses (Figure 1c), the responses<br />
observed for the samples collected from LV Wash <strong>and</strong> LV<br />
Bay <strong>in</strong> April 1997 were not markedly different from predicted<br />
responses. Thus, the known E2 <strong>and</strong> EE2 composition <strong>of</strong> F3<br />
<strong>of</strong> the samples collected from LV Wash <strong>and</strong> LV Bay appeared<br />
to account for all the ER agonist potency observed. Additional<br />
TABLE 2. Extract 17-Estradiol Equivalents (EEQs) (ng/mL) <strong>and</strong><br />
Predicted MVLN Responses e<br />
location date<br />
NP/OP-<br />
EEQ a<br />
predicted<br />
response b<br />
E2/EE2-<br />
EEQ c<br />
predicted<br />
response d<br />
LV Wash 4/30/97<br />
Lake Mead<br />
0.061 0 10.9 92<br />
LV Bay 4/30/97 0.040 0 9.05 88<br />
9/5/97 0.008 0 0.86 35<br />
LV Mar<strong>in</strong>a 9/5/97 NA NA 1.08 41<br />
Saddle Isl<strong>and</strong> 4/30/97 NA NA NA NA<br />
Callville Bay 9/5/97 NA NA NA NA<br />
Trenton Channel<br />
WWTP 8/30/97 0.024 0 4.26 71<br />
Chem. 8/30/97 0.044 0 3.64 68<br />
B. Lagoon 8/30/97 0.052 0 5.30 76<br />
M. Creek 8/30/97 0.066<br />
WWTPs<br />
0 4.25 71<br />
BV-upstream 10/8/97 NA NA 2.50 59<br />
BV-effluent 10/8/97 1.90 53 14.9 99<br />
MA-upstream 10/8/97 NA NA NA NA<br />
MA-effluent 10/8/97 0.027 0 3.77 68<br />
ER-upstream 10/8/97 NA NA NA NA<br />
ER-effluent 10/8/97 0.009 0 1.90 53<br />
a Nonylphenol <strong>and</strong> octylphenol-derived 17-estradiol equivalents.<br />
NP/OP-EEQ ) (NPrelative potency (REP) × NPconcentration) + (OPREP × OPconcentration).<br />
NPREP ) 1.25 × 10 -5 .OPREP ) 1.9 × 10 -5 . A REP estimate was not available<br />
for NPE; therefore, it was not considered when deriv<strong>in</strong>g EEQ estimates.<br />
b MVLN bioassay response magnitudes predicted based on regression<br />
<strong>of</strong> NP/OP-derived EEQ aga<strong>in</strong>st a 17-estradiol st<strong>and</strong>ard curve. Units are<br />
%E2-max. c Estradiol <strong>and</strong> ethynylestradiol-derived 17-estradiol equivalents.<br />
E2/EE2-EEQ ) (E2REP × E2concentration) + (EE2REP × EE2concentration).<br />
E2REP ) 1.0. EE2REP ) 0.10. d MVLN bioassay response magnitudes<br />
predicted based on regression <strong>of</strong> E2/EE2-derived EEQ aga<strong>in</strong>st a 17estradiol<br />
st<strong>and</strong>ard curve. Units are %E2-max. e NA ) not applicable.<br />
Note: total EEQ ) NP/OP-EEQ + E2/EE2-EEQ. Predicted bioassay<br />
response magnitudes are not additive.<br />
fractionation <strong>of</strong> the F3 extracts from LV Wash <strong>and</strong> LV Bay<br />
revealed that all <strong>of</strong> the ER agonist potency was associated<br />
with the f<strong>in</strong>e fractions (FFs) 3 <strong>and</strong> 4, which equate roughly<br />
to the retention times <strong>of</strong> E2 <strong>and</strong> EE2 (Figures 2 <strong>and</strong> 3). FFs<br />
3 <strong>and</strong> 4 from the F3 extract <strong>of</strong> the LV Wash sample were<br />
collected, comb<strong>in</strong>ed, <strong>and</strong> fractionated aga<strong>in</strong> by RP-HPLC<br />
us<strong>in</strong>g a slower flow rate <strong>and</strong> solvent gradient to separate E2<br />
<strong>and</strong> EE2 (Figure 4). ER agonist potency was observed <strong>in</strong> f<strong>in</strong>e<br />
fractions where E2 <strong>and</strong> EE2 elute, <strong>and</strong> the magnitude <strong>of</strong><br />
VOL. 35, NO. 18, 2001 / ENVIRONMENTAL SCIENCE & TECHNOLOGY 9 3623