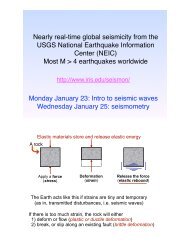
SEISMOMETERS, SEISMOGRAPHS, SEISMOGRAMS 1. What is a ...
SEISMOMETERS, SEISMOGRAPHS, SEISMOGRAMS 1. What is a ...
SEISMOMETERS, SEISMOGRAPHS, SEISMOGRAMS 1. What is a ...

You also want an ePaper? Increase the reach of your titles
YUMPU automatically turns print PDFs into web optimized ePapers that Google loves.
<strong>SEISMOMETERS</strong>, <strong>SEISMOGRAPHS</strong>, <strong>SEISMOGRAMS</strong><br />
<strong>1.</strong> <strong>What</strong> <strong>is</strong> a se<strong>is</strong>mometer?<br />
2. <strong>What</strong> <strong>is</strong> a se<strong>is</strong>mograph?<br />
3. <strong>What</strong> <strong>is</strong> a se<strong>is</strong>mogram
A se<strong>is</strong>mometer <strong>is</strong> a mechanical device that<br />
measures and amplifies ground motion at a point<br />
on the Earth’s surface or in a borehole
A modern se<strong>is</strong>mograph records ground<br />
motion (from a se<strong>is</strong>mometer) in digital format<br />
onto magnetic or optical d<strong>is</strong>k
A se<strong>is</strong>mogram <strong>is</strong> a<br />
v<strong>is</strong>ual representation<br />
of ground motion at a<br />
point in space as a<br />
function of time
<strong>SEISMOMETERS</strong> MEASURE GROUND MOTIONS<br />
> ground motions can be described and measured<br />
in different ways:<br />
<strong>1.</strong> ground d<strong>is</strong>placement<br />
2. ground velocity<br />
3. ground acceleration<br />
Q<strong>1.</strong> How are they related?<br />
Q2. Which <strong>is</strong> most useful?
d<strong>is</strong>placement<br />
velocity<br />
acceleration<br />
u(t)<br />
du(t)<br />
dt<br />
d 2 u(t)<br />
dt 2
damage ~ force ~ acceleration<br />
During large earthquakes, accelerations<br />
can approach or even exceed gravity
SEISMOMETRY EXERCISE<br />
> ground motions provide much important information<br />
on both earthquakes and Earth structure<br />
>NO se<strong>is</strong>mometer provides a perfect representation<br />
of ground motion, each one has an (imperfect) response<br />
> we will derive response for a simple damped pendulum<br />
se<strong>is</strong>mometer<br />
> GROUP EXERCISE: I want you to analyse th<strong>is</strong> response<br />
to see how true ground motions are modified by<br />
se<strong>is</strong>mometer
SHORT/LONG PERIOD <strong>SEISMOMETERS</strong> &<br />
GEOPHONES<br />
> used prior to 1990’s<br />
> work on damped pendulum<br />
theory<br />
> resonant frequency at 1 Hz,<br />
0.1 Hz<br />
> mass incorporates solenoid<br />
which moves in a magnetic field<br />
> Faraday’s law states<br />
ɛ = − dΦ<br />
dt<br />
∼ dv<br />
dt
MODERN BROADBAND <strong>SEISMOMETERS</strong><br />
> record motions faithfully<br />
between 100 - 0.001 Hz<br />
> driven by soph<strong>is</strong>ticated<br />
feedback electronic circuits<br />
> motion <strong>is</strong> measured<br />
through voltage required to<br />
keep masses stationary
STRONG MOTION <strong>SEISMOGRAPHS</strong><br />
> made from MEMS &<br />
sensitive to large accelerations<br />
> regular se<strong>is</strong>mometers go<br />
off scale<br />
> used in triggered mode to<br />
study effects of large eq’s<br />
> employed by engineers to<br />
aid in design of earthquake<br />
res<strong>is</strong>tant infrastructure
SEISMIC NETWORKS<br />
> arrays of se<strong>is</strong>mometers deployed for a common<br />
purpose<br />
<strong>1.</strong> Global Se<strong>is</strong>mic Network<br />
2. Regional Networks<br />
3. Portable Arrays<br />
4. EarthScope
GLOBAL SEISMIC NETWORKS<br />
> 150+ stations globally d<strong>is</strong>tributed<br />
> high quality stations with detection limit ~M=4<br />
> partly underwritten by military agencies to aid in<br />
nuclear test ban verification treaties
UNDER GROUND VAULT -<br />
KYRGYZSTAN<br />
> note thermal insulation, concrete bunker
SOUTH POLE SITE<br />
> some sites involve se<strong>is</strong>mometers in boreholes to<br />
minimize no<strong>is</strong>e
PITCAIRN ISLAND SITE<br />
> most communications by satellite
HIGH PRECISION <strong>SEISMOMETERS</strong><br />
> highly sensitive : -200 <strong>is</strong> equivalent to what acceleration?
x = 10 −10 m s −2
REGIONAL SEISMOGRAPH NETWORKS<br />
> Japanese Hi-Net has<br />
over 600 short-period,<br />
borehole stations<br />
> since 2000, has led to<br />
many important<br />
d<strong>is</strong>coveries<br />
> 10-20 km spacing
CANADIAN NATIONAL SEISMOGRAPH<br />
NETWORK (B.C.)<br />
> G.S.C. operates ~30<br />
se<strong>is</strong>mographs in SW<br />
B.C.<br />
> note concentration<br />
on V.I. and lower<br />
mainland
PACIFIC NORTHWEST SEISMIC<br />
NETWORK<br />
> UW operates ~100 sp<br />
and ~10-20 BB sites<br />
through Washington and<br />
Oregon<br />
> significant data exchange<br />
between CNSN and<br />
PNSN
STRONG MOTION<br />
SITES - SW BC
PORTABLE ARRAYS<br />
> many countries possess<br />
portable instruments used<br />
for temporary field campaigns<br />
> Canada: POLARIS (Portable<br />
Observatories for Lithospheric<br />
Analys<strong>is</strong> and Research<br />
Investigating Se<strong>is</strong>micity<br />
> can be used in aftershock or<br />
structural studies<br />
45 o N<br />
50 o N<br />
55 o N<br />
60 o N<br />
65 o N<br />
BATHOLITHS<br />
CANOE<br />
CNSN<br />
POLARIS<br />
OTHERS<br />
144 o W 136 o W 128 o W 120 o W 112 o W
makeshift<br />
vaults with solar<br />
power<br />
> data archived onto<br />
loggers that record<br />
continuously<br />
> typical deployment<br />
1-2 years<br />
PORTABLE ARRAY VAULTS
new generation of portable experiment; cover whole<br />
USA at 70 km spacing<br />
> each station active for 18 months, deployed roll-along<br />
array over 15 years
<strong>SEISMOGRAMS</strong><br />
> incredibly rich and varied in appearance depending on<br />
source, frequency content, d<strong>is</strong>tance etc.
Many ways to extract information from se<strong>is</strong>mogram:<br />
<strong>1.</strong> Identify main phases, extract time/amplitude<br />
2. Identify scattered phases<br />
3. Match whole se<strong>is</strong>mogram<br />
Use information to extract knowledge of earthquake and/or<br />
earth structure
T > 10 s<br />
> dominated by<br />
S and surface waves<br />
> simple to model<br />
LONG PERIOD<br />
<strong>SEISMOGRAMS</strong>
REGIONAL <strong>SEISMOGRAMS</strong><br />
> higher frequency (>1Hz), more complex, harder<br />
to identify individual P, S, surface waves
PRIMARY PHASES<br />
> at global scale Earth looks like layered sphere<br />
> readily predictable se<strong>is</strong>mic phases propagating through<br />
crust, mantle, outer core, inner core
equires knowledge<br />
knowledge of model<br />
for both source and<br />
struture<br />
> data: black, model<br />
red<br />
> at long periods (gt<br />
10 s) we can model<br />
se<strong>is</strong>mograms well,<br />
not so at short<br />
periods (lt 1s)<br />
WAVEFORM MATCHING<br />
05/03/28 (Mw 8.5) , Sumatra Earthquake
SEISMIC REFLECTION IMAGING<br />
> se<strong>is</strong>mic reflections/conversions originate from<br />
d<strong>is</strong>continuities in velocity/density<br />
> primary tool for hydrocarbon exploration
TELESEISMIC IMAGING<br />
> waves generated by earthquakes and scattered from<br />
d<strong>is</strong>continuties can be used to image e.g. subduction<br />
zones
TRAVELTIME TOMOGRAPHY<br />
t1 = 3s<br />
V1<br />
> 2 blocks (1 m X 1 m) with unknown velocities<br />
> 2 traveltime measurements<br />
> can you determine ?<br />
V1, V2<br />
t1, t2<br />
V2<br />
t2 = 5s<br />
V1, V2
t1<br />
t2<br />
<br />
=<br />
SOLUTION<br />
<strong>1.</strong> Solve for V1 using t1 : V1 = 0.3333 m/s<br />
2. Insert in solve for :<br />
OR<br />
Solve matrix equation<br />
3<br />
5<br />
V2<br />
<br />
=<br />
V2 = 0.5 m/s<br />
1 0<br />
1 1<br />
1<br />
V1<br />
1<br />
V2
modern global<br />
tomography<br />
incorporates<br />
information from<br />
many phases<br />
including CMB/<br />
surface reflections<br />
TRAVELTIMES OF MAJOR PHASES<br />
(a)<br />
TUC 88.8°<br />
(b)<br />
Mantle shear-wave tomography 2477<br />
S SS<br />
SSS<br />
SS<br />
SSSSS<br />
SSSS<br />
300 s<br />
S<br />
ScS<br />
SKS<br />
SSS<br />
SSSS<br />
d<strong>is</strong>tance: 88.8°<br />
velocity model: TNA<br />
Figure <strong>1.</strong> (a) A horizontally polarized se<strong>is</strong>mogram recorded in the western United States from<br />
an earthquake that occurred in the southern Pacific Ocean. Below the se<strong>is</strong>mogram <strong>is</strong> a synthetic<br />
se<strong>is</strong>mogram. Numerous phases that have good matches between the synthetic and data are<br />
labelled. The large arrival at the end of the se<strong>is</strong>mogram <strong>is</strong> the Love wave that cons<strong>is</strong>ts of SSSSS<br />
and higher-order multiples of S. Part (b) shows the paths taken by the phases labelled at the<br />
top, as well as the paths of phases that interact with the core, which, although not v<strong>is</strong>ible in
GLOBAL SEISMIC TOMOGRAPHY<br />
> model Earth as many<br />
constant velocity elements<br />
> each measured time<br />
represents a ray and an<br />
equation<br />
> 1,000,000’s of equations<br />
in 100,000’s of elements<br />
> solve enormous matrix<br />
system for Earth’s velocity<br />
structure
D<strong>is</strong>cretization: model earth as<br />
a mesh of small elements each with<br />
constant se<strong>is</strong>mic velocity
WHAT DOES TOMOGRAPHY TELL US ABOUT<br />
PLATE BOUNDARIES AND MAJOR FAULTS?
TOMOGRAPHIC IMAGES<br />
> images show subduction zones as high-velocity<br />
slabs that penetrate through the mantle to the CMB<br />
> why are they high velocity?
TOMOGRAPHY & WADATI-BENIOFF<br />
ZONES<br />
> most subduction<br />
zones have W-B<br />
zones extending to<br />
se<strong>is</strong>micity related<br />
to mineral reactions
DOUBLE BENIOFF ZONES<br />
> example from NE Japan<br />
> 2 lines of se<strong>is</strong>micity, one near plate boundary, the other<br />
40 km below<br />
> thought to be due to dehydration reactions
Cascadia not as<br />
active as some s.z.’s<br />
> still controversy<br />
over exact position<br />
of downgoing plate<br />
> W-B se<strong>is</strong>micity<br />
restricted to above<br />
100 km<br />
CASCADIA SEISMICITY