A Sea-Floor Spreading Event Captured by Seismometers - Lamont ...
A Sea-Floor Spreading Event Captured by Seismometers - Lamont ...
A Sea-Floor Spreading Event Captured by Seismometers - Lamont ...

You also want an ePaper? Increase the reach of your titles
YUMPU automatically turns print PDFs into web optimized ePapers that Google loves.
ceptionally high light attenuation (∆c) values<br />
(>0.15 m –1 ) (Fig. 3), indicative of vigorous discharge<br />
of high-temperature hydrothermal fluids.<br />
Maximum ∆c was centered precisely over the<br />
OBS array during both cruises, with densityinversion<br />
layers found throughout the bottommost<br />
100 m, especially between 9°48.5′N and<br />
9°50.5′N. Their magnitude, variability, and near<br />
ubiquity over this area, along with exceptionally<br />
high methane concentrations, are symptomatic of<br />
a sea floor that discharges hot, potentially lowchlorinity,<br />
hydrothermal fluid. These qualities<br />
also suggest that an eruption had occurred less<br />
than 7 months before May 2006 (14).<br />
<strong>Sea</strong>-floor images collected using a digital<br />
towed camera system [TowCam (16)] confirmed<br />
the existence of new lavas and constrained the<br />
eruption's spatial extent (Fig. 1). The new lavas<br />
appear to be erupted from fissures within the<br />
AST, which reestablished quickly after the event<br />
<strong>by</strong> drain-back and collapse. Comparison of<br />
TowCam bathymetry with pre-eruption Alvin<br />
mapping (17) suggests that the AST is now 10 to<br />
15 m narrower and a few meters shallower at<br />
9°50.4′N than it was previously. Lava flow<br />
morphologies indicate that the highest effusion<br />
rates were near 9°50'N (18).<br />
Radiometric dating (14) of 10 rocks collected<br />
from the young terrain is under way, using 210 Po<br />
(4). Preliminary 210 Po results indicate that nine of<br />
the rocks were erupted within a year before their<br />
collection, with dates ranging from late summer<br />
2005 to January 2006.<br />
Based on the sea-floor images, the extent of<br />
water column anomalies, the preliminary lava<br />
ages, and the distribution of OBSs that failed to<br />
return, we estimate that the flow extended<br />
intermittently for ≥18 km along the ridge axis,<br />
from 9°46'N to 9°55.7'N, with off-axis extent<br />
ranging from 0 to ≥1 km.Theeruptionoccurred<br />
on the same segment (segment B) as the 1991 to<br />
1992 eruption, with a similar length scale.<br />
Data from only two of the four OBSs recovered<br />
in 2006 are presently available because<br />
of hard-drive problems, but efforts are being<br />
made to recover these data and more OBSs (14).<br />
The available data come from the northernmost<br />
instrument (no. 209), ~0.15 km west of the AST<br />
at 9°51'N, and the westernmost instrument (no.<br />
204), ~1.8 km west of the AST near 9°50'N<br />
(Fig. 1). Automatic phase picks (Fig. 2), combined<br />
with visual inspection of the seismograms,<br />
provide a picture of year-long high earthquake<br />
rates and abundant harmonic tremors visible at<br />
a range of frequencies, particularly in the 5- to<br />
25-Hz band. Periods of pronounced harmonic<br />
tremors reduce the signal-to-noise ratio, making<br />
automatic detection of earthquakes a less<br />
reliable indicator of large swarm activity. To<br />
better quantify the variation of seismic activity<br />
over time, we summed the root mean square<br />
(RMS) amplitude of the seismic vertical channel<br />
in the 3- to 18-Hz band within 10-min windows<br />
(Fig. 4). High-amplitude events observed on<br />
only one instrument may indicate the presence<br />
of swarms to the north or south of the array or<br />
very close to that instrument. The event on 22<br />
January is clearly the largest event at either<br />
REPORTS<br />
station and is well correlated between instruments,<br />
indicating local activity over a spatial<br />
scale important to both sensors.<br />
Fig. 2. Plot of the event rate from 3 October 2003 to 23 April 2006. Array turnarounds in April<br />
2004 and May 2005 are marked with vertical dotted lines. Different methods were used to estimate<br />
event rates for the various deployments (14). Results were normalized <strong>by</strong> comparing periods of<br />
array overlap. The inset plot shows the average daily event rates <strong>by</strong> year, including data from a<br />
1995 deployment (12).<br />
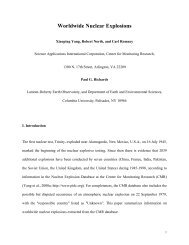
Fig. 3. Contour plot of Dc versus depth and latitude for an along-axis (ridge summit) tow-yo cast.<br />
Dc intensity is represented <strong>by</strong> colors. Potential density (sigma-theta; in kg m –3 ) contours (solid<br />
black lines) are superimposed over Dc. The dotted line indicates the saw-toothed tow pattern of the<br />
CTD-transmissometer-bottle rosette instrument package. The deepest density line indicates<br />
localized areas of instability in the lower part of the water column; the strong correlation between<br />
the vertical structures in Dc and the deep density contour line suggest that strong localized<br />
hydrothermal venting is driving the entrainment and subsequent rise of ambient bottom water.<br />
www.sciencemag.org SCIENCE VOL 314 22 DECEMBER 2006 1921<br />
on January 3, 2007<br />
www.sciencemag.org<br />
Downloaded from