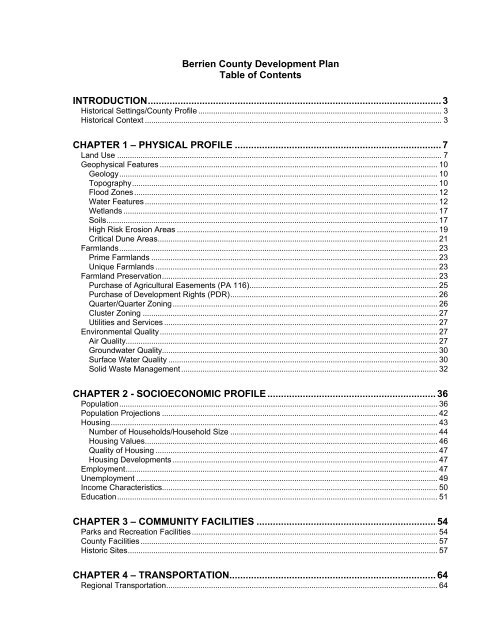
Berrien County Development Plan Table of Contents ...
Berrien County Development Plan Table of Contents ...
Berrien County Development Plan Table of Contents ...

Create successful ePaper yourself
Turn your PDF publications into a flip-book with our unique Google optimized e-Paper software.
<strong>Berrien</strong> <strong>County</strong> <strong>Development</strong> <strong>Plan</strong><br />
<strong>Table</strong> <strong>of</strong> <strong>Contents</strong><br />
INTRODUCTION............................................................................................................ 3<br />
Historical Settings/<strong>County</strong> Pr<strong>of</strong>ile .................................................................................................................. 3<br />
Historical Context ........................................................................................................................................... 3<br />
CHAPTER 1 – PHYSICAL PROFILE ............................................................................ 7<br />
Land Use ........................................................................................................................................................ 7<br />
Geophysical Features .................................................................................................................................. 10<br />
Geology..................................................................................................................................................... 10<br />
Topography............................................................................................................................................... 10<br />
Flood Zones.............................................................................................................................................. 12<br />
Water Features ......................................................................................................................................... 12<br />
Wetlands ................................................................................................................................................... 17<br />
Soils........................................................................................................................................................... 17<br />
High Risk Erosion Areas .......................................................................................................................... 19<br />
Critical Dune Areas................................................................................................................................... 21<br />
Farmlands..................................................................................................................................................... 23<br />
Prime Farmlands ...................................................................................................................................... 23<br />
Unique Farmlands .................................................................................................................................... 23<br />
Farmland Preservation................................................................................................................................. 23<br />
Purchase <strong>of</strong> Agricultural Easements (PA 116)........................................................................................ 25<br />
Purchase <strong>of</strong> <strong>Development</strong> Rights (PDR)................................................................................................. 26<br />
Quarter/Quarter Zoning............................................................................................................................ 26<br />
Cluster Zoning .......................................................................................................................................... 27<br />
Utilities and Services ................................................................................................................................ 27<br />
Environmental Quality.................................................................................................................................. 27<br />
Air Quality.................................................................................................................................................. 27<br />
Groundwater Quality................................................................................................................................. 30<br />
Surface Water Quality .............................................................................................................................. 30<br />
Solid Waste Management........................................................................................................................ 32<br />
CHAPTER 2 - SOCIOECONOMIC PROFILE .............................................................. 36<br />
Population..................................................................................................................................................... 36<br />
Population Projections ................................................................................................................................. 42<br />
Housing......................................................................................................................................................... 43<br />
Number <strong>of</strong> Households/Household Size ................................................................................................. 44<br />
Housing Values......................................................................................................................................... 46<br />
Quality <strong>of</strong> Housing .................................................................................................................................... 47<br />
Housing <strong>Development</strong>s ............................................................................................................................ 47<br />
Employment.................................................................................................................................................. 47<br />
Unemployment ............................................................................................................................................. 49<br />
Income Characteristics................................................................................................................................. 50<br />
Education...................................................................................................................................................... 51<br />
CHAPTER 3 – COMMUNITY FACILITIES .................................................................. 54<br />
Parks and Recreation Facilities ................................................................................................................... 54<br />
<strong>County</strong> Facilities ........................................................................................................................................... 57<br />
Historic Sites................................................................................................................................................. 57<br />
CHAPTER 4 – TRANSPORTATION............................................................................ 64<br />
Regional Transportation............................................................................................................................... 64<br />
1
Bus Systems............................................................................................................................................. 64<br />
Train – Commuter Service ....................................................................................................................... 64<br />
Airports – Regional General Aviation ...................................................................................................... 64<br />
Airports – General Aviation ...................................................................................................................... 66<br />
St. Joseph River Harbor........................................................................................................................... 66<br />
Public Transportation Systems.................................................................................................................... 68<br />
<strong>Berrien</strong> <strong>County</strong> Public Transportation (<strong>Berrien</strong> Bus)............................................................................... 68<br />
Buchanan Dial-A-Ride.............................................................................................................................. 68<br />
Niles Dial-A-Ride ...................................................................................................................................... 68<br />
Twin Cities Transportation Authority (TCATA)........................................................................................ 69<br />
Pedestrian/Non-motorized Transportation .............................................................................................. 69<br />
Transportation <strong>Plan</strong>ning............................................................................................................................... 69<br />
Urban Transportation <strong>Plan</strong>ning................................................................................................................ 69<br />
Rural Transportation <strong>Plan</strong>ning ................................................................................................................. 73<br />
CHAPTER 5 – TRENDS, PATTERNS AND PROBLEMS........................................... 75<br />
Future Land Use Projections ....................................................................................................................... 75<br />
CHAPTER 6 – GOALS, POLICIES AND STRATEGIES............................................. 78<br />
Land Use ...................................................................................................................................................... 78<br />
Environment.................................................................................................................................................. 79<br />
Economy....................................................................................................................................................... 79<br />
Transportation .............................................................................................................................................. 80<br />
Strategies for Smart Growth ........................................................................................................................ 80<br />
APPENDIX A - BIBLIOGRAPHY................................................................................. 81<br />
2
INTRODUCTION<br />
Historical Settings/<strong>County</strong> Pr<strong>of</strong>ile<br />
<strong>Berrien</strong> <strong>County</strong> is located in the extreme southwestern portion <strong>of</strong> Michigan, bordering<br />
on Lake Michigan and Indiana (Map 1). It has a land area <strong>of</strong> 373,120 acres or 583<br />
square miles. There are 86 inland lakes totaling 4,500 acres, and the <strong>County</strong> enjoys 42<br />
miles <strong>of</strong> shoreline along Lake Michigan. Lake Michigan has a total area <strong>of</strong> 22,400<br />
square miles and is 923 feet at its deepest point.<br />
Three major rivers, the St. Joseph River, the Paw Paw River and the Galien River<br />
empty into Lake Michigan. The St. Joseph River is the largest and most important to<br />
the area. Its uses include recreational, agricultural irrigation, discharge, and<br />
hydroelectricity. The St. Joseph River Basin is one <strong>of</strong> the larger basins in Michigan and<br />
has a drainage area <strong>of</strong> 4,591 square miles.<br />
Farming is one <strong>of</strong> the main economic enterprises in the <strong>County</strong>. Prevailing winds from<br />
Lake Michigan moderate air temperature, making the climate in the northern part <strong>of</strong> the<br />
<strong>County</strong> favorable for orchard crops and vineyards. The southern part <strong>of</strong> the <strong>County</strong> is<br />
favorable for cash crops and livestock farming.<br />
Lake Michigan modifies the climate in <strong>Berrien</strong> <strong>County</strong> to a considerable degree.<br />
Prevailing westerly winds are cooled in the summer and warmed in the winter as they<br />
cross the lake. <strong>Berrien</strong> <strong>County</strong> has an average temperature ranging from 29.4° in<br />
January to 74.4° in July. The growing season is 184 days with an average annual<br />
precipitation <strong>of</strong> 34.0 inches.<br />
<strong>Berrien</strong> <strong>County</strong> contains 22 townships, 8 cities and 9 villages (Map 2), with the <strong>County</strong><br />
seat located in the City <strong>of</strong> St. Joseph. More information on <strong>Berrien</strong> <strong>County</strong> Government<br />
Facilities can be found in Chapter 3.<br />
Historical Context<br />
<strong>Berrien</strong> <strong>County</strong>’s pioneer history dates back to the end <strong>of</strong> the Seventeenth Century.<br />
The early French missionaries and explorers were the first Europeans in <strong>Berrien</strong><br />
<strong>County</strong>. In 1679, the French explorer LaSalle entered the mouth <strong>of</strong> the St. Joseph<br />
River in search <strong>of</strong> a waterway to the Mississippi River. There, at the mouth <strong>of</strong> the St.<br />
Joseph River, he established a small fortified post called Fort Miami. The fur trade<br />
established in the early 1700’s was followed by more permanent agriculture based<br />
settlements. Agriculture remains a major element <strong>of</strong> the <strong>County</strong>’s mixed economy and<br />
is the dominant land use.<br />
In 1691, the French built Fort St. Joseph south <strong>of</strong> the present site <strong>of</strong> Niles City, along<br />
the eastern edge <strong>of</strong> the St. Joseph River. The region earned the nickname, ‘Land <strong>of</strong><br />
Four Flags’, because it had been claimed by France, England, Spain and America at<br />
various times. It is the only area to hold such distinction in Michigan.<br />
3
The <strong>County</strong> seat was originally in the town <strong>of</strong> Newberryport, presently the site <strong>of</strong> St.<br />
Joseph City. In 1837, the <strong>County</strong> Seat was moved to <strong>Berrien</strong> Springs, where a<br />
Courthouse was constructed in 1839. By decision <strong>of</strong> a popular vote, the <strong>County</strong> Seat<br />
was moved to St. Joseph in 1894.<br />
Organized in 1831, the <strong>County</strong> was named in honor <strong>of</strong> John M. <strong>Berrien</strong>, an Attorney<br />
General in President Andrew Jackson’s cabinet. <strong>Berrien</strong> <strong>County</strong> originally consisted <strong>of</strong><br />
the townships <strong>of</strong> <strong>Berrien</strong>, Niles, and St. Joseph. In 1924, Baroda became the newest<br />
township when it separated from Lake Township.<br />
The current <strong>Berrien</strong> <strong>County</strong> Courthouse, which was built between Port Street and the<br />
St. Joseph River in the City <strong>of</strong> St. Joseph, was formally dedicated on July 4, 1967.<br />
Initially, <strong>Berrien</strong> <strong>County</strong> policy was administered by a Board <strong>of</strong> Supervisors. The Board<br />
<strong>of</strong> Supervisors consisted <strong>of</strong> the township supervisors, city mayors and village<br />
presidents. The <strong>County</strong> changed from supervisors to the <strong>County</strong> Board <strong>of</strong><br />
Commissioners in 1969 when the state constitution was amended. The <strong>County</strong><br />
Commissioners are elected positions, each serving two-year terms. There are<br />
currently thirteen commissioners serving <strong>Berrien</strong> <strong>County</strong>.<br />
4
Location in Michigan<br />
W<br />
N<br />
E<br />
S<br />
Scale: 1" = 4.5 miles<br />
BUFFALO<br />
M239<br />
ASH<br />
<strong>Berrien</strong> <strong>County</strong>, Michigan<br />
GALIEN RIVER<br />
I94<br />
LAKE ST<br />
WARREN WOODS RD<br />
BLUE JAY CREEK<br />
5<br />
CLEVELAND AV<br />
CLEVELAND<br />
NILES AV<br />
M-139<br />
NILES RD<br />
ST. JOSEPH RIVER<br />
US 31<br />
I196<br />
BLUE CREEK<br />
RED ARROW HWY<br />
MAIN<br />
PAW PAW RIVER<br />
PIPESTONE CREEK<br />
ST JOSEPH<br />
RED BUD TR<br />
COLOMA RD<br />
PIPESTONE RD<br />
ST JOSEPH VAL PKY<br />
US 12<br />
OLD U S 31<br />
NAPIER AV<br />
WALTON RD<br />
PAW PAW<br />
LAKE<br />
NILES-BUCHANAN RD<br />
MILL CREEK<br />
PAINTER SCHOOL RD<br />
OLD M62<br />
DOWAGIAC RIVER<br />
BRANDYWINE CREEK<br />
MAP 1
W<br />
VILLAGE OF<br />
GRAND BEACH<br />
VILLAGE OF<br />
MICHIANA<br />
N<br />
S<br />
E<br />
Scale: 1" = 4.5 miles<br />
CITY OF<br />
NEW BUFFALO<br />
NEW BUFFALO<br />
TOWNSHIP<br />
Local Municipalities<br />
CHIKAMING<br />
TOWNSHIP<br />
VILLAGE OF<br />
THREE OAKS<br />
THREE OAKS<br />
TOWNSHIP<br />
LAKE<br />
TOWNSHIP<br />
VILLAGE OF<br />
SHOREHAM<br />
CITY OF<br />
BRIDGMAN<br />
CITY OF<br />
ST. JOSEPH<br />
LINCOLN<br />
TOWNSHIP<br />
VILLAGE OF<br />
STEVENSVILLE<br />
WEESAW<br />
TOWNSHIP<br />
GALIEN<br />
TOWNSHIP<br />
6<br />
ST. JOSEPH<br />
TOWNSHIP<br />
VILLAGE OF<br />
BARODA<br />
CITY OF<br />
BENTON HARBOR<br />
BARODA<br />
TOWNSHIP<br />
VILLAGE OF<br />
GALIEN<br />
ROYALTON<br />
TOWNSHIP<br />
HAGAR<br />
TOWNSHIP<br />
BENTON<br />
TOWNSHIP<br />
ORONOKO<br />
TOWNSHIP<br />
SODUS<br />
TOWNSHIP<br />
BUCHANAN<br />
TOWNSHIP<br />
CITY OF<br />
BUCHANAN<br />
BERTRAND<br />
TOWNSHIP<br />
COLOMA<br />
TOWNSHIP<br />
CITY OF<br />
COLOMA<br />
VILAGE OF<br />
BERRIEN SPRINGS<br />
CITY OF<br />
WATERVLIET<br />
BAINBRIDGE<br />
TOWNSHIP<br />
PIPESTONE<br />
TOWNSHIP<br />
VILLAGE OF<br />
EAU CLAIRE<br />
BERRIEN<br />
TOWNSHIP<br />
NILES TOWNSHIP<br />
WATERVLIET<br />
TOWNSHIP<br />
CITY OF<br />
NILES<br />
MAP 2
CHAPTER 1 – PHYSICAL PROFILE<br />
Land Use<br />
Land use controls act as the tools that enable the <strong>County</strong> to grow in a managed<br />
way, balancing the needs <strong>of</strong> the marketplace and property owners with the<br />
overall desires <strong>of</strong> the community to maintain and promote a highly desirable<br />
lifestyle for its citizens. Achieving this balance is among the most complex<br />
challenges facing local decision-makers. While the <strong>County</strong> Master <strong>Plan</strong> has little<br />
direct control over decisions made by local units <strong>of</strong> government, it can be an<br />
important basis for encouraging coordination and cooperation by providing local<br />
units <strong>of</strong> government and other agencies with broader criteria in their decision<br />
making processes. The legitimate interests <strong>of</strong> land owners, developers and those<br />
that seek to migrate to the <strong>County</strong> must be balanced with the desires <strong>of</strong> current<br />
residents. This balance must be achieved in the context <strong>of</strong> the limited regulatory<br />
powers <strong>of</strong> local government, acting with restricted resources and in a constantly<br />
changing political environment. Given all <strong>of</strong> these challenges and obstacles, it is<br />
important that the <strong>County</strong> maintain a realistic perspective concerning the degree<br />
to which land use controls can be effective in the area <strong>of</strong> growth management.<br />
In 1999, a Generalized Existing Land Use map was prepared, by the <strong>County</strong>,<br />
using the <strong>County</strong>’s 1996 aerial photography along with the land use maps from<br />
the development plans <strong>of</strong> each municipality. Each municipality received a draft<br />
copy <strong>of</strong> the land use map and was asked to participate by updating any changes<br />
in land use or correcting any inaccuracies in the map. The Generalized Existing<br />
Land Use map (Map 3) details the predominant land uses in the <strong>County</strong>, using<br />
the following categories:<br />
Residential: All predominant residential areas including subdivisions,<br />
cities, villages, and other areas where residential is the predominant land<br />
use.<br />
Commercial: Areas <strong>of</strong> wholesale or retail sales, <strong>of</strong>fices and pr<strong>of</strong>essional<br />
services.<br />
Industrial: Areas <strong>of</strong> industrial or manufacturing uses.<br />
Public and Semi-Public: Churches, schools, municipal buildings,<br />
cemeteries, parks, recreational areas and open public spaces.<br />
Agriculture or Vacant: Areas under agricultural production; land not<br />
presently being actively used and rural residential development.<br />
The amount in acreage <strong>of</strong> each land use type can be found in <strong>Table</strong> 1.<br />
7
LAND USE CLASSIFICATIONS<br />
Residential<br />
W<br />
Commercial<br />
Industrial<br />
Public/Semi-Public<br />
Agriculture or Vacant<br />
Municipal Boundaries<br />
Roads<br />
N<br />
S<br />
Source: 1996 Aerial Photography,<br />
<strong>Berrien</strong> <strong>County</strong> <strong>Plan</strong>ning Department<br />
E<br />
Scale: 1" = 4.5 miles<br />
Generalized Land Use<br />
8<br />
MAP 3
<strong>Table</strong> 1: Land Use Type by Acreage<br />
Land Use Type Acres % <strong>of</strong> Total<br />
Agricultural/<br />
Vacant<br />
314,538<br />
9<br />
84.2%<br />
Commercial 4,911 1.3%<br />
Industrial 5,641 1.5%<br />
Public/<br />
Semi-Public<br />
13,063<br />
3.5%<br />
Residential 35,197 9.4%<br />
Total 373,350 100%<br />
In most communities, the predominant residential land use consists <strong>of</strong> the fairly<br />
low-density residential classification with the exception <strong>of</strong> the cities <strong>of</strong> St. Joseph,<br />
Benton Harbor and Niles. The Lakefront is continually confronting growth<br />
pressures for new residential development. An estimated 35,197 acres (9.4%)<br />
make up the residential land use in <strong>Berrien</strong> <strong>County</strong>.<br />
Commercial land uses in the <strong>County</strong> are centered in the core urban areas and<br />
along major traffic corridors. The Fairplain area (Benton Township) has seen<br />
substantial commercial development in the last 5 years and has built new roads<br />
to keep up with the volume <strong>of</strong> traffic added to this area. There is an estimated<br />
4,911 acres <strong>of</strong> commercial land in the county. Compared to the <strong>County</strong><br />
<strong>Development</strong> <strong>Plan</strong> <strong>of</strong> 1975, the county has doubled the amount <strong>of</strong> commercial<br />
use.<br />
The industrial uses throughout the county tend to gravitate toward the urban<br />
areas. Industrial land uses make up about 5,641 acres <strong>of</strong> the total land<br />
compared to the 2,608 acres referenced in the 1975 <strong>Development</strong> <strong>Plan</strong>. The<br />
growth in industrial use is taking place predominantly in industrial parks. Tax<br />
incentives have also attracted new industry to the county.<br />
Public and semi-public land uses make up approximately 13,063 acres (3.5%) <strong>of</strong><br />
the land.<br />
The majority <strong>of</strong> the land (84.2%) in the county is either agricultural or vacant.<br />
The land is well suited for the production <strong>of</strong> a great variety <strong>of</strong> row crops, specialty<br />
crops and livestock. These lands provide unique, aesthetic and economic<br />
benefits to the citizens <strong>of</strong> <strong>Berrien</strong> <strong>County</strong> and are an important part <strong>of</strong> the<br />
<strong>County</strong>’s heritage.
Geophysical Features<br />
Geology<br />
When the last glacier receded from Michigan, it left <strong>Berrien</strong> <strong>County</strong> with outwash<br />
plains, river valleys, lake plains, moraines, till plains and glacial lakes. Many <strong>of</strong><br />
these lakes later became filled with plant remains, thus forming muck and peat<br />
deposits. Well above the present lake level, glacial Lake Michigan deposited<br />
sandy beach ridges on the slopes <strong>of</strong> hillsides, further contributing to the<br />
complexity <strong>of</strong> the soils patterns in the <strong>County</strong>.<br />
The western portion <strong>of</strong> <strong>Berrien</strong> <strong>County</strong> fronts Lake Michigan and the major<br />
surface features in the order <strong>of</strong> their occurrence eastward from the lake shore<br />
are: a narrow belt <strong>of</strong> discontinuous sand dunes and sandy shore lines; a gently<br />
rolling lake plain followed by a higher, gently rolling to hilly morainal ridge; and an<br />
outwash plain. (Map 4)<br />
Topography<br />
Elevations in <strong>Berrien</strong> <strong>County</strong> range from 580 feet above sea level along the<br />
shores <strong>of</strong> Lake Michigan to a high <strong>of</strong> approximately 820 feet above sea level,<br />
south <strong>of</strong> Buchanan. Along the lakefront and eastward the topography is relatively<br />
flat with the exception <strong>of</strong> the dunes. The topographic pr<strong>of</strong>ile indicates there are<br />
four well defined divisions that extend roughly parallel to the Lake Michigan<br />
shore. The first division is a discontinuous lake plain that is 10-15 feet above the<br />
lakeshore and is covered in many places by sand dunes rising to over 200 feet<br />
above Lake Michigan. These areas, devoid <strong>of</strong> the sand dunes, are near Grand<br />
Mere Lakes and extend to the Paw Paw and St. Joseph River valleys.<br />
A second division is a nearly level plain about 40-80 feet above Lake Michigan.<br />
This division generally lies behind the dunes but reaches the lake in places,<br />
terminating in steep bluffs. This area varies from 6 to 8 miles in width, except<br />
where it widens and merges with the terraces <strong>of</strong> the St. Joseph River southeast<br />
<strong>of</strong> St. Joseph. This plain is apparently the remnant floor <strong>of</strong> glacial Lake Chicago,<br />
which covered earlier deposits <strong>of</strong> glacial till.<br />
A third division consists <strong>of</strong> broad swells, inconspicuous smooth ridges, and<br />
detached high plains lying at slightly higher levels than the second physiographic<br />
division. The land is 80-120 feet above Lake Michigan. The absence <strong>of</strong> the<br />
original inequalities and constructional features common to moraines indicates<br />
erosion and depositional evens, possibly tied to wave action and deposition from<br />
a smaller glacial lake that is ponded between this moraine and the Valpariso<br />
Terminal Moraine to the east.<br />
The fourth major division comprises most <strong>of</strong> the eastern two-thirds <strong>of</strong> the county.<br />
This topographic division consists <strong>of</strong> a broad plateau like highland. In places<br />
10
639455528810146435569971332553443629624531079244433 SNEWMunicipalBoundariesSource:United<br />
11
there is an abrupt front facing the lake plains to the west. This area ranges from<br />
100 to more than 300 feet above Lake Michigan. Map 5 illustrates this<br />
topographic division.<br />
Flood Zones<br />
The 100-year floodplain is the measure used to gauge flood risk. The definition<br />
<strong>of</strong> the 100-year flood is that flood level which has a one-percent chance <strong>of</strong> being<br />
reached in any given year. The land along the St. Joseph, Paw Paw and Galien<br />
Rivers predominantly make up the areas designated by the Federal Emergency<br />
Management Agency (FEMA) as being within the 100 year floodplain. Map 6<br />
identifies the flood zones, for those local municipalities that participate, for<br />
<strong>Berrien</strong> <strong>County</strong>. Those municipalities on the map that are labeled as<br />
undetermined are municipalities that did not participate in the flood insurance<br />
rate program. FEMA’s Federal Insurance Rate Maps (FIRMs) are the basis for<br />
floodplain management, mitigation, and insurance activities for the National<br />
Flood Insurance Program.<br />
Most flood-prone communities in the United States have chosen to participate in<br />
the National Flood Insurance Program (NFIP), as a condition for the availability <strong>of</strong><br />
federal flood insurance. The NFIP provides basic flood hazard data, and a flood<br />
hazard management framework for every flood-prone community in the United<br />
States. The NFIP <strong>of</strong>fers insurance coverage and other benefits to local<br />
communities conditioned on the communities undertaking certain flood hazard<br />
mitigation steps.<br />
The NFIP is implemented through the Federal Insurance Administration, which is<br />
a component <strong>of</strong> the Federal Emergency Management Agency (FEMA). Anyone<br />
with questions about the program should either contact FEMA by telephone at<br />
877-336-2627 or the <strong>of</strong>fices <strong>of</strong> their local municipality.<br />
Water Features<br />
<strong>Berrien</strong> <strong>County</strong>’s abundant water resources provide many opportunities for<br />
outdoor recreation and education. Overall, there are 3,078 acres <strong>of</strong> inland lakes,<br />
500 miles <strong>of</strong> streams and rivers and 42 miles <strong>of</strong> Lake Michigan shoreline (Map<br />
7).<br />
The largest inland lakes in <strong>Berrien</strong> <strong>County</strong> are Paw Paw Lake near Watervliet<br />
and Coloma [900 acres <strong>of</strong> surface area], and Lake Chapin near <strong>Berrien</strong> Springs<br />
[600 acres <strong>of</strong> surface area]. <strong>Berrien</strong>’s three main rivers are the St. Joseph River<br />
[46 miles], the Paw Paw River [13 miles] and the Galien River [33 miles]. Dams<br />
on the St. Joseph River corridor have created impoundments near Niles,<br />
Buchanan and <strong>Berrien</strong> Springs. Paw Paw Lake and Dayton Lake are<br />
impoundments resulting from dams.<br />
12
SNEWSource:UnitedStatesGeologicalSurveyScale:1"=4.5miles<br />
TopographyMAP5USGSContours-Feet550-650651-70 14
Areas<strong>of</strong>100-yearflood;basefloodelevationsandfloodhazardfactorsnotdeterminedAreas<strong>of</strong>100-yearflood;basefloodelevationsandfloodhazardfac<br />
15
W<br />
N<br />
S<br />
Water Features<br />
Lakes<br />
Scale: 1" = 4.5 miles<br />
Municipal Boundaries<br />
E<br />
S O<br />
UTH<br />
WARBURTON POND<br />
BRANC H GALIEN R<br />
GALIEN RIVER<br />
KLUTES LAKES<br />
Source: <strong>Berrien</strong> <strong>County</strong>, <strong>Plan</strong>imetric Data (1996)<br />
Water Features<br />
GRAND<br />
MERE<br />
LAKES<br />
16<br />
HICKORY CREEK<br />
B L UE JAY C R E EK<br />
HESS LAKE<br />
SINGER LAKE<br />
PAW PAW RIVER<br />
BLUE CREEK<br />
PAW PAW LAKE<br />
MILL CREEK<br />
SMITH LAKE<br />
PAINTER LAKE LAKE CHAPIN<br />
BROWNS LAKE LONGS LAKE<br />
LITTLE INDIAN LAKE<br />
WEBSTER LAKE<br />
STEINBAUER LAKE<br />
BOYLE LAKE<br />
MADRON LAKE<br />
JUDY LAKE<br />
WAGNER LAKE<br />
MOON LAKE<br />
YELLOW LAKE WEAVER LAKE<br />
CLEAR LAKE<br />
DAYTON LAKE<br />
PIKE LAKE<br />
ST. JOSEPH R IVER<br />
HARRIS LAKE<br />
LITTLE PAW PAW LAKE<br />
SHERWOOD LAKE<br />
BRANT LAKE??<br />
SOUTH CLEAR LAKE<br />
KIBLER LAKE<br />
P I P ESTONE C R E EK<br />
ST. JOS E PH RI V E R<br />
PIPESTONE LAKE<br />
JARVIS LAKE<br />
BLACK LAKE<br />
ROWE LAKE<br />
MUD LAKE<br />
B R A<br />
BRUSH LAKE<br />
BARNHART LAKE<br />
MURPHY LAKE<br />
RIGGINS LAKE<br />
DOWAGIAC RIVER<br />
NDY<br />
WI N E CREEK<br />
MAP 8
The St. Joseph and Paw Paw River valley are extensively terraced. The Galien<br />
River is deeply entrenched with a steep gradient. The St. Joseph, Paw Paw<br />
and Galien Rivers exhibit a relatively low level <strong>of</strong> development along their banks<br />
with rather large wooded floodplain areas, which contribute, to their wild and<br />
scenic character.<br />
Wetlands<br />
Wetlands serve as a transition zone between land and water. They are low<br />
areas characterized by the presence <strong>of</strong> water at a frequency that is sufficient to<br />
support wetland vegetation or aquatic life. They provide a variety <strong>of</strong> benefits that<br />
include flood mitigation, soil erosion prevention, improved water quality, and<br />
provide the habitat for a variety <strong>of</strong> vegetation and wildlife.<br />
Wetlands found in <strong>Berrien</strong> <strong>County</strong> fall into four general categories – marshes,<br />
swamps, bogs and fens. Marshes are wetlands dominated by s<strong>of</strong>t-stemmed<br />
vegetation, while swamps have mostly woody plants. Bogs are freshwater<br />
wetlands, <strong>of</strong>ten formed in old glacial lakes, characterized by spongy peat<br />
deposits, evergreen trees and shrubs, and a floor covered by a thick carpet <strong>of</strong><br />
sphagnum moss. Fens are freshwater peat-forming wetlands covered mostly by<br />
grasses, sedges, reeds and wildflowers.<br />
New Buffalo has the largest marsh remaining in wetlands. The National Wetland<br />
Inventory (NWI) <strong>of</strong> the U.S. Fish & Wildlife Service produces a map <strong>of</strong> wetlands<br />
(Map 8). The Emergency Wetland Resources Act <strong>of</strong> 1986 requires that NWI<br />
archive and disseminate wetland maps and add newly discovered wetlands to<br />
the maps as they become available. Information on NWI can be obtained by<br />
calling 727-570-5400.<br />
Any wetlands greater than five acres in size or contiguous with a waterway are<br />
regulated by the Michigan Department <strong>of</strong> Environmental Quality (MDEQ) through<br />
the Goemaere-Anderson Wetland Protection Act, Public Act 203, as amended.<br />
Any activity which requires these regulated wetlands be filled or drained requires<br />
a permit from the MDEQ. Permits will generally not be granted unless the<br />
issuance is in the public interest and necessary to realize the benefits derived<br />
from the activity. If a wetland fill permit is granted, mitigation should be required<br />
such as creating new wetlands within the same drainage way or enhancement <strong>of</strong><br />
existing wetlands. Questions about MDEQ regulations can be answered by<br />
calling 517-373-1170.<br />
Soils<br />
The United States Department <strong>of</strong> Agriculture Soil Conservation Service published<br />
the Soil Survey <strong>of</strong> <strong>Berrien</strong> <strong>County</strong>, Michigan in 1979. The Soil Survey describes<br />
the characteristics <strong>of</strong> the soils in a given area, classifies the soils according to a<br />
17
Scale:1"=4.5miles SNEWLacustrine-Lakesanddeepponds.Palustrine-Vegetatedwetlandstradionallycalledbysuchnamesasmarsh,swamp,bog,<br />
18
standard classification system, and includes soil location maps. The Soil Survey<br />
also interprets the uses and limitations <strong>of</strong> the different soil types. This<br />
information is used to make a variety <strong>of</strong> land use, agricultural management,<br />
engineering, and wildlife management decisions.<br />
Most <strong>of</strong> the <strong>County</strong> is comprised <strong>of</strong> gently sloping soils that are dominantly well<br />
drained or moderately well drained. These soils are well suited to agriculture and<br />
urban development.<br />
Broad areas that have a distinctive pattern <strong>of</strong> soils, relief and drainage are<br />
referred to as soil associations. These associations are named for the major soil<br />
types found in them. Of the 42 different soil types identified in <strong>Berrien</strong> <strong>County</strong>,<br />
eight distinct associations were formed (Map 9).<br />
High Risk Erosion Areas<br />
High risk erosion areas are those shorelands <strong>of</strong> the Great Lakes and connecting<br />
waters where recession <strong>of</strong> the zone <strong>of</strong> active erosion has been occurring at a<br />
long-term average rate <strong>of</strong> one foot or more per year. The erosion can be caused<br />
from one or several factors. High water levels, storms, wind, ground water<br />
seepage, surface water run<strong>of</strong>f, and frost are important factors causing erosion.<br />
In accordance with Part 323, Shorelands Protection and Management, <strong>of</strong> the<br />
Natural Resources and Environmental Protection Act, 1994, Public Act 451, the<br />
Department the <strong>of</strong> Environmental Quality is required to notify all local<br />
governmental agencies, along with the affected land owners, <strong>of</strong> the designation<br />
<strong>of</strong> high risk erosion areas in their jurisdiction which are subject to zoning<br />
regulations or other protective measures as specified in this act.<br />
Picture 1: Erosion along Lake Michigan<br />
19<br />
More information on high<br />
risk erosion areas can be<br />
found by calling the Land<br />
and Water Management<br />
Division <strong>of</strong> the MDEQ at<br />
517-373-1130.
82176351122223446784444111685333 GeneralSoilsMap Source:SoilSurvey<strong>of</strong><strong>Berrien</strong><strong>County</strong>,Michigan(US<br />
20
Critical Dune Areas<br />
Michigan's critical dune areas are a unique, irreplaceable, and fragile resource<br />
that provides significant recreational, economic, scientific, scenic, educational<br />
and ecological benefits to the people <strong>of</strong> Michigan and all who visit them. They<br />
represent the largest assemblage <strong>of</strong> fresh water dunes in the world and support<br />
numerous threatened and endangered species. <strong>Berrien</strong> <strong>County</strong> contains<br />
approximately 4,000 acres (Map 10) <strong>of</strong> Michigan's 80,000 acres <strong>of</strong> critical dunes.<br />
With over 1,200 acres <strong>of</strong> critical dunes falling within state and local parks, it is<br />
easy to see the importance they have on the tourism industry in <strong>Berrien</strong> <strong>County</strong>.<br />
Critical dune areas are designated by the Michigan Department <strong>of</strong> Environmental<br />
Quality (MDEQ) in their Atlas <strong>of</strong> Critical Dune Areas, 1989. These critical dune<br />
areas are regulated by Part 353, Sand Dune Protection and Management, <strong>of</strong> the<br />
Natural Resources and Environmental Protection Act, 1994 PA 451. The Sand<br />
Dune Protection and Management Act regulates the sand mining industry, along<br />
with developmental, silvicultural and recreational activities in Michigan's<br />
designated dune areas.<br />
The Sand Dune Protection and Management Act allows for local units to assume<br />
permitting authority by adopting or amending a zoning ordinance that provides<br />
the same or a greater level <strong>of</strong> protection for critical dune areas as the act's model<br />
zoning plan. In the model, uses are prohibited on slopes measuring greater than<br />
33 percent without a variance, and structures are prohibited on the first lakewardfacing<br />
slope <strong>of</strong> a critical dune area. Environmental impact assessments are<br />
required for special use projects. Currently, there are no municipalities in<br />
<strong>Berrien</strong> <strong>County</strong> that have assumed permitting authority for critical dunes.<br />
Picture 2: Critical Dunes<br />
21<br />
For more information<br />
on critical dunes, call<br />
the Land and Water<br />
Management Division<br />
<strong>of</strong> the MDEQ at 517-<br />
373-1170.
M-140I-96REDARROWHWYI-94TERRITORIALRDM-140NAPIERAVEBR94M-63PIPESTONELAKESHOREDRNILESAVEM-139M-63CLEVELANDAVEPIPESTONERDUS31M-140WALTONRDUS31BR12US12M-51BR60US33REDBUDTRAILI-94WARRENWOODSRDREDARRO<br />
22
Farmlands<br />
Prime Farmlands<br />
The National Environmental Policy Act defines several classifications <strong>of</strong> farmland<br />
including Prime and Unique farmland. The Prime and Unique farmland in <strong>Berrien</strong><br />
<strong>County</strong> can be seen on Map 11.<br />
Prime farmland is land that has the best combination <strong>of</strong> physical and chemical<br />
characteristics for producing food, feed, forage, fiber, and oilseed crops, and is<br />
also available for these uses (the land could be cropland, pastureland,<br />
rangeland, forest land, or other land, but not urban built-up land or water). It has<br />
the soil quality, growing season, and moisture supply needed to economically<br />
produce sustained high yields <strong>of</strong> crops when treated and managed, including<br />
water management, according to acceptable farming methods. In general, prime<br />
farmlands have an adequate and dependable water supply from precipitation or<br />
irrigation, a favorable temperature and growing season, acceptable acidity or<br />
alkalinity, acceptable salt and sodium content, and few or no rocks. They are<br />
permeable to water and air. Prime farmlands are not excessively erodible or<br />
saturated with water for a long period <strong>of</strong> time, and they either do not flood<br />
frequently or are protected from flooding.<br />
Unique Farmlands<br />
Unique farmland is land other than prime farmland that is used for the production<br />
<strong>of</strong> specific high value food and fiber crops. It has the special combination <strong>of</strong> soil<br />
quality, location, growing season, and moisture supply needed to economically<br />
produce sustained high quality and/or high yields <strong>of</strong> a specific crop when treated<br />
and managed according to acceptable farming methods.<br />
Farmland Preservation<br />
<strong>Berrien</strong> <strong>County</strong> is experiencing substantial residential development. The<br />
population growth in <strong>Berrien</strong> <strong>County</strong> is not uniform in all jurisdictions. According<br />
to the 2000 Census (See Chapter 2) the county’s population has increased by<br />
1,075 people but there has been a loss <strong>of</strong> population in the urban areas. The<br />
number <strong>of</strong> people and new housing is increasing in Lake, Royalton, Chikaming<br />
and New Buffalo Townships. Historically, these communities were predominantly<br />
farming communities and increasing growth pressures has resulted from sprawl<br />
from the urban areas. The land that is suitable for farming is an irreplaceable<br />
natural resource that cannot be regained once it has been lost to development.<br />
23
Scale:1"=4.5milesSource:UnitedStatesDepartment<strong>of</strong>Agriculture(1983) PrimeandUniqueFarmlands S<br />
Residential <strong>Development</strong> Meets Farmland<br />
24
Picture 3: <strong>Development</strong> Pressure<br />
There are few issues as important, or overlooked as the preservation <strong>of</strong><br />
farmland. Farmland is an important part <strong>of</strong> <strong>Berrien</strong> <strong>County</strong>’s history, culture and<br />
economic structure. According to the 1997 Census <strong>of</strong> Agriculture, there are<br />
173,958 acres <strong>of</strong> farmland in <strong>Berrien</strong> <strong>County</strong>. That means that almost half <strong>of</strong> the<br />
land in <strong>Berrien</strong> <strong>County</strong> is farmland. Yet very little has been done to preserve this<br />
resource. Now is the time to use sound planning principles to direct urban<br />
growth in a way that minimizes the negative impact on agriculture, before it is too<br />
late.<br />
There is a variety <strong>of</strong> programs and zoning strategies available to control this<br />
growth and preserve farmland. Agricultural preservation methods primarily fall in<br />
one <strong>of</strong> four categories: purchase <strong>of</strong> agricultural easement programs, right to farm<br />
laws, agricultural protection zoning, and finally circuit breaker tax relief credits.<br />
No one technique is right for all areas.<br />
Purchase <strong>of</strong> Agricultural Easements (PA 116)<br />
Michigan passed the Farmland and Open Space Preservation Act (Public Act<br />
116) in 1974. The original purpose <strong>of</strong> this act was to slow the conversion <strong>of</strong><br />
farmland to non-farm uses, while providing tax relief to farm owners at the same<br />
time.<br />
Qualifying farmland owners temporarily transfer their development rights to the<br />
state for a period <strong>of</strong> not less than 10 years in exchange for property tax credits. If<br />
a development rights contract expires, the last seven years <strong>of</strong> PA 116 program<br />
credits received are placed as a lien against the property. Repayment <strong>of</strong> the tax<br />
lien is required before the development rights agreement is released and the land<br />
can be converted to other uses.<br />
For farmland to qualify it must meet one <strong>of</strong> three requirements:<br />
25
1. 40 acres or more in size<br />
2. 5 acres or more and less than 40 acres with at least $200 annual gross<br />
income per acre <strong>of</strong> cleared and tillable land from agricultural production<br />
3. a specialty farm <strong>of</strong> 15 or more acres producing an annual gross income <strong>of</strong><br />
$2,000 or more from agricultural uses and designated by the Michigan<br />
Department <strong>of</strong> Agriculture as a specialty farm<br />
For more information on PA 116, call Farmland and Open Space Preservation in<br />
the Real Estate Division <strong>of</strong> the Michigan Department <strong>of</strong> Natural Resources<br />
(MDNR) at 517-373-3328.<br />
Purchase <strong>of</strong> <strong>Development</strong> Rights (PDR)<br />
A purchase <strong>of</strong> <strong>Development</strong> Rights program is a means <strong>of</strong> compensating farmers<br />
for their willingness to accept a permanent deed restriction on their land for nonagricultural<br />
purposes. Land owners are compensated for the fair market value <strong>of</strong><br />
their land, based on the difference between what it could be sold for on the open<br />
market with no restrictions and what it can be sold for once an easement is<br />
placed on the land. The deed restriction prevents physical development <strong>of</strong> the<br />
land, but allows the land to continue to be farmed by the owner.<br />
In 1996, Michigan’s zoning enabling acts were amended to permit local<br />
municipalities to establish their own Purchase <strong>of</strong> <strong>Development</strong> Rights programs.<br />
Also, a statewide PDR was created. This is funded by money recaptured by PA<br />
116 terminations and PA 260 (the agricultural ‘popup’ tax) money. In order to<br />
participate, a local municipality is required to adopt a development rights<br />
ordinance and provide a 25% match <strong>of</strong> funds.<br />
For more information on Purchase <strong>of</strong> <strong>Development</strong> Rights in Michigan, call the<br />
Farmland Preservation Office at the Michigan Department <strong>of</strong> Agriculture at 517-<br />
373-3328.<br />
The Federal Agricultural Improvement Act <strong>of</strong> 1996 (1996 Farmland Bill)<br />
authorized a grant to provide 50% federal matching funds to selected state and<br />
local farmland protection programs.<br />
For information on federal farmland protection programs, call the local USDA<br />
Service Center at 269-471-9111.<br />
Quarter/Quarter Zoning<br />
Quarter/quarter zoning limits landowners to one lot per 40 acres <strong>of</strong> farmland. If a<br />
farmer owned a 200 acre parcel, 5 dwelling units would be allowed to be<br />
constructed. But typically, those are limited to _ acre to 2 acres so as to<br />
preserve the largest amount <strong>of</strong> the land for continued agricultural use.<br />
26
Cluster Zoning<br />
Cluster zoning is a way to allow development in a manner which leaves large<br />
blocks <strong>of</strong> open space or farmland. Michigan Public Acts 177, 178 and 179 <strong>of</strong><br />
2001 mandates qualified communities to include cluster development provisions<br />
in their zoning ordinances.<br />
A qualified community includes any city, township, village or county that meets<br />
the following criteria:<br />
1. has a population <strong>of</strong> 1,800 or more; and<br />
2. has an adopted zoning ordinance; and<br />
3. has undeveloped land that is zoned for residential development at 2 dwelling<br />
units or less per acre unsewered or 3 dwelling units or less per acre if on<br />
public sewers<br />
Cluster zoning groups dwellings on smaller lots on a smaller piece <strong>of</strong><br />
undeveloped tract <strong>of</strong> land in order to preserve the balance <strong>of</strong> the tract as open<br />
space. The law requires qualified counties and townships to build open space<br />
zoning, preserving a minimum <strong>of</strong> 50 percent <strong>of</strong> open space, into their ordinances.<br />
The law requires qualified cities and villages to build open space zoning,<br />
preserving a minimum <strong>of</strong> 20 percent <strong>of</strong> open space, into their ordinances.<br />
Utilities and Services<br />
Utility construction is a two-edged sword. The location <strong>of</strong> water and sanitary<br />
sewer lines (Maps 12 & 13) will largely determine where development will take<br />
place, if the placement <strong>of</strong> these utilities is not adequately correlated with a plan <strong>of</strong><br />
where development should take place, utility construction can accelerate<br />
irrational dispersion and sprawl. Wherever you see water and sewer lines, you<br />
can expect development to follow.<br />
Environmental Quality<br />
<strong>Berrien</strong> <strong>County</strong> is rich in natural resources, and accordingly, the environment is<br />
an integral part <strong>of</strong> economic and recreational activities. The quality <strong>of</strong> life in this<br />
area is dependent upon the conditions <strong>of</strong> air, water, and land. The following<br />
section summarizes the current state and quality <strong>of</strong> these resources.<br />
Air Quality<br />
The Air quality in <strong>Berrien</strong> <strong>County</strong> is monitored by the Michigan Department <strong>of</strong><br />
Environmental Quality’s Air Quality Division (MDEQ’s AQD). Currently, there is<br />
one air monitoring site within the <strong>County</strong>. It is located at 4689 Defield Road in<br />
Coloma at the Paw Paw lake Waste Water Treatment <strong>Plan</strong>t. Pollutant levels and<br />
weather conditions are measured at this site. Specifically, the ozone level has<br />
27
W<br />
Municipal Boundaries<br />
Water Lines<br />
Scale: 1" = 4.5 miles<br />
Source: Local Municipalities<br />
N<br />
S<br />
E<br />
Water Lines<br />
28<br />
MAP 17
W<br />
Municipal Boundaries<br />
Sewer Lines<br />
N<br />
S<br />
E<br />
Scale: 1" = 4.5 miles<br />
Source: Local Municipalities<br />
Sanitary Sewer Lines<br />
29<br />
MAP 16
een monitored on a daily basis since 1992, and levels <strong>of</strong> particulate matter with<br />
diameter less than 2.5 um (micrometer) has been recorded since 1999. Other<br />
parameters monitored include the air temperature, wind speed, wind direction,<br />
and barometric pressure.<br />
Additionally, this monitoring site is used to determine the overall daily health<br />
hazards related to air pollution in the Benton Harbor metropolitan area. The Air<br />
Quality Index created by the U.S. Environmental Protection Agency (EPA)<br />
categorizes each day based on a six point scale ranging from “good” to<br />
“hazardous”. Since 1991, this areas has had eight days classified as “unhealthy”<br />
for the general public. Specific data measurements for this air monitoring station<br />
can be found in the AIRSData database on the EPA’s website<br />
(www.epa.gov/airsweb/).<br />
Groundwater Quality<br />
Most <strong>of</strong> the drinking water that comes into the homes in <strong>Berrien</strong> <strong>County</strong> comes<br />
from groundwater. Groundwater comes from precipitation that has fallen and<br />
seeped through the surface <strong>of</strong> the ground. Areas in <strong>Berrien</strong> <strong>County</strong> are<br />
monitored and tested through wells. These wells provide information on the<br />
depth <strong>of</strong> the water table, contamination problems, and the strata <strong>of</strong> the<br />
surrounding soil.<br />
<strong>Berrien</strong> <strong>County</strong> contains groundwater that ranges in quality from very good to<br />
contaminated. When examining the potential hazard <strong>of</strong> a particular area <strong>of</strong><br />
groundwater, it is best to look at the surrounding area. The fertilization <strong>of</strong> crops,<br />
the salting <strong>of</strong> roads in the winter, and pesticide use are among the factors that<br />
can contribute to groundwater contamination.<br />
The level below ground <strong>of</strong> the water table, is an important factor in the quality <strong>of</strong><br />
the water. The deeper the water table, the deeper water must infiltrate providing<br />
more chance that contamination can be filtered. The depth <strong>of</strong> the water table in<br />
<strong>Berrien</strong> <strong>County</strong> ranges from 22’ to 96’ deep. This range <strong>of</strong> water table depths<br />
can be seen in Map 14.<br />
Surface Water Quality<br />
Surface waters in <strong>Berrien</strong> <strong>County</strong> include Lake Michigan, numerous inland lakes,<br />
and perennial and intermittent rivers. Overall, Michigan’s surface waters meet<br />
the Water Quality Standards set by the state. However, these resources are<br />
threatened by nonpoint source pollution from run<strong>of</strong>f near urban areas,<br />
construction sites, and agricultural lands and by point discharges from municipal<br />
and industrial processes. This can result in increased nutrient enrichment,<br />
sedimentation, and toxins in the waters.<br />
30
Water <strong>Table</strong> (feet)<br />
W<br />
N<br />
S<br />
22 - 28<br />
29 - 33<br />
34 - 45<br />
46 - 56<br />
57 - 96<br />
Not Studied<br />
E<br />
Scale: 1" = 4.5 miles<br />
Average Water <strong>Table</strong> Depth<br />
Source: <strong>Berrien</strong> <strong>County</strong> Groundwater Mapping Notebook,<br />
1981, Southwestern Michigan Commission<br />
31<br />
MAP 14
Lake Michigan is classified as having a moderate nutrient level, and its water<br />
quality has improved with decreasing discharges <strong>of</strong> phosphorus from point<br />
sources. However, the water quality is threatened by the introduction <strong>of</strong> exotic<br />
aquatic species and the presence <strong>of</strong> persistent toxic pollutants. Due to<br />
bioaccumulation <strong>of</strong> toxins in fish tissues, public health fish consumption<br />
advisories are in effect for the Great Lakes.<br />
Nutrient levels are <strong>of</strong> concern for inland lakes in the southern Lower Peninsula<br />
because the majority <strong>of</strong> lakes in this area have high to excessive nutrient levels.<br />
The only lake studied in <strong>Berrien</strong> <strong>County</strong>, Paw Paw Lake, was classified as<br />
eutrophic (high nutrient levels). Elevated nutrient levels are problematic due to<br />
the associated nuisance plant growth and algal blooms. Sources <strong>of</strong> excess<br />
nutrients include sewage, fertilizers, detergents, and surface run<strong>of</strong>f. Additionally,<br />
all <strong>of</strong> Michigan’s inland lakes are under a mercury-based fish consumption<br />
advisory. The mercury largely enters the lake waters via atmospheric deposition.<br />
<strong>Berrien</strong> <strong>County</strong>’s rivers, streams, and creeks are generally considered to be <strong>of</strong><br />
good quality. Areas <strong>of</strong> reduced river quality can be associated with urban areas<br />
and human activities. According to a 1997 study, the majority <strong>of</strong> the Galien River<br />
watershed meets the state’s Water Quality Standards. Sections <strong>of</strong> this<br />
watershed that did not meet these Standards were harmed by untreated sewage<br />
discharge, E. Coli, PCBs, and nuisance algal growths. Over 30 miles <strong>of</strong> the St.<br />
Joseph River had similar water quality problems.<br />
Solid Waste Management<br />
Solid waste refers to garbage, rubbish, yard waste, some sludges and other solid<br />
material byproducts <strong>of</strong> residential, commercial and institutional activities. Most <strong>of</strong><br />
the non-sludge solid waste generated within <strong>Berrien</strong> <strong>County</strong> is disposed <strong>of</strong> in one<br />
<strong>of</strong> the three landfills located in the <strong>County</strong>. Of the remaining portion, roughly<br />
10% is recycled (including municipal or commercial composting operations),<br />
some is landfilled outside the county, while still more is handled directly by<br />
residents through various methods (i.e. home composting, leaf & shrub burning<br />
or burning household trash in burn barrels, as allowed by local ordinance). Also,<br />
a small portion is dumped illegally as litter on roadsides, ravines and secluded<br />
lots. Sludges, most especially from wastewater treatment plants, are primarily<br />
applied to agricultural land as fertilizer.<br />
Map 15 shows the primary solid waste management facilities within <strong>Berrien</strong><br />
<strong>County</strong>, none <strong>of</strong> which is currently owned or operated by the <strong>County</strong>. Transfer<br />
stations consolidate collected solid waste before final transport to a landfill.<br />
Orchard Hill and Forest Lawn are private for-pr<strong>of</strong>it landfills and Southeast <strong>Berrien</strong><br />
<strong>County</strong> is owned by an authority comprised <strong>of</strong> five municipalities in that corner <strong>of</strong><br />
the <strong>County</strong>.<br />
32
#<br />
W<br />
Roads<br />
Water<br />
US 12<br />
N<br />
S<br />
Solid Waste Management Facility Locations<br />
Municipal Boundaries<br />
Solid Waste Facilities<br />
1. United For Survival (R)<br />
2. Orchard Hill Landfill (L,R,C)<br />
3. Gateway (R)<br />
4. Southeast <strong>Berrien</strong> <strong>County</strong> Landfill &<br />
Buchanan City MRF (L,R,C)<br />
5. Forest Lawn Landfill (L,R)<br />
6. Reliable Disposal (T)<br />
7. Gateway West (R)<br />
8. Michiana Recycling and<br />
Disposal (R)<br />
R = recyling facility<br />
L = landfill<br />
T = transfer station<br />
C = composting site<br />
M - 239<br />
E<br />
Scale: 1" = 4.5 miles<br />
RED ARROW HWY<br />
GALIEN RIVER<br />
5<br />
I-94<br />
7<br />
WARREN WOODS RD<br />
US12 PULASKI HWY<br />
6<br />
SHAWNEE RD<br />
Source: <strong>Berrien</strong> <strong>County</strong> Solid Waste Management <strong>Plan</strong>, 2001<br />
I-94<br />
33<br />
LAKESHORE DR<br />
1<br />
NILES AVE<br />
CLEVELAND AVE<br />
PIPESTONE<br />
M-63<br />
M-139<br />
US 31<br />
M-63<br />
BR 94<br />
I-94<br />
M-63<br />
ST. JOSEPH RIVER<br />
I-96<br />
BLUE CREEK<br />
PAW PAW RIVER<br />
PIPESTONE CREEK<br />
PIPESTONE RD<br />
REDBUD TRAIL<br />
RED ARROW HWY<br />
3<br />
SHAWNEE RD OLD US 31<br />
RED BUD TR<br />
COLOMA RD<br />
US 31<br />
WALTON RD<br />
4<br />
I-94<br />
2<br />
TERRITORIAL RD<br />
US 31<br />
NAPIER AVE<br />
BR 12<br />
M-140<br />
M-140<br />
US 12<br />
WATERVLIET RD<br />
M-140<br />
PAINTER SCHOOL RD<br />
US 33<br />
M-62<br />
M-51<br />
DOWAGIAC RIVER<br />
8<br />
BR 12<br />
BR 60<br />
MAP 15
A <strong>County</strong> Solid Waste Management <strong>Plan</strong> (SW<strong>Plan</strong>) is developed periodically, as<br />
required by Michigan's Natural Resources and Environmental Protection Act<br />
(NREPA) and as directed by the Michigan Department <strong>of</strong> Environmental Quality<br />
(MDEQ). <strong>Berrien</strong> <strong>County</strong>'s <strong>Plan</strong>ning Department serves as the Designated<br />
<strong>Plan</strong>ning Agency, to lead its development, in consultation with a 14 member<br />
committee. The most recent SW<strong>Plan</strong> was finalized in March, 2001 and locally<br />
approved by municipalities in June. Final review and approval was granted by<br />
the DEQ on January 28, 2002.<br />
The SW<strong>Plan</strong> established three primary goals for <strong>Berrien</strong> <strong>County</strong>, as follows:<br />
1. Promote a waste management system that protects public health and the<br />
environment, through public and private sector cooperation.<br />
2. Educational programs for the general public and school-aged children, to<br />
inform them on the benefits and opportunities for use <strong>of</strong> sound solid waste<br />
management practices (i.e. using trash collection services vs. creating air<br />
pollution with burn barrels).<br />
3. Establish new and maintain existing programs that employ or advance<br />
waste reduction, recycling and other resource recovery methods.<br />
The SW<strong>Plan</strong> identifies the <strong>Plan</strong>ning Department as the chief implementer <strong>of</strong> its<br />
goals and objectives. Since 1995 the Department has dedicated a full-time staff<br />
position to solid waste management issues, currently in the form <strong>of</strong> a Solid Waste<br />
Management Coordinator. Additionally, the <strong>County</strong> recently added, at the<br />
recommendation <strong>of</strong> the SW<strong>Plan</strong>, a full-time Resource Recovery Educator.<br />
Several programs aimed at achieving the SW<strong>Plan</strong>'s resource recovery objectives<br />
are currently in operation, some for several years, while others are in<br />
development. Highlights include:<br />
1. Household Hazardous Waste Collections - Nine one-day collections are held<br />
annually, for residents to properly dispose <strong>of</strong> potentially toxic waste items from<br />
the home, garden and garage.<br />
2. Clean Sweep (agricultural pesticide) Collections - In cooperation with the<br />
MSU Extension services <strong>of</strong> <strong>Berrien</strong>, Cass and Van Buren counties, and with<br />
financial assistance from a grant from the Michigan Dept. <strong>of</strong> Agriculture, area<br />
growers can safely dispose <strong>of</strong> unwanted or unusable pesticides, at no cost.<br />
3. Well testing, biennially, <strong>of</strong> randomly selected private property wells<br />
surrounding the three landfills and monitoring <strong>of</strong> the landfills' own programs to<br />
screen out improper waste from entering their facilities.<br />
4. Grade appropriate classroom programs (K-8) and a quarterly newsletter<br />
targeting teachers with information on resource recovery opportunities in a<br />
school setting.<br />
5. Expanded access to drop-<strong>of</strong>f recycling sites for under-served rural<br />
populations.<br />
6. Specific collection programs for distinct waste streams, such as mercury<br />
thermometers, medical sharps, tires, appliances and computers.<br />
34
More information on these programs can be obtained either on the internet<br />
(Http:\\www.berriencounty.org) or by calling 269-983-7111 x8350.<br />
35
CHAPTER 2 - SOCIOECONOMIC PROFILE<br />
A demographic analysis provides important insights about a community and<br />
serves as a basis upon which future land use decisions can be made. Included<br />
in this analysis is a review <strong>of</strong> aspects <strong>of</strong> the <strong>County</strong>’s population, housing,<br />
employment trends and projections, tax base, and education. Current estimates,<br />
historic trends and projections are presented.<br />
Data from the 2000 U.S. Census <strong>of</strong> Population and Housing released in 2001<br />
and 2002, and relatively current information compiled from other public and<br />
private sources are provided in this chapter.<br />
Population<br />
Population change in <strong>Berrien</strong> <strong>County</strong> since 1960 is illustrated in Figure 1. In the<br />
1970’s, the county had a significant increase in population.<br />
Population<br />
175,000<br />
170,000<br />
165,000<br />
160,000<br />
155,000<br />
150,000<br />
145,000<br />
140,000<br />
135,000<br />
Figure 1: Population Change, 1990 to 2000<br />
1960 1970 1980 1990 2000<br />
1960 1970 1980 1990 2000<br />
There is a slight growth in total population throughout the <strong>County</strong> since 1990.<br />
The U.S. Census indicates that the county will see a slight drop in future<br />
population projections. Indications from building permits and new construction <strong>of</strong><br />
homes can conclude that the increase in new homes is attracting populations<br />
where the <strong>County</strong> is not their primary residence.<br />
The following table identifies the population change from 1990 to 2000 by<br />
municipality. This is also illustrated in Map #16.<br />
36<br />
Year
51.4<br />
22.0<br />
Population Change<br />
W<br />
-5.0<br />
-12.8 - -4.4<br />
-4.4 - -0.1<br />
0.1 - 3<br />
3.1 - 6<br />
6.1 - 9.9<br />
10 - 15<br />
15 - 25<br />
25.1 - 55<br />
N<br />
S<br />
E<br />
scale 1" = 4.5 miles<br />
Percent Change in Population<br />
From 1990 to 2000<br />
2.0<br />
-1.0<br />
2.4<br />
-0.1<br />
13.5<br />
26.6<br />
16.7<br />
-3.2<br />
-2.3<br />
37<br />
Source: 2000 Census SF-1 and SF-3, 1990 Census STF1A and STF3A.<br />
2.6<br />
-4.6<br />
30.6<br />
4.5<br />
5.5<br />
-12.8<br />
24.0<br />
-3.6<br />
-4.4<br />
0.2<br />
-3.4<br />
8.0<br />
3.2<br />
3.6<br />
-6.2<br />
1.8<br />
-5.0<br />
32.8<br />
9.3<br />
3.9<br />
7.4<br />
-1.3<br />
15.9<br />
-2.0<br />
1.3 6.8 3.9<br />
MAP 16
<strong>Table</strong> 2: Change in Population, 1990 to 2000<br />
Population Pop. Change<br />
2000 1990 1990-2000<br />
<strong>Berrien</strong> <strong>County</strong> 162,453 161,378 0.7%<br />
Bainbridge Township 3,132 2,865 9.3%<br />
Baroda Township 2,022 2,074 -2.5%<br />
Baroda Village 858 657 30.6%<br />
Benton Township 16,404 7,163 -4.4%<br />
<strong>Berrien</strong> Township 4,419 4,203 5.1%<br />
Eau Claire Village 656 494 32.8%<br />
Bertrand Township 2,380 2,228 6.8%<br />
Buchanan Township 3,510 3,402 3.2%<br />
Chikaming Township 3,678 3,717 -1.0%<br />
Coloma Township 5,217 5,123 1.8%<br />
Galien Township 1,018 995 2.3%<br />
Galien Village 593 596 -0.5%<br />
Hagar Township 3,964 4,113 -3.6%<br />
Lake Township 3,148 2,487 26.6%<br />
Lincoln Township 12,761 12,374 3.1%<br />
Stevensville Village 1,191 1,230 -3.2%<br />
New Buffalo Township 2,047 2,109 -2.9%<br />
Grand Beach Village 221 146 51.4%<br />
Michiana Village 200 164 22.0%<br />
Niles Township 13,325 12,828 3.9%<br />
Oronoko Township 7,981 7,892 1.1%<br />
<strong>Berrien</strong> Springs Village 1,862 1,927 -3.4%<br />
Pipestone Township 2,474 2,303 7.4%<br />
Royalton Township 3,888 3,135 24.0%<br />
St. Joseph Township 9,182 8,876 3.4%<br />
Shoreham Village 860 737 16.7%<br />
Sodus Township 2,139 2,065 3.6%<br />
Three Oaks Township 1,120 2,286 -51.0%<br />
Three Oaks Village 1,829 1,786 2.4%<br />
Watervliet Township 3,392 2,926 15.9%<br />
Weesaw Township 2,065 2,114 -2.3%<br />
Benton Harbor City 11,182 12,818 -12.8%<br />
Bridgman City 2,428 2,140 13.5%<br />
Buchanan City 4,681 4,992 -6.2%<br />
Coloma City 1,595 1,679 -5.0%<br />
New Buffalo City 2,200 2,317 -5.0%<br />
Niles City 12,204 12,458 -2.0%<br />
St. Joseph City 8,789 9,214 -4.6%<br />
Watervliet City 1,843 1,867 -1.3%<br />
Source: U.S. Census Bureau Summary File 1<br />
38
Population density can be calculated by dividing the total population by the land<br />
area. With 571 square miles <strong>of</strong> land area that make up the 39 municipalities, the<br />
following table will show the population density <strong>of</strong> each community. At the county<br />
level there is about .44 persons per acre.<br />
<strong>Table</strong> 3: Population Density <strong>of</strong> Local Municipalities, 2000<br />
Community Population Total Area Population Density<br />
39<br />
Square Miles Acres People/Acre<br />
BERRIEN COUNTY 162,453 571 365,440 0.44<br />
Bainbridge Township 3,132 35 22,632 0.14<br />
Baroda Township 2,880 17 10,994 0.26<br />
Benton Township 16,404 33 21,005 0.78<br />
<strong>Berrien</strong> Township 5,075 36 23,161 0.22<br />
Bertrand Township 2,380 35 22,436 0.11<br />
Buchanan Township 3,510 38 24,520 0.14<br />
Chikaming Township 3,678 22 14,164 0.26<br />
Coloma Township 5,217 21 13,312 0.39<br />
Galien Township 1,611 22 14,389 0.11<br />
Hagar Township 3,964 19 11,964 0.33<br />
Lake Township 3,148 19 11,915 0.26<br />
Lincoln Township 13,952 17 10,989 1.27<br />
New Buffalo Township 2,468 19 12,221 0.20<br />
Niles Township 13,325 38 24,586 0.54<br />
Oronoko Township 9,843 32 20,761 0.47<br />
Pipestone Township 2,474 36 22,788 0.11<br />
Royalton Township 3,888 19 11,857 0.33<br />
St. Joseph Township 10,042 6 4,079 2.46<br />
Sodus Township 2,139 20 12,830 0.17<br />
Three Oaks Township 2,949 22 14,384 0.21<br />
Watervliet Township 3,392 17 10,877 0.31<br />
Weesaw Township 2,065 36 22,806 0.09<br />
Benton Harbor City 11,182 4.5 2,860 3.91<br />
Bridgman City 2,428 2.9 1,887 1.29<br />
Buchanan City 4,681 2.6 1,661 2.82<br />
Coloma City 1,595 0.9 568 2.81<br />
New Buffalo City 2,200 2.4 1,550 1.42<br />
Niles City 12,204 5.3 3,396 3.59<br />
St. Joseph City 8,789 3.7 2,352 3.74<br />
Watervliet City 1,843 1.3 808 2.28<br />
Baroda Village 858 0.7 436 1.97<br />
<strong>Berrien</strong> Springs Village 1,862 0.9 607 3.07<br />
Eau Claire Village 656 0.8 487 1.35<br />
Galien Village 593 0.4 272 2.18<br />
Grand Beach Village 221 0.8 530 0.42<br />
Michiana Village 200 0.4 233 0.86<br />
Shoreham Village 860 0.6 366 2.35<br />
Stevensville Village 1,191 1.1 673 1.77<br />
Three Oaks Village 1,829 1.0 628 2.91
Age<br />
Population counts by sex over the past three decades are exhibited in <strong>Table</strong> 4 .<br />
Counts show that the male to female ratio in the <strong>County</strong> has remained fairly<br />
constant and equal.<br />
Male<br />
Female<br />
<strong>Table</strong> 4: Population by Sex in <strong>Berrien</strong> <strong>County</strong><br />
1980 % 1990 % 2000 %<br />
82,642 48.6<br />
88,634 51.4<br />
40<br />
77,324 48.4<br />
84,054 51.6<br />
Total 171,276 161,378 162,453<br />
78,738 48.5<br />
83,715 51.5<br />
The change in population by age group from 1990 to 2000 reveals that the<br />
median age has increased from 33.5 in 1990 to 37.4 in 2000. The graph shows<br />
the change in age group from 1990 to 2000.<br />
85 +<br />
75-84<br />
65-74<br />
60-64<br />
55-59<br />
45-54<br />
35-44<br />
25-34<br />
20-24<br />
15-19<br />
10 14<br />
5 - 9<br />
Under 5<br />
Figure 2: Population by Age Group, 2000<br />
- 5,000 10,000 15,000 20,000 25,000 30,000<br />
Under 5 5 - 9 10 14 15-19 20-24 25-34 35-44 45-54 55-59 60-64 65-74 75-84 85 +<br />
2000 Population 10,583 11,959 12,401 11,726 9,084 19,690 25,033 22,901 8,608 7,019 12,160 8,440 2,849<br />
1990 Population 12,176 12,221 12,091 12,150 10,795 24,960 23,240 16,765 7,171 7,760 12,878 7,103 2,068<br />
Population
50%<br />
45%<br />
40%<br />
35%<br />
30%<br />
25%<br />
20%<br />
15%<br />
10%<br />
5%<br />
0%<br />
-5%<br />
Racial composition among the county region varies significantly. The 2000<br />
Census indicates that there has been an increase in minority populations and a<br />
slight decrease in the majority (white) population. The following graph shows<br />
that percent change in population by race. As the graph indicates, the <strong>County</strong><br />
has seen a high increase in the Hispanic, Latino population.<br />
Figure 3: Percent Change in Population by Race, 1990 to 2000<br />
Total Population White Black or African<br />
American<br />
Native American Asian Hispanic or Latino Other<br />
<strong>Table</strong> 5: Population by Race<br />
1990 2000 % Change<br />
Total Population 161,378 162,453 1%<br />
White 133,259 129,459 -3%<br />
Black or African American 24,872 25,879 4%<br />
Native American 685 691 1%<br />
Asian 1,487 1,849 20%<br />
Hispanic or Latino 2,683 4,888 45%<br />
Other 1,075 1,845 42%<br />
41
Population Projections<br />
Three factors that modify the population <strong>of</strong> an area are births, deaths and<br />
migration. The birth and death rate are factors that can be predicted based upon<br />
trends. The in-and-out migration are largely influenced by the local economy,<br />
transportation accessibility, development policies and local lending policies.<br />
The inability to predict population growth with pinpoint accuracy does not<br />
diminish the importance <strong>of</strong> projections as a guide to local decision-making. For<br />
the purpose <strong>of</strong> this plan, projections are used to assess the effect <strong>of</strong> growth on<br />
current and desired conditions in the <strong>County</strong>. Population projections serve as a<br />
tool for the desired level <strong>of</strong> growth the community can bear without harming its<br />
physical and social environment.<br />
<strong>Table</strong> 6: Population Projections for <strong>Berrien</strong> <strong>County</strong><br />
Year 2000 2005 2010 2015 2020<br />
Regional<br />
Econometric Model,<br />
Inc 1998<br />
Michigan Department<br />
<strong>of</strong> Management &<br />
Budget<br />
Michigan State<br />
University – Census<br />
2000 Project<br />
162,453 162,482 162,636 164,496 167,284<br />
162,300 161,800 160,800 159,700 158,900<br />
162,268 161,761 160,788 159,721 158,914<br />
Source: Michigan Department <strong>of</strong> Management and Budget, Office <strong>of</strong> the State Demographer, January 1996<br />
Notes: The cohort-component method is used to prepare population projections for every five years from<br />
1995 to 2020, based on 1990 census counts, and projected fertility, mortality, and migration rates by age,<br />
sex, and race. Where appropriated, the preliminary July 1, 1995 estimates developed by the Census Bureau<br />
through the Federal-State Cooperative Program are used to adjust the projections and benchmark the<br />
projections from July 1, 1995. The projections represent the July 1 population for subsequent projection<br />
years. The preliminary projections are subject to revision when more recent fertility, mortality, and migration<br />
data become available.<br />
The three population projections above can also be seen in Figure 4 below.<br />
42
Housing<br />
University – Census<br />
Population<br />
168,000<br />
166,000<br />
164,000<br />
162,000<br />
160,000<br />
158,000<br />
156,000<br />
154,000<br />
Figure 4: Population Projections<br />
2000 2005 2010 2015 2020<br />
Year<br />
As the economy during the 1990’s was extremely strong, new housing stock was<br />
the result. Overall, the current housing stock, consisting <strong>of</strong> 73,445 units, is<br />
predominately old. Sixty –five percent <strong>of</strong> the housing stock is over 30 years old.<br />
<strong>Table</strong> 7 illustrates the number <strong>of</strong> units built over the years.<br />
<strong>Table</strong> 7: Housing Stock<br />
Year Structure Built Number Percent<br />
1999 to March 2000 1,199 1.6<br />
1995 to 1998 3,475 4.7<br />
1990 to 1994 3,413 4.6<br />
1980 to 1989 6,044 8.2<br />
1970 to 1979 11,664 15.9<br />
1960 to 1969 11,432 15.6<br />
1940 to 1959 20, 476 27.9<br />
1939 or earlier 15,742 21.4<br />
Source: U.S. Bureau <strong>of</strong> the Census, Census 2000 SF-3.<br />
There is an increase in new development throughout the county. According to<br />
the <strong>Berrien</strong> <strong>County</strong> Economic <strong>Development</strong> Department, in 2001, 1,416 building<br />
permits were issued for residential uses. The figure represents any permit<br />
necessary for residential uses, such as renovation or new construction.<br />
While there are 73,445 total housing units, approximately 86.6 % (63,569) are<br />
occupied. This figure includes homes for sale, which were unoccupied. Of the<br />
13.4 percent that is vacant, 7.2 percent, (5,259) represents housing units for<br />
seasonal, recreational or occasional use.<br />
43<br />
Regional<br />
Econometric Model,<br />
Inc 1998<br />
Michigan Department<br />
<strong>of</strong> Management &<br />
Budget<br />
Michigan State<br />
2000 Project
The 2000 U.S. Census data shows change in the type <strong>of</strong> housing since 1990.<br />
The majority <strong>of</strong> the housing units consist <strong>of</strong> single family (1-unit) which make up<br />
about 76 percent <strong>of</strong> the housing stock. Duplexes have decreased by 8.6%<br />
throughout the <strong>County</strong>.<br />
As for unit sizes available, Forty percent <strong>of</strong> the <strong>County</strong> featured mostly two and<br />
three bedroom units in 2000. Of the units available, only 8.9 percent have four<br />
bedrooms and 8.1 percent have 5 or more bedrooms available.<br />
Number <strong>of</strong> Households/Household Size<br />
According to the 2000 Census, the number <strong>of</strong> households in <strong>Berrien</strong> <strong>County</strong><br />
increased by 2,544 from 61,025 in 1990 to 63,569 in 2000 (<strong>Table</strong> 8). The<br />
change in total households by municipality can be seen on Map 17. The<br />
increase in households is much higher than the increase <strong>of</strong> 1,075 in population.<br />
The slower population growth being experienced by <strong>Berrien</strong> <strong>County</strong> can be<br />
partially explained by the average household size. While the total number <strong>of</strong><br />
households has increased, the average household size decreased from 2.60 to<br />
2.49. Given the 63,569 total households in 2000, if the average household size<br />
had remained at 2.60 the population would have increased by 3,901 to a total <strong>of</strong><br />
165,279. The decrease in household size is likely related to the national trends<br />
<strong>of</strong> couples getting married when they are older and waiting longer to have<br />
children.<br />
The following table illustrates the breakdown <strong>of</strong> Households by family type.<br />
<strong>Table</strong> 8: Households by Family Type 2000 Census 1990-2000 1990 Census<br />
Number % % change Number %<br />
Total Households: 63,569 4.2 61,025<br />
Family households (families) 43,336 68.2 -1.2 43,845 71.8<br />
with own children under 18 19,850 31.2 -10.9 22,280 36.5<br />
Married-couple family 32,550 51.2 -4.2 33,974 55.7<br />
with own children under 18 13,283 20.9 -13.9 15,434 25.3<br />
Female householder, no husband present 8,419 13.2 4 8,099 13.3<br />
with own children under 18 5,283 8.3 -10.9 5,927 9.7<br />
Nonfamily households 20,233 31.8 17.8 17,180 28.2<br />
Householder living alone 17,196 27.1 15.7 14,861 24.4<br />
Householder 65 years and over 6,883 10.8 7.4 6,406 10.5<br />
Households with individuals under 18 years 21,934 34.5 -2.9 22,588 37<br />
Households with individuals 65 years and over 16,474 25.9 4.7 15,729 25.8<br />
Average household size 2.49 2.60<br />
Average family size 3.01 3.10<br />
44
56.5<br />
31.7<br />
W<br />
Percent Change in Total Households<br />
From 1990 to 2000<br />
Percent Change in Number <strong>of</strong> Households<br />
-13.1<br />
-13.1 - -0.3<br />
-0.3 - 4.2<br />
4.2 - 7.5<br />
7.5 - 12.2<br />
12.2 - 25.5<br />
25.5 - 56.5<br />
N<br />
S<br />
-0.3<br />
E<br />
scale 1" = 4.5 miles<br />
12.2<br />
7.5<br />
7.5<br />
6.6<br />
18.7<br />
36.2<br />
25.5<br />
-3.5<br />
7.1<br />
4.2<br />
8.8<br />
45<br />
Source: 2000 Census SF-1 and SF-3, 1990 Census STF1A and STF3A.<br />
-13.1<br />
-2.0<br />
5.0<br />
10.8<br />
31.6<br />
7.1<br />
20.1<br />
3.2<br />
-1.1<br />
9.5<br />
5.5<br />
6.3<br />
-3.8<br />
9.1<br />
-3.7<br />
10.9<br />
-0.6<br />
23.4<br />
5.5<br />
6.0<br />
8.5<br />
10.7<br />
2.3<br />
-1.6<br />
18.3<br />
MAP 17
Housing Values<br />
The median housing value helps identify how the county and communities are<br />
developing. The <strong>County</strong> Median Household Income is 38,567. The household<br />
income is defined by the census as any income within the household (not<br />
related). In a general term, the housing values along Lake Michigan are<br />
comparably higher. Housing costs and values increased significantly countywide<br />
over the past 10 years.<br />
<strong>Table</strong> 9: Median Household Income and Median House Value<br />
Community Median Hshld Median House Affordable<br />
Income Value Unit Price*<br />
BERRIEN COUNTY 38,567 94,700 96,418<br />
Bainbridge Township 38,750 90,300 96,875<br />
Baroda Township 44,219 109,700 110,548<br />
Benton Township 25,942 64,400 64,855<br />
<strong>Berrien</strong> Township 46,293 115,100 115,733<br />
Bertrand Township 55,183 100,000 137,958<br />
Buchanan Township 40,503 95,000 101,258<br />
Chikaming Township 47,778 162,200 119,445<br />
Coloma Township 40,029 95,400 100,073<br />
Galien Township 37,434 77,100 93,585<br />
Hagar Township 38,614 89,300 96,535<br />
Lake Township 49,764 122,700 124,410<br />
Lincoln Township 53,718 133,400 134,295<br />
New Buffalo Township 46,991 169,500 117,478<br />
Niles Township 37,794 80,000 94,485<br />
Oronoko Township 35,980 111,600 89,950<br />
Pipestone Township 41,440 89,800 103,600<br />
Royalton Township 69,375 172,700 173,438<br />
St. Joseph Township 54,158 113,500 135,395<br />
Sodus Township 33,804 89,200 84,510<br />
Three Oaks Township 36,989 86,400 92,473<br />
Watervliet Township 39,152 89,800 97,880<br />
Weesaw Township 41,434 92,600 103,585<br />
Benton Harbor City 17,471 38,700 43,678<br />
Bridgman City 48,292 122,600 120,730<br />
Buchanan City 34,244 69,300 85,610<br />
Coloma City 38,882 79,500 97,205<br />
New Buffalo City 41,658 103,000 104,145<br />
Niles City 31,208 69,600 78,020<br />
St. Joseph City 37,032 100,000 92,580<br />
Watervliet City 38,681 72,400 96,703<br />
*Affordable Unit Price is based on Household Median Income multiplied by 2.5<br />
**Villages are included in Township totals.<br />
46
Quality <strong>of</strong> Housing<br />
Since 1990, the median house value has increased by $27,369 (Year 2000<br />
dollars) to $94,700. It can be assumed that since housing values have<br />
increased, so has the quality <strong>of</strong> housing. According to the 2000 Census, only<br />
256 housing units lacked complete plumbing facilities. This is a decrease <strong>of</strong> 11<br />
percent since 1990.<br />
There are three Public Housing Agencies in the <strong>County</strong>, the Benton Harbor<br />
Housing Commission, St. Joseph Housing Commission and the Niles Housing<br />
Commission. Each agency owns and operates housing for low-income<br />
individuals. Benton Harbor Housing Commission also administers Section 8<br />
Vouchers for the community.<br />
In an effort to continue to achieve quality housing in <strong>Berrien</strong> <strong>County</strong>, the <strong>County</strong><br />
Homeowner Rehabilitation Program was initiated in 1999 to address the needs <strong>of</strong><br />
homeowner repairs to low income homeowners throughout the county.<br />
Housing <strong>Development</strong>s<br />
As the housing stock is increasing and the average household size is smaller,<br />
new developments are the current trend. Information retained from the <strong>Berrien</strong><br />
<strong>County</strong> Register <strong>of</strong> Deeds indicates there is an increasing growth in<br />
condominiums throughout the <strong>County</strong>. In addition, subdivisions in several<br />
townships are being approved for development. Since 1990, there have been 83<br />
new condominium developments and 77 new subdivisions.<br />
Employment<br />
This section will include the major employers, employment statistics, income<br />
statistics, and number <strong>of</strong> establishments.<br />
47
Figure 5: Occupation <strong>of</strong> Employed Population 16 years and older, 2000<br />
According to the <strong>Berrien</strong> <strong>County</strong> Economic <strong>Development</strong> Department, Lakeland<br />
Regional Health System is the <strong>County</strong>’s largest employer.<br />
<strong>Table</strong> 10: <strong>Berrien</strong> <strong>County</strong>’s Ten Largest Employers<br />
# 10 Largest<br />
Employers<br />
1 Lakeland Reg.<br />
Health System, Inc<br />
2 Whirlpool<br />
Corporation<br />
3 Michigan Pizza Hut,<br />
Inc.<br />
4 American Electric<br />
Power<br />
5 Bosch Braking<br />
Systems<br />
Occupation <strong>of</strong> Employed Population<br />
16 years and older<br />
Management, pr<strong>of</strong>essional, and related occupations<br />
Service occupations<br />
Sales and <strong>of</strong>fice occupations<br />
Farming, fishing and forestry occupations<br />
Construction, extraction, and maintenance occupations<br />
Other<br />
Product/Service Employment<br />
levels as <strong>of</strong><br />
Jan. 2001<br />
48<br />
Employment<br />
levels as <strong>of</strong><br />
Sept. 2000<br />
Health Care 3000 3000<br />
Residential major home<br />
appliances<br />
2300 2230<br />
Restaurant 1428 nbsp;<br />
Electric Services 1350 1320<br />
Auto parts, hydraulics &<br />
ductile iron castings<br />
1300 1358<br />
6 Benton Harbor Area<br />
Schools<br />
Education 1025 1060<br />
7 Andrews University Education 900 850<br />
8 Leco Corporation Determinators for gases<br />
in metals,carbon,etc<br />
750 650<br />
9 <strong>Berrien</strong> <strong>County</strong> Legislative bodies 744 725<br />
10 Gast Manufacturing Air Motors, pumps &<br />
compressors<br />
600 590
The top ten employers cover a wide range <strong>of</strong> occupations. The following figure<br />
identifies the type <strong>of</strong> occupations throughout the <strong>County</strong>. Management,<br />
pr<strong>of</strong>essional, and related occupations make up 29.3 percent <strong>of</strong> the working<br />
population. Sales and <strong>of</strong>fice occupations make up 24.1 percent. Farming,<br />
fishing and forestry make up 1 percent, yet they have the largest land use in the<br />
<strong>County</strong>.<br />
<strong>Table</strong> 11 shows the employment forecast by industry for 1998 to 2008. <strong>Berrien</strong><br />
<strong>County</strong>’s total employment is expected to grow by 2008. Total employment is<br />
expected to increase 6.40 percent or 8,945 jobs between 1998 and year 2008.<br />
Technicians and related support is expected to have the highest percentage<br />
increase (13.5). The largest numeric increase <strong>of</strong> jobs will be in the services<br />
sector with a projected increase <strong>of</strong> 1,945 jobs.<br />
<strong>Table</strong> 11: Employment Projections<br />
Occupational Group Employment Change Average Annual Openings<br />
1998 2008 Level % Growth Replacem<br />
ent<br />
49<br />
Total<br />
Total, All Occupations 139,875 148,820 8,945 6.40% 897 3,368 4,265<br />
Executive,<br />
Administrative, and<br />
Managerial<br />
13,460 14,410 950 7.10% 96 249 345<br />
Pr<strong>of</strong>essional Specialty 17,420 19,300 1,880 10.80% 186 339 525<br />
Technicians and<br />
Related Support<br />
5,300 6,015 715 13.50% 74 121 195<br />
Marketing and Sales 12,925 13,415 490 3.80% 50 385 435<br />
Administrative Support,<br />
Clerical<br />
19,695 19,880 185 0.90% 19 389 408<br />
Service 23,305 25,250 1,945 8.30% 196 809 1,005<br />
Agricultural, Forestry,<br />
Fishing, and Related<br />
Precision Production,<br />
Craft, and Repair<br />
Operators, Fabricators,<br />
and Laborers<br />
7,035 7,305 270 3.90% 27 146 173<br />
17,535 18,485 950 5.40% 96 402 498<br />
22,720 24,275 1,555 6.80% 152 521 673<br />
Note:The Southwest Michigan area is comprised <strong>of</strong> <strong>Berrien</strong>, Cass and Van Buren counties. Employment totals<br />
may not add up due to rounding. Percent change is based on unrounded numbers. Replacement openings<br />
reflect permanent separations (such as death, retirement, disability, etc.) but do not reflect total job turnover.<br />
Further information may be found at<br />
Source: Michigan Department <strong>of</strong> Career <strong>Development</strong><br />
Unemployment<br />
According to the Michigan Department <strong>of</strong> Career <strong>Development</strong>, unemployment<br />
rates in <strong>Berrien</strong> <strong>County</strong> have remained constant with the State <strong>of</strong> Michigan over<br />
the past decade.
Figure 6: Unemployment Trends, 1990 to 2002<br />
10<br />
9<br />
8<br />
7<br />
6<br />
5<br />
4<br />
3<br />
2<br />
1<br />
0<br />
1990<br />
1991<br />
1992<br />
1993<br />
Income Characteristics<br />
Median Household Income for <strong>Berrien</strong> <strong>County</strong> is currently $38,567, up from<br />
$35,360 in 1990 (adjusted to year 2000 dollars), an increase <strong>of</strong> over 9 percent.<br />
Compared to the State <strong>of</strong> Michigan, the <strong>County</strong> is below the median income,<br />
which is $44,667. The following figure shows the household income distribution<br />
for 2000.<br />
Figure 7: Household Income Distribution, 2000<br />
$150,000 to $199,999<br />
$75,000 to $99,999<br />
$35,000 - $49,999<br />
$15,000 - $24,999<br />
Less than $10,000<br />
1994<br />
1995<br />
1996<br />
1997<br />
1998<br />
50<br />
1999<br />
2000<br />
2001<br />
2002<br />
Household Income Distribution 2000<br />
- 5,000 10,000 15,000<br />
<strong>Berrien</strong> <strong>County</strong><br />
Michigan<br />
United States<br />
Number <strong>of</strong><br />
Households
<strong>Table</strong> 12: Median Family/Household Income, 2000<br />
Community Median Hshld Median Family Per Capita<br />
Income Income Income ($)<br />
BERRIEN COUNTY 38,567 46,548 19,952<br />
Bainbridge Township 38,750 46,250 17,854<br />
Baroda Township 44,219 47,161 21,837<br />
Benton Township 25,942 30,899 14,137<br />
<strong>Berrien</strong> Township 46,293 49,390 18,448<br />
Bertrand Township 55,183 59,118 22,130<br />
Buchanan Township 40,503 46,797 19,572<br />
Chikaming Township 47,778 53,942 30,868<br />
Coloma Township 40,029 44,859 20,377<br />
Galien Township 37,434 44,706 17,850<br />
Hagar Township 38,614 47,768 19,710<br />
Lake Township 49,764 57,228 21,667<br />
Lincoln Township 53,718 64,211 27,559<br />
New Buffalo Township 46,991 58,333 33,587<br />
Niles Township 37,794 44,446 18,249<br />
Oronoko Township 35,980 45,998 16,904<br />
Pipestone Township 41,440 45,859 16,423<br />
Royalton Township 69,375 76,295 26,926<br />
St. Joseph Township 54,158 60,743 28,095<br />
Sodus Township 33,804 42,250 17,646<br />
Three Oaks Township 36,989 45,302 17,901<br />
Watervliet Township 39,152 45,709 22,134<br />
Weesaw Township 41,434 45,511 18,159<br />
Benton Harbor City 17,471 19,250 8,965<br />
Bridgman City 48,292 56,466 25,405<br />
Buchanan City 34,244 43,860 16,600<br />
Coloma City 38,882 46,042 17,714<br />
New Buffalo City 41,658 52,639 24,440<br />
Niles City 31,208 38,870 16,584<br />
St. Joseph City 37,032 51,328 24,949<br />
Watervliet City 38,681 42,391 16,691<br />
*Affordable Unit Price is based on Household median income multiplied by 2.5<br />
Villages are included in Township total<br />
Education<br />
There are 16 public school districts, 30 private/parochial, and two public school<br />
academies in the <strong>County</strong>. (Map 18) According to the 2000 census, 29,777<br />
students are enrolled in grades 1-12. Compared to the enrollment <strong>of</strong> 29,816 in<br />
1990, there has been very little change.<br />
Educational attainment is computed from the population 25 years and over. Of<br />
the 106,690, 81.9% <strong>of</strong> the population has received a high school degree or<br />
higher. Compared to 1990, the county has increased by 7.2% <strong>of</strong> high school<br />
51
School Districts<br />
å<br />
å Building, Private School<br />
W<br />
Benton Harbor<br />
<strong>Berrien</strong><br />
Brandywine<br />
Bridgman<br />
Buchanan<br />
Coloma<br />
Covert<br />
Dowagiac<br />
Eau Claire<br />
Building, Public School<br />
N<br />
S<br />
E<br />
Scale: 1" = 4.5 miles<br />
ååå<br />
å<br />
School Districts & Facilities<br />
Galien<br />
Lakeshore<br />
New Buffalo<br />
Niles<br />
River School<br />
River Valley<br />
Riverside<br />
St. Joseph<br />
Watervliet<br />
å<br />
å<br />
å<br />
å<br />
å<br />
å<br />
åå<br />
Source: United States Census Bureau, Tiger Files (1995).<br />
å<br />
52<br />
å åå<br />
åååå å<br />
å åå<br />
å å<br />
å å<br />
å<br />
å å<br />
å å<br />
å<br />
å<br />
å<br />
å å<br />
åå å å<br />
å å<br />
åå<br />
å<br />
å<br />
å<br />
å<br />
å<br />
å å<br />
å<br />
å å<br />
å<br />
å<br />
å<br />
å<br />
å<br />
å å<br />
å<br />
å å<br />
å<br />
å<br />
å<br />
å<br />
å<br />
å<br />
å<br />
å<br />
å<br />
å<br />
å<br />
å<br />
å<br />
å<br />
å<br />
å<br />
å å<br />
å<br />
å åå<br />
å å<br />
åå<br />
MAP 18
Figure 8: Education Attainment, 2000<br />
12%<br />
8%<br />
7%<br />
23%<br />
53<br />
6% 12%<br />
32%<br />
less than 9th grade<br />
9th to 12th grade, no diploma<br />
high school graduate (includes equivilency)<br />
some college, no degree<br />
associates degree<br />
bachelor's degree<br />
graduate or pr<strong>of</strong>essional degree
CHAPTER 3 – COMMUNITY FACILITIES<br />
Parks and Recreation Facilities<br />
Many <strong>of</strong> the <strong>County</strong>’s 225 parks and open spaces are located within cities and<br />
Lake Michigan coastal communities as can be seen on Map 19. A listing <strong>of</strong> the<br />
number <strong>of</strong> parks and acreage by ownership can be seen in <strong>Table</strong> 13.<br />
The <strong>Berrien</strong> <strong>County</strong> Parks and Recreation Commission adopted their current<br />
Parks and Recreation <strong>Plan</strong> in February <strong>of</strong> 2001. The purpose <strong>of</strong> the <strong>Plan</strong> is to<br />
help guide <strong>Berrien</strong> <strong>County</strong> in its parks and recreation planning and development<br />
efforts over the next five years. The <strong>Plan</strong> details the current inventory <strong>of</strong> parks,<br />
open spaces and other recreational resources in the <strong>County</strong> along with the<br />
Commission’s goals and objectives. The Commission is required to adopt a <strong>Plan</strong><br />
every five years to be eligible for state and federal recreation grants.<br />
More information can be obtained by contacting 269-983-7111 x8435, at the<br />
<strong>Berrien</strong> <strong>County</strong> Parks and Recreation Department, 701 Main Street, St. Joseph,<br />
Michigan 49085.<br />
Picture 4: Sculpture (And You, Seas, Richard Hunt)<br />
Silver Beach <strong>County</strong> Park, St. Joseph<br />
54
Parks and Open Spaces<br />
by Ownership<br />
W<br />
N<br />
S<br />
<strong>County</strong><br />
Local Municipality<br />
State<br />
Private<br />
Municipal Boundaries<br />
Source: Local Park <strong>Plan</strong>s, various years.<br />
E<br />
Scale: 1" = 4.5 miles<br />
Parks and Open Spaces<br />
55<br />
MAP 19
One <strong>of</strong> the goals listed in the Parks and Recreation <strong>Plan</strong> include doing a<br />
Blossomland Trail Study. The <strong>Berrien</strong> <strong>County</strong> Parks and Recreation Commission<br />
intends to evaluate the feasibility <strong>of</strong> establishing a 3.5 mile non-motorized<br />
recreation trail from the Indiana line to Benton Harbor. The Blossomland Trail<br />
Concept Map (Map 20) identifies three possible alternative routes, which will be<br />
the subject <strong>of</strong> a detailed evaluation in the future. See Chapter 4, for more<br />
information on non-motorized transportation.<br />
Another goal <strong>of</strong> the Commission is to evaluate the availability and cost <strong>of</strong><br />
acquiring additional land as part <strong>of</strong> the Love Creek Park Preserve to link the<br />
original Love Creek Park property with the 95 acres <strong>of</strong> land deeded to <strong>Berrien</strong><br />
<strong>County</strong> from the Nature Conservancy. Map 21 shows the area around Love<br />
Creek Park Preserve.<br />
<strong>Table</strong> 13: Parks and Open Spaces by Ownership<br />
Ownership # Parks Total Acreage<br />
Bainbridge Township 0 0<br />
Baroda Township 2 30.81<br />
Baroda Village 1 1.51<br />
Benton Harbor City 16 133.32<br />
Benton Township 4 74.33<br />
<strong>Berrien</strong> Springs Village 3 45.94<br />
<strong>Berrien</strong> Township 1 22.16<br />
Bertrand Township 1 1.38<br />
Bridgman City 2 48.38<br />
Buchanan City 14 112.98<br />
Buchanan Township 2 106.80<br />
Chikaming & New Buffalo Township 1 2.03<br />
Chikaming Township 8 107.06<br />
Coloma City 4 3.51<br />
Coloma Township 1 0.22<br />
Eau Claire Village 2 11.17<br />
Galien Township 0 0<br />
Galien Village 1 5.56<br />
Grand Beach Village 1 0.54<br />
Hagar Township 5 140.06<br />
Lake Township 2 136.01<br />
Lincoln Township 13 134.53<br />
Michiana Village 1 2.10<br />
New Buffalo City 3 24.86<br />
New Buffalo Township 2 43.73<br />
Niles City 35 181.52<br />
Niles Township 7 62.03<br />
Oronoko Township 1 10.74<br />
56
Pipestone Township 0 0<br />
Royalton Township 1 8.08<br />
Shoreham Village 1 14.88<br />
Sodus Township 2 0.82<br />
St. Joseph City 16 195.41<br />
St. Joseph Township 12 160.45<br />
Stevensville Village 1 12.63<br />
Three Oaks Township 1 66.78<br />
Three Oaks Village 3 8.34<br />
Watervliet City 4 31.87<br />
Watervliet Township 6 1.76<br />
Weesaw Township 0 0<br />
<strong>Berrien</strong> <strong>County</strong> 6 450.52<br />
State <strong>of</strong> Michigan 26 1,260.65<br />
Private 13 3,062.76<br />
Total <strong>of</strong> all Parks and Open Space 225 6718.23<br />
<strong>County</strong> Facilities<br />
The majority <strong>of</strong> <strong>County</strong> facilities are situated near the <strong>County</strong> seat in St. Joseph<br />
(Map 22). Information on the location <strong>of</strong> various services can be found either by<br />
calling 269-983-7111 or on the web at www.berriencounty.org.<br />
The <strong>County</strong> began undertaking a $10.2 million buildings and facilities upgrade in<br />
2001. Some <strong>of</strong> the changes to the <strong>Berrien</strong> <strong>County</strong> Courthouse in St. Joseph will<br />
include the addition <strong>of</strong> a drive-through cashier kiosk on the north side <strong>of</strong> the<br />
building, a canopied courthouse entrance plaza, and the reconfiguration <strong>of</strong> the<br />
parking lots. The facility upgrades will also include an expansion <strong>of</strong> the South<br />
<strong>County</strong> Building to better serve residents living in the south part <strong>of</strong> the <strong>County</strong>.<br />
More information on various <strong>County</strong> services can be<br />
found by calling<br />
269-983-7111 or<br />
on the internet at www.berriencounty.org<br />
Picture 6: Old <strong>Berrien</strong> <strong>County</strong> Courthouse in <strong>Berrien</strong> Springs<br />
Historic Sites<br />
Historic locations can be found on Map 23, page 63 along with a listing on the<br />
following page.<br />
57
Alternative Bike Trails<br />
W<br />
S<br />
Old 31 Right-<strong>of</strong>-way<br />
Abandoned Railroad Line<br />
American Electric Power Line<br />
Water<br />
Municipal Boundaries<br />
Cities & Villages<br />
N<br />
E<br />
Scale: 1" = 4.5 miles<br />
Blossomland Trail Concept<br />
Source: <strong>Berrien</strong> <strong>County</strong> Parks and Recreation <strong>Plan</strong>, 2001<br />
City <strong>of</strong><br />
Benton Harbor<br />
City <strong>of</strong><br />
St. Joseph<br />
58<br />
Village <strong>of</strong><br />
<strong>Berrien</strong> Springs<br />
City <strong>of</strong><br />
Niles<br />
Indiana-Michigan Border<br />
MAP 20
W<br />
N<br />
S<br />
Scale: 5" = 1 mile<br />
Source: <strong>Berrien</strong> <strong>County</strong> Parks and Recreation <strong>Plan</strong>, 2001<br />
E<br />
Love Creek <strong>County</strong> Park<br />
59<br />
Dean's Hill Road<br />
Huckleberry Road<br />
MAP 21
Benton Harbor - St. Joseph Detail<br />
W<br />
Ê Ê 15 3<br />
Ê<br />
Ê14 4<br />
1<br />
Ê8<br />
NILES AV<br />
LAKE SHORE DR<br />
Municipal Boundaries<br />
Roads<br />
Ê <strong>County</strong> Facility Locations<br />
N<br />
US 12<br />
E<br />
S<br />
Scale: 1" = 4.5 miles<br />
<strong>Berrien</strong> <strong>County</strong> Government Facilities<br />
MAIN<br />
NAPIER AV<br />
19<br />
PIPESTONE RD<br />
M - 239<br />
Ê7<br />
20<br />
Ê<br />
FAIR<br />
5 Ê<br />
M-139<br />
MARTIN LUTHER KING DR<br />
Source: <strong>Berrien</strong> <strong>County</strong> GIS, 2002.<br />
<strong>County</strong> Facilities<br />
1 Administration Center<br />
2 Animal Control<br />
3 Courthouse<br />
4 Family Independance Agency<br />
5 Health Department<br />
6 Health Department<br />
7 Health Department<br />
I94<br />
RED ARROW HWY<br />
I-94<br />
18<br />
Ê<br />
WARREN WOODS RD<br />
US12 PULASKI HWY<br />
See Inset<br />
I-94<br />
Ê<br />
Ê<br />
6<br />
17<br />
SHAWNEE RD<br />
8 Health Department - School Based Clinic<br />
9 Juvenile Center<br />
10 Love Creek Nature Center<br />
11 MSU Extension<br />
12 Madeline Bertrand Park<br />
60<br />
13 Marine Division<br />
14 Sheriff's Department<br />
Ê Ê<br />
Ê<br />
Ê<br />
Ê<br />
Ê<br />
CLEVELAND AVE<br />
M-63<br />
Ê<br />
5<br />
M-139<br />
US 31<br />
SHAWNEE RD<br />
M-63<br />
BR 94<br />
I-94<br />
M-63<br />
13<br />
Ê<br />
PIPESTONE RD<br />
I-96<br />
COLOMA RD<br />
Ê<br />
OLD US 31<br />
RED BUD TR<br />
REDBUD TRAIL<br />
RED ARROW HWY<br />
11<br />
US 31<br />
WALTON RD<br />
Ê<br />
Ê Ê<br />
I-94<br />
TERRITORIAL RD<br />
US 31<br />
NAPIER AVE<br />
9<br />
10<br />
2<br />
BR 12<br />
16<br />
M-140<br />
Ê<br />
Ê<br />
M-140<br />
WATERVLIET RD<br />
US 12<br />
M-140<br />
PAINTER SCHOOL RD<br />
12<br />
US 33<br />
M-62<br />
M-51<br />
BR 60<br />
BR 12<br />
15 Silver Beach <strong>County</strong> Park<br />
16 South <strong>County</strong> Building<br />
17 Stevensville Complex<br />
18 Three Oaks Building<br />
19 Youth Service and Assistance Bureau<br />
20 Galien River <strong>County</strong> Park<br />
MAP 22
St. Joseph-Benton Harbor<br />
#<br />
25<br />
62<br />
#<br />
98 9<br />
#<br />
#<br />
41 32 #<br />
#<br />
# # # #<br />
#<br />
# #<br />
#<br />
# # 59<br />
#<br />
72 #<br />
#<br />
# 86<br />
#<br />
67<br />
#<br />
23<br />
19 89<br />
#<br />
6<br />
44<br />
#<br />
38<br />
60<br />
27 #<br />
#<br />
#<br />
#<br />
61<br />
#<br />
#<br />
31<br />
#<br />
18<br />
#<br />
#<br />
84<br />
5<br />
66<br />
#<br />
12 #<br />
#<br />
16<br />
2<br />
30<br />
#<br />
W<br />
13<br />
N<br />
S<br />
E<br />
Scale: 1" = 4.5 miles<br />
City <strong>of</strong> Niles<br />
#<br />
22<br />
# #<br />
#<br />
#<br />
#<br />
#<br />
14<br />
68<br />
#<br />
34 79 29<br />
#<br />
#<br />
#<br />
#<br />
74 # # #<br />
# #<br />
# # #<br />
52 17<br />
#<br />
#<br />
88 93 # #<br />
#<br />
35<br />
69<br />
37 #<br />
#<br />
#<br />
50<br />
46<br />
#<br />
28<br />
#<br />
# 33<br />
51<br />
# 54<br />
Sources: National Register <strong>of</strong> Historic Places,<br />
Michigan State Register <strong>of</strong> Historic Places,<br />
and the <strong>Berrien</strong> Community Foundation<br />
#<br />
#<br />
#<br />
85<br />
92<br />
#<br />
49<br />
#<br />
#<br />
80<br />
#<br />
Historic Sites<br />
#<br />
#<br />
97<br />
96<br />
78 8<br />
# #<br />
24<br />
21<br />
91<br />
#<br />
83<br />
3 57<br />
#<br />
Historic Sites<br />
# National Register <strong>of</strong> Historic Places Site<br />
# State Register <strong>of</strong> Historic Places Site<br />
# Site <strong>of</strong> Local Historic Significance<br />
Municipal Boundaries<br />
61<br />
#<br />
#<br />
82<br />
55<br />
53 81<br />
39<br />
#<br />
#<br />
# #<br />
#<br />
# #<br />
# # ## # #<br />
# # #<br />
# # #<br />
# #<br />
#<br />
#<br />
# #<br />
#<br />
#<br />
#<br />
#<br />
77<br />
94<br />
11<br />
See Inset<br />
#<br />
42<br />
43<br />
45<br />
#<br />
#<br />
#<br />
40<br />
36<br />
#<br />
#<br />
#<br />
#<br />
#<br />
#<br />
26<br />
90<br />
56<br />
#<br />
15<br />
#<br />
#<br />
#<br />
#<br />
#<br />
#<br />
#<br />
# 64<br />
#<br />
#<br />
#<br />
#<br />
#<br />
#<br />
#<br />
#<br />
See Inset<br />
75<br />
71<br />
65<br />
4<br />
10<br />
1<br />
20<br />
13<br />
76 7<br />
73<br />
87<br />
47 95<br />
#<br />
# #<br />
#<br />
#<br />
## ## #<br />
#<br />
# #<br />
#<br />
#<br />
#<br />
#<br />
#<br />
#<br />
#<br />
#<br />
#<br />
#<br />
48<br />
63<br />
51<br />
70<br />
58<br />
MAP 23
<strong>Table</strong> # 14 Historic Districts<br />
1. Andrews University Campus<br />
2. Anthony House<br />
3. Avery Road-Galien River Bridge<br />
4. Ball House<br />
5. Benton Harbor Historic Houses<br />
6. Benton Harbor Ship Canal<br />
7. Bertrand Informational Designation<br />
8. Bethany Beach<br />
9. Blossomland Bridge<br />
10. Brick School<br />
11. Buckhorn Tavern<br />
12. Burnett Trading Post<br />
13. Carey Mission Informational Designation<br />
14. Carnegie Library<br />
15. Carter Centennial Farm Home<br />
16. Chapin Hall<br />
17. Chapin House<br />
18. Children <strong>of</strong> Israel Synagogue<br />
19. Congregational Church <strong>of</strong> St. Joseph<br />
20. Cotten House<br />
21. Dewey Cannon<br />
22. Dodge Commemorative Designation<br />
23. Dunbar House<br />
24. Drew House<br />
25. Edgewater Club Annex<br />
26. Edwards Farmstead<br />
27. Farmers & Merchants Bank<br />
28. Father Claude Allouez Memorial<br />
29. Ferry Street Elementary School<br />
30. Fidelity Building<br />
31. First Baptist Church<br />
32. Fort Miami Informational Site<br />
33. Fort St. Joseph Site<br />
34. Four Flags Hotel<br />
35. Franklin African Methodist Episcopal Church<br />
36. Freethinker’s Monument<br />
37. French Paper Mill<br />
38. Fruit Belt Commemorative Designation<br />
39. Galien Township Hall<br />
40. Gardner School<br />
41. Herring’s First Flight Informational Designation<br />
42. Hinchman School<br />
43. Hogue House<br />
44. House <strong>of</strong> David Hotel<br />
45. Jakway Cabin<br />
46. Johnson House (Alfred)<br />
47. Johnson House (John)<br />
48. Lake View Farm<br />
49. Lakeside Inn<br />
62<br />
50. Lardner House<br />
51. McOmber-Beeson House<br />
52. Methodist Episcopal Church<br />
53. Michigan Central Railroad Galien Depot<br />
54. Michigan Central Railroad Niles Depot<br />
55. Mielke House<br />
56. Moccasin Bluff Site<br />
57. Morley’s Mill<br />
58. Morris Chapel<br />
59. Morrison Channel<br />
60. Morton Cemetery<br />
61. Morton House<br />
62. Ninth District Lighthouse Depot<br />
63. North Watervliet Road-Paw Paw Lake Outlet Bridge<br />
64. Old <strong>Berrien</strong> <strong>County</strong> Courthouse<br />
65. Old <strong>Berrien</strong> <strong>County</strong> Courthouse Complex<br />
66. Old St. Joseph Historic District<br />
67. Old St. Joseph Public Library Building<br />
68. Old United States Post Office<br />
69. Paine Bank<br />
70. Parc Aux Vaches Informational Designation<br />
71. Pears Mill<br />
72. Pere Marquette Railroad Depot<br />
73. Portage Prairie Evangelical Church<br />
74. Reddick Building<br />
75. Ross-Sanders House<br />
76. Rough House<br />
77. Royal School<br />
78. Sandburg House<br />
79. Second Baptist Church Commemorative Designation<br />
80. Shiloh House<br />
84. Smith House and Drugstore<br />
82. Snow Flake Motel<br />
83. Spring Creek School<br />
84. St. John the Evangelist Catholic Church<br />
85. St. John German Lutheran Evangelical Church<br />
86. St. Joseph Catholic Church<br />
87. St. Joseph Mission & Cemetery<br />
88. St. Mary’s Catholic Church<br />
89. St. Peter’s Evangelical Church<br />
90. Tabor Farm Resort<br />
91. Three Oaks Township Hall<br />
92. Tourist Lodge Informational Designation<br />
93. Trinity Episcopal Church<br />
94. Tyron School<br />
95. Union Church and Cemetery<br />
96. Union Meat Market<br />
97. Warren Featherbone Company Office Building<br />
98. Whitcomb Hotel
Picture 5: Michigan Central Railroad Niles Depot<br />
Picture 6: Old <strong>Berrien</strong> <strong>County</strong> Courthouse in <strong>Berrien</strong> Springs
CHAPTER 4 – TRANSPORTATION<br />
Various passenger transportation services are detailed below and can be seen<br />
on Map 24.<br />
Regional Transportation<br />
Bus Systems<br />
• Benton Harbor Bus Center<br />
The Benton Harbor Bus Center serves as a terminal for Greyhound Bus Lines<br />
& Indian Trails Motor Coach<br />
Address: 2412 M-139<br />
Benton Harbor, MI 49022<br />
Telephone: 269-925-1121<br />
Train – Commuter Service<br />
• Amtrak’s Pere Marquette line provides commuter service, with stops at rail<br />
stations in the cities <strong>of</strong> St. Joseph, Niles and New Buffalo.<br />
For information on reservations call 800-872-7245.<br />
Station Locations:<br />
New Buffalo Station<br />
Located at the intersection <strong>of</strong> Whittaker Road and the railroad tracks.<br />
New Buffalo, MI 49117<br />
Niles Station<br />
Located at 598 Dey Road<br />
Niles, MI 49120<br />
St. Joseph Station<br />
Located at 410 _ Vine Street<br />
St. Joseph, MI 49085<br />
Airports – Regional General Aviation<br />
• Southwest Michigan Regional Airport<br />
Address: 1123 Territorial Road<br />
Benton Harbor, MI 49022<br />
Telephone: 269-927-3194
W<br />
Railroad Tracks<br />
Municipal Boundaries<br />
Bus System Service Areas<br />
Other Transportation Features<br />
e<br />
e<br />
e<br />
e<br />
í<br />
<strong>Berrien</strong> Bus<br />
Buchanan Dial-A-Ride<br />
Niles Dial-A-Ride<br />
TCATA<br />
Southwest MI Regional Airport<br />
Watervliet Airpark<br />
Andrews University Airpark<br />
Jerry Tyler Memorial Airport<br />
St. Joseph River Harbor<br />
Benton Harbor Bus Center<br />
Niles Amtrak Train Station<br />
St. Joseph Amtrak Train Station<br />
New Buffalo Amtrak Train Station<br />
N<br />
S<br />
E<br />
Scale: 1" = 4.5 miles<br />
Source: <strong>Berrien</strong> <strong>County</strong> GIS, 2002.<br />
Transportation Systems<br />
í<br />
e<br />
e<br />
e<br />
e<br />
MAP 24
Airports – General Aviation<br />
• Andrews University Airpark<br />
Address: Griggs Road<br />
<strong>Berrien</strong> Springs, MI 49103<br />
Telephone: 269-471-1455<br />
• Jerry Tyler Memorial Airport<br />
Address: 2018 Lake Street<br />
Niles, MI 49120<br />
Telephone: 269-684-7030<br />
• Watervliet Airpark<br />
Address: Airport Drive<br />
Watervliet, MI 49098<br />
Telephone: 269-463-5113<br />
St. Joseph River Harbor<br />
The St. Joseph/Benton Harbor commercial port accommodates deep draft<br />
freighters, as well as river barge shipping via the Mississippi River. According to<br />
Acting Harbormaster Robert Grimm, commercial docks on the Harbor received<br />
more than one million tons <strong>of</strong> materials in 2001. This is the highest amount<br />
since the 1960s.<br />
The St. Joseph River Harbor Authority was established for the administration,<br />
development and promotion <strong>of</strong> commercial and recreational usage <strong>of</strong> the St.<br />
Joseph River Harbor and environs.<br />
Contact Information:<br />
St. Joseph River Harbor Authority<br />
<strong>Berrien</strong> <strong>County</strong> Administration Center<br />
701 Main Street<br />
St. Joseph, MI 49085<br />
Telephone: 269-983-7111 x8617<br />
Web site: www.berriencounty.org<br />
Currently, the commercial status <strong>of</strong> the port enables the Army Corps <strong>of</strong><br />
Engineers to justify dredging the channel every few years.<br />
In 2001, the St. Joseph River Harbor Authority contracted Mariport Group Ltd. to<br />
do a study <strong>of</strong> the St. Joseph River Harbor. The following were among the studies<br />
findings:<br />
• The port fulfils an essential shipping function within <strong>Berrien</strong> <strong>County</strong> and SW<br />
Michigan.
• Over 80% <strong>of</strong> the cargo received is delivered within a 50-mile radius <strong>of</strong> the<br />
port.<br />
• If the port ever ceased to be an effective commercial port, it would be difficult<br />
to persuade the Army Corps <strong>of</strong> Engineers to maintain the channel, with<br />
serious implications to the small boat community.<br />
Picture 7: The Paul H. Townsend at dock<br />
One challenge facing the St. Joseph River Harbor Authority is finding an<br />
acceptable site to hold material dredged from the harbor to keep the shipping<br />
channel open. The Harbor Authority has been using property at the Southwest<br />
Michigan Regional Airport on a year-by-year basis. The opportunity now exists<br />
to use the airport for long-term storage. The airport is currently lengthening their<br />
main runway and extending safety zones. The airport needs fill as part <strong>of</strong> the<br />
expansion project. The Airport and the Harbor Authority propose excavating a<br />
hole near the west end <strong>of</strong> the runway to provide fill, leaving the hole as a<br />
potential site for the dredge material. This site could provide enough capacity to<br />
hold more than 30 years <strong>of</strong> dredge material. This proposal is being examined<br />
currently by the Army Corps <strong>of</strong> Engineers as well as other regulatory agencies<br />
like the Michigan Department <strong>of</strong> Environmental Quality.
Public Transportation Systems<br />
<strong>Berrien</strong> <strong>County</strong> Public Transportation (<strong>Berrien</strong> Bus)<br />
<strong>Berrien</strong> bus is a nonurban system that provides transportation to all areas not<br />
served by dial-a-ride service areas. The service includes both semi-fixed route<br />
service and demand-response service.<br />
Hours <strong>of</strong> Operation: M-F 5:00 am – 5:00 pm<br />
Contact:<br />
<strong>Berrien</strong> Bus<br />
PO Box 186<br />
<strong>Berrien</strong> Springs, MI 49103<br />
Tel: 269-471-1100<br />
E-mail: berr_bus@a1access.net<br />
Buchanan Dial-A-Ride<br />
Picture 8: <strong>Berrien</strong> Bus<br />
Buchanan D-A-R is a nonurban city system serving the City <strong>of</strong> Buchanan and<br />
parts <strong>of</strong> Buchanan Township with service to Niles.<br />
Hours <strong>of</strong> Operation: M-F 7:00 am – 5:30 pm<br />
Sat 9:0 am – 3:30 pm<br />
Contact: Buchanan Dial-A-Ride<br />
633 North Second Street<br />
Niles, MI 49120<br />
Tel: 269-683-8282<br />
E-mail: nilesta@a1access.net<br />
Niles Dial-A-Ride<br />
Niles D-A-R is a small city urban system serving the City <strong>of</strong> Niles, and part <strong>of</strong><br />
Niles and Bertrand Townships.<br />
Hours <strong>of</strong> Operation: M-Thurs 6:00 am – 11:00 pm<br />
F 6:00 am – 6:00 pm
Sat 8:00 am – 11:00 pm<br />
Sun 9:30 am – 4:30 pm<br />
Contact: Niles Dial-A-Ride<br />
633 N. Second Street<br />
Niles, MI 49120<br />
Tel: 269-683-8282<br />
E-mail: nilesta@a1access.net<br />
Twin Cities Transportation Authority (TCATA)<br />
TCATA is a small city urban system providing service to the Cities <strong>of</strong> St. Joseph<br />
and Benton Harbor, and part <strong>of</strong> Benton Charter and St. Joseph Charter<br />
Townships.<br />
Hours <strong>of</strong> Operation: M-F 6:00 am – 6:00 pm<br />
Sat 8:00 am – 4:30 pm<br />
Contact: TCATA<br />
275 E. Wall Street<br />
Benton Harbor, MI 49022<br />
Tel: 269-927-2268<br />
E-mail: tcata@a1access.net<br />
Pedestrian/Non-motorized Transportation<br />
Biking or walking can be a healthy, economical, and relaxing form <strong>of</strong><br />
transportation. Providing safe, convenient facilities is required to encourage this<br />
sort <strong>of</strong> transportation. As part <strong>of</strong> their Southwest Non-Motorized Investment <strong>Plan</strong><br />
Study, the Michigan Department <strong>of</strong> Transportation, Southwest Region, developed<br />
an inventory <strong>of</strong> existing and proposed non-motorized facilities (Map 25). The<br />
goal <strong>of</strong> the plan was intended to integrate non-motorized considerations into<br />
Southwest Michigan’s transportation planning and programming activities.<br />
Transportation <strong>Plan</strong>ning<br />
Urban Transportation <strong>Plan</strong>ning<br />
Federal funding is available for transportation planning in urbanized areas. The<br />
funding is distributed locally using a formula based on population, population<br />
density and other transit criteria, and requires local municipalities to provide<br />
matching funds. Transportation planning assistance is also available from the<br />
Michigan Department <strong>of</strong> Transportation in the form <strong>of</strong> staff services including<br />
planning and program management.<br />
Federal Legislation requires a continuing, comprehensive and cooperative (3-C)<br />
process for transportation planning in all urban areas in order to obtain any
federal funding. Each urban area has a transportation planning committee, made<br />
up <strong>of</strong> interested parties, that are responsible for producing the following
MDOT Non-motorized Routes<br />
W<br />
N<br />
S<br />
Proposed Facilities<br />
Existing Facilities<br />
E<br />
Scale: 1" = 4.5 miles<br />
Municipal Boundaries<br />
Non-Motorized Transportation<br />
Source: Southwest Michigan Non-Motorized Investment Study, MDOT,2001<br />
MAP 25
documents: a work program, which includes the planning work to be<br />
accomplished in that year; a three-year Transportation Improvement Program<br />
(TIP), which lists all transportation improvement projects in the three-year period;<br />
and a transportation plan which covers a twenty-five year period and is revised<br />
every five years.<br />
There are two transportation committees operating in<strong>Berrien</strong> <strong>County</strong>. The two<br />
committees are the Twin Cities Area Transportation Study (TwinCATS) and the<br />
Niles-Buchanan-Cass Area Transportation Study (NATS).<br />
Twin Cities Area Transportation Study (TwinCATS)<br />
TwinCATS is responsible for transportation planning in the cities <strong>of</strong> Benton<br />
Harbor and St. Joseph, the Villages <strong>of</strong> Shoreham and Stevensville, and the<br />
townships <strong>of</strong> Benton (Charter), Lincoln (Charter), Royalton, St. Joseph (Charter),<br />
and Sodus.<br />
The current TwinCATS 2000-2025 Long Range <strong>Plan</strong> was written by the<br />
Southwestern Michigan Commission in 2000.<br />
Contact:<br />
Southwestern Michigan Commission<br />
185 E. Main Street, Suite 701<br />
Benton Harbor, MI 49022<br />
Telephone: 269-925-1137<br />
E-mail: swmicomm@swmicomm.org<br />
The following goals are listed in the <strong>Plan</strong>:<br />
- Support economic vitality <strong>of</strong> the metropolitan area<br />
- Enhance efficiency for all transportation system users<br />
- Promote accessibility and multimodal integration <strong>of</strong> the system<br />
- Efficiently manage and preserve existing system<br />
- Promote livable communities and environmental enhancement<br />
The plan also looks at the area’s developments that are likely to have a major<br />
impact. These developments include the expansion <strong>of</strong> the Lakeland Medical<br />
Center and associated development in Royalton Township; the continued<br />
construction <strong>of</strong> the Edgewater project in the cities <strong>of</strong> Benton Harbor and St.<br />
Joseph; and the completion <strong>of</strong> U.S. 31 using Napier Avenue as a temporary<br />
connection.
Niles-Buchanan-Cass Transportation Study (NATS)<br />
NATS is responsible for transportation planning in the cities <strong>of</strong> Niles and<br />
Buchanan, and the townships <strong>of</strong> Bertrand and Niles in <strong>Berrien</strong> <strong>County</strong>, and the<br />
townships <strong>of</strong> Howard and Milton in Cass <strong>County</strong>.<br />
The current NATS 2000-2025 Long Range <strong>Plan</strong> was written by the Southwestern<br />
Michigan Commission in 2000.<br />
The following goals are listed in the <strong>Plan</strong>:<br />
- To provide access and efficient movement <strong>of</strong> goods and people<br />
- To make the transportation system as safe as possible<br />
- To preserve the existing transportation system<br />
- Encourage a transportation system that enhances the area’s economic vitality<br />
- To promote land use planning, which supports the transportation system and<br />
natural resources<br />
Rural Transportation <strong>Plan</strong>ning<br />
<strong>Berrien</strong> <strong>County</strong> Rural Taskforce<br />
The Intermodal Surface Transportation Efficiency Act (ISTEA), was signed into<br />
law December 1991. The intent was to create a sound financial base while<br />
maintaining and expanding the Nation’s transportation system.<br />
In rural counties, this requires a more involved process in order to procure<br />
federal transportation funding. All federally funded transportation decisions must<br />
include transit operators and representatives <strong>of</strong> cities with populations under<br />
5,000.<br />
This rural task force has the following responsibilities:<br />
- Review projects and priorities selected by individual counties<br />
- Review available funding capabilities<br />
- Ensure opportunities for public comment have been provided, including<br />
concerns <strong>of</strong> Indian tribal governments where appropriate<br />
- Selects projects and assigns priorities<br />
- Constrain each year’s list <strong>of</strong> projects to available funding levels.<br />
The Michigan Department <strong>of</strong> Transportation is responsible for final project<br />
selection for federal funds and administration <strong>of</strong> the federal-aid transportation<br />
program.
For more information contact:<br />
Michigan Department <strong>of</strong> Transportation<br />
Bureau <strong>of</strong> Transportation <strong>Plan</strong>ning<br />
Sub-State <strong>Plan</strong>ning Section<br />
Telephone: 517-373-1881
CHAPTER 5 – TRENDS, PATTERNS AND PROBLEMS<br />
Future Land Use Projections<br />
Over the past 20 years, the changes in land use have been influenced primarily<br />
by economic development and population changes. To understand and predict<br />
what the future <strong>of</strong> <strong>Berrien</strong> <strong>County</strong> will look like in 2020 is by no means an easy<br />
task. There are several factors to consider. To predict the future land use<br />
patterns and trends, it is necessary to analyze the past and present.<br />
Twenty years ago, the county consisted <strong>of</strong> residential and commercial uses<br />
complimenting each other in the urban centers. Industrial uses were developed<br />
near and concentrated to the urban centers or just outside the edge <strong>of</strong> the urban<br />
boundary. As it is now, parks and recreation was scattered throughout the<br />
county, with the natural beauty <strong>of</strong> Lake Michigan enhancing the quality <strong>of</strong> life in<br />
the area. Farmland dominated the rural landscape, but the trend <strong>of</strong> development<br />
encroaching on primer farmland was beginning.<br />
Today, Residential development appears to be moving away from the core urban<br />
centers and extending farther out. This “sprawling” effect is prevalent throughout<br />
the nation and is among many <strong>of</strong> the hot issues facing community planners,<br />
environmentalist, economists and citizens.<br />
It is evident that population growth in the county is stagnant. Over the last 10<br />
years, the county has grown .7%. As two <strong>of</strong> the three population projections<br />
indicate, the county will have a slight decrease in population, but the growth and<br />
development rate may continue to increase. The trend <strong>of</strong> smaller household<br />
sizes, increased new development, and the boom in subdivisions and<br />
condominiums is on the rise. The economy and market will also be a significant<br />
factor in determining the future land uses for 2020.<br />
Preservation is the “buzzword” <strong>of</strong> the 21 st Century. Farmland, open space, and<br />
historic preservation are all on the rise with legislation providing the tools to<br />
regulate, manage and control growth. That is in effect what a future land use<br />
map is, creating desired goals and strategies based on what the community<br />
values.<br />
Map 26 is a compilation <strong>of</strong> the future land use identified by local municipalities in<br />
their development plans. The goal <strong>of</strong> each township, city and village’s future land<br />
use map is to guide growth, based on an inventory <strong>of</strong> existing land uses, current<br />
development trends, and community input.<br />
Due to the autonomy <strong>of</strong> local municipalities to create their own development<br />
plans, each uses their own definitions <strong>of</strong> residential land use which can include a<br />
wide range <strong>of</strong> densities. In general, residential land use will continue to locate<br />
along major road corridors and in urban centers. One issue to be concerned with
Future Land Use<br />
W<br />
AgriculturalVacant<br />
Commercial<br />
Industrial<br />
Mobile-Home<br />
Public/Semi-Public<br />
<strong>Plan</strong>ned Unit <strong>Development</strong><br />
Recreational<br />
Residential<br />
Residential, High Density<br />
Residential, Low Density<br />
Residential-Agricultural<br />
Rural Residential<br />
<strong>Development</strong> <strong>Plan</strong> Unavailable<br />
Municipal Boundaries<br />
Roads<br />
N<br />
S<br />
US 12<br />
E<br />
Scale: 1" = 4.5 miles<br />
M - 239<br />
Composite Future Land Use Map<br />
RED ARROW HWY<br />
I-94<br />
WARREN WOODS RD<br />
US12 PULASKI HWY<br />
Source: Local <strong>Development</strong> <strong>Plan</strong>s, various years.<br />
I-94<br />
SHAWNEE RD<br />
LAKESHORE DR<br />
NILES AVE<br />
CLEVELAND AVE<br />
PIPESTONE<br />
M-63<br />
M-139<br />
US 31<br />
SHAWNEE RD<br />
M-63<br />
BR 94<br />
I-94<br />
M-63<br />
PIPESTONE RD<br />
I-96<br />
COLOMA RD<br />
OLD US 31<br />
RED BUD TR<br />
REDBUD TRAIL<br />
RED ARROW HWY<br />
US 31<br />
WALTON RD<br />
I-94<br />
TERRITORIAL RD<br />
US 31<br />
NAPIER AVE<br />
BR 12<br />
M-140<br />
M-140<br />
WATERVLIET RD<br />
US 12<br />
US 33<br />
M-140<br />
PAINTER SCHOOL RD<br />
M-62<br />
M-51<br />
BR 60<br />
BR 12<br />
MAP 26
are areas where industrial uses are adjacent to residential uses, without the use<br />
<strong>of</strong> transition zones. This can <strong>of</strong>ten be seen between municipalities and within a<br />
single municipality. These type <strong>of</strong> issues are one <strong>of</strong> many addressed under the<br />
new Township, City and Village planning and zoning laws (PA 263, 264, 265 <strong>of</strong><br />
2001), which require that neighboring municipalities review new/updated<br />
development plans to see if there are areas <strong>of</strong> conflict that should be addressed.<br />
Commercial uses concentrate in major road corridors and within urban<br />
boundaries. In a dynamic environment, a variety <strong>of</strong> commercial uses will<br />
continue to increase along major roads and compliment the character <strong>of</strong> the<br />
neighborhoods.<br />
Industrial districts are scattered throughout the county. Municipalities should<br />
require industrial uses to locate on vacant lands already planned for industrial<br />
use, rather than creating new industrial areas. The community benefits when<br />
industrial businesses are required to use already available sites that comply with<br />
the municipality’s adopted plan, which should locate industrial uses where they<br />
have the least impact on neighboring uses.<br />
Open Space and Recreational Uses range from small corner lots, to state parks.<br />
There are several beautiful parks and recreational areas throughout the county.<br />
The Galien River <strong>County</strong> Park, and several community skateboard parks have<br />
been acquired in response to the needs and requests <strong>of</strong> the community. Over<br />
the next 20 years, the recreational and open spaces will remain a symbol <strong>of</strong><br />
<strong>Berrien</strong> <strong>County</strong>.<br />
The future <strong>of</strong> agricultural land was addressed in Chapter 1. It is an important<br />
resource that helps to make up the character <strong>of</strong> <strong>Berrien</strong> <strong>County</strong>. The pressure to<br />
guide growth, while not negatively impacting farmland, is placed on each<br />
municipality and the <strong>County</strong>.
CHAPTER 6 – GOALS, POLICIES AND STRATEGIES<br />
Goals and Objectives<br />
The Master <strong>Plan</strong> establishes planning goals that, if strived for, will help shape<br />
and direct the future <strong>of</strong> <strong>Berrien</strong> <strong>County</strong>.<br />
The goals and objectives <strong>of</strong>fered in this Master <strong>Plan</strong> are the combined result <strong>of</strong><br />
input from citizens and government <strong>of</strong>ficials – elected and appointed throughout<br />
<strong>Berrien</strong> <strong>County</strong>. The historical information, statistics, and current trends<br />
presented in the Master <strong>Plan</strong> are the result <strong>of</strong> observation, research, and<br />
analysis performed by the <strong>Berrien</strong> <strong>County</strong> <strong>Plan</strong>ning Commission with assistance<br />
<strong>of</strong> staff. The <strong>Berrien</strong> <strong>County</strong> <strong>Plan</strong>ning Commission is responsible for overall<br />
compilation and content <strong>of</strong> the <strong>County</strong> Master <strong>Plan</strong>.<br />
The plan will require frequent adjustment in order to steer the county down the<br />
desired path. The <strong>Plan</strong>ning Commission is establishing a process and criteria to<br />
periodically review and update the plan based on ever-changing conditions and<br />
trends. As with the development <strong>of</strong> this plan, the review and revision process will<br />
require public input.<br />
Based on the observation, research, and analysis the principal themes have<br />
evolved into a series <strong>of</strong> goals that relate four primary issues:<br />
• Land Use and Change Management<br />
• Environment<br />
• Economy<br />
• Transportation<br />
Land Use<br />
In <strong>Berrien</strong> <strong>County</strong>, we enjoy a wide-range <strong>of</strong> land types and uses, from<br />
agricultural to urban development to beautiful coastlines. The resources within<br />
the <strong>County</strong> <strong>of</strong>fer varied cultural, recreational, and economic opportunities to a<br />
diverse population.<br />
The land use goals desired by the <strong>Plan</strong>ning Commission are:<br />
1. Protect farmland<br />
2. Provide a variety <strong>of</strong> housing types to suit various lifestyles<br />
3. Develop nonresidential land in appropriate locations to serve visitors and<br />
tourists, create jobs and increase economic vitality<br />
4. Manage land development to minimize impact on natural existing drains.<br />
5. Coordinate land use change throughout the county<br />
6. Improve quality <strong>of</strong> life
Environment<br />
Government <strong>of</strong>ficials at the local, county, state and federal levels are responsible<br />
for the environment within their jurisdictional boundaries. They should also be<br />
concerned about the environment within neighboring jurisdictional areas.<br />
The environment goals desired by the <strong>Plan</strong>ning Commission are:<br />
1. Sustain the health, diversity, and extent <strong>of</strong> natural resources<br />
2. Increase environmental awareness and comply with environmental<br />
regulations<br />
3. Protect surface and groundwater from a watershed perspective, rather than<br />
just within jurisdictional boundaries<br />
4. Protect and preserve the environment from a regional perspective, rather than<br />
within jurisdictional boundaries.<br />
5. Provide public services either at the same time as development occurs or in<br />
orderly, phased manner consistent with government plans<br />
6. Protect citizens and resources from hazardous materials<br />
Economy<br />
The factors that affect our economy go far beyond dollars spent or saved. These<br />
factors include:<br />
• Personal income and the number <strong>of</strong> people living in poverty, both <strong>of</strong><br />
which are also on the rise in the <strong>County</strong><br />
• Education<br />
• Labor force and labor force mobility<br />
• Employers and industry<br />
• Employment, unemployment and land needed for employment<br />
Trends and projections indicate there is a need within <strong>Berrien</strong> <strong>County</strong> to manage<br />
these factors in order to strengthen our economy, protect our land resources, and<br />
improve our quality <strong>of</strong> life.<br />
The economic goals desired by the <strong>Plan</strong>ning Commission are:<br />
1. Provide leadership to develop countywide economic goals and, thus, provide<br />
sustained and stable economic growth<br />
2. Use existing and emerging technologies to develop a sustainable diversified<br />
economy countywide<br />
3. Assist schools, businesses, and state agencies to provide education, training,<br />
and diverse technical and skilled jobs<br />
4. Encourage educators and employer to cooperate for long-term labor force<br />
stability in future. (Career Preparation System)<br />
5. Preserve agriculture as an economic component<br />
6. Preserve historical and cultural centers as economic components<br />
7. Encourage and assist people and agencies to provide housing opportunities<br />
for all income groups.
Transportation<br />
Transportation planning requires a comprehensive study <strong>of</strong> existing and<br />
anticipated traffic volumes, safety, roadway improvements, and non-motorized<br />
means <strong>of</strong> transportation. Transportation planning must also consider how, when<br />
and where people travel and potential impacts on community character, the<br />
environment, air quality, noise pollution, taxation and fiscal expenditures.<br />
Responsibility for legislating and implementing goals and strategies lies primarily<br />
with government <strong>of</strong>ficials within the county, cities, and villages. However,<br />
township <strong>of</strong>ficials and citizens also have a significant impact on road<br />
development and placement.<br />
The transportation goals desired by <strong>Berrien</strong> <strong>County</strong> residents are:<br />
1. Continually evaluate and adjust road standards<br />
2. Revise thoroughfare plans to coincide with anticipated growth<br />
3. Develop and implement access management standards<br />
4. Develop detailed small area plans for key roadways and growth corridors<br />
5. Reserve sufficient right-<strong>of</strong>-way for future roads and related improvements<br />
6. Limit private roads<br />
7. Expand existing public transportation systems to link residential areas with<br />
employment centers and services<br />
8. Coordinate with all transportation systems to create a reliable transportation<br />
system<br />
9. Coordinate development and highway improvements to minimize traffic<br />
congestion hazards<br />
Strategies for Smart Growth<br />
Smart growth means development patterns that promote healthy communities,<br />
make efficient use <strong>of</strong> land, and accommodate and effectively serve future<br />
population growth through all <strong>of</strong> the following strategies:<br />
(a) Promoting mixed land uses<br />
(b) Utilizing compact building designs.<br />
(c) Creating a range <strong>of</strong> housing opportunities and choices<br />
(d) Creating pedestrian-friendly neighborhoods<br />
(e) Fostering distinctive, attractive communities with a strong sense <strong>of</strong> place<br />
(f) Preserving open space, farmland, natural beauty, and critical environmental<br />
areas<br />
(g) Directing development towards and strengthening existing communities<br />
(h) Providing a variety <strong>of</strong> transportation choices<br />
(i) Making development decisions predictable, fair, and cost-effective<br />
(j) Encouraging communities and interested parties to cooperate in determining<br />
development designs
In the Michigan House Committee on Land Use and Environment, a proposed<br />
resolution (HB 6135) would create an <strong>of</strong>fice <strong>of</strong> smart growth. The <strong>of</strong>fice <strong>of</strong> Smart<br />
Growth would be established in the <strong>of</strong>fice <strong>of</strong> Consumer and Industry services.<br />
The responsibilities <strong>of</strong> this <strong>of</strong>fice would include:<br />
(a) Act as a clearinghouse for model zoning ordinances and other zoning policy<br />
initiatives that promote smart growth.<br />
(b) Offer technical assistance about smart growth to local <strong>of</strong>ficials and bodies,<br />
planners, and other interested persons.<br />
Assist state departments or agencies to coordinate state programs that affect<br />
land use and to administer such programs in a manner that promotes smart<br />
growth.<br />
APPENDIX A - BIBLIOGRAPHY<br />
Atlas <strong>of</strong> Critical Dune Areas, Michigan Department <strong>of</strong> Environmental Quality,<br />
1989. 1989)
Bainbridge Township General <strong>Development</strong> <strong>Plan</strong>, Bainbridge Township <strong>Plan</strong>ning<br />
Commission, 1995.<br />
Baroda Township General <strong>Development</strong> <strong>Plan</strong>, Steiding & Associates, 1993.<br />
Benton Charter Township Ten Year Comprehensive Land Use <strong>Plan</strong>, Steiding &<br />
Associates, 2001.<br />
<strong>Berrien</strong> <strong>County</strong> Groundwater Mapping Notebook, Southwestern Michigan<br />
Commission, 1981.<br />
<strong>Berrien</strong> <strong>County</strong> Land Use/Cover Study, Southwestern Michigan Commission,<br />
1982.<br />
<strong>Berrien</strong> <strong>County</strong>, Michigan, Natural Features Study, Driker Associates Inc., 1968.<br />
<strong>Berrien</strong> <strong>County</strong>, Michigan, <strong>Development</strong> <strong>Plan</strong>, <strong>Berrien</strong> <strong>County</strong> <strong>Plan</strong>ning<br />
Commission,<br />
October, 1974.<br />
<strong>Berrien</strong> <strong>County</strong> Parks and Recreation Master <strong>Plan</strong>, <strong>Berrien</strong> <strong>County</strong> Parks and<br />
Recreation Commission, 1996.<br />
<strong>Berrien</strong> <strong>County</strong> Solid Waste Management <strong>Plan</strong>, 2nd Update, <strong>Berrien</strong> <strong>County</strong><br />
Department <strong>of</strong> <strong>Plan</strong>ning and Public Works, 2001.<br />
<strong>Berrien</strong> Township Sketch <strong>Development</strong> <strong>Plan</strong>, <strong>Berrien</strong> Township <strong>Plan</strong>ning<br />
Commission, 1992.<br />
Bertrand Township General <strong>Development</strong> <strong>Plan</strong>, Public Consulting Team, 1994.<br />
Buchanan Township Sketch <strong>Development</strong> <strong>Plan</strong>, Buchanan Township <strong>Plan</strong>ning<br />
Commission, 1976.<br />
Census <strong>of</strong> Population and Housing 1990, Summary Tape File 1, U.S. Census<br />
Bureau, 1990.<br />
Census <strong>of</strong> Population and Housing 1990, Summary Tape File 3, U.S. Census<br />
Bureau, 1990.<br />
Census <strong>of</strong> Population and Housing 2000, Summary File 1, U.S. Census Bureau,<br />
2000.<br />
Census <strong>of</strong> Population and Housing 2000, Summary File 3, U.S. Census Bureau,<br />
2000.
Chikaming Township Master Land Use <strong>Plan</strong>, 1992-2012, Chikaming Township<br />
<strong>Plan</strong>ning Commission, 1992.<br />
Coloma Charter Township Sketch <strong>Development</strong> <strong>Plan</strong>, Coloma Charter Township<br />
<strong>Plan</strong>ning Commission, 1975.<br />
Hagar Township Sketch <strong>Development</strong> <strong>Plan</strong>, Hagar Township <strong>Plan</strong>ning<br />
Commission, 1976.\<br />
Historical Sketches <strong>of</strong> <strong>Berrien</strong> <strong>County</strong>, Vol. 1, Robert C. Myers, 1839 Courthouse<br />
Museum,<br />
1994.<br />
Historical Sketches <strong>of</strong> <strong>Berrien</strong> <strong>County</strong>, Vol. 3, Robert C. Myers, 1839 Courthouse<br />
Museum,<br />
1994.<br />
Important Farmlands, <strong>Berrien</strong> <strong>County</strong>, Michigan, Soil Conservation Service,<br />
United States Department <strong>of</strong> Agriculture, <strong>of</strong> <strong>Berrien</strong> <strong>County</strong> , Michigan, 1983.<br />
Lake Charter Township Master <strong>Plan</strong>, Lake Charter Township <strong>Plan</strong>ning<br />
Commission, 2001.<br />
Lincoln Charter Township Revised <strong>Development</strong> <strong>Plan</strong>, Thomas Sinn &<br />
Associates, 1991.<br />
National Wetland Inventory Map, U.S. Department <strong>of</strong> Fish and Wildlife, 1994.<br />
New Buffalo Township Master <strong>Plan</strong>, Langworthy LeBlanc, Inc., 1998.<br />
Niles-Buchanan Area <strong>Plan</strong> Study, Southwestern Michigan Commission, 1997.<br />
Oronoko Charter Township Comprehensive <strong>Plan</strong> Update, Steiding & Associates,<br />
1999.<br />
Pipestone Township General <strong>Development</strong> <strong>Plan</strong>, Pipestone Township <strong>Plan</strong>ning<br />
Commission, 1986.<br />
Q3 Flood Insurance Rate Maps, Federal Emergency Management Agency, 1996.<br />
Quaternary Geology Features Map, Michigan Department <strong>of</strong> Natural Resources,<br />
1982.<br />
Royalton Township Revised Land Use <strong>Plan</strong>, Royalton Township <strong>Plan</strong>ning<br />
Commission, 1997.
St. Joseph Charter Township Revised Comprehensive <strong>Plan</strong>, Thomas Sinn &<br />
Associates, 1993.<br />
Soil Survey <strong>of</strong> <strong>Berrien</strong> <strong>County</strong>, Michigan, United States Department <strong>of</strong><br />
Agriculture, Soil Conservation Service, 1979.<br />
Source: Southwest Michigan Non-Motorized Investment Study, Michigan<br />
Department <strong>of</strong> Transportation,2001.<br />
St. Joseph River Harbor Study, Mariport Group Ltd., 2000.<br />
Village <strong>of</strong> Three Oaks Master <strong>Plan</strong>, Three Oaks Village Council / Wightman &<br />
Associates, 2002.<br />
Water Quality and Pollution Control in Michigan 1998 305(b) Report, MDEQ<br />
Surface Water Quality Division, Great Lakes and Environmental Assessment<br />
Section, John Wuycheck, 1998.<br />
Watervliet Township Sketch <strong>Development</strong> <strong>Plan</strong>, Langworthy LeBlanc, Inc., 1999.<br />
Weesaw Township Future Land Use <strong>Plan</strong>, Langworthy LeBlanc, Inc., 1999.