Optimization of product design through quality function deployment
Optimization of product design through quality function deployment
Optimization of product design through quality function deployment

You also want an ePaper? Increase the reach of your titles
YUMPU automatically turns print PDFs into web optimized ePapers that Google loves.
14 METU JFA 2011/1<br />
Table 12. Percentages <strong>of</strong> customer<br />
requirements.<br />
Table 13. Percentages <strong>of</strong> the combination<br />
<strong>of</strong> technical attributes and customer<br />
requirements.<br />
ÖNDER ERKARSLAN ve HANDE YILMAZ<br />
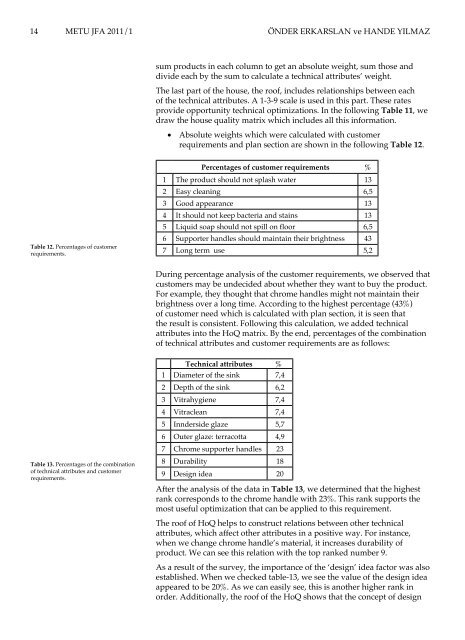
sum <strong>product</strong>s in each column to get an absolute weight, sum those and<br />
divide each by the sum to calculate a technical attributes’ weight.<br />
The last part <strong>of</strong> the house, the ro<strong>of</strong>, includes relationships between each<br />
<strong>of</strong> the technical attributes. A 1-3-9 scale is used in this part. These rates<br />
provide opportunity technical optimizations. In the following Table 11, we<br />
draw the house <strong>quality</strong> matrix which includes all this information.<br />
•<br />
Absolute weights which were calculated with customer<br />
requirements and plan section are shown in the following Table 12.<br />
Percentages <strong>of</strong> customer requirements %<br />
1 The <strong>product</strong> should not splash water 13<br />
2 Easy cleaning 6,5<br />
3 Good appearance 13<br />
4 It should not keep bacteria and stains 13<br />
5 Liquid soap should not spill on floor 6,5<br />
6 Supporter handles should maintain their brightness 43<br />
7 Long term use 5,2<br />
During percentage analysis <strong>of</strong> the customer requirements, we observed that<br />
customers may be undecided about whether they want to buy the <strong>product</strong>.<br />
For example, they thought that chrome handles might not maintain their<br />
brightness over a long time. According to the highest percentage (43%)<br />
<strong>of</strong> customer need which is calculated with plan section, it is seen that<br />
the result is consistent. Following this calculation, we added technical<br />
attributes into the HoQ matrix. By the end, percentages <strong>of</strong> the combination<br />
<strong>of</strong> technical attributes and customer requirements are as follows:<br />
Technical attributes %<br />
1 Diameter <strong>of</strong> the sink 7,4<br />
2 Depth <strong>of</strong> the sink 6,2<br />
3 Vitrahygiene 7,4<br />
4 Vitraclean 7,4<br />
5 Innderside glaze 5,7<br />
6 Outer glaze: terracotta 4,9<br />
7 Chrome supporter handles 23<br />
8 Durability 18<br />
9 Design idea 20<br />
After the analysis <strong>of</strong> the data in Table 13, we determined that the highest<br />
rank corresponds to the chrome handle with 23%. This rank supports the<br />
most useful optimization that can be applied to this requirement.<br />
The ro<strong>of</strong> <strong>of</strong> HoQ helps to construct relations between other technical<br />
attributes, which affect other attributes in a positive way. For instance,<br />
when we change chrome handle’s material, it increases durability <strong>of</strong><br />
<strong>product</strong>. We can see this relation with the top ranked number 9.<br />
As a result <strong>of</strong> the survey, the importance <strong>of</strong> the ‘<strong>design</strong>’ idea factor was also<br />
established. When we checked table-13, we see the value <strong>of</strong> the <strong>design</strong> idea<br />
appeared to be 20%. As we can easily see, this is another higher rank in<br />
order. Additionally, the ro<strong>of</strong> <strong>of</strong> the HoQ shows that the concept <strong>of</strong> <strong>design</strong>