Energy Scenario for Sweden 2050
Energy Scenario for Sweden 2050
Energy Scenario for Sweden 2050

Create successful ePaper yourself
Turn your PDF publications into a flip-book with our unique Google optimized e-Paper software.
the ivl scenario:<br />
<strong>Energy</strong> <strong>Scenario</strong><br />
<strong>for</strong> <strong>Sweden</strong> <strong>2050</strong><br />
Based on Renewable <strong>Energy</strong> Technologies and Sources<br />
Gustavsson, Mathias<br />
Särnholm, Erik<br />
Stigson, Peter<br />
Zetterberg, Lars
is no URL<br />
L - Regular<br />
Organization<br />
IVL Swedish Environmental<br />
Research Institute Ltd.<br />
Address<br />
P.O. Box 5302<br />
SE-400 14 Göteborg<br />
Telephone<br />
+46 (0)31-725 62 00<br />
Date<br />
September<br />
Authors<br />
Gustavsson, Mathias;<br />
Särnholm, Erik;<br />
Stigson, Peter;<br />
Zetterberg, Lars<br />
Corresponding author<br />
mathias.gustavsson@ivl.se<br />
Keyword<br />
<strong>Energy</strong> scenario, <strong>2050</strong>,<br />
renewable energy, <strong>Sweden</strong><br />
ENERGY SCENARIO <strong>2050</strong> 2<br />
Bibliographic data<br />
Gustavsson, M., E. Särnholm, P.<br />
Stigsson and L. Zetterberg (2011).<br />
“<strong>Energy</strong> <strong>Scenario</strong> <strong>for</strong> <strong>Sweden</strong> <strong>2050</strong><br />
Based on Renewable <strong>Energy</strong> Technologies<br />
and Sources”, IVL Swedish<br />
Environment Institute and WWF<br />
<strong>Sweden</strong>, Göteborg and Stockholm.<br />
September.<br />
Disclaimer<br />
The opinions expressed in this document are the sole responsibility of the authors and do not<br />
necessarily represent the position of the IVL Swedish Research Institute or WWF <strong>Sweden</strong>.<br />
Reproduction and translation <strong>for</strong> non-commercial purposes are authorized, provided the source<br />
is acknowledged and the publisher is given prior notice and sent a copy.<br />
Why we are here<br />
Project sponsor To stop the degradation of the planet’s natural environment and<br />
to build a future in which humans live in harmony and nature.<br />
This project was co-funded by WWF <strong>Sweden</strong> and the Foundation <strong>for</strong> IVL Swedish Environmental Research<br />
Institute (SIVL) via grants from the Swedish Environmental Protection Agency and the Swedish Research Council<br />
<strong>for</strong> Environment, Agricultural Sciences and Spatial Planning (Formas).<br />
Why we are here<br />
To stop the degradation of the planet’s natural environment and<br />
to build a future in which humans live in harmony with nature.<br />
www.climatesolver.org
<strong>Energy</strong> <strong>Scenario</strong> <strong>2050</strong> IVL report<br />
Summary<br />
Summary<br />
ENERGY SCENARIO <strong>2050</strong> 3<br />
The report presents an energy scenario <strong>for</strong> <strong>Sweden</strong> aiming at providing close to 100% of<br />
the The energy report by presents renewable an energy sources. scenario Renewable <strong>for</strong> <strong>Sweden</strong> resources aiming should at providing be produced close to with 100% a of<br />
high the energy level of by environmental renewable energy concern sources. and within Renewable the carrying resources capacity should of the be ecosystems. produced As with a<br />
a high consequence level of environmental biomass becomes concern a limited and resource, within the especially carrying since capacity the transport of the ecosystems. sector in As<br />
<strong>Sweden</strong> a consequence relies on biomass fossil energy becomes which a limited needs to resource, be substituted especially with since domestically the transport produced sector in<br />
renewable <strong>Sweden</strong> relies fuels, on and fossil electricity energy is produced which needs with to renewable be substituted energy technologies.<br />
with domestically produced<br />
renewable fuels, and electricity is produced with renewable energy technologies.<br />
In order to reach the goal of the energy scenario, efficiency measures are needed on the<br />
demand<br />
In order<br />
side<br />
to reach<br />
in all<br />
the<br />
of<br />
goal<br />
the three<br />
of the<br />
energy<br />
energy<br />
sectors.<br />
scenario,<br />
The<br />
efficiency<br />
scenario<br />
measures<br />
builds on<br />
are<br />
the<br />
needed<br />
idea that<br />
on<br />
the<br />
the de-<br />
energy<br />
mand side<br />
services<br />
in all<br />
needed<br />
of the<br />
in<br />
three<br />
society<br />
energy<br />
can<br />
sectors.<br />
be delivered<br />
The scenario<br />
in more efficient<br />
builds on<br />
ways.<br />
the idea<br />
For example<br />
that the energy<br />
in<br />
terms<br />
services<br />
of<br />
needed<br />
transport,<br />
in<br />
personal<br />
society can<br />
transports<br />
be delivered<br />
<strong>for</strong> long<br />
in more<br />
journeys<br />
efficient<br />
in <strong>Sweden</strong><br />
ways.<br />
are<br />
For<br />
considered<br />
example in<br />
to<br />
terms<br />
be<br />
of<br />
done<br />
transport,<br />
by train<br />
personal<br />
to a greater<br />
transports<br />
extent than<br />
<strong>for</strong> long<br />
today.<br />
journeys<br />
Still, cars<br />
in<br />
and<br />
<strong>Sweden</strong><br />
individual<br />
are considered<br />
transport means<br />
to be done<br />
are<br />
by<br />
important<br />
train to a greater<br />
<strong>for</strong> fulfilling<br />
extent<br />
transport<br />
than today.<br />
needs<br />
Still,<br />
in<br />
cars<br />
areas<br />
and individual<br />
where there<br />
transport<br />
is no public<br />
means are<br />
transport<br />
important<br />
infrastructure.<br />
<strong>for</strong> fulfilling transport<br />
Cars will operate<br />
needs in<br />
on<br />
areas<br />
biofuels<br />
where<br />
to<br />
there<br />
a great<br />
is<br />
extent<br />
no public<br />
<strong>for</strong> long<br />
transport<br />
journeys,<br />
infrastructure.<br />
while short<br />
Cars<br />
journeys<br />
will operate<br />
can be<br />
on<br />
powered<br />
biofuels to<br />
by<br />
a<br />
electricity.<br />
great extent<br />
Plug-in<br />
<strong>for</strong> long<br />
hybrid<br />
journeys,<br />
cars are<br />
while<br />
an option<br />
short<br />
that<br />
journeys<br />
will be<br />
can<br />
able<br />
be<br />
to<br />
pow-<br />
provide<br />
ered by<br />
both<br />
electricity.<br />
these services.<br />
Plug-in hybrid cars are an option that will be able to provide both these<br />
services.<br />
TWh<br />
450<br />
400<br />
350<br />
300<br />
250<br />
200<br />
150<br />
100<br />
50<br />
0<br />
1970 1990 2010 2030 <strong>2050</strong><br />
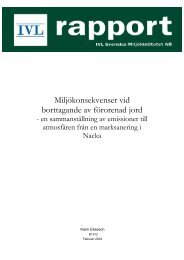
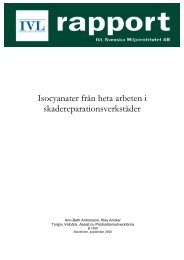
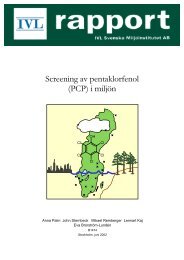
The paper and pulp industry will, according to the scenario continue to play a key role in both<br />
The biofuel paper and and heat pulp production. industry will, The according scenario builds to the on scenario the idea continue that biorefineries to play a key can role supply in a<br />
both range biofuel of energy and and heat industry production.The products scenario based on builds biomass on the resources. idea that The biorefineries biorefinery can can do<br />
supply this in an a range efficient of manner energy provided and industry that excess products heat based and residues on biomass are handled resources. properly. The<br />
biorefinery can do this in an efficient manner provided that excess heat and residues are<br />
handled<br />
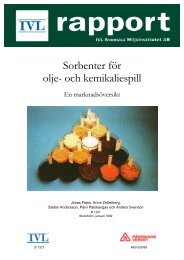
Hydropower,<br />
properly.<br />
bioenergy, wind and solar power (both heating and photovoltaic) <strong>for</strong>m the basis<br />
<strong>for</strong> energy supply in this scenario. Nuclear power as well as energy conversion based on<br />
non-renewable energy sources is phased out. New renewable energy technologies, such as<br />
bio algae, play a part in the scenario only in the run-up to <strong>2050</strong>. An increased share of intermittent<br />
power will be seen in the electricity system. This will pay increased attention to<br />
securing regulating capacity in the power system, as well as ensuring transmission capacity<br />
within the country and abroad.<br />
i<br />
Total<br />
Residential, services etc.<br />
Industry<br />
National transport
on non-renewable energy sources is phased out. New renewable energy technologies, such<br />
as bio algae, play a part in the scenario only in the run-up to <strong>2050</strong>. An increased share of<br />
intermittent power will be seen in the electricity system. This will pay increased attention to<br />
ENERGY SCENARIO <strong>2050</strong> 4<br />
securing regulating capacity in the power system, as well as ensuring transmission capacity<br />
within the country and abroad.<br />
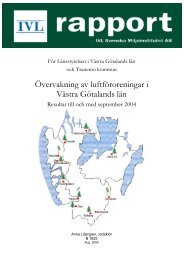
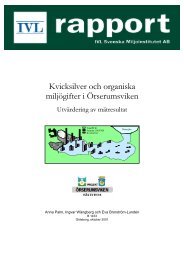
The supply curve of the Swedish energy system according to this scenario, excluding losses<br />
The in nuclear supply power, curve of is displayed the Swedish below energy (TWh). system according to this scenario, excluding losses<br />
in nuclear power, is displayed below (TWh).<br />
TWh<br />
500<br />
450<br />
400<br />
350<br />
300<br />
250<br />
200<br />
150<br />
100<br />
50<br />
0<br />
2010 2020 2030 2040 <strong>2050</strong><br />
Crude oil and oil products<br />
Coal and coke<br />
Natural gas, gasworks gas<br />
Hydropower is kept at the current production level. The increased production anticipated<br />
Hydropower is kept at the current production level. The increased production anticipated<br />
through climate change will be used to improve the environmental status of running water<br />
through climate change will be used to improve the environmental status of running water<br />
in <strong>Sweden</strong>. Wind power will increase to 20 TWh in 2020 and 30 TWh in 2030 and reach 45<br />
in <strong>Sweden</strong>. Wind power will increase to 20 TWh in 2020 and 30 TWh in 2030 and reach 45<br />
TWh in <strong>2050</strong>. A similar increase is seen in solar photovoltaic, reaching 32 TWh in <strong>2050</strong>.<br />
TWh in <strong>2050</strong>. A similar increase is seen in solar photovoltaic, reaching 32 TWh in <strong>2050</strong>.<br />
Reducing the demand will however represent the most important input to the scenario. <strong>Energy</strong><br />
Reducing efficiency the demand improvement will however of the magnitude represent the that most we anticipate important will input require to the a range scenario. of new<br />
approaches <strong>Energy</strong> efficiency in order improvement to be realized of the at the magnitude levels assumed that we anticipate in this scenario. will require The barriers a range of to be<br />
overcome new approaches are among in order other to things be realized found at the in promoting levels assumed available in this technology scenario. The in society barriers and<br />
making to be overcome energy efficiency are among a other central things variable found in in assessing promoting investment available technology options. Systematic in society ef<strong>for</strong>ts<br />
and making to prevent energy rebound efficiency effects a central from variable counteracting in assessing the reductions investment in options. demand Systematic must be initiated.<br />
ef<strong>for</strong>ts The to prevent scenario rebound builds on effects a constant from counteracting phasing out of the non-renewable reductions in demand energy sources must be and<br />
thus initiated. if a surplus The scenario is present builds there on should a constant be driving phasing <strong>for</strong>ces out of in non-renewable place to ensure energy that this sources surplus<br />
is and deducted thus if a from surplus fossil is and present non-renewable there should sources. be driving It can <strong>for</strong>ces be in seen place as to investing ensure that the surplus this<br />
created by energy efficiency improvement in natural capital.<br />
When assuming renewable energy sources as zero GHG-emitters, the reduction of carbon<br />
dioxide emissions from the energy sector will keep pace with the phasing out of fossil energy<br />
sources. Compared to 1990 greenhouse gas ii emissions in <strong>Sweden</strong> the reductions are almost<br />
30% by 2020 and will be halved by 2030. These emission levels can further be reduced by<br />
pushing harder <strong>for</strong> introducing biofuels or other alternative renewable fuels as a substitute<br />
<strong>for</strong> fossil fuels in the transport sector.<br />
The scenario has studied dynamic emissions of carbon dioxide, including terrestrial carbon,<br />
linked to the fuel category tops and branches. The results show that if substituting oil, tops<br />
and branches will reduce the global net carbon dioxide emissions significantly. Still, biomass<br />
Peat<br />
Nuclear power<br />
Heat pumps (extracted heat)<br />
Solar heat<br />
Surplus heat from industry<br />
Waste<br />
Bioenergy<br />
New renewable energy tech<br />
Solar photovoltaic<br />
Wind power<br />
Hydropower
ENERGY SCENARIO <strong>2050</strong> 5<br />
resources if used as a fuel will result in substantial emissions of terrestrial carbon dioxide<br />
and there are reasons to consider this when creating support structures and regulations <strong>for</strong><br />
various biofuels. For example, there might be biomass alternatives that are more beneficial<br />
<strong>for</strong> climate mitigation than others.<br />
The report also evaluates costs associated with the scenario’s main trends. The results point<br />
to reasonable costs and increasing benefits of the investments required to follow the scenario.<br />
Most of the measures are identified as mature technologies.<br />
The energy scenario presented in this report provides one scenario of what an energy scenario<br />
based on renewable energy could look like. <strong>Sweden</strong> and the energy system here is not<br />
isolated, but rather part of a Nordic energy system, as well as the European and global systems.<br />
This national energy scenario provides input and the basis <strong>for</strong> discussion on how to<br />
integrate and work with scenarios that include larger systems. For example there is a need<br />
to ensure that the process of initiating and creating support structures <strong>for</strong> energy efficiency<br />
improvement is started promptly. Investments in renewable energy technologies are already<br />
made but new capacity must replace old capacity based on non-renewable sources. This study<br />
shows one scenario where a Swedish energy system based on renewable energy sources, produced<br />
within the carrying capacity of the ecosystems in <strong>Sweden</strong>, is possible.
Foreword<br />
ENERGY SCENARIO <strong>2050</strong> 6<br />
The energy scenario presented in this report is based on a backcasting scenario of the Swedish<br />
energy system between 2010 and <strong>2050</strong>. The point of departure has been to see whether<br />
energy demand in <strong>Sweden</strong> can be covered by renewable energy resources available in the<br />
country at the same time as the resource utilization is kept within the carrying capacity of<br />
the ecosystems. In order to approach this last issue we have based the assumptions on limits<br />
on biomass output, bioenergy, hydropower, wind power, solar photovoltaic and solar heat<br />
potentials on a dialogue process with WWF <strong>Sweden</strong>. The result was a list of potentials which<br />
were then applied as resource limits in the energy scenario. It must be pointed out that these<br />
potentials should not be seen as policy or clearly defined sustainable potentials in <strong>Sweden</strong><br />
but rather as a pragmatic approach to set some boundaries in terms of available biomass<br />
and renewable energy resources in <strong>Sweden</strong>. The scenario represents one possible system under<br />
a certain set of inputs, and it should be seen as a point of departure <strong>for</strong> discussion and<br />
planning. The outset, in terms of technological change, is relatively conservative as most<br />
technologies that are applied in the model are available today. At the same time a number of<br />
not-so-conservative changes will have to happen, possibly the most acute is getting energy<br />
efficiency improvement initiatives to be realized. At present there is much talk on the issue<br />
of energy efficiency improvement, but un<strong>for</strong>tunately little happens.<br />
The work was to some extent based on the work reported in “Swedish long-term low carbon<br />
scenario – Exploratory study on opportunities and barriers” (Gode et al. 2010). The present<br />
project has improved the model and created a number of milestones between present and<br />
<strong>2050</strong>. In addition the present study has a focus on using renewable resources and potential<br />
climate impacts were then analysed based on the results.<br />
This project was carried out by IVL Swedish Environment Research Institute and lead authors<br />
are Mathias Gustavsson (project leader), Erik Särnholm, Peter Stigson and Lars Zetterberg.<br />
A number of people have contributed with inputs and valuable comments during the course<br />
of developing the scenario. Lisa Bolin and Martin Jerksjö at IVL have provided some data on<br />
energy efficiency improvement in buildings and transport data. A continuous dialogue with<br />
WWF <strong>Sweden</strong> has provided input and constructive comments on energy and environmental<br />
issues. This project was co-funded by WWF <strong>Sweden</strong> and the Foundation <strong>for</strong> IVL Swedish Environmental<br />
Research Institute (SIVL) via grants from the Swedish Environmental Protection<br />
Agency and the Swedish Research Council <strong>for</strong> Environment, Agricultural Sciences and<br />
Spatial Planning (Formas).
Contents<br />
Summary . . . . . . . . . . . . . . . . . . . . . . . . . . . . . . . .3<br />
Foreword . . . . . . . . . . . . . . . . . . . . . . . . . . . . . . . .6<br />
List of figures . . . . . . . . . . . . . . . . . . . . . . . . . . . .9<br />
List of tables . . . . . . . . . . . . . . . . . . . . . . . . . . . .10<br />
Abbreviations . . . . . . . . . . . . . . . . . . . . . . . . . . .12<br />
1 Introduction . . . . . . . . . . . . . . . . . . . . . . . . . . .13<br />
1.1 Other scenario studies. ................... 15<br />
1.2 Approach ............................. 16<br />
2 A Swedish <strong>2050</strong> energy scenario based on<br />
renewable energy . . . . . . . . . . . . . . . . . . . . .18<br />
2.1 Assumptions <strong>for</strong> the situation desired in <strong>2050</strong> .. 18<br />
2.2 Functions of the energy model applied ....... 21<br />
3 Demand side in <strong>Sweden</strong> . . . . . . . . . . . . . . . . .25<br />
3.1 The industry sector ...................... 25<br />
3.1.1 Pulp and paper industry ................. 26<br />
3.1.1.1 Wood available from <strong>for</strong>ests ......... 28<br />
3.2 The transport sector ..................... 30<br />
3.2.1 Goods transport ..................... 30<br />
3.2.1.1 Activity data ..................... 30<br />
3.2.1.2 Transport work efficiency (Wh/tkm) .... 31<br />
3.2.1.3 Railway goods transport –<br />
energy carriers ......................... 32<br />
3.2.1.4 Road goods transport – energy carriers 32<br />
3.2.1.5 Domestic shipping goods transport ... 33<br />
3.2.1.6 Domestic goods transport by air. ..... 34<br />
3.2.2 Passenger transport .................. 34<br />
3.2.2.1 Activity data ..................... 34<br />
3.2.2.2 Passenger transport work efficiency<br />
(Wh/pkm) ............................... 35<br />
3.2.2.3 Railway passenger transport –<br />
energy carriers ......................... 36<br />
3.2.2.4 Cars – energy carriers. ............. 36<br />
3.2.2.5 Metro and tram – energy carriers ..... 37<br />
3.2.2.6 Buses – energy carriers ............ 38<br />
3.2.2.7 Domestic shipping – energy carriers ... 38<br />
3.2.2.8 Domestic passenger air travel. ....... 38<br />
3.2.3 Other transport ...................... 39<br />
3.2.4 Transport in the household<br />
and service sector ........................ 40<br />
ENERGY SCENARIO <strong>2050</strong> 7<br />
3.2.5 Other parameters .................... 41<br />
3.2.5.1 Low blending .................... 41<br />
3.2.5.2 The source <strong>for</strong> the gas used<br />
in transport sector ...................... 41<br />
3.2.5.3 The source of the ethanol used<br />
in the transport sector. ................... 41<br />
3.3 The household and service sector ........... 42<br />
3.3.1 Activity data ........................ 42<br />
3.3.2 Efficiency <strong>for</strong> space and tap water heating<br />
(kWh/m 2 ) ............................... 43<br />
3.3.2.1 Detached houses –<br />
background parameters .................. 43<br />
3.3.2.2 Apartments – background parameters . 44<br />
3.3.2.3 Non-residential premises –<br />
background parameters .................. 44<br />
3.3.2.4 Summary of energy efficiency improvements<br />
<strong>for</strong> space and tap water heating ...... 45<br />
3.3.2.5 Improvement of heat pumps ........ 45<br />
3.3.2.6 Change in heating demand<br />
depending on climate change. ............. 46<br />
3.3.3 <strong>Energy</strong> carriers used <strong>for</strong> space and<br />
tap water heating ......................... 46<br />
3.3.3.1 Detached houses ................. 46<br />
3.3.3.2 Apartments. ..................... 47<br />
3.3.3.3 Non-residential premises. ........... 48<br />
3.3.4 Use of cooling ....................... 48<br />
3.3.5 Use of electricity (not <strong>for</strong> heating<br />
or cooling purposes) ...................... 49<br />
3.3.6 Other energy use in the household and<br />
service sector. ........................... 49<br />
4 Supply . . . . . . . . . . . . . . . . . . . . . . . . . . . . . . . .51<br />
4.1 Biofuel production ....................... 51<br />
4.2 District heating production. ................ 52<br />
4.3 Electricity production ..................... 53<br />
4.3.1 Hydropower ........................ 54<br />
4.3.2 Wind power ........................ 54<br />
4.3.3 Solar power ........................ 55<br />
4.3.4 New renewable energy technologies ...... 55<br />
4.3.5 Nuclear power. ...................... 55<br />
4.3.6 Electricity production in industry and<br />
district heating systems .................... 56<br />
4.3.7 Losses in transmission and distribution .... 56<br />
4.4 Bioenergy, waste and peat ................ 57
5 Results from the energy model . . . . . . . . . . . .59<br />
5.1 Supply. ............................... 60<br />
5.1.1 Electricity .......................... 61<br />
5.1.2 District heating ...................... 63<br />
5.2 <strong>Energy</strong> demands in <strong>Sweden</strong> ............... 65<br />
5.2.1 Demand in the industry sector. .......... 65<br />
5.2.2 Demand in the transport sector. ......... 66<br />
5.2.3 Demand in the household and<br />
service sector. ........................... 68<br />
5.3 Emissions of greenhouse gases. ............ 69<br />
5.4 Rebound effects ........................ 72<br />
6 Cost and policy overview . . . . . . . . . . . . . . . .74<br />
6.1 Costs ................................ 75<br />
6.1.1 Industry. ........................... 75<br />
6.1.2 Transport. .......................... 77<br />
6.1.3 Buildings ........................... 79<br />
6.1.4 Supply side ......................... 81<br />
6.2 Policies ............................... 82<br />
ENERGY SCENARIO <strong>2050</strong> 8<br />
7 Conclusions . . . . . . . . . . . . . . . . . . . . . . . . . . .83<br />
8 References . . . . . . . . . . . . . . . . . . . . . . . . . . . .85<br />
Appendix 1: . . . . . . . . . . . . . . . . . . . . . . . . . . . . .92
List of figures<br />
Figure 1: Illustration of the energy system studied,<br />
from energy supply to energy end-use without<br />
import and/or export by energy carriers (other<br />
than fossil fuels). .......................... 21<br />
Figure 2: <strong>Energy</strong> flows between the different<br />
sectors included in the model.. ............... 23<br />
Figure 3: Sector-wise change in energy demands,<br />
actual 1970-2009 and scenario 2010, 2020,<br />
2030, 2040 and <strong>2050</strong> (TWh). ................ 59<br />
Figure 4: Total <strong>Energy</strong> supply, excluding losses<br />
in nuclear (TWh) .......................... 60<br />
Figure 5: Demand of electricity in the Swedish<br />
energy system 2010-<strong>2050</strong> (TWh) ............. 61<br />
Figure 6: Generation of electricity in <strong>Sweden</strong><br />
2010-<strong>2050</strong> (TWh) ......................... 62<br />
Figure 7: Share of renewables in the electricity<br />
production mix in <strong>Sweden</strong>. .................. 63<br />
Figure 8: District heating, sources (TWh). ........ 64<br />
Figure 9: Total final energy demand in the<br />
Swedish energy system 2010-<strong>2050</strong> (TWh) ...... 65<br />
Figure 10: Total final energy demand in the<br />
Swedish industry sector 2010-<strong>2050</strong> (TWh) ...... 66<br />
Figure 11: Total final energy demand in the Swedish<br />
transport sector 2010-<strong>2050</strong> (TWh). Petrol and diesel<br />
categories are here pure fossil sources, the low-blend<br />
content is found in biofuels (liquid). ............ 66<br />
Figure 12: Total final energy demand in the Swedish<br />
household and service sector 2010-<strong>2050</strong> (TWh) .. 68<br />
Figure 13: Total energy-related carbon dioxide<br />
emissions, actual emissions 1980-2009<br />
(Energimyndigheten 2010b) and scenario emissions<br />
based on static emission factors (Naturvårdsverket<br />
2011) (Million ton CO 2) ..................... 69<br />
Figure 14: Remaining carbon dioxide in<br />
the atmosphere based on the tops and branches<br />
variable in the renewable energy scenario.<br />
Oil is used as a comparison. ................. 71<br />
Figure 15: Main trends in the scenario <strong>for</strong><br />
the transition towards a fossil-free society ....... 74<br />
Figure 16: Costs of increasing biofuels<br />
in industry per decade. ..................... 76<br />
ENERGY SCENARIO <strong>2050</strong> 9<br />
Figure 17: Cost comparison between<br />
a transition to RES (biofuels) and carbon dioxide<br />
tax costs per annum ....................... 77<br />
Figure 18: Costs of increasing rail transports<br />
per decade .............................. 77<br />
Figure 19: Cost comparison between rail and<br />
truck transports per ton kilometre (tkm) ......... 78<br />
Figure 20: Costs per decade of introducing<br />
electric vehicles ........................... 78<br />
Figure 21: Cost comparison between additional<br />
investment costs of EVs and ten-year spending<br />
on fuels in different scenarios. ................ 79<br />
Figure 22: Investments per decade to increase<br />
energy efficiency in the building sector. ......... 80<br />
Figure 23: Cost comparison of energy efficiency<br />
improvement investments and electricity costs<br />
in buildings per annum ..................... 80<br />
Figure 24: Costs per decade of<br />
increasing production of electricity production<br />
by wind and photovoltaic ................... 81<br />
Figure 25: An example of net emissions from<br />
using branches (2 cm) <strong>for</strong> energy. Data is based on<br />
simulations of carbon stock changes from using<br />
spruce branches (2 cm) in Southern Finland<br />
(Repo et al. 2010). The initial emission pulse from<br />
combustion is reduced over time due to avoided<br />
reference case emission (leaving the branches<br />
on the ground to decompose). ............... 93<br />
Figure 26: Remaining amount of CO 2 after a 1 kg<br />
pulse emission at t=0. Data from IPCC (2007b) ... 94<br />
Figure 27: Simulated carbon stock changes in<br />
a Swedish spruce <strong>for</strong>est, assuming two different<br />
utilization cases. Data is from Ågren et al. (2010) .. 95<br />
Figure 28: Use of tops and branches<br />
in the energy scenario (TWh). ................ 96<br />
Figure 29: Net emissions from using 1 MJ tops<br />
and branches <strong>for</strong> energy at t=0. .............. 96<br />
Figure 30: Calculated accumulated emissions<br />
<strong>for</strong> the four scenarios. ...................... 97<br />
Figure 31: Remaining carbon in the atmosphere<br />
from our four scenarios ..................... 98
List of tables<br />
Table 1: Population growth in <strong>Sweden</strong><br />
(million people) ........................... 19<br />
Table 2: The implementation rate of the different<br />
categories of measures introduced in the industry<br />
sector to reduce the use of fossil fuels. ......... 26<br />
Table 3: Share of black liquor used<br />
in recovery boilers ........................ 28<br />
Table 4: Biomass output from <strong>for</strong>ests based on<br />
different management regimes (Million cubic meters<br />
standing volume incl. bark, Mm3sk). ........... 29<br />
Table 5: Recalculated potentials of biomass output<br />
from <strong>for</strong>ests based on different management regimes<br />
(Million cubic meters standing volume incl. bark,<br />
Mm 3 sk) ................................ 29<br />
Table 6: The shares saw timber and pulp wood of<br />
net felling are averages from 2004 to 2009 according<br />
to Swedish Forest Agency (Skogsstyrelsen 2010).<br />
Net wood felling in Mm3sk is the WWF potentials.. 30<br />
Table 7: Transport volumes categorized by transport<br />
option in Wikström et al. (2009), SIKA (2009b) and<br />
the IVL scenario assumptions ................ 31<br />
Table 8: <strong>Energy</strong> efficiency <strong>for</strong> goods transport<br />
(Wh/tkm) ................................ 31<br />
Table 9: Share of goods transported by rail by<br />
different energy carriers ..................... 32<br />
Table 10: Goods transported and share of tkm<br />
per<strong>for</strong>med by different energy carriers <strong>for</strong> goods<br />
transport on roads (short distance) ............ 33<br />
Table 11: Goods transported and share of tkm<br />
per<strong>for</strong>med by different energy carriers <strong>for</strong> goods<br />
transport on roads (long distance) ............. 33<br />
Table 12: Goods transported and share of tkm<br />
per<strong>for</strong>med by different energy carriers <strong>for</strong> domestic<br />
shipping ................................ 34<br />
Table 13: Goods transported and share of tkm<br />
per<strong>for</strong>med by different energy carriers <strong>for</strong> goods<br />
transport by domestic air transports ........... 34<br />
Table 14: Personal transport volumes divided on<br />
transport option in Wikström et al. (2009), SIKA<br />
(2009b) and the IVL scenario assumptions ...... 35<br />
Table 15: <strong>Energy</strong> efficiency <strong>for</strong> passenger transport<br />
(Wh/pkm) ............................... 35<br />
Table 16: Passengers transported and share of<br />
pkm per<strong>for</strong>med by different energy carriers ...... 36<br />
Table 17: People transported by car and the<br />
share of pkm per<strong>for</strong>med by different energy carriers<br />
(short distance) ........................... 37<br />
ENERGY SCENARIO <strong>2050</strong> 10<br />
Table 18: People transported by car and share of<br />
pkm per<strong>for</strong>med by different energy carriers <strong>for</strong> people<br />
transported by car (long distance) ............. 37<br />
Table 19: Passengers and share of pkm per<strong>for</strong>med<br />
by different energy carriers <strong>for</strong> passenger transport<br />
by bus. ................................. 38<br />
Table 20: Passengers and share of pkm per<strong>for</strong>med<br />
by different energy carriers <strong>for</strong> passenger transport<br />
by domestic shipping. ...................... 38<br />
Table 21: Passengers and share of pkm per<strong>for</strong>med<br />
by different energy carriers <strong>for</strong> passenger transport<br />
by air. .................................. 39<br />
Table 22: <strong>Energy</strong> volumes linked to transport categorized<br />
as “other transport” and share of energy carriers<br />
linked to the transport work. ................. 39<br />
Table 23: <strong>Energy</strong> volumes linked to transport in<br />
the household and service sector and share of<br />
energy carriers linked to the transport work. ..... 40<br />
Table 24: Input parameters in the model of low<br />
blend in petrol and diesel fuels. ............... 41<br />
Table 25: The source of gas<br />
in the transport sector ...................... 41<br />
Table 26: Technology generation to produce ethanol<br />
used in the scenario ....................... 42<br />
Table 27: Activity data <strong>for</strong> detached houses,<br />
apartments and non-residential premises 2009,<br />
2010-<strong>2050</strong>.. ............................. 42<br />
Table 28: Background parameters <strong>for</strong> space and<br />
tap water heating in detached houses. ......... 43<br />
Table 29: Background parameters <strong>for</strong> space and<br />
tap water heating in apartments houses ........ 44<br />
Table 30: Background parameters <strong>for</strong> space and<br />
tap water heating in non-residential premises .... 44<br />
Table 31: Summary <strong>Energy</strong> efficiency improvements<br />
<strong>for</strong> space and tap water heating in detached houses,<br />
apartments and non-residential premises ....... 45<br />
Table 32: Improvement of COP values <strong>for</strong><br />
heat pumps. ............................. 45<br />
Table 33: Change in heating demand as a function<br />
of climate change ......................... 46<br />
Table 34: <strong>Energy</strong> carriers used <strong>for</strong> space and<br />
tap water heating in detached houses. ......... 46<br />
Table 35: <strong>Energy</strong> carriers used <strong>for</strong> space and<br />
tap water heating in apartments .............. 47<br />
Table 36: <strong>Energy</strong> carriers used <strong>for</strong> space and<br />
tap water heating in non-residential premises .... 48
Table 37: Need of cooling in household and<br />
service sector and share of cooling technology<br />
applied ................................. 48<br />
Table 38: Electricity use in detached houses,<br />
apartments and non-residential premises ....... 49<br />
Table 39: Other energy use in the household and<br />
service sector ............................ 50<br />
Table 40: <strong>Energy</strong> efficiency <strong>for</strong> producing (+) or<br />
using (-) biofuels, heat, electricity and other<br />
by-products compared to bioenergy input. ...... 51<br />
Table 41: District heating production and energy<br />
carriers (technologies) (TWh) ................. 52<br />
ENERGY SCENARIO <strong>2050</strong> 11<br />
Table 42: Alpha values <strong>for</strong> electricity production<br />
in district heating systems ................... 53<br />
Table 43: The production of electricity<br />
by different technologies (TWh) ............... 54<br />
Table 44: Losses linked to<br />
electric power production ................... 56<br />
Table 45: Bioenergy waste and peat potentials<br />
in the scenario (TWh). ...................... 57<br />
Table 46: Electricity production<br />
and demand (TWh) ........................ 62
Abbreviations<br />
ENERGY SCENARIO <strong>2050</strong> 12<br />
CCS Carbon Capture and Storage<br />
CHP Combined heat and power production, cogeneration<br />
COP Coefficient of per<strong>for</strong>mance<br />
DME Dimethyl ether<br />
EE <strong>Energy</strong> efficiency<br />
EO1 Oil quality (light fuel oil, similar to diesel)<br />
EO2-4 Oil quality (fuel oil, thicker quality contains more sulphur than EO1)<br />
EU-ETS European Emission Trading Scheme<br />
EV Electric vehicles<br />
FAME Fatty acid methyl ester<br />
GHG Greenhouse gases<br />
ICT In<strong>for</strong>mation and Communication Technologies<br />
IVL IVL Swedish Environmental Research Institute<br />
LPG Liquefied Petroleum Gas<br />
PFE Program <strong>for</strong> Improving <strong>Energy</strong> Efficiency in <strong>Energy</strong> Intensive Industries<br />
pkm person kilometre<br />
PV Photovoltaic<br />
RES Renewable energy source<br />
RD&D Research, development and demonstration<br />
SNG Synthetic Natural Gas. The gas can have an origin in both renewable<br />
sources as well as fossil. Here SNG relates to synthetic gas that originates<br />
from organic matter hence a renewable SNG.<br />
tkm tonne kilometre<br />
UNFCCC United Nations Framework Convention on Climate Change<br />
WWF Name of a global environmental organization. Previously it was an acronym<br />
<strong>for</strong> World Wildlife Fund and World Wide Fund <strong>for</strong> Nature but stands as<br />
the name of the international organization today. Known in <strong>Sweden</strong> as<br />
WWF <strong>Sweden</strong>.
1 Introduction<br />
ENERGY SCENARIO <strong>2050</strong> 13<br />
This report describes what the energy demands could be in a resource efficient energy system<br />
in <strong>Sweden</strong>. These energy demands were then analysed in the light of available energy<br />
resources in <strong>Sweden</strong>. This last step shows that a possible energy balance based on renewable<br />
energy resources, available in <strong>Sweden</strong> extracted within the environmental carrying capacity<br />
is possible. The report also includes an evaluation of the costs associated with the scenario’s<br />
main trends. This includes a discussion on stakeholders and policy perspectives in terms of<br />
which actors will bear which costs and how the required investments can be promoted.<br />
The energy systems that we see today in European countries rely heavily on fossil- and nonrenewable<br />
energy sources. The energy systems are the result of many decades of development,<br />
and optimization towards being competitive and safe in terms of operation and delivery<br />
of the services that the systems supply. Changes can occur in terms of what type of<br />
fuels used, technologies used to generate, and transfer energy as well as technologies used<br />
to transport people and goods. Society can develop a number of instruments to support,<br />
stimulate or <strong>for</strong>ce changes in certain directions.<br />
The use of fossil resources in the energy system has been a main contributing factor to the<br />
increase in greenhouse gases (GHG) in the atmosphere (IPCC 2007a). The challenges presented<br />
by climate change pose a great risk that may threaten the very existence of the human<br />
society (Lynas 2008).<br />
Climate change cannot be seen in isolation to other environmental and societal challenges.<br />
Rockström et al (2009) argue that there are a number of planetary boundaries that we have<br />
to consider when shaping and planning our society. In this framework the challenges of climate<br />
change are accompanied by those of loss of biodiversity and human interference with<br />
the nitrogen cycle. Time series since the 70’s shows substantial losses of biodiversity (WWF<br />
2010) and it has been shown that biodiversity plays a central role in keeping ecosystems<br />
services intact and thus also creating the foundation <strong>for</strong> our societies (Millennium Ecosystem<br />
Assessment 2005).<br />
Large parts of the world’s population do not have access to modern energy sources while<br />
other people use energy without having to consider whether it is sustainable or not. As an<br />
example, developing countries use about half of the world’s energy but hosts more than 80%<br />
of the global population (World Bank 2011). Access to modern energy sources has a number<br />
of positive impacts on human well-being, such as improved health due to improved in-door<br />
climate, the ability to take advantage of in<strong>for</strong>mation and communication technologies (ICT)<br />
and reduce time and money spent on collection and purchasing traditional energy sources<br />
(Modi et al. 2005; UNDP 2005).<br />
On a global scale there is a need both to expand and facilitate the access to modern energy<br />
sources <strong>for</strong> many people, while in other cases there is need to reduce the use of energy<br />
(World Bank 2010). OECD countries will generally have to make more efficient use of energy,<br />
while access to modern energy sources in developing countries will have to increase. This is<br />
not the same thing as to argue that in countries where energy use should decrease, a reduc-
ENERGY SCENARIO <strong>2050</strong> 14<br />
tion in living standards or economic activity will occur. <strong>Energy</strong> is often discussed in terms of<br />
energy units and this is a practical way of presenting and analysing the energy system and<br />
this is also done in this report. <strong>Energy</strong> is linked to economic growth in countries, as more<br />
production generally means that there is need <strong>for</strong> more use of energy. As a consequence<br />
increased use of energy has normally meant that there is also economic growth (IEA 2010).<br />
At the same time it is not the energy per se that creates or pushes development, but rather<br />
what the energy is used <strong>for</strong>. Services created from energy use are often referred to as energy<br />
services. The same energy service can be obtained from different energy sources, as well as<br />
different amounts of energy units. How to decouple economic growth from energy use and<br />
economic growth is being discussed. The operationalisation of this in areas with high energy<br />
use, and the implementation of energy efficiency improvement activities are of great importance.<br />
<strong>Energy</strong> use is a global issue and there is no simple, single solution. However, one thing is<br />
certain, changes in the energy systems will occur whether we like it or not. Climate changes<br />
will alter weather conditions and affect ecosystems, hydrological cycles and a whole range of<br />
ecosystem services that are linked to energy systems (Ebinger and Vergara 2011). In addition<br />
there is growing evidence that the fossil oil era is coming to an end as we now likely have<br />
passed what is referred to as the peak-oil (Aleklett et al. 2010) 1 . Even though we have seen a<br />
moving 30-year respite in terms of available oil reserves since the Rome club report in 1972<br />
(Meadows et al. 1972) we seem now to have reached a point where the known reserves of oil<br />
do not grow at the same pace as the demand <strong>for</strong> oil, a situation not known previously.<br />
Still it is vital to understand that these challenges, even though they may sound dystopic, do<br />
not imply that the end of the world is coming. A key report presented by Sir Nicholas Stern<br />
(2006) argues that a transition towards a more sustainable society would require substantial<br />
investments but would not necessarily act as a cap on the capacity <strong>for</strong> economic growth. The<br />
worst scenario, according to the report, is to do nothing.<br />
The current report presents an energy scenario <strong>for</strong> <strong>Sweden</strong> where the use of fossil and nonrenewable<br />
energy sources has been reduced to a level less than 5% of the total energy use in<br />
the country. This is reached in <strong>2050</strong>. In order to achieve this, a number of steps and changes<br />
will have to be seen in the energy system, infrastructure, and regulating/supporting mechanisms<br />
and institutions. The global challenges are all relevant to the Swedish case. There is<br />
need to reduce the use of resources and to attain more efficient energy services. <strong>Sweden</strong> has<br />
a high primary energy use per person and, as will be shown, vast improvements can be made 2 .<br />
Further on, aspects of environmental concern in the exploitation of natural resources can be<br />
strengthened. All options of energy generation and extraction of natural resources will have<br />
environmental impact and in this scenario a high level of environmental restrictions have<br />
been applied.<br />
1 Peak oil describes a point in time when the production rate of oil products reaches its maximum. The point is defined through analysing the known production<br />
in individual oil wells in combination with known oil reserves. Reaching the peak oil sets focus on a decrease in oil production and subsequently<br />
increased oil prices.<br />
2 Primary energy is the actual energy resource use. In the case of energy carriers such as electricity, there is a range of unseen losses.
1.1 Other scenario studies<br />
ENERGY SCENARIO <strong>2050</strong> 15<br />
There have been a large numbers of studies produced in recent years focusing on global energy<br />
systems and possible pathways <strong>for</strong>ward (some examples are Delucchi and Jacobson 2010;<br />
EREC 2010; Jacobson and Delucchi 2010; PWC 2010; Teske et al. 2010b; Deng et al. 2011;<br />
IPCC 2011b; Jeffries 2011; UNEP 2011). These studies were motivated by needs to mitigate<br />
the rising GHG levels in the atmosphere, counteract effects that will occur as the cost of oil<br />
increases, prevent the loss of biodiversity, minimize negative effects on local livelihoods and<br />
human well-being and tackle unequal distribution of wealth in the world.<br />
The scenarios all indicate a reduction in GHG emissions and a shift towards more renewables<br />
in the energy system. A whole range of efficiency measures are taken into account in order<br />
to reduce energy use. However, there are also a number of optional technologies that are<br />
found in some scenarios, but not used in others. For example nuclear power is a technology,<br />
defined as non-renewable, which has low GHG emissions compared to fossil energy-based<br />
technologies. Another technology found in some scenarios, while not in others is Carbon<br />
Capture and Storage (CCS) and similar technologies such as Bio-energy with Carbon Capture<br />
and Storage (BECCS). In a recent study of the IPCC working group on renewable energy they<br />
conclude that the global technical potential of renewable energy is always substantially higher<br />
than global energy demand (Edenhofer et al. 2011). There is a whole range of technology<br />
options that may develop in the future, but it is difficult today to assess whether or not their<br />
potentials will be realized. There are assumptions made in all scenarios regarding the technologies<br />
and usage patterns that will evolve, and outcomes are based on these assumptions.<br />
Technical breakthroughs, and societal changes could make the transition to the sustainable<br />
use of resources come much quicker.<br />
The present study is limited to the Swedish energy system and in that sense connects to the<br />
long range of energy pathways that have been studied and presented <strong>for</strong> <strong>Sweden</strong>. In 1980<br />
there was a referendum in <strong>Sweden</strong> concerning the future <strong>for</strong> nuclear power and linked to<br />
this referendum an intensive debate took place on how the energy system would look in the<br />
future. Focus was generally on electricity and to some extent also heating, while energy <strong>for</strong><br />
transport was rarely discussed. One reason was that climate change had not become a prioritized<br />
political issue at that time. The decision on the future of nuclear power in <strong>Sweden</strong><br />
in 1980 was that it should be phased out in parallel with the introduction of new production<br />
capacity based on renewable energy technologies. The process of phasing out nuclear power<br />
in <strong>Sweden</strong> was, however, slow and today only two reactors have been shut down and 10 are<br />
still in operation.<br />
During the 90s several studies of energy futures were carried out (Meyer et al. 1993; Haegermark<br />
1996; Azar and Lindgren 1998). The discussion on nuclear power also continued and an<br />
official report by the Swedish government concerning the energy system and future development<br />
was presented in 1995 (SOU 1995). In 1996 a special initiative was launched that looked<br />
at transport (Kommunikations<strong>for</strong>skningsberedningen). This initiative led to research and<br />
studies were carried out on sustainable transport systems (Åkerman et al. 2000).<br />
The global work looking at pathways <strong>for</strong> energy futures and how to tackle climate change<br />
have stimulated development within the EU of the climate package also referred to as the
ENERGY SCENARIO <strong>2050</strong> 16<br />
2020 targets (COM 2008) as well as the Renewable <strong>Energy</strong> Directive (RED) (European Parliament<br />
2009). Several studies and energy scenarios were also designed and presented in<br />
<strong>Sweden</strong> (Herland 2005; Åkerman et al. 2007; Bryntse and Mattison 2010; Gode et al. 2010;<br />
Profu 2010; Svensk Energi 2010) 3 . Most of these look at different ways to make the energy<br />
system in <strong>Sweden</strong> independent on fossil energy sources. In 2008 the Swedish Government<br />
presented goals and visions linked to energy and climate issues (Regeringskansliet 2008b;<br />
Regeringskansliet 2008a). According to these documents <strong>Sweden</strong> should not be a net emitter<br />
of GHG in <strong>2050</strong> and the transport fleet should not be dependent on fossil energy sources<br />
in 2030 4 . In terms of the more immediate actions, <strong>Sweden</strong>, as all EU member states have<br />
ventured on a National Renewable <strong>Energy</strong> Action Plan (NREAP) stating how the goals set<br />
in the RED will be met by 2020 (Regeringskansliet 2010; Beurskens and Hekkenberg 2011).<br />
The goals set by <strong>Sweden</strong> in its NREAP are not very ambitious considering the resources and<br />
energy system found in <strong>Sweden</strong> today. The goal of 49% renewable energy will be met on a<br />
business-as- usual scenario. <strong>Energy</strong> efficiency improvement stands out in terms of vagueness<br />
and is not considered in the NREAP and the route <strong>for</strong>ward to realize the goals set in<br />
the 2020 targets. In 2010 and 2011 the goals related to the energy efficiency improvement<br />
in the 2020 targets was presented in a little more detail by the European Commission (European<br />
Commission 2010c; European Commission 2010a). <strong>Energy</strong> efficiency improvement<br />
activities are carried out in <strong>Sweden</strong> and a number of programmes have been implemented<br />
by the Swedish <strong>Energy</strong> Agency to support energy efficiency improvement in <strong>for</strong> example the<br />
Program <strong>for</strong> Improving <strong>Energy</strong> Efficiency in <strong>Energy</strong> Intensive Industries (PFE) and also support<br />
<strong>for</strong> energy efficiency improvement work in municipalities and county councils. Many<br />
would, however, argue that there are vast untapped potentials <strong>for</strong> energy efficiency improvement<br />
that have not been realized yet (McKinsey&Company 2008; Nilsson 2008; Ågren et al.<br />
2008; Nilsson and Wolf 2011).<br />
1.2 Approach<br />
The Swedish energy system is interlinked and part of the Scandinavian energy system, the<br />
European energy system and also a part of a global energy system. There are many energy<br />
visions, pathways and scenarios <strong>for</strong> each of these levels; global (WEC 2007; Shell 2008;<br />
C.I.R.E.D et al. 2009; Delucchi and Jacobson 2010; IEA 2010; Jacobson and Delucchi 2010;<br />
Teske et al. 2010b; Deng et al. 2011; Jeffries 2011), regional EU 27 (EREC 2010; Odenberger<br />
and Johnsson 2010; PWC 2010; Teske et al. 2010a; EWEA 2011), regional Nordic (Illum 2006;<br />
Melgaard 2006) and Swedish (Haegermark 1996; Azar and Lindgren 1998; Akhtarzand et al.<br />
2003; Åkerman et al. 2007; Bryntse and Mattison 2010; Profu 2010). The reports mentioned<br />
above are interlinked both between scales and between the same scale in <strong>for</strong> example neighbouring<br />
countries. For instance, a number of the Danish scenarios make use of the regulating<br />
capacity in the Swedish and Norwegian electricity systems when planning their energy<br />
scenarios (see <strong>for</strong> example Mathiesen et al. 2009). In such cases it is vital to know of whether<br />
there is or will be in the future competition <strong>for</strong> the regulating capacity that makes it possible<br />
to balance moment by moment demand and supply of electricity. Another example is the<br />
3 There are also some examples of studies made of a Scandinavian energy system, see <strong>for</strong> example Illum (2006) and Melgaard (2006).<br />
4 Flex-fuel engines are acceptable according to this goal as these engines can run on renewables.
ENERGY SCENARIO <strong>2050</strong> 17<br />
biomass used to produce energy carriers to substitute fossil energy such as petrol and diesel,<br />
how much of this biomass will be domestically sourced and how it will be used within the<br />
national energy system.<br />
These national energy scenarios are planning tools and inevitably include assumptions and<br />
normative judgments. Many of these assumptions are linked to define system boundaries<br />
and here defining a geographical border is useful. <strong>Sweden</strong> is part of the European Union (EU)<br />
and as such we cooperate and take part in EU processes to reduce CO 2 emissions and preserve<br />
environmental values. Some things we cannot decide by ourselves, such as the internal<br />
market, but there are several other issues that we can decide upon. For example the regulations<br />
on buildings, strategic work on energy efficiency improvement and support structures<br />
linked to this, as well as how to consider environmental values such as biodiversity in our<br />
management of <strong>for</strong>ests and other land uses.<br />
The scenario developed in this report is based on a backcasting method (Robinson 1982; Dreborg<br />
1996). The backcasting method in terms of scenario making takes a point of departure<br />
in a desired vision and from this vision a path linking the vision to present day is described.<br />
Linking the vision with the present is an iterative process where actions are described that<br />
will push changes in the system in a direction that will end with the vision. Backcasting is<br />
a normative method and is useful <strong>for</strong> exploring and creating an understanding of future<br />
opportunities and structures of society and in strategic planning (Naturvårdsverket 2005;<br />
Börjeson et al. 2006). The method has been applied in a range of studies and often within a<br />
sustainability context (Azar and Lindgren 1998; Holmberg and Robért 2000; Åkerman et al.<br />
2000; Svenfelt et al. 2010).<br />
A backcasting is different from a <strong>for</strong>ecast approach where present day situation and trends<br />
are drawn further into the future, adjusting the development in relation to price adjustments,<br />
possible innovations and regulations. A Swedish example of a <strong>for</strong>ecast is the longterm<br />
energy <strong>for</strong>ecast presented by the Swedish <strong>Energy</strong> Agency (Energimyndigheten 2009). A<br />
<strong>for</strong>ecast could be broadly described as a possible, relatively near future, while the backcasting<br />
is <strong>for</strong>med around a desired future or examined vision in a more distant future.
2 A Swedish <strong>2050</strong> energy scenario<br />
based on renewable energy<br />
ENERGY SCENARIO <strong>2050</strong> 18<br />
The energy scenario presented in this report is based on a backcast. The energy system investigated<br />
<strong>for</strong> <strong>2050</strong> should fulfil a set of desired conditions related to the sustainable use of<br />
existing resources.<br />
2.1 Assumptions <strong>for</strong> the situation desired in <strong>2050</strong><br />
The energy system <strong>for</strong> <strong>2050</strong> investigated in this energy scenario could be described as a resource-efficient<br />
energy system, based on local resources managed with a high level of sustainability<br />
concern. The scenario is geographically limited to the energy system in <strong>Sweden</strong><br />
and includes supply and demand in the transport, industrial, household and service sectors.<br />
The supply should be provided with renewable resources produced or present within <strong>Sweden</strong>.<br />
This does not mean that imports and exports of renewable energy sources are not allowed,<br />
but there should not be an import of a resource, <strong>for</strong> example biofuels, that exceeds the export<br />
of domestic production. This precondition is based on the realization that <strong>Sweden</strong>’s<br />
energy use is dependent on imported energy resources to a high degree 5 and at least <strong>Sweden</strong><br />
should be able to provide renewables to meet its own needs. At the same time renewable<br />
energy sources are not cornucopias where an endless amount of energy can be tapped in<br />
every second. In fact renewable energy sources are limited to the regeneration capacity of<br />
the source and this will necessitate management of the source sustainability or it will be<br />
depleted. The levels of use of <strong>for</strong> example biomass were based on a dialogue with WWF. This<br />
dialogue has resulted in a number of potentials that are given in the report. The levels indicated<br />
are based on assessments made on environmental considerations but do not represent<br />
a policy statement.<br />
The energy system should be based on renewable energy technologies and resources in <strong>2050</strong>.<br />
There is, however, one exception concerning coal used in steel processing. This coal has not<br />
been fully substituted with renewables in the scenario. In other industries the transition<br />
from fossil sources to renewable sources is accomplished by <strong>2050</strong> and thus almost all excess<br />
heat and electricity production is based on renewables.<br />
The approach to limit the scenario to the Swedish geographic area is pragmatic in the sense<br />
that the energy system in <strong>Sweden</strong> is part of a Scandinavian energy market <strong>for</strong> electricity<br />
(NordPool) and also in that <strong>Sweden</strong> is part of the European Union and takes an active part<br />
in the implementation of the Union’s goals concerning related areas. For example, according<br />
to the European Commission (2010b) there is a need to develop a pan-European energy<br />
market and thus Swedish energy conversion and energy use would be interlinked with other<br />
countries’ energy systems. The scenario is, however, based on a balance between the domes-<br />
5 According to the European Union (2010) imported energy amounts to 17% of the total gross inland consumption of energy. If nuclear energy is included in<br />
imported energy (there is no commercial mining of uranium in <strong>Sweden</strong>) this dependency on imported energy reaches almost 70%.
ENERGY SCENARIO <strong>2050</strong> 19<br />
tic energy needs and existing domestic energy conversion and generation, which does not<br />
exclude export and import as long as this balance is kept.<br />
The scenario also stipulates that a high level of concern is taken in the management of <strong>for</strong>est<br />
and other land uses. The level envisioned goes beyond the RED sustainability criteria<br />
(European Parliament 2009) and will need a range of changes in present <strong>for</strong>est governance<br />
and management in order to be operationalised. This report takes its point of departure in<br />
assessments of the potential available biomass, but does not include a detailed discussion<br />
of the changes that this would require in terms of policy and regulations within the sector.<br />
Consumption and energy use linked to the resources used <strong>for</strong> this production that take place<br />
outside Swedish borders, is not included in this scenario. Carlson-Kanyama et al. (2007)<br />
made assessments of emissions of GHG linked to Swedish consumption and the resulting<br />
GHG emissions which also included emissions in other parts of the world. This was then<br />
compared to official statistics. The result showed that emissions varied to a high degree (57-<br />
109 Mton CO 2 per year) if these emissions were included or not. The official statistic <strong>for</strong> a<br />
comparable period was 54 Mton CO 2 per year (Carlsson-Kanyama et al. 2007). Similar results<br />
are also found in Minx et al. (2008) and Naturvårdsverket (2010)<br />
The resources used in international air travels by Swedish people are not part of this scenario.<br />
This is considered consumption outside the Swedish borders and hence excluded. Based<br />
on the same reasoning domestic air travel and transport is part of the scenario. Similar exclusion<br />
is made <strong>for</strong> international shipping while domestic boat transports are included in the<br />
scenario. For a global approach to a renewable energy scenario, where international air and<br />
boat traffic is also included, see <strong>for</strong> example Deng et al. (2011)<br />
The scenario does not include CCS as an option to reduce emissions of carbon dioxide. An energy<br />
scenario based on renewable resources is the point of departure – CCS (or BECCS) would<br />
not affect the energy mixes other than through <strong>for</strong> example efficiency losses in the capture<br />
technologies. Nuclear power is not a renewable source of energy and is thus also phased out<br />
be<strong>for</strong>e <strong>2050</strong>. All fossil fuels are assumed to be faced out gradually from 2010 to <strong>2050</strong> except<br />
parts of the coal used in the steel industry. It is assumed that a renewable source is used<br />
where such exists, thus substituting the non-renewable.<br />
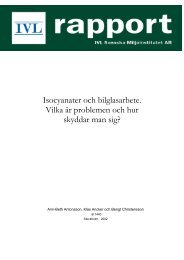
The number of people that live and work in <strong>Sweden</strong> will have an impact on the resources<br />
required in the energy system. Population growth is based on Statistics <strong>Sweden</strong> (SCB 2011)<br />
and the population in <strong>Sweden</strong> will reach 10.7 million people in <strong>2050</strong> (Table 1).<br />
Table 1: Population growth in <strong>Sweden</strong> (million people)<br />
2005 2010 2020 2030 2040 <strong>2050</strong><br />
Population (million) 9.05 9.42 10.00 10.36 10.55 10.73<br />
Population Growth (% per year) 0.81% 0.60% 0.36% 0.18% 0.18%<br />
The scenario takes its point of departure in the economic growth assumed <strong>for</strong> <strong>Sweden</strong> from<br />
2010 to 2030 (National Institute of Economic Research). That economic growth is used in<br />
the Swedish <strong>Energy</strong> Agency (Energimyndigheten 2009) and the other <strong>for</strong>ecasts used in the
ENERGY SCENARIO <strong>2050</strong> 20<br />
scenario. That has resulted in increased demand of production in industry, increased activity<br />
of transport and increase demand <strong>for</strong> e.g. cooling in the residential and service sectors. The<br />
scenario assumes a lower increase in transport activity compared to official <strong>for</strong>ecasts and<br />
<strong>Energy</strong> <strong>Scenario</strong> <strong>2050</strong> IVL report<br />
high energy efficiency improvement implementation. Economic growth is assumed to be<br />
constant at 2.2% per year due to the large investments needed <strong>for</strong> energy efficiency improvement<br />
implementation.<br />
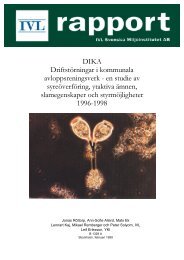
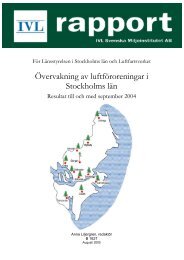
Area: 450,000 km² km²<br />
• Forests: 53% 53%<br />
• Mountains: 11% 11%<br />
• Cultivated land: land: 8% 8%<br />
• Lakes and and rivers: rivers: 9% 9%<br />
Longest north-south distance: distance: 1,574 1,574 km km<br />
Longest east-west distance: 499 499 km km<br />
Capital: Stockholm<br />
Population 2010: 9.4 9.4 million million inhabitants<br />
Most important export goods: Machinery, electronics electronics and telecommunication, and telecommunication, paper, pharmaceuticals,<br />
paper,<br />
petroleum pharmaceuticals, products, petroleum iron and steel, products, and foodstuffs iron and steel, and foodstuffs<br />
Most important imported goods: Electronics and telecommunication, and telecommunication, machinery, machinery, foodstuffs, foodstuffs, crude oil,<br />
textiles crude oil, and textiles footwear, and chemicals, footwear, pharmaceuticals chemicals, pharmaceuticals and petroleum products and petroleum products<br />
(Source: <strong>Sweden</strong>.se 2011)
2.2 Functions of the energy model applied<br />
ENERGY SCENARIO <strong>2050</strong> 21<br />
In order to investigate the road to <strong>2050</strong>, a model of the energy system in <strong>Sweden</strong> has been applied.<br />
The energy system was analysed with respect to energy supply, energy conversion and<br />
energy end-use in the three energy demanding sectors i) industry, ii) transport, and iii) household<br />
and service, see Figure 1. Bunker fuels (international flight and shipping), energy <strong>for</strong><br />
uses other than energy purposes, and losses in nuclear were not included in the methodology.<br />
<strong>Energy</strong> supply<br />
Hydro power<br />
Wind power<br />
Biomass<br />
Solar<br />
Other renewable<br />
Coal and coke<br />
Crude oil, oil<br />
products and gas<br />
Nuclear power<br />
Other<br />
<strong>Energy</strong> carriers<br />
Losses etc<br />
Figure 1: Illustration of the energy system studied, from energy supply to energy end-use without<br />
import and/or export by energy carriers (other than fossil fuels).<br />
<strong>Energy</strong> demand and supply are analysed <strong>for</strong> the following sectors:<br />
1) <strong>Energy</strong> end-using sectors<br />
a) Industry<br />
b) Transport (excluding international aviation and shipping)<br />
c) Household and service<br />
2) <strong>Energy</strong> converting/supplying sectors:<br />
a) Power production<br />
b) Heat production<br />
c) Fuel production<br />
Electricity<br />
District heating<br />
Biofuels<br />
Coal and coke<br />
Fossil gas<br />
Synthetic gas<br />
Losses electricity<br />
transmission<br />
Losses in nuclear<br />
Other<br />
Demand sectors<br />
Industry sector<br />
Transport sector<br />
Household and<br />
service sector
ENERGY SCENARIO <strong>2050</strong> 22<br />
The model is based on fulfilling energy service demands. There is an iteration taking place<br />
in order to see that the demands can be fulfilled by the supply side, and that the supply side<br />
is also within the set of potentials described as being within the carrying capacity of the<br />
ecosystems in <strong>Sweden</strong>. The methodology used can be divided into 3 stages <strong>for</strong> the end-using<br />
sectors:<br />
1. Determine the activity level, e.g. need of transport, square meters heated, and how it<br />
trends in the future. These activities are based on demand of energy services and are<br />
not limited to energy units.<br />
2. Find specific energy use per unit activity and how it trends in the future. This variable<br />
is an operationalisation of technology development and initiatives that push <strong>for</strong><br />
more efficient energy use in supplying each specific energy service.<br />
3. Assess and determine the energy carriers and technologies that are applied in the<br />
model.<br />
Each of these steps was taken <strong>for</strong> 2010, 2020, 2030, 2040 and <strong>2050</strong>. There are no calculations<br />
between these points. The diagrams presented are generally made as area diagrams as these<br />
are easily understood. In the diagrams a straight line connects the different decades, while<br />
in fact the process described and anticipated in the scenario takes place mostly at the end<br />
or beginning of the period. The reader is asked to bear this in mind when interpreting the<br />
diagrams. The gradient in the line between 2010 and 2020 does not account <strong>for</strong> the actual<br />
situation in the preceding years. This means that considering the progress we see in the energy<br />
demand today in <strong>Sweden</strong>, there is a challenge to shift this trend from slight increase to<br />
decrease in energy use.<br />
The values <strong>for</strong> 2010 are based on calculations. Due to the economic crisis that was experienced<br />
in <strong>Sweden</strong> (and globally) 2007-2010 the connections between calculated numbers <strong>for</strong><br />
2010 and real values display gaps in some cases.<br />
Activity levels are based on official <strong>for</strong>ecasts or the extrapolation of historical trends even<br />
though the increase in activity has been reduced <strong>for</strong> the transport sector. The assessments<br />
of specific energy use per unit activity are based on literature or in some cases IVL assumptions<br />
based on experience. References are given in the text to make the sources transparent.<br />
The scenario assumes a rapid implementation of energy efficiency improvement activities<br />
in all sectors. The assumptions also include development of the technology found in the<br />
energy system, both on the supply side as well as the demand side. The energy carriers and<br />
technologies used in the future have been selected with regard to reaching the overall goal<br />
of a renewable future in <strong>2050</strong> within the carrying capacity of the ecosystems with regards to<br />
energy supply.<br />
In the case of the industry sector it has not been possible to separate the two first stages<br />
(except <strong>for</strong> the pulp and paper industry). The use of energy in each sub-sector was instead<br />
based on the Swedish <strong>Energy</strong> Agency long term scenario (Energimyndigheten 2009) and<br />
extrapolated to <strong>2050</strong> with an assumption of increased energy efficiency.
ENERGY SCENARIO <strong>2050</strong> 23<br />
The Swedish <strong>Energy</strong> Agency long term scenario and the other <strong>for</strong>ecasts used in the scenario<br />
are based on an economic growth rate of 2.2% per year (National Institute of Economic Research,<br />
Konjunkturinstitutet). The impact of the decreased activity in the transport sector<br />
and the energy efficiency improvement measures implemented on economic development<br />
are not analysed in the report. At the same time all the required investments will stimulate<br />
economic development and not decrease economic activity. A more detailed discussion of<br />
the economy of the scenario is provided in Chapter 6.<br />
The methodology used <strong>for</strong> supply differs between the different sectors. Biofuel production<br />
and the district heating sectors produce the biofuels and heat demanded by the end-using<br />
sectors. Biofuel production uses bioenergy and electricity to produce biofuels as well as heat<br />
and energy resources and in some processes yield electricity. District heating systems produce<br />
electricity by combined heat and power and use surplus heat and energy from biofuel<br />
production and industry beside waste, heat pumps and bioenergy. Electricity production is<br />
determined by the electricity production potentials and during some decades potential production<br />
<strong>Energy</strong> <strong>Scenario</strong> is much <strong>2050</strong> larger than the electricity demand in the scenario.<br />
IVL report<br />
Figure 2 illustrates energy interactions between the different sectors that are operationalised<br />
in the model. The figure shows the end-using sectors on the left and the energy supplying sectors<br />
on the right. The figure also shows the interactions between the two groups of sectors.<br />
Industry<br />
Household<br />
Figure 2: <strong>Energy</strong> flows between the different sectors included in the model.<br />
Figure 2: <strong>Energy</strong> flows between the different sectors included in the model.<br />
Electricity<br />
production<br />
District heating<br />
production<br />
Transport Biofuel<br />
production<br />
<strong>Energy</strong> end-using sectors <strong>Energy</strong> supply sectors<br />
Figure 2 illustrates only the energy that flows from one sector to another. It does not<br />
include use of energy carriers other than electricity, district heating and the biofuels DME,<br />
Synthetic Natural Gas (SNG) 6 and biogas.<br />
The technical pathways displayed in the scenario are to a great extent based on an analysis<br />
of attractive, feasible technical solutions found at present. This is perhaps most illustrative<br />
<strong>for</strong> the case of biofuels and this scenario‘s relatively heavy reliance on DME production in
ENERGY SCENARIO <strong>2050</strong> 24<br />
Figure 2 illustrates only the energy that flows from one sector to another. It does not include<br />
use of energy carriers other than electricity, district heating and the biofuels DME, Synthetic<br />
Natural Gas (SNG) 6 and biogas.<br />
The technical pathways displayed in the scenario are to a great extent based on an analysis<br />
of attractive, feasible technical solutions found at present. This is perhaps most illustrative<br />
<strong>for</strong> the case of biofuels and this scenario’s relatively heavy reliance on DME production in<br />
biorefineries. This is a technical route that combines keeping an existing industry (paper and<br />
pulp industry) and receiving a range of needed products <strong>for</strong> the energy system. The biorefineries<br />
will, apart from the pulp, also produce biofuels, electricity and heat, all of which have<br />
productive uses in the energy system. If other technology options emerge in the future that<br />
display similar efficiency in resource use, those can be applied. The focus on specific energy<br />
carriers, such as DME, should thus be interpreted as one route toward realizing the energy<br />
system <strong>for</strong> <strong>2050</strong>. This accounts <strong>for</strong> DME, FAME and ethanol, and the authors are well aware<br />
that new options will emerge.<br />
6 In this scenario SNG refers to a synthetic gas produced from renewable sources and is thus a renewable source; the mix is presented in section 3.2.5.2 The<br />
source <strong>for</strong> the gas used in transport sector.
3 Demand side in <strong>Sweden</strong><br />
ENERGY SCENARIO <strong>2050</strong> 25<br />
In this chapter the demand side of the energy system is presented, which includes background<br />
data and assessments of the changes towards <strong>2050</strong> required to meet the desired energy<br />
scenario in <strong>2050</strong>. The demand side is divided into the three sectors, i) industry, ii) transport<br />
and iii) household and service sector.<br />
3.1 The industry sector<br />
The yearly growth of the total energy use <strong>for</strong> each industry sub-sector 7 is reduced by 0.5%<br />
per year compared to the yearly growth used in the Swedish <strong>Energy</strong> Agency <strong>for</strong>ecast between<br />
2005 and 2030 (Energimyndigheten 2009) and (Lagerquist 2011). In the Swedish <strong>Energy</strong><br />
Agency <strong>for</strong>ecast only adopted policy instruments are included and in this scenario we<br />
assume that the pressure to increase energy efficiency will increase by e.g. new policy instruments.<br />
The same yearly change in energy demand <strong>for</strong> each sector between 2005 and 2030 is<br />
also used <strong>for</strong> 2030 to <strong>2050</strong>.<br />
A number of measures to reduce the use of fossil fuels in the industry sector are included in<br />
the scenario. The measures are about the same as in Gode et al. (2010):<br />
• The solid fossil fuels (except the coal used <strong>for</strong> processes in the steel industry – see<br />
below) are replaced by solid bioenergy.<br />
• Diesel, oil and liquefied petroleum gas (LPG) are assumed to be replaced by liquid biofuels<br />
produced in the biofuel sector. The biofuel used will depend on how research <strong>for</strong><br />
different biofuels develops. A biofuel must be chosen in order to per<strong>for</strong>m calculations<br />
<strong>for</strong> the scenarios in which biofuels will be used, and in this scenario dimethyl ether<br />
(DME) was selected as the biofuel used in industry. However, other biofuels may well<br />
dominate in the future.<br />
• Natural gas is assumed to be replaced by gaseous biofuels. In the calculations it is assumed<br />
that the gaseous biofuel is Synthetic Natural Gas (SNG). The SNG introduced<br />
in the scenario will have a renewable origin.<br />
• Some of the coal <strong>for</strong> the steel process is shifted to wood charcoal. The volume that<br />
could be replaced is described by McKinsey & Company (2008). They say that the<br />
coal could be replaced by natural gas. However, according to the research programme<br />
(ULCOS 2011) it will probably be possible to use wood charcoal in the steel-making<br />
process in the future. Even more of the coal could according to ULCOS be replaced by<br />
wood charcoal. As a consequence of limited access to biomass we assume that 45% of<br />
the coal and coke in the steel industry in <strong>2050</strong> can be replaced by bioenergy. This also<br />
affects the surplus coke gases used <strong>for</strong> electricity and heat production that partly will<br />
have renewable origin.<br />
7 Except <strong>for</strong> the pulp- and paper industry where the energy efficiency potentials are examined more carefully.
ENERGY SCENARIO <strong>2050</strong> 26<br />
Table 2 shows the implementation rate of the different measures to reduce fossil fuels. For all<br />
measures 100% means that all fossil fuels are replaced. All measures except the measure <strong>for</strong><br />
reducing coal and coke in the steel industry reach 100% to <strong>2050</strong>.<br />
Table 2: The implementation rate of the different categories of measures introduced<br />
in the industry sector to reduce the use of fossil fuels.<br />
Substitution of solid fossil fuels<br />
to solid bioenergy<br />
Substitution of oil with liquid bioenergy<br />
(e.g. DME)<br />
2005 2010 2020 2030 2040 <strong>2050</strong><br />
0% 0% 25% 50% 75% 100%<br />
0% 0% 25% 50% 75% 100%<br />
Substitution of natural gas with e.g. SNG 0% 0% 25% 50% 75% 100%<br />
Substitution of LPG with e.g. DME 0% 0% 25% 50% 75% 100%<br />
Direct reduction (coal and coke is<br />
replaced by charcoal from bioenergy)<br />
3.1.1 Pulp and paper industry<br />
0% 0% 0% 0% 0% 45%<br />
The pulp and paper industry in <strong>Sweden</strong> uses about half of the energy used in the industry<br />
sector. The pulp and paper industry is also a large user of bioenergy and has the potential to<br />
be an important producer of biofuels <strong>for</strong> the transport sector. There<strong>for</strong>e more careful examination<br />
of the future potentials of the pulp and paper industry was conducted in this report.<br />
In 2007, the baseline <strong>for</strong> the pulp and paper industry was a year with very high production<br />
(large global demand) and with high levels of available wood because of the storms “Gudrun”<br />
in 2005 and “Per” in 2007. The use of wood in <strong>Sweden</strong> in 2007 was far above the level of wood<br />
production in 2020-<strong>2050</strong> according to the WWF adjusted scenario. If the pulp and paper industry<br />
is to rely on wood from the Swedish <strong>for</strong>ests and the same imported volume of pulp<br />
wood as in 2007 the production volume of pulp has to decrease over the next two decades in<br />
order to ensure supply of feedstock <strong>for</strong> production of biofuel <strong>for</strong> the transport sector. During<br />
these decades the energy sector will use some of the biomass that is today used as pulp wood.<br />
In total this means that pulp production will decline by 1.1% per year to 2020 and 0.5% per<br />
year from 2020 to 2030. After that the industry can start to grow again because of increased<br />
wood availability in the <strong>for</strong>ests and reduced use of pulp wood <strong>for</strong> energy purposes. The increase<br />
is 0.5% per year from 2030 to 2040 and 0.80% per year from 2040 to <strong>2050</strong>.<br />
The statistics <strong>for</strong> 2007 from Wiberg (2007) were used <strong>for</strong> the pulp and paper industry and<br />
include specific details of the energy flows and production volumes. The historical average<br />
total specific energy efficiency improvement in kWh/ton produced paper and sold pulp was<br />
0.5% to 1% per year during the period 1979 to 2007. The lower number is according to (Skogsindustrierna<br />
2011) and the higher number from calculations based on Wiberg (2007).<br />
(Skogsindustrierna 2011) has the goal of improving the specific energy efficiency by 15% by<br />
2020. Based on this in<strong>for</strong>mation it is assumed that the future specific energy efficiency will<br />
improve by 1% per year (from 2007 to <strong>2050</strong>) <strong>for</strong> all parts of the pulp and paper industry except<br />
<strong>for</strong> the steam needed <strong>for</strong> the chemical pulp production.
ENERGY SCENARIO <strong>2050</strong> 27<br />
The specific steam needed per ton chemical pulp is assumed to fall by 1.7% per year. The best<br />
available technology in the future <strong>for</strong> chemical pulp production is a steam demand of 7 GJ<br />
per ton pulp produced <strong>for</strong> a pulp production not integrated with paper production according<br />
to Alv<strong>for</strong>s et al. (2010). The average steam demand in chemical pulp production not integrated<br />
with paper production in 2007 is 14.6 GJ/ton 8 pulp produced. A reduction from 14.6 GJ/<br />
ton in 2007 to 7 GJ/ton in <strong>2050</strong> results in a specific energy efficiency improvement of 1.7%<br />
per year. The same specific energy efficiency improvement is assumed <strong>for</strong> the chemical pulp<br />
production integrated with paper production. In these industries steam demand decreases<br />
from 19.0 GJ/ton (an average Swedish integrated chemical pulp mill according to (Alv<strong>for</strong>s et<br />
al. 2010) to 9.1 GJ/ton in <strong>2050</strong>. 1.7% per year in specific energy efficiency improvement is a<br />
very high rate. It could be compared with the average value <strong>for</strong> steam demand between 1979<br />
and 2007 of 0.6% per year (Wiberg 2007).<br />
Decreased steam demand results in oversupply of black liquor and bark in the chemical pulp<br />
mills. These fuels are difficult and expensive to transport to e.g. district heating plants. There<br />
are examples already today where there is an excess of bark and the bark is then used <strong>for</strong><br />
electricity production in condensing mode or used <strong>for</strong> producing pellets (which are more<br />
economical to transport). There are different pathways in which the pulp and paper industry<br />
could develop to improve the output from the surplus black liquor and bark, some of which<br />
are described in (Jönsson and Algehed 2009). Two of the most probable developments in<br />
the long term are increased electricity production and DME-production respectively. These<br />
two pathways are examined in Grahn et al (2010). The mill could either build a new recovery<br />
boiler with higher steam data that will increase the electricity production or it could build a<br />
new recovery boiler that integrates DME-production. Electricity and DME-production per<strong>for</strong>mance<br />
will depend on steam demand; refer to Alv<strong>for</strong>s et al. (2010) <strong>for</strong> further in<strong>for</strong>mation.<br />
The black liquor production per ton pulp produced (5.84 MWh per ton pulp) in the example<br />
mill illustrated in Alv<strong>for</strong>s et al. (2010) is higher than in the statistics by Wiberg (2007), (4.80<br />
MWh per ton pulp). To be able to use the example by Alv<strong>for</strong>s et al. (2010) black liquor production<br />
per ton pulp has been reduced by 18%. Electricity and DME-production per ton pulp in<br />
that example have been reduced by the same factor. However, bark production has been increased<br />
by 24% to include other wood residuals and to fit with the energy statistics in Wiberg<br />
(2007) from 0.66 to 0.82 MWh per ton pulp.<br />
The implementation rate of recovery boilers <strong>for</strong> increased electricity production and DME<br />
production is described in Table 3.<br />
8 The calculation is based on Wiberg (2007) with 90% efficiency in steam generation.
Table 3: Share of black liquor used in recovery boilers<br />
Share of the black liquor used in new<br />
recovery boilers <strong>for</strong> DME-production<br />
Share of the black liquor used in new<br />
recovery boilers <strong>for</strong> high electricity<br />
production<br />
ENERGY SCENARIO <strong>2050</strong> 28<br />
2007 2010 2020 2030 2040 <strong>2050</strong><br />
0% 0% 10% 40% 70% 90%<br />
0% 0% 10% 10% 10% 10%<br />
The electricity and black liquor use <strong>for</strong> DME production is allocated to the biofuel production<br />
sector. Black liquor and bark used <strong>for</strong> electricity production are allocated to the electricity<br />
production sector.<br />
3.1.1.1 Wood available from <strong>for</strong>ests<br />
The Swedish Forest Agency (Skogsstyrelsen 2008b) has created scenarios <strong>for</strong> future available<br />
wood from <strong>for</strong>ests. Their <strong>for</strong>ecasts are presented along with an adjusted WWF scenario in<br />
Table 4. These calculations assume positive growth responses in Swedish <strong>for</strong>ests due to climate<br />
change. However, due to projection difficulties, no account has been taken of possible<br />
increases in <strong>for</strong>est damage resulting from e.g. pests, storms and fires. Hence, volume availability<br />
may prove to be overestimations. WWF’s adjusted scenario (WWF 2011) has reduced<br />
round wood availability compared to the SKA-08 environmental scenario 9 , by assuming a<br />
further increase in protected areas by 3.5% and another 7.5% of the total area to be used as<br />
continuous cover <strong>for</strong>estry. Continuous cover <strong>for</strong>estry is assumed to reduce the availability<br />
of round wood volume on average by 35% (optimistic 15%, pessimistic 40%). In total, the<br />
reduced round wood volume is 5.75% compared to the SKA-08 environment scenario (Skogsstyrelsen<br />
2008b).<br />
9 The SKA-08 environmental scenario is an interpretation made by the Swedish Forest Agency on what will be needed to fulfill the environmental objectives<br />
adopted by the Swedish Parliament.
Table 4: Biomass output from <strong>for</strong>ests based on different management regimes (Million cubic<br />
meters standing volume incl. bark, Mm 3 sk)<br />
ENERGY SCENARIO <strong>2050</strong> 29<br />
2010-2019 2020-2029 2030-2039 2040-2049 <strong>2050</strong>-2059<br />
Reference scenario<br />
(Skogsstyrelsen 2008b)<br />
91 88 90 95 102<br />
Production scenario<br />
(Skogsstyrelsen 2008b)<br />
91 90 95 104 115<br />
Environment scenario<br />
(Skogsstyrelsen 2008b)<br />
85 84 85 88 96<br />
Environment + production scenario<br />
(Skogsstyrelsen 2008b)<br />
85 85 89 98 107<br />
WWF adjusted scenario 81 79 79 83 89<br />
The scenarios in Table 4 above describe the potentials in 10-year-intervals, 2010-19, 2020-<br />
2029 etc. However, the potentials in 2020, 2030, etc. have to be calculated as the average<br />
of the potentials in the 10-year interval be<strong>for</strong>e and after the actual year. For example, to<br />
calculate the potential in 2020 the average of the potentials <strong>for</strong> 2010-2019 and 2020-2029 is<br />
calculated. The recalculated potentials are presented in Table 5. The potentials discussed and<br />
assessed in dialogues with WWF are used in the project.<br />
Table 5: Recalculated potentials of biomass output from <strong>for</strong>ests based on different management<br />
regimes (Million cubic meters standing volume incl. bark, Mm 3 sk)<br />
2020 2030 2040 <strong>2050</strong><br />
Reference scenario 89 89 93 99<br />
Production scenario 90 93 100 110<br />
Environment scenario 85 84 87 92<br />
Environment + production scenario 85 87 93 102<br />
WWF adjusted scenario 80 79 81 86<br />
The scenario potential can be divided into different categories of available fractions according<br />
to historical values. Table 6: The shares saw timber and pulp wood of net felling are averages<br />
from 2004 to 2009 according to Swedish Forest Agency (Skogsstyrelsen 2010). Net<br />
wood felling in Mm3sk is the WWF potentials.Table 6 shows the share of each fraction of the<br />
available wood.
ENERGY SCENARIO <strong>2050</strong> 30<br />
Table 6: The shares saw timber and pulp wood of net felling are averages from 2004 to 2009 according<br />
to Swedish Forest Agency (Skogsstyrelsen 2010). Net wood felling in Mm 3 sk is the WWF<br />
potentials.<br />
2020 2030 2040 <strong>2050</strong><br />
Net wood felling (Mm 3 sk) 79.9 79.2 81.1 86.2<br />
Net wood felling (Mm 3 fub) 66.6 66.0 67.6 71.9<br />
whereof saw timber (Mm 3 fub) 33.0 32.7 33.6 35.9<br />
whereof pulp wood (Mm 3 fub) 27.2 26.9 27.6 29.5<br />
whereof wood <strong>for</strong> domestic energy use (Mm 3 fub) 5.9 5.9 5.9 5.9<br />
whereof other (Mm 3 fub) 0.5 0.5 0.5 0.5<br />
Mm 3 sk = million m 3 standing volume incl. bark<br />
Mm 3 fub = million m 3 solid volume under bark<br />
50% of the saw timber used in the saw mills becomes by-products (Skogsstyrelsen 2007a).<br />
2/3 of the by-products are used in the pulp and paper industry and 1/3 is used <strong>for</strong> heat and<br />
electricity production (Skogsstyrelsen 2007a).<br />
3.2 The transport sector<br />
The transport sector uses mainly fossil energy in satisfying existing energy demands. There<br />
are a range of alternatives to fossil fuels, many of which can be used in already existing<br />
technology and infrastructure. The transport sector is divided into goods transport, and passenger<br />
transport. Another division is made between short and long distance transport/journeys.<br />
A short distance transport/journey is less than 100 km.<br />
3.2.1 Goods transport<br />
3.2.1.1 Activity data<br />
Wikström et al. (2009) have made <strong>for</strong>ecasts of goods transported in <strong>Sweden</strong> up to 2020. According<br />
to their scenario “<strong>Energy</strong> efficient-scenario - investment” road transport tkm will<br />
increase by 0.74% per year between 2006 and 2020. The corresponding level <strong>for</strong> rail transport<br />
is 1.92% per year (Wikström et al. 2009). The inland transport with shipping is difficult to<br />
measure. However, statistics show that 8 billion tkm were produced during 2005 by domestic<br />
shipping (SIKA 2009b). Assuming domestic shipping to be constant the total activity<br />
increase in goods transport in <strong>Sweden</strong> measured in tkm is 1.04% per year from 2005 to 2020.<br />
It is difficult to reduce the growth in transport work. However, a reduction of the need of<br />
goods transport will be necessary to limit the increasing energy need <strong>for</strong> transport. There<br />
are methods and technologies to reduce the need of transport and with strong policy instruments<br />
growth in transport may be slowed down. In the scenario IVL has assumed that the<br />
growth rate of 1.04% per year as described above is reduced to half. A yearly growth of 0.52%<br />
is assumed to be valid <strong>for</strong> the whole period 2006 to <strong>2050</strong>.<br />
For road transport the km driven by lorries increase more rapidly than the transported volume<br />
in tkm (Wikström et al. 2009). This is explained by larger growth in distribution lorries<br />
than in long distance road transport. In the scenario it is assumed that policies are intro-
ENERGY SCENARIO <strong>2050</strong> 31<br />
duced so that driven distances increase at the same pace as the transported volume measured<br />
in tkm. Table 7 shows the <strong>for</strong>ecast by Wikström et al. (2009) and the transport volumes<br />
in the scenario. The volume of transported goods is larger in Wikström et al. (2009) than in<br />
SIKA (2009). In the scenario the volume is based on SIKA (2009) and the discussion about<br />
growth rate is based on Wikström et al. (2009).<br />
Table 7: Transport volumes categorized by transport option in Wikström et al. (2009),<br />
SIKA (2009b) and the IVL scenario assumptions<br />
Transported goods (billion<br />
tkm)<br />
Growth per year compared<br />
to the preceding column<br />
(Wikström<br />
et al . 2009)<br />
(SIKA<br />
2009b) IVL assumptions<br />
2006 2020 2005 2010 2020 2030 2040 <strong>2050</strong><br />
74 85 68 70 74 78 82 86<br />
1.04% 0.52% 0.52% 0.52% 0.52% 0.52%<br />
Transport share:<br />
Rail transport 30% 34% 31.8% 33.1% 33.4% 38.5% 44.0% 48.6%<br />
Road transport 59% 57% 56.5% 55.6% 55.4% 50.4% 44.9% 40.0%<br />
Domestic shipping 11%* 9%* 11.7% 11.1% 11.1% 11.0% 11.0% 11.3%<br />
Domestic air 0.1%** 0.1%** 0.1%** 0.1% 0.1% 0.1% 0.1% 0.1%<br />
* The numbers <strong>for</strong> shipping in Wikström et al (2009) include all shipping to and from <strong>Sweden</strong> including international transport. There<strong>for</strong>e the figures <strong>for</strong> domestic shipping<br />
from SIKA (2009) <strong>for</strong> 2005 are used.<br />
In the reference scenario domestic is assumed to be constant measured in tkm even if total goods transport grows.<br />
** The figures <strong>for</strong> air transport are not included in Wikström et al (2009) or SIKA (2009). The values are calculated<br />
based on energy use statistics in Swedish <strong>Energy</strong> Agency (Energimyndigheten 2010c) and on IVL assumptions.<br />
In the scenario the share of national shipping is constant even if it was assumed that the volume<br />
of transported tkm by domestic shipping was constant in the calculation of total transported<br />
volume, the reason being that policies will be introduced to en<strong>for</strong>ce energy-efficient<br />
domestic shipping.<br />
3.2.1.2 Transport work efficiency (Wh/tkm)<br />
Transport work efficiency is operationalised in the model through the variable energy per<br />
tkm (Wh/tkm). The development of energy efficiency in goods transport work is shown in<br />
Table 8.<br />
Table 8: <strong>Energy</strong> efficiency <strong>for</strong> goods transport (Wh/tkm)<br />
2005 2010 2020 2030 2040 <strong>2050</strong><br />
Rail 53 51 46 41 37 34<br />
Lorries 667 638 584 534 489 448<br />
Domestic shipping 50 48 43 39 35 32<br />
Domestic air 1 064 1 012 915 828 749 677<br />
The energy efficiencies <strong>for</strong> 2005 (except <strong>for</strong> domestic shipping) are calculated by combining<br />
the data from SIKA (2009b) <strong>for</strong> tkm transported and from Swedish <strong>Energy</strong> Agency (Energimyndigheten<br />
2010c) <strong>for</strong> energy use per transport category. The report by Transport Analysis<br />
(Trafikanalys 2010) is used <strong>for</strong> energy use in the rail sector. The methodology used by the
ENERGY SCENARIO <strong>2050</strong> 32<br />
Swedish <strong>Energy</strong> Agency to calculate energy use is based on personal and goods transport by<br />
registered vehicles and not all vehicles. This may result in numbers that are too low <strong>for</strong> the<br />
energy efficiency levels used.<br />
The energy efficiency <strong>for</strong> domestic shipping could be calculated from the same sources of in<strong>for</strong>mation<br />
as above. However, according to Erik Fridell (pers com Fridell 2011) the statistics<br />
<strong>for</strong> domestic shipping are of very bad quality. The domestic shipping energy efficiency values<br />
<strong>for</strong> 2005 come from Åkerman et al. (2007).<br />
The energy efficiency <strong>for</strong> goods transport by road (percentage reduced energy need per tkm)<br />
up until <strong>2050</strong> is based on (Löfgren and Wänn 2009) and reduce energy need per tkm by 30%<br />
<strong>for</strong> long distance transport and 40% <strong>for</strong> short distance transport up to 2040. This gives a<br />
yearly reduction of 0.9%. This corresponds with the assumptions made by Åkerman et al.<br />
(2007). The energy efficiency improvement <strong>for</strong> the other categories is assumed by IVL to be<br />
1% per year.<br />
3.2.1.3 Railway goods transport – energy carriers<br />
Share of tkm per<strong>for</strong>med by different energy carriers <strong>for</strong> railway goods transport is found<br />
in Table 9. Electricity is the major energy carrier used. However, other energy carriers are<br />
needed where rail routes are not electrified.<br />
Table 9: Share of goods transported by rail by different energy carriers<br />
2005 2010 2020 2030 2040 <strong>2050</strong><br />
Transported goods (billion<br />
tkm)<br />
22 23 25 30 36 42<br />
Electricity 84% 84% 86% 88% 90% 92%<br />
Diesel 16% 16% 12% 8% 4% 0%<br />
Gas* 0% 0% 2% 4% 6% 8%<br />
* The share of gas that has fossil and renewable origin respectively can be found in section 3.2.5.2.<br />
The figures <strong>for</strong> 2005 are based on data by Transport Analysis (Trafikanalys 2010). The numbers<br />
<strong>for</strong> 2010 to <strong>2050</strong> are estimations made by IVL.<br />
3.2.1.4 Road goods transport – energy carriers<br />
The required energy <strong>for</strong> road transports differs between long and short-distance journeys.<br />
The boundary between long and short distance is generally set at 100 km (see <strong>for</strong> example<br />
Åkerman et al. 2000; Åkerman and Höjer 2006). From a general point of view the energy requirements<br />
<strong>for</strong> long-distance road goods transports are lower than <strong>for</strong> short distance travels.<br />
The share of tkm per<strong>for</strong>med by different energy carriers <strong>for</strong> short distance goods transport<br />
on roads is found in Table 10.
ENERGY SCENARIO <strong>2050</strong> 33<br />
Table 10: Goods transported and share of tkm per<strong>for</strong>med by different energy carriers <strong>for</strong> goods<br />
transport on roads (short distance)<br />
2005 2010 2020 2030 2040 <strong>2050</strong><br />
Transported goods (billion tkm) 7 8 8 8 7 7<br />
Electricity 0% 0% 5% 20% 35% 50%<br />
Petrol 9% 9% 5% 3% 0% 0%<br />
Diesel 91% 91% 79% 52% 25% 0%<br />
Biofuels, e.g. ethanol 0% 0% 0% 0% 0% 0%<br />
Gas* 0% 0% 3% 10% 20% 30%<br />
Biofuels, e.g. FAME 0% 0% 3% 5% 5% 0%<br />
Biofuels, e.g. DME 0% 0% 5% 10% 15% 20%<br />
* The share of gas that has fossil and renewable origin respectively can be found in section 3.2.5.2.<br />
The share of tkm per<strong>for</strong>med by different energy carriers <strong>for</strong> long distance goods transport on<br />
roads is found in Table 11.<br />
Table 11: Goods transported and share of tkm per<strong>for</strong>med by different energy carriers <strong>for</strong> goods<br />
transport on roads (long distance)<br />
2005 2010 2020 2030 2040 <strong>2050</strong><br />
Transported goods (billion tkm) 31 31 33 32 30 28<br />
Electricity 0% 0% 0% 0% 0% 0%<br />
Petrol 9% 9% 5% 3% 0% 0%<br />
Diesel 91% 91% 85% 63% 29% 0%<br />
Biofuels, e.g. ethanol 0% 0% 0% 0% 0% 0%<br />
Gas* 0% 0% 2% 4% 6% 10%<br />
Biofuels, e.g. FAME 0% 0% 3% 5% 5% 0%<br />
Biofuels, e.g. DME 0% 0% 5% 25% 60% 90%<br />
* The share of gas that has fossil and renewable origin respectively can be found in section 3.2.5.2.<br />
The figures <strong>for</strong> 2005 were only calculated <strong>for</strong> the sum of the short and long distance transport<br />
by road. These figures are based on Swedish <strong>Energy</strong> Agency (Energimyndigheten 2010c). The<br />
figures <strong>for</strong> 2010 to <strong>2050</strong> are estimates by IVL. Electricity is assumed to be easier to implement<br />
in short distance goods transport by road than in long distance where biofuels such as<br />
DME will be the alternative to fossil fuels.<br />
3.2.1.5 Domestic shipping goods transport<br />
Table 12 shows the share of tkm per<strong>for</strong>med by different energy carriers <strong>for</strong> goods transport<br />
by domestic shipping. The energy required per tkm <strong>for</strong> shipping is generally the lowest of<br />
all types of transport means even though rail transport can come close <strong>for</strong> certain types of<br />
journey.
Table 12: Goods transported and share of tkm per<strong>for</strong>med by different energy carriers<br />
<strong>for</strong> domestic shipping<br />
ENERGY SCENARIO <strong>2050</strong> 34<br />
2005 2010 2020 2030 2040 <strong>2050</strong><br />
Transported goods (billion tkm) 8 8 8 9 9 10<br />
EO1 (low content of sulphur) 22% 22% 37% 49% 52% 0%<br />
EO2-5 (different degree of sulphur content) 78% 78% 63% 31% 8% 0%<br />
Biofuel, e.g. DME 0% 0% 0% 20% 40% 100%<br />
The shares <strong>for</strong> 2005 were calculated by the Swedish <strong>Energy</strong> Agency (Energimyndigheten<br />
2010c). The numbers <strong>for</strong> 2010 to <strong>2050</strong> are estimates by IVL.<br />
3.2.1.6 Domestic goods transport by air<br />
Domestic transport of goods by air is included in the scenario. Aviation fuel makes a transition<br />
from kerosene to DME during the period 2010 to <strong>2050</strong>. The numbers presented in Table<br />
13 are assessed by IVL.<br />
Table 13: Goods transported and share of tkm per<strong>for</strong>med by different energy carriers<br />
<strong>for</strong> goods transport by domestic air transports<br />
2005 2010 2020 2030 2040 <strong>2050</strong><br />
Transported goods (billion tkm) 0.1 0.1 0.1 0.1 0.1 0.1<br />
Kerosene 100% 100% 100% 70% 50% 0%<br />
Biofuels, e.g. DME 0% 0% 0% 30% 50% 100%<br />
3.2.2 Passenger transport<br />
3.2.2.1 Activity data<br />
Löfgren and Yngström-Wänn (2009) have made <strong>for</strong>ecasts of passenger transport in <strong>Sweden</strong><br />
to 2020 and to 2040. In their <strong>for</strong>ecast the increase between 2006 and 2020 is 0.97% per year<br />
and between 2020 and 2040 the increase is 0.95%. This scenario assumes that the growth is<br />
0.49% per year <strong>for</strong> the period 2006 to 2020 and 0.48% per year <strong>for</strong> the period 2020 to 2040.<br />
The annual growth between 2020 and 2040 is assumed to be the same between 2040 and<br />
<strong>2050</strong>. The reduced increase in the growth rate of passenger transportation is largely due<br />
to the high penetration of In<strong>for</strong>mation and Communication Technology (ICT). Ecofys and<br />
WWF judge that this has great potential <strong>for</strong> reducing the need <strong>for</strong> personal transport (Ecofys<br />
and WWF 2008).<br />
The transported volumes and the shares between different transport categories differ between<br />
Löfgren and Yngström-Wänn (2009) and SIKA (2009b) <strong>for</strong> 2005/2006. Löfgren and<br />
Yngström-Wänn (2009) include less travelling, but a larger share of rail transport. In this<br />
report we have based the scenarios on the transported volumes in SIKA (2009b) <strong>for</strong> the year<br />
2005.<br />
In the scenario IVL has assumed that high-speed rail transport grows as well as metro and<br />
tram. This decreases the share of people transported by car. The other transporting categories<br />
are assumed to be fairly constant.
Table 14: Personal transport volumes divided on transport option in Wikström et al. (2009),<br />
SIKA (2009b) and the IVL scenario assumptions<br />
Total transport of people<br />
(billion pkm)<br />
Yearly growth of personal<br />
transports (pkm)<br />
(Löfgren and<br />
Yngström-Wänn 2009)<br />
ENERGY SCENARIO <strong>2050</strong> 35<br />
(SIKA<br />
2009b) IVL assumptions<br />
2006 2020 2040 2005 2010 2020 2030 2040 <strong>2050</strong><br />
112 128 155 126 130 136 143 149 157<br />
0.97% 0.95% 1.0% 0.49% 0.49% 0.48% 0.48% 0.48%<br />
Transport share:<br />
Rail 9% 12% 12% 7.1% 7.8% 9.2% 12.1% 15.5% 18.2%<br />
Metro, tram and other<br />
tracks<br />
4% 5% 4% 1.6% 1.7% 1.7% 2.6% 3.9% 4.5%<br />
Cars 71% 70% 70% 77.0% 77.2% 76.3% 72.4% 66.4% 62.5%<br />
Buses 9% 8% 8% 6.9% 6.7% 6.1% 6.2% 6.8% 7.0%<br />
Shipping 0.6% 0.7% 0.6% 0.6% 0.7% 0.7%<br />
Air 3% 2% 2% 2.6% 2.6% 2.4% 2.4% 2.6% 2.6%<br />
Walking, cycling 3% 3% 3% 3.5% 3.5% 3.6% 3.7% 4.2% 4.4%<br />
3.2.2.2 Passenger transport work efficiency (Wh/pkm)<br />
Transport work efficiency is operationalised in the model through the variable energy per<br />
person kilometre (Wh/pkm). The development of energy efficiency in personal transportation<br />
work is presented in Table 15.<br />
Table 15: <strong>Energy</strong> efficiency <strong>for</strong> passenger transport (Wh/pkm)<br />
2005 2010 2020 2030 2040 <strong>2050</strong><br />
Rail 127 121 109 99 89 81<br />
Car 498 456 383 321 268 225<br />
Bus 280 256 215 193 173 155<br />
Metro and tram 123 117 106 96 87 78<br />
Domestic ferries 1 435 1 365 1 234 1 116 1 010 913<br />
Domestic air 793 750 672 601 538 482<br />
The energy efficiency improvement presented in Table 15 does not include the end-use efficiency<br />
of converting the vehicles from fuels to electricity. This improvement is added to the<br />
model afterwards.<br />
The figures <strong>for</strong> 2005 are in most cases based on statistics in <strong>Sweden</strong>. <strong>Energy</strong> use in different<br />
sub-sectors of the transport sector was collected from Swedish <strong>Energy</strong> Agency (2010c). Statistics<br />
from SIKA (2009b) were used <strong>for</strong> pkm travelled. The division into sub-categories is not<br />
exactly the same in the two sources, there<strong>for</strong>e some of the efficiencies are a little uncertain.<br />
Efficiency improvement potentials <strong>for</strong> cars are estimated at 45% between 2005 and 2040<br />
(Löfgren and Yngström-Wänn 2009) excluding the energy efficiency improvement by converting<br />
from fuels to electricity. That reduction is extrapolated to <strong>2050</strong> and reaches 55% com-
ENERGY SCENARIO <strong>2050</strong> 36<br />
pared to 2005. The yearly energy efficiency improvement from 2005 to <strong>2050</strong> is between 1.7<br />
and 1.8% per year. Åkerman et al. (2007) and Deng et al. (2011) assume even higher energy<br />
efficiency rates in their scenarios.<br />
The efficiency improvement when driving on electricity instead of fossil fuels is assumed to<br />
be a factor 3 <strong>for</strong> petrol and 2.5 <strong>for</strong> diesel which means that a car running on electricity only<br />
uses one third of the end use energy of a car using petrol (Energimyndigheten 2009). The<br />
improvement is very difficult to estimate. Åkerman et al. (2007) estimate the improvement<br />
level to increase by a factor of around 2, while assuming a higher efficiency level <strong>for</strong> fueldriven<br />
cars than that assumed by this report. The per<strong>for</strong>mance of electric cars is probably<br />
then about the same in Åkerman et al. (2007) and in this report.<br />
Buses are assumed to have an efficiency improvement of 1.7% per year between 2005 and<br />
2020, and an efficiency improvement of 1.1% per year between 2020 and <strong>2050</strong>. This corresponds<br />
to efficiency levels <strong>for</strong> lorries. However, buses have a larger share of short distance<br />
travel and the yearly improvement is there<strong>for</strong>e larger <strong>for</strong> buses than lorries.<br />
Domestic air has an efficiency improvement of 1.1% per year which correspond to the 40%<br />
reduction between 2005 and <strong>2050</strong> as projected by Åkerman and Höjer (2006). Deng et al.<br />
(2011) use 50% reduction.<br />
The other categories are assumed to have an efficiency improvement of 1% per year between<br />
2005 and <strong>2050</strong>.<br />
3.2.2.3 Railway passenger transport – energy carriers<br />
The share of pkm per<strong>for</strong>med by different energy carriers <strong>for</strong> rail passenger transport is found<br />
in Table 16. Electricity is most common. However, some traffic takes place on non-electrified<br />
routes and there<strong>for</strong>e other energy carriers are needed.<br />
Table 16: Passengers transported and share of pkm per<strong>for</strong>med by different energy carriers<br />
2005 2010 2020 2030 2040 <strong>2050</strong><br />
Passengers (billion pkm) 9 10 12 17 23 28<br />
Electricity 95% 95% 95% 95% 95% 96%<br />
Diesel 5% 5% 4% 2% 1% 0%<br />
Gas* 0% 0% 1% 3% 4% 4%<br />
* The respective shares of the gas with fossil and renewable origins can be found in section 3.2.5.2.<br />
The figures <strong>for</strong> 2005 are based on data by Transport Analysis (Trafikanalys 2010). The figures<br />
<strong>for</strong> 2010 to <strong>2050</strong> are estimations made by IVL. Rail passenger transport is to a high degree<br />
based on electricity already today. The rate is assumed to increase a little up to <strong>2050</strong>. The<br />
larger change from today to <strong>2050</strong> is the fuel switch from diesel to gas (e.g. biogas and SNG).<br />
3.2.2.4 Cars – energy carriers<br />
A relatively large share of all person transport is made by car, more than 75% (Table 14). It is<br />
a challenge to make shifts towards more efficient technologies that are mainly represented<br />
in the scenario by plug-in hybrids. Pure electrical cars are assumed to have limited potential
ENERGY SCENARIO <strong>2050</strong> 37<br />
of becoming an attractive solution <strong>for</strong> long distance travel. The share of energy carriers <strong>for</strong><br />
short distance car travels is found in Table 17.<br />
Table 17: People transported by car and the share of pkm per<strong>for</strong>med by different energy carriers<br />
(short distance)<br />
2005 2010 2020 2030 2040 <strong>2050</strong><br />
Passengers (billion pkm) 81 82 85 84 79 77<br />
Electricity 0% 0% 15% 60% 80% 90%<br />
Petrol 90% 90% 35% 5% 0% 0%<br />
Diesel 9% 9% 40% 20% 5% 0%<br />
Biofuels, e.g. ethanol 0% 0% 5% 5% 0% 0%<br />
Gas* 1% 1% 5% 10% 15% 10%<br />
Biofuels, e.g. FAME 0% 0% 0% 0% 0% 0%<br />
Biofuels, e.g. DME 0% 0% 0% 0% 0% 0%<br />
* The respective shares of the gas with fossil and renewable origins can be found in section 3.2.5.2.<br />
The shares of energy carriers <strong>for</strong> long distance car travels are found in Table 18.<br />
Table 18: People transported by car and share of pkm per<strong>for</strong>med by different energy carriers <strong>for</strong><br />
people transported by car (long distance)<br />
2005 2010 2020 2030 2040 <strong>2050</strong><br />
Passengers (billion pkm) 17 18 19 19 20 21<br />
Electricity 0% 0% 0% 10% 15% 20%<br />
Petrol 90% 90% 30% 15% 0% 0%<br />
Diesel 9% 9% 60% 45% 35% 0%<br />
Biofuels, e.g. ethanol 0% 0% 5% 5% 0% 0%<br />
Gas* 1% 1% 5% 10% 10% 10%<br />
Biofuels, e.g. FAME 0% 0% 0% 0% 0% 0%<br />
Biofuels, e.g. DME 0% 0% 0% 15% 40% 70%<br />
* The share of gas that has fossil and renewable origin respectively can be found in section 3.2.5.2.<br />
The transport share of pkm by cars <strong>for</strong> different energy carriers is assumed to be equal <strong>for</strong><br />
short and long distance travel in 2005. The figures <strong>for</strong> 2005 were calculated by using Swedish<br />
<strong>Energy</strong> Agency statistics (Energimyndigheten 2010c). The potential <strong>for</strong> implementing<br />
electric cars and plug-in-hybrids is much greater <strong>for</strong> short distance traffic. Long distance car<br />
travel depends to a larger degree on biofuels, e.g. DME and to some extent gas. The figures<br />
<strong>for</strong> 2010 to <strong>2050</strong> are assumed by IVL.<br />
In 2005 the number of short distance travel was about 5 times as large as long distance travel<br />
measured in pkm.<br />
3.2.2.5 Metro and tram – energy carriers<br />
Metros and trams only use electricity per definition.
ENERGY SCENARIO <strong>2050</strong> 38<br />
3.2.2.6 Buses – energy carriers<br />
Shares of pkm per<strong>for</strong>med by different energy carriers <strong>for</strong> passenger transport by bus are<br />
shown in Table 19.<br />
Table 19: Passengers and share of pkm per<strong>for</strong>med by different energy carriers<br />
<strong>for</strong> passenger transport by bus<br />
2005 2010 2020 2030 2040 <strong>2050</strong><br />
Passengers (billion pkm) 9 9 8 9 10 11<br />
Electricity 0% 0% 0% 5% 8% 10%<br />
Diesel 100% 100% 90% 70% 42% 0%<br />
Biofuels, e.g. ethanol 0% 0% 5% 5% 0% 0%<br />
Gas* 0% 0% 5% 10% 25% 30%<br />
Biofuels, e.g. FAME 0% 0% 0% 0% 0% 0%<br />
Biofuels, e.g. DME 0% 0% 0% 10% 25% 60%<br />
* The share of gas that has fossil and renewable origin respectively can be found in section 3.2.5.2.<br />
The figures <strong>for</strong> 2005 were calculated from data from the Swedish <strong>Energy</strong> Agency (Energimyndigheten<br />
2010c). The figures <strong>for</strong> 2010 to <strong>2050</strong> are assumed by IVL. The assumptions are based<br />
on those <strong>for</strong> lorries. A minor proportion of pkm are powered by electricity in <strong>2050</strong> and the<br />
major proportion by biofuels, e.g. DME. However, the part driven by gas is assumed to be<br />
higher <strong>for</strong> buses due to more local traffic.<br />
3.2.2.7 Domestic shipping – energy carriers<br />
Ferries are found throughout <strong>Sweden</strong>. Today the energy carriers are generally either oil of<br />
the quality EO1 or EO2-5. During the period 2010 to <strong>2050</strong> a transition to biofuels, e.g. DME<br />
will be made <strong>for</strong> this whole sector.<br />
Table 20: Passengers and share of pkm per<strong>for</strong>med by different energy carriers <strong>for</strong> passenger transport<br />
by domestic shipping.<br />
2005 2010 2020 2030 2040 <strong>2050</strong><br />
Passengers (billion pkm) 0.8 0.8 0.9 0.9 1.1 1.2<br />
EO1 (low content of sulphur) 48% 48% 60% 65% 50% 0%<br />
EO2-5 (different degree of sulphur content) 52% 52% 40% 30% 0% 0%<br />
Biofuels, e.g. DME 0% 0% 0% 5% 50% 100%<br />
The figures <strong>for</strong> 2005 are based on data from the Swedish <strong>Energy</strong> Agency (Energimyndigheten<br />
2010c). The figures <strong>for</strong> 2010 to <strong>2050</strong> are assumed by IVL.<br />
3.2.2.8 Domestic passenger air travel<br />
Domestic passenger air travel is included in the scenario. Aviation fuel makes a transition<br />
from kerosene to DME during the period 2010 to <strong>2050</strong>.
Table 21: Passengers and share of pkm per<strong>for</strong>med by different energy carriers<br />
<strong>for</strong> passenger transport by air.<br />
ENERGY SCENARIO <strong>2050</strong> 39<br />
2005 2010 2020 2030 2040 <strong>2050</strong><br />
Passengers(billion pkm) 3.3 3.3 3.2 3.4 3.9 4.1<br />
Kerosene 100% 100% 100% 100% 70% 0%<br />
Biofuels, e.g. DME 0% 0% 0% 0% 30% 100%<br />
The numbers <strong>for</strong> 2005 are based on data from the Swedish <strong>Energy</strong> Agency (Energimyndigheten<br />
2010c). The numbers <strong>for</strong> 2010 to <strong>2050</strong> is assumed by IVL.<br />
3.2.3 Other transport<br />
In Swedish <strong>Energy</strong> Agency (Energimyndigheten 2010c) the energy needed <strong>for</strong> personal and<br />
goods transport <strong>for</strong> different transport categories are specified. However, there is a large<br />
part of the delivered energy to the transport sector that is not included in that specification.<br />
This is because the specified statistics in (Energimyndigheten 2010c) only include passenger<br />
and goods transport by registered vehicles and not all vehicles, and that not all transport<br />
can be divided into passenger and goods transport, e.g. working machines and leisure boats.<br />
The energy volume that is included in “other transport” as presented in Table 22 is the difference<br />
between delivered energy to the transport sector (Energimyndigheten 2010c) and the<br />
sum of the specified energy use <strong>for</strong> the different categories <strong>for</strong> passenger and goods transport<br />
above. The growth rate of energy use (excluding the final energy use savings from electrification)<br />
considers the same increase in the activity as <strong>for</strong> goods transport and assumes 1%<br />
energy efficiency improvement per year. The yearly growth in energy demand then decreases<br />
by about 0.5% per year during the period 2005 to <strong>2050</strong>.<br />
Table 22: <strong>Energy</strong> volumes linked to transport categorized as “other transport” and share of energy<br />
carriers linked to the transport work.<br />
2005 2010 2020 2030 2040 <strong>2050</strong><br />
Use of energy (TWh) 10 10 10 9 9 8<br />
Yearly growth in the use of energy 2.7% –0.5% –0.5% –0.5% –0.5% –0.5%<br />
Share of the energy needed covered by:<br />
Electricity 5% 5% 10% 20% 50% 50%<br />
Petrol 30% 30% 30% 0% 0% 0%<br />
Diesel 64% 64% 59% 70% 20% 0%<br />
EO1 (low content of sulphur) 1% 1% 1% 0% 0% 0%<br />
Biofuels, e.g. ethanol 0% 0% 0% 5% 5% 0%<br />
Gas* 0% 0% 0% 5% 10% 20%<br />
Biofuels, e.g. FAME 0% 0% 0% 0% 0% 0%<br />
Biofuels, e.g. DME 0% 0% 0% 0% 15% 30%<br />
* The share of gas that has fossil and renewable origin respectively can be found in section 3.2.5.2<br />
The shares of different energy carriers <strong>for</strong> 2005 in “other transport” are also determined<br />
according to the difference in the delivered energy to the transport sector according to (En-
ENERGY SCENARIO <strong>2050</strong> 40<br />
ergimyndigheten 2010c) and the sum of the specified energy use <strong>for</strong> personal and goods<br />
transport above. The shares <strong>for</strong> 2010 to <strong>2050</strong> are assumed by IVL.<br />
3.2.4 Transport in the household and service sector<br />
In Swedish energy statistics, e.g. (Energimyndigheten 2010a) some of the transport fuels<br />
are allocated to the household and service sector. These are fuels used e.g. in machines used<br />
<strong>for</strong> agriculture or <strong>for</strong>estry, in fishing boats, or at building sites (Nilsson 2011). The energy<br />
allocated to the transport sector is energy used <strong>for</strong> transport and not <strong>for</strong> other means. However,<br />
measures that are possible to implement <strong>for</strong> transport fuels used in the household and<br />
service sector are very similar to those in the transport sector. There<strong>for</strong>e these fuels are allocated<br />
to the transport sector in this report.<br />
The industrial sector also uses transport fuels <strong>for</strong> such things as transport at the industrial<br />
sites. These could have been allocated to the transport sector in this report. However, because<br />
it is more difficult to know which industrial sector fuels should be transferred to the<br />
transport sector, these fuels are treated in the industry sector.<br />
Table 23: <strong>Energy</strong> volumes linked to transport in the household and service sector<br />
and share of energy carriers linked to the transport work.<br />
2005 2010 2020 2030 2040 <strong>2050</strong><br />
Use of energy (TWh) 11 10 10 9 9 9<br />
Yearly growth in the use of energy -0.5% -0.5% -0.5% -0.5% -0.5%<br />
Share of the energy needed covered by:<br />
Electricity 0% 0% 2% 10% 20% 30%<br />
Petrol 0% 0% 0% 0% 0% 0%<br />
Diesel 100% 100% 85% 70% 45% 0%<br />
EO1 (low content of sulphur) 0% 0% 0% 0% 0% 0%<br />
Biofuels, e.g. ethanol 0% 0% 8% 10% 5% 0%<br />
Gas* 0% 0% 5% 10% 15% 15%<br />
Biofuels, e.g. FAME 0% 0% 0% 0% 0% 0%<br />
Biofuels, e.g. DME 0% 0% 0% 0% 15% 55%<br />
* The share of gas that has fossil and renewable origin respectively can be found in section 3.2.5.2<br />
The amount of transport fuel used in the household and service sector is calculated as the<br />
diesel oil in the household sector and service sector in Swedish <strong>Energy</strong> Agency (Energimyndigheten<br />
2010b) that is not specified in Swedish <strong>Energy</strong> Agency statistics <strong>for</strong> the subsectors<br />
detached houses (Energimyndigheten 2011c), apartments (Energimyndigheten 2011b),<br />
or non-residential premises (Energimyndigheten 2011a). The shares in 2010 to <strong>2050</strong> are assumed<br />
by IVL.
ENERGY SCENARIO <strong>2050</strong> 41<br />
3.2.5 Other parameters<br />
3.2.5.1 Low blending<br />
The blending of biofuels in diesel and petrol fuels <strong>for</strong> transport is done today to various<br />
degrees. As a result of the low blend a certain share of biofuels are found in the diesel and<br />
petrol categories in Table 16 to Table 23. The blending share <strong>for</strong> petrol and diesel is found in<br />
Table 24.<br />
Table 24: Input parameters in the model of low blend in petrol and diesel fuels<br />
2005 2010 2020 2030 2040 <strong>2050</strong><br />
Low blending of ethanol in petrol 3% 5% 10% 10% 10% n/a*<br />
Low blending of FAME in diesel 0.2% 5% 5% 5% 5% n/a*.<br />
* No fossil fuels used in <strong>2050</strong>.<br />
In 2005 a maximum of 5% biofuels mixed into petrol and diesel was permissible. This was<br />
changed to a maximum of 10% on May 1, 2011. IVL assumes that the higher level will be used<br />
<strong>for</strong> ethanol mixed into petrol. However, the FAME mix into diesel is assumed by IVL to remain<br />
at 5% because of an assumed limited supply of FAME in Europe.<br />
3.2.5.2 The source <strong>for</strong> the gas used in transport sector<br />
The gas used in the transport sector can have a range of origins. At present natural gas (fossil<br />
gas) and biogas are relatively common while the share of SNG with origins in renewable<br />
resources is zero. The transition towards exclusively renewable origins in the gas used in the<br />
transport sector is found in Table 25.<br />
Table 25: The source of gas in the transport sector<br />
2005 2010 2020 2030 2040 <strong>2050</strong><br />
Share of natural gas 55% 43% 25% 5% 2% 0%<br />
Share of biogas 45% 57% 60% 60% 40% 30%<br />
Share of SNG 0% 0% 15% 35% 58% 70%<br />
The shares of origins <strong>for</strong> the gas <strong>for</strong> 2005 are calculated from the statistics in Swedish <strong>Energy</strong><br />
Agency (Energimyndigheten 2010c). The shares <strong>for</strong> 2010 to <strong>2050</strong> are assumed by IVL. Natural<br />
gas declines, whereas biogas increases. After 2030 biogas is partially replaced by SNG (Synthetic<br />
Natural Gas) produced by the gasification of biomass.<br />
3.2.5.3 The source of the ethanol used in the transport sector<br />
The scenario does not opt <strong>for</strong> introducing ethanol on a broad scale. Production of ethanol<br />
from cellulosic raw material still needs development in order to reach a high level of total<br />
efficiency. If there are some technical breakthroughs this technology could prove important<br />
to support the transition towards a renewable energy system. Some ethanol remains in the<br />
scenario and the technologies to produce it will shift a little towards second-generation technologies;<br />
see Table 26.
Table 26: Technology generation to produce ethanol used in the scenario<br />
ENERGY SCENARIO <strong>2050</strong> 42<br />
2005 2010 2020 2030 2040 <strong>2050</strong><br />
1st generation 100% 100% 90% 75% 75% n/a.*<br />
2nd generation 0% 0% 10% 25% 25% n/a.*<br />
3.3 The household and service sector<br />
* No ethanol used in <strong>2050</strong>.<br />
The presentation of the household and service sector has been divided into activity data<br />
(use of space), energy efficiency (use of energy per square meter heated), and energy carriers<br />
used <strong>for</strong> heating. In addition, electricity consumption (not used <strong>for</strong> heating) is analysed<br />
separately. As is the case with the transport sector, the household and service sector also has<br />
a part of the energy supply that is not specified in detailed statistics and must there<strong>for</strong>e be<br />
treated as “Other energy use”.<br />
3.3.1 Activity data<br />
<strong>Energy</strong> demand in the household and service sector is operationalised in the model through<br />
a number of variables linked to heating and the space each person uses. The input variables<br />
are found in Table 27.<br />
Table 27: Activity data <strong>for</strong> detached houses, apartments and<br />
non-residential premises 2009, 2010-<strong>2050</strong>.<br />
Detached houses<br />
Apartments<br />
Non-residential<br />
premises<br />
2009 2010 2020 2030 2040 <strong>2050</strong><br />
millions m2 heated 272 273 284 296 309 322<br />
Increase in m2 heated 1.5% 0.4% 0.4% 0.4% 0.4% 0.4%<br />
m2 per person in <strong>Sweden</strong> 29 29 28 29 29 30<br />
millions m2 heated 173 174 183 193 203 214<br />
Increase in m2 heated -0.5% 0.1% 0.5% 0.5% 0.5% 0.5%<br />
m2 per person in <strong>Sweden</strong> 18 18 18 19 19 20<br />
millions m2 heated 134 135 142 150 158 166<br />
Increase in m2 heated -1.2% 0.1% 0.5% 0.5% 0.5% 0.5%<br />
m2 per person in <strong>Sweden</strong> 14 14 14 14 15 15<br />
The area heated will grow by about 0.5% per year as shown in Table 27. Growth is calculated<br />
based on the pace of new building and the pace of demolition as shown in Table 28, 29 and<br />
Table 30 below. The number of square meters grows more rapidly than the population increase<br />
in <strong>Sweden</strong> which results in larger areas per person in <strong>Sweden</strong>.
ENERGY SCENARIO <strong>2050</strong> 43<br />
3.3.2 Efficiency <strong>for</strong> space and tap water heating (kWh/m 2 )<br />
Operationalisation of energy efficiency improvement measures in housing and buildings is<br />
done in the model through the variable efficiency <strong>for</strong> space and tap water heating and this<br />
variable is measured in kWh/m 2 .<br />
For detached houses, apartments and non-residential premises the energy saved through<br />
renovation is calculated based on a 50% reduction of energy use (Boverket 2008) 10 and<br />
assumptions by IVL about the number of buildings rebuilt per decade. It is assumed that<br />
buildings are renovated every 40 years (Erlandsson and Levin 2005). In the model all existing<br />
buildings will there<strong>for</strong>e be renovated once between 2010 and <strong>2050</strong>. The Swedish <strong>Energy</strong><br />
Agency (Energimyndigheten 2011c) provides in<strong>for</strong>mation about energy per<strong>for</strong>mance<br />
<strong>for</strong> buildings renovated each decade. The pace of renovation is high. However, the historical<br />
proportion exceeds 2% per year (Deng et al. 2011).<br />
The pace of demolition is historically close to zero (SCB 2010). This may change in the future.<br />
However, it is assumed that the demolition rate will remain close to zero. Demolished houses<br />
are assumed by IVL to use 50% more than the average house 10 years earlier.<br />
3.3.2.1 Detached houses – background parameters<br />
The background parameters linked to the space and tap water heating <strong>for</strong> detached houses is<br />
found in Table 28.<br />
Table 28: Background parameters <strong>for</strong> space and tap water heating in detached houses<br />
2009 2010 2020 2030 2040 <strong>2050</strong><br />
<strong>Energy</strong> use in newly built stock kWh/m2 110 40 40 40 40<br />
<strong>Energy</strong> saved in rebuilt stock kWh/m2 98 88 86 77<br />
<strong>Energy</strong> use in demolished stock kWh/m2 234 233 199 165 132<br />
Pace of new building %/a 0.4% 0.4% 0.4% 0.4% 0.4% 0.4%<br />
Pace of rebuilding %/a n/a. n/a. 1.9% 2.2% 2.3% 2.5%<br />
Pace of demolition %/a 0.0% 0.0% 0.0% 0.0% 0.0% 0.0%<br />
The passive house standard <strong>for</strong> detached houses of 40 kWh/m 2 <strong>for</strong> heating and tap water is<br />
assumed to be reached in 2020 <strong>for</strong> new buildings. This level is assumed to remain the same<br />
up to <strong>2050</strong> even though further improvement can be expected.<br />
10 Deng et al (2011) assumes 60%. However, it can be assumed that buildings in <strong>Sweden</strong> have a higher per<strong>for</strong>mance than the current global average and the<br />
improvement potential in <strong>Sweden</strong> is there<strong>for</strong>e lower.
ENERGY SCENARIO <strong>2050</strong> 44<br />
3.3.2.2 Apartments – background parameters<br />
The background parameters linked to space and tap water heating <strong>for</strong> apartments are found<br />
in Table 29.<br />
Table 29: Background parameters <strong>for</strong> space and tap water heating in apartments houses<br />
2009 2010 2020 2030 2040 <strong>2050</strong><br />
<strong>Energy</strong> use in new built stock kWh/m2 110 35 35 35 35<br />
<strong>Energy</strong> saved in the rebuilt stock kWh/m2 78 75 72 70<br />
<strong>Energy</strong> use in demolished stock kWh/m 2 230 230 193 159 128<br />
Pace of new buildings %/a 0.6% 0.6% 0.6% 0.6% 0.6%<br />
Pace of rebuilding %/a n/a. n/a. 2.3% 2.3% 2.3% 2.1%<br />
Pace of demolition %/a 0.1% 0.1% 0.1% 0.1% 0.1% 0.1%<br />
The passive house standard <strong>for</strong> apartment buildings of 35 kWh/m 2 <strong>for</strong> heating and tap water<br />
is assumed to be reached in 2020 <strong>for</strong> new buildings. This level is assumed to remain the same<br />
up to <strong>2050</strong> even though further improvement can be expected.<br />
3.3.2.3 Non-residential premises – background parameters<br />
The background parameters linked to the space and tap water heating <strong>for</strong> non-residential<br />
premises are found in Table 30.<br />
Table 30: Background parameters <strong>for</strong> space and tap water heating in non-residential premises<br />
2009 2010 2020 2030 2040 <strong>2050</strong><br />
<strong>Energy</strong> use in new built stock kWh/m2 110 35 35 35 35<br />
<strong>Energy</strong> saved in the rebuilt<br />
stock<br />
kWh/m2 72 70 66 63<br />
<strong>Energy</strong> use in the demolished<br />
stock<br />
kWh/m2 215 215 205 171 145<br />
Pace of new buildings %/a 0.6% 0.6% 0.6% 0.6% 0.6% 0.6%<br />
Pace of rebuilding %/a n/a. n/a. 2.3% 2.0% 2.3% 2.4%<br />
Pace of demolition %/a 0.1% 0.1% 0.1% 0.1% 0.1% 0.1%<br />
The passive house standard <strong>for</strong> apartment houses of 35 kWh/m 2 <strong>for</strong> heating and tap water is<br />
assumed to apply to non-residential premises as well and is assumed to be reached in 2020<br />
<strong>for</strong> new buildings. This level is assumed to remain the same up to <strong>2050</strong> even though further<br />
improvement can be expected.
ENERGY SCENARIO <strong>2050</strong> 45<br />
3.3.2.4 Summary of energy efficiency improvements <strong>for</strong> space and tap water heating<br />
Table 31 shows a summary of the pace of change in energy efficiency linked to heating and<br />
tap water heating in detached houses, apartments and non-residential premises.<br />
Table 31: Summary <strong>Energy</strong> efficiency improvements <strong>for</strong> space and tap water heating in detached<br />
houses, apartments and non-residential premises<br />
Detached houses<br />
Apartments<br />
Non-residential<br />
premises<br />
2009 2010 2020 2030 2040 <strong>2050</strong><br />
kWh/m2 156 154 129 105 83 63<br />
%/year -0.7% -1.1% -1.8% -2.0% -2.4% -2.7%<br />
The share of tap water 20% 20% 20% 25% 30% 35%<br />
kWh/m2 154 152 125 101 80 63<br />
%/year -2.2% -0.2% -1.9% -2.1% -2.3% -2.3%<br />
The share of tap water 20% 20% 20% 25% 30% 35%<br />
kWh/m2 144 142 132 109 91 73<br />
%/year 0.4% -0.2% -0.7% -1.9% -1.8% -2.1%<br />
The share of tap water 20% 20% 20% 25% 30% 35%<br />
Statistics by Swedish <strong>Energy</strong> Agency (Energimyndigheten 2011c; Energimyndigheten 2011b;<br />
Energimyndigheten 2011a) are used <strong>for</strong> calculating energy use values <strong>for</strong> 2009. However,<br />
Swedish <strong>Energy</strong> Agency does not include heat extracted by heat pumps from air, the ground<br />
or lakes. The heat extracted by heat pumps in the household and service sector has been estimated<br />
at 11 TWh in 2009 (about 10% of the heating demand <strong>for</strong> space and tap water heating)<br />
based on (Nilsson 2011). This calculation is relatively close to the 13 TWh <strong>for</strong> 2009 that<br />
the Swedish heat pump association assume (Bertenstam 2011). The heat extracted by heat<br />
pumps has been added to the Swedish <strong>Energy</strong> Agency official statistics be<strong>for</strong>e calculating the<br />
figures presented in Table 31. As a consequence the figures are higher <strong>for</strong> 2009 than usually<br />
presented. This energy is however used <strong>for</strong> heating purposes and should thus be included in<br />
the model.<br />
3.3.2.5 Improvement of heat pumps<br />
<strong>Sweden</strong> already has relatively large numbers of heat pumps installed in the energy system.<br />
Heat pump efficiency is represented by the coefficient of per<strong>for</strong>mance (COP) factor. The development<br />
of this factor is presented in Table 32.<br />
Table 32: Improvement of COP values <strong>for</strong> heat pumps<br />
2005 2010 2020 2030 2040 <strong>2050</strong><br />
Average COP <strong>for</strong> heat pumps 2.7 2.8 3.3 3.8 4.3 4.8<br />
Based on numbers by (Nowacki 2011) the average COP <strong>for</strong> heat pumps is calculated to 2.7 <strong>for</strong><br />
2009. According to the Swedish heat pump association the improvement <strong>for</strong> new heat pumps<br />
is an increase of 0.05 per year according to historical data (Bertenstam 2011). How rapid the<br />
average increase is depends on the per<strong>for</strong>mance of the scrapped old heat pumps and the rate<br />
at which they are scrapped as well as the per<strong>for</strong>mance of the new heat pumps. IVL has as-
ENERGY SCENARIO <strong>2050</strong> 46<br />
sumed that the increase in per<strong>for</strong>mance is on average 0.05 per year during the period 2005<br />
to <strong>2050</strong>.<br />
3.3.2.6 Change in heating demand depending on climate change<br />
According to Gode and Jarnehammar (2007) heating demand will decrease by almost 11%<br />
compared to 2005 because of the changing climate. Gode and Jarnehammar (2007) calculate<br />
the decrease of heating demand by assuming that the change in heating demand due to climate<br />
change is linear between the average <strong>for</strong> the period 1961-1990 and the average <strong>for</strong> the<br />
period 2041-2070. Climate change will have an effect on heating demand. The level of change<br />
in heating demand is shown in Table 33.<br />
Table 33: Change in heating demand as a function of climate change<br />
Changed heating demand because<br />
of changed climate compared to 2005<br />
2005 2010 2020 2030 2040 <strong>2050</strong><br />
0 -1.2% -3.6% -6.0% -8.5% -10.9%<br />
3.3.3 <strong>Energy</strong> carriers used <strong>for</strong> space and tap water heating<br />
<strong>Energy</strong> demands <strong>for</strong> tap water and heating purposes stand <strong>for</strong> a large share of the energy<br />
demands <strong>for</strong> housing. The energy carriers used to satisfy these energy demands can vary. In<br />
<strong>Sweden</strong> there is a very low dependency of oil within this sector at present.<br />
3.3.3.1 Detached houses<br />
Detached houses will have varied types of heating technologies to secure space and tap water<br />
heating. The energy carriers used and the changes over the period 2010-<strong>2050</strong> are found in<br />
Table 34.<br />
Table 34: <strong>Energy</strong> carriers used <strong>for</strong> space and tap water heating in detached houses<br />
2009 2010 2020 2030 2040 <strong>2050</strong><br />
District heating 12% 12% 16% 20% 22% 24%<br />
Electricity (direct use) 23% 23% 17% 11% 6% 0%<br />
Oil 4% 4% 0% 0% 0% 0%<br />
Heat pumps 31% 31% 31% 31% 31% 31%<br />
Biofuel 31% 31% 25% 22% 19% 16%<br />
Natural gas 1% 1% 0% 0% 0% 0%<br />
Solar heat 0% 0% 11% 16% 23% 29%<br />
The shares <strong>for</strong> 2009 have been calculated from statistics by Swedish <strong>Energy</strong> Agency (Energimyndigheten<br />
2011c) complemented with in<strong>for</strong>mation about heat extracted by heat pumps<br />
based on in<strong>for</strong>mation from (Nilsson 2011). Oil has decreased rapidly over the last decade and<br />
it is assumed that oil and natural gas will disappear by 2020. Electricity <strong>for</strong> direct heating<br />
use is an inefficient way of using electricity and it is assumed that this is no longer found<br />
by <strong>2050</strong>. The share of biofuel decreases to conserve these resources <strong>for</strong> other more valuable<br />
needs. Heat pumps are assumed to be constant, and district heating almost doubles its<br />
market share because it is an important recipient of surplus heat from industry and biofuel<br />
production. Solar heat grows significantly and becomes the second largest energy carrier
ENERGY SCENARIO <strong>2050</strong> 47<br />
<strong>for</strong> detached houses. District heating is used at all detached houses close to district heating<br />
networks; solar heating, together with biofuels and/or heat pumps is used in almost all detached<br />
houses not using district heating.<br />
3.3.3.2 Apartments<br />
In the scenario apartments are to a great extent connected to a district heating network to<br />
secure space and tap water heating. The energy carriers used and the changes over the period<br />
2010-<strong>2050</strong> are found in Table 35.<br />
Table 35: <strong>Energy</strong> carriers used <strong>for</strong> space and tap water heating in apartments<br />
2009 2010 2020 2030 2040 <strong>2050</strong><br />
District heating 88% 88% 88% 89% 90% 91%<br />
Electricity (direct use) 3% 3% 0% 0% 0% 0%<br />
Oil 2% 2% 0% 0% 0% 0%<br />
Heat pumps 6% 6% 6% 6% 5% 4%<br />
Biofuel 1% 1% 1% 1% 1% 1%<br />
Natural gas 1% 1% 1% 0% 0% 0%<br />
Solar heat 0% 0% 4% 4% 4% 4%<br />
Other fuel 0% 0% 0% 0% 0% 0%<br />
The shares <strong>for</strong> 2009 have been calculated from statistics by Swedish <strong>Energy</strong> Agency (Energimyndigheten<br />
2011b) together with in<strong>for</strong>mation about heat extracted by heat pumps<br />
based on in<strong>for</strong>mation from (Nilsson 2011). For the period 2010 to <strong>2050</strong> it is assumed that<br />
the high market share <strong>for</strong> district heating will grow a little replacing the use of oil, natural<br />
gas and electricity <strong>for</strong> direct use, all of which disappear be<strong>for</strong>e 2030. It is also assumed that<br />
solar heating increases and heat pumps decrease. Some further solar heating is introduced<br />
through district heating systems and is thus not visible in Table 35. Consequently, the share<br />
of solar energy is higher than in Table 35.
ENERGY SCENARIO <strong>2050</strong> 48<br />
3.3.3.3 Non-residential premises<br />
In non-residential buildings the trend is to use either heat pumps or district heating. The<br />
energy carriers, technologies used are seen in Table 36.<br />
Table 36: <strong>Energy</strong> carriers used <strong>for</strong> space and tap water heating in non-residential premises<br />
2009 2010 2020 2030 2040 <strong>2050</strong><br />
District heating 73% 73% 77% 79% 81% 82%<br />
Electricity (direct use) 5% 5% 0% 0% 0% 0%<br />
Oil 4% 4% 0% 0% 0% 0%<br />
Heat pumps 13% 13% 17% 15% 14% 13%<br />
Biofuel 3% 3% 3% 3% 1% 0%<br />
Natural gas 2% 2% 0% 0% 0% 0%<br />
Solar heat 0% 0% 3% 3% 4% 5%<br />
Other fuel 0% 0% 0% 0% 0% 0%<br />
The shares <strong>for</strong> 2009 have been calculated from statistics by the Swedish <strong>Energy</strong> Agency<br />
(Energimyndigheten 2011a) together with in<strong>for</strong>mation about heat from heat pumps based<br />
on in<strong>for</strong>mation from (Nilsson 2011). For the period 2010 to <strong>2050</strong> it is assumed that the high<br />
market share <strong>for</strong> district heating will grow a little replacing the use of oil, natural gas and<br />
electricity <strong>for</strong> direct use, all of which will disappear be<strong>for</strong>e 2020. It is also assumed that share<br />
of heat from heat pumps is roughly constant. Some solar heating is assumed in these buildings.<br />
3.3.4 Use of cooling<br />
The cooling demand will increase as a consequence of <strong>for</strong> example climate effects, improved<br />
building envelopes in combination with increased numbers of heat producing appliances in<br />
our homes as well as increased demands on controlled indoor climate. The change in cooling<br />
demand in buildings is found in Table 37.<br />
Table 37: Need of cooling in household and service sector and share of cooling technology applied<br />
2009 2010 2020 2030 2040 <strong>2050</strong><br />
Need of cooling (TWh) 1 1 4 7 10 13<br />
Share of cooling covered by:<br />
Absorption cooling produced by district heating 20% 20% 24% 28% 31% 35%<br />
Absorption cooling produced by solar heat 0% 0% 4% 8% 11% 15%<br />
Free cooling 20% 20% 25% 30% 35% 40%<br />
Electric cooling machines 60% 60% 48% 35% 23% 10%<br />
Average COP <strong>for</strong> electric cooling machines 2.5 2.5 2.9 3.3 3.6 4.0<br />
Average COP <strong>for</strong> absorption cooling 80% 80% 80% 80% 80% 80%<br />
Electricity <strong>for</strong> pumps as share of cooling<br />
production<br />
5% 5% 5% 5% 5% 5%<br />
The cooling production and market shares between the technologies to produce cooling are<br />
assumed by IVL <strong>for</strong> 2009, due to lack of statistics. The cooling demand in <strong>2050</strong> is estimated<br />
by Gode and Jarnehammar (2007). The cooling demand development between 2010 and <strong>2050</strong>
ENERGY SCENARIO <strong>2050</strong> 49<br />
is assumed to be linear. The development of the market shares is assumed by IVL. The high<br />
share of absorption cooling depends on the high share of surplus heat (from industries and<br />
biofuel production), use of waste and solar heat in district heating production that provide<br />
cheap heat during summer. Absorption cooling by solar heat is also assumed to be possible<br />
to produce locally.<br />
3.3.5 Use of electricity (not <strong>for</strong> heating or cooling purposes)<br />
The household and service sector uses electricity <strong>for</strong> a number of purposes other than <strong>for</strong><br />
heating and cooling, e.g. <strong>for</strong> electrical appliances and lighting. The variable is operationalised<br />
in the model as electricity use in the baseline plus a yearly change. The electricity use <strong>for</strong> detached<br />
houses, apartments and non-residential premises are found in Table 38.<br />
Table 38: Electricity use in detached houses, apartments and non-residential premises<br />
Detached houses<br />
Apartments<br />
Non-residential premises<br />
2009 2010 2020 2030 2040 <strong>2050</strong><br />
TWh 8.2 8.1 7.3 6.6 6.0 5.4<br />
(%/a) -1.0% -1.0% -1.0% -1.0% -1.0%<br />
TWh 11.3 11.2 10.1 9.1 8.3 7.5<br />
(%/a) -1.0% -1.0% -1.0% -1.0% -1.0%<br />
TWh 32 31.4 28.4 25.7 23.2 21.0<br />
(%/a) -1.0% -1.0% -1.0% -1.0% -1.0%<br />
Electricity <strong>for</strong> purposes other than heating has historically increased rapidly (Energimyndigheten<br />
2010b) with an increased requirement of ventilation (especially <strong>for</strong> non-residential<br />
premises) and increased use of electric appliances, e.g. computers. Even if there is a rapid improvement<br />
in efficiency <strong>for</strong> example <strong>for</strong> refrigerators and washing machines, the increased<br />
number of appliances has increased the use of electricity. However, since 2001 demand has<br />
stabilized (Energimyndigheten 2010b). In the analysis of electricity use in 400 Swedish<br />
households it was concluded that large electricity savings are possible (Zimmermann 2009).<br />
Based on this, IVL assumes that a reduction in electricity use of 1% per year is possible.<br />
3.3.6 Other energy use in the household and service sector<br />
In Table 39 energy demand <strong>for</strong> other energy uses is displayed, along with corresponding<br />
energy carrier. It is unclear how this energy is used and to what purposes. However, IVL<br />
assumes that it is used <strong>for</strong> similar purposes as the rest of the household and service sector.
Table 39: Other energy use in the household and service sector<br />
ENERGY SCENARIO <strong>2050</strong> 50<br />
2009 2010 2020 2030 2040 <strong>2050</strong><br />
<strong>Energy</strong> use TWh 9.7 9.7 8.3 7.1 6.0 5.1<br />
Yearly growth of energy use %/y 0.0% -1.6% -1.6% -1.6% -1.6%<br />
Share of energy use covered by:<br />
Electricity % 42.6% 43% 43% 43% 43% 43%<br />
District heating % 35.4% 35% 41% 46% 46% 46%<br />
Oil % 0.0% 0% 0% 0% 0% 0%<br />
Natural gas % 10.5% 10% 5% 0% 0% 0%<br />
Biofuel % 11.5% 12% 12% 12% 12% 12%<br />
Solar heat % 0.0% 0% 0% 0% 0% 0%<br />
<strong>Energy</strong> <strong>for</strong> the household and service sector 2009 presented in (Energimyndigheten 2010b)<br />
but not specified in the Swedish <strong>Energy</strong> Agency publications <strong>for</strong> detached houses (Energimyndigheten<br />
2011c), apartments (Energimyndigheten 2011b), and non-residential premises<br />
(Energimyndigheten 2011a) is described in Table 39, except <strong>for</strong> oil fuels which are treated<br />
in the transport sector above.<br />
The change of energy use is of the same magnitude as in the detached houses and apartments<br />
subsectors above. An activity level increase of about 0.5% and an efficiency level just<br />
over 2% result in a total decline of energy use by 1.6% per year from 2010 to <strong>2050</strong>.<br />
The shares of most energy carriers used are assumed to be unchanged because it is difficult<br />
to know how this will develop owing to uncertainty as to exactly where these fuels are used.<br />
Fossil gas used <strong>for</strong> heating is assumed to be replaced by district heating.
4 Supply<br />
ENERGY SCENARIO <strong>2050</strong> 51<br />
In the model the energy supply is generated from existing demands. An iterative process has<br />
been used to ensure that the demands are found within limitations defined in this backcasting<br />
scenario. This chapter presents input variables that are used in the model. The variables<br />
define <strong>for</strong> example per<strong>for</strong>mances, availability and also in some cases actual expanding power<br />
production from a specific source. In a number of cases the model will give results and inputs<br />
in terms of available resources. For example residues from the industry used <strong>for</strong> DME production,<br />
will result in inputs both <strong>for</strong> electricity and heat generation and needs.<br />
4.1 Biofuel production<br />
Biofuels can be produced by different technologies from different biomass materials. It is<br />
difficult to assess which biofuels will be produced in the future. In this scenario an outset has<br />
been to utilize the biomass resource as efficiently as possible as it is a limited resource. Hence<br />
a resource-efficient process has been sought <strong>for</strong>. The available resource in the Swedish case<br />
is to a great extent solid biomass and that has also resulted in choosing a technology trajectory<br />
based on biorefineries within the existing paper and pulp industry. In recent years the<br />
biorefinery concept has received increased attention and also application in <strong>Sweden</strong>.<br />
In a biorefinery a range of products can be obtained from the biomass and losses are reduced<br />
substantially. The technology applied in the scenario will produce either DME or FAME and<br />
the production specifications are specific in terms of the output that will be received from the<br />
input resources. In Table 40 the per<strong>for</strong>mances <strong>for</strong> the biofuel productions that are included<br />
in the project are shown. All future biofuel is assumed to be produced in poly-generation<br />
plants with several outputs to improve efficiency.<br />
Table 40: <strong>Energy</strong> efficiency <strong>for</strong> producing (+) or using (-) biofuels, heat, electricity<br />
and other by-products compared to bioenergy input.<br />
Biofuel<br />
production<br />
Efficiency compared to input energy<br />
Heat use (-) /<br />
heat prod (+)<br />
Electricity use<br />
(-) / prod (+)<br />
Usable by-<br />
products<br />
Biogas *,** 70% -7% -7% 0%<br />
SNG * 71% 24% -4% 0%<br />
Ethanol 1st gen * 55% -19% -3% 39%<br />
Ethanol 2nd gen * 32% 8% 13% 0%<br />
FAME * 67% -12% 0% 0%<br />
DME * 65% 11% -6% 4%<br />
* (Gode et al. 2008)<br />
** (Berglund and Börjesson 2003)<br />
In the scenario it is assumed that a major part of the biofuels in the future will be DME<br />
complemented with biogas and SNG based on renewable sources. DME is assumed to be<br />
produced partly from gasification of black liquor in the pulp and paper industry and partly<br />
by gasification of solid biomass elsewhere. How much DME is produced from black liquor
ENERGY SCENARIO <strong>2050</strong> 52<br />
is determined by developments in the chemical pulp industry and the implementation of<br />
DME production facilities at pulp mills, see section3.1 The industry sector3.1 The industry<br />
sector. The volume of biofuels produced is determined by the demand specified in the sectors<br />
above. The per<strong>for</strong>mance of DME produced by black liquor gasification depends on the steam<br />
demand at the chemical plant and varies during the period. In most cases this production is<br />
more efficient than other DME production.<br />
4.2 District heating production<br />
Table 41 shows the energy supply to the district heating plants and the share of each fuel.<br />
District heating systems are (today) relatively local and only in larger cities interlinked between<br />
communities.<br />
Table 41: District heating production and energy carriers (technologies) (TWh)<br />
2005 2010 2020 2030 2040 <strong>2050</strong><br />
Oil 3.8 3.3 2.5 0.0 0.0 0.0<br />
Natural gas 3.0 2.7 2.0 1.3 0.7 0.0<br />
Coal 3.1 2.8 2.1 0.0 0.0 0.0<br />
Bioenergy 22.3 23.3** 19.0** 17.6** 10.4** 2.8**<br />
Peat 3.3 2.9 2.2 1.5 0.7 0.0<br />
Waste 10.6 10.6 12.6 12.6 12.6 12.6<br />
Surplus coke gases 2.6 2.8** 2.2** 0.7** 0.7** 0.4**<br />
Surplus heat from biofuel production<br />
0.0 -1.2** -0.8** 0.8** 3.5** 6.0**<br />
Surplus energy from biofuel production<br />
0.0 1.8** 2.8** 1.7** 0.8** 1.1**<br />
Electricity boilers 0.3 0.0 0.0 0.0 0.0 0.0<br />
Heat pumps (extracted heat)* 4.4 4.4 4.8 5.3 5.7 6.2<br />
Heat pumps (electricity) 1.8 1.8 1.8 1.8 1.8 1.8<br />
Surplus heat from industry 5.4 5.8 6.6 7.4 8.2 9.0<br />
Solar heat 0.0 0.0 1.0 2.0 3.0 4.0<br />
Total 60 .6 61 .0 58 .8 52 .7 48 .1 43 .9<br />
* The COP <strong>for</strong> heat pumps in district heating systems increases from 3.4 in 2010 to 4.4 in <strong>2050</strong>.<br />
It is a slower increase than <strong>for</strong> heat pumps <strong>for</strong> domestic use. The reason is higher temperatures needed in the district heating system and a lower investment rate.<br />
** These numbers are calculated within the model and are the results from the scenario<br />
The energy used <strong>for</strong> electricity and heat production in combined heat and power plants and<br />
in heat boilers <strong>for</strong> 2005 is presented in Table 41 and is based on Swedish <strong>Energy</strong> Agency<br />
statistics (Energimyndigheten 2009). The energy use <strong>for</strong> each energy carrier listed in Table<br />
41 <strong>for</strong> 2010 to <strong>2050</strong> is assumed by IVL. Fossil fuels, peat and electricity boilers decline to<br />
zero, heat from heat pumps increases slightly (but with constant electricity demand due to<br />
increased per<strong>for</strong>mance), waste is assumed to increase a little, and solar heat is introduced to<br />
some extent.
ENERGY SCENARIO <strong>2050</strong> 53<br />
The waste directive (European Parliament 2008) stipulates that a desired development <strong>for</strong><br />
management of wastes is to strive <strong>for</strong> re-use and recycling of resources rather than burning<br />
them <strong>for</strong> energy recovery. This is far from the actual situation today where waste is a mixed<br />
resource with both renewable/organic and fossil origins. Improved separation of the waste<br />
fraction, and also a shift in resources used in the production of plastics, etc. will have an<br />
impact here. Assuming that there is a general shift towards phasing out fossil resources globally<br />
waste will become increasingly renewable/organic. The amount of waste used <strong>for</strong> energy<br />
purposes in <strong>Sweden</strong> is supposed to be held constant from 2020 onwards. It would obviously<br />
make much sense to reduce the amount of waste even further.<br />
Surplus coke gases depends in this scenario on the production level in the steel industry, and<br />
surplus heat and energy from biofuel production depend on the production level of biofuels<br />
and the production technologies used. Bioenergy used in district heating plants to produce<br />
heat and electricity is calculated as the difference between the demand of fuels (depending<br />
on the demand <strong>for</strong> district heating) and the potential from the other fuels, heat production<br />
technologies and surplus energy and heat per decade.<br />
The electricity produced in district heating plants is determined by the alpha values <strong>for</strong> each<br />
fuel in 2005. The alpha value is defined by dividing the electricity production with the heat<br />
production. The alpha values were calculated as Swedish averages based on data from Svensk<br />
Fjärrvärme (2011) and the Swedish <strong>Energy</strong> Agency (Energimyndigheten 2009). The alpha<br />
values are listed in Table 42.<br />
Table 42: Alpha values <strong>for</strong> electricity production in district heating systems<br />
Oil<br />
2005<br />
0.11<br />
Natural gas 0.36<br />
Coal 0.36<br />
Bioenergy 0.14<br />
Peat 0.25<br />
Waste 0.07<br />
The alpha values will probably be possible to increase in the future. However, since biomass<br />
is a limited resource in this scenario the alpha values have been kept at a static level.<br />
4.3 Electricity production<br />
The generation of electricity is secured through a number of different energy technologies.<br />
In <strong>2050</strong> all non-renewable energy sources have been replaced by renewable energy technologies.<br />
Table 43 shows electricity production in 2005 according to the Swedish <strong>Energy</strong> Agency<br />
(Energimyndigheten 2009). In Table 43 values <strong>for</strong> <strong>2050</strong> are based on the assessment made by<br />
IVL and is discussed in more detail under each technology section below.
Table 43: The production of electricity by different technologies (TWh)<br />
ENERGY SCENARIO <strong>2050</strong> 54<br />
2005 2010 2020 2030 2040 <strong>2050</strong><br />
Hydropower 72 66 66 66 66 66<br />
Wind power 0.9 3.5 20 30 38 45<br />
Solar photovoltaic 0 0 4 8 16 32<br />
New renewable energy tech 0 0 0 0 0 3<br />
Nuclear power 70 63 70 50 0 0<br />
Electricity production<br />
at district heating plants<br />
7.3 5.9* 5.9* 5.1* 3.9* 2.9*<br />
Electricity production in industry 4.6 6.6* 5.6* 4.4* 3.2* 1.9*<br />
* These numbers are calculated within the model and are the results from the scenario<br />
4.3.1 Hydropower<br />
The hydropower production was higher in 2005 than in a normal year due to more rainfall<br />
than average. A normal year results in a production of 66 TWh. Climate change is predicted<br />
to lead to increased rainfall which would result in an increase in hydropower production.<br />
This increase is used to improve the natural capital in running water and around the water<br />
catchment areas. The process of implementing the European water directive (European Parliament<br />
2000) in <strong>Sweden</strong> is currently under way and changes in regulation regimes and management<br />
of running water will be needed to realize it. There are a number of ways to improve<br />
the existing hydropower to reduce negative impacts.<br />
In the energy system hydropower acts as a regulating capacity, compensating <strong>for</strong> both short-<br />
and long-term changes in electricity demand. It may regulate the intermittent production<br />
from <strong>for</strong> example wind and solar technologies. There are, however, two types of hydropower<br />
stations in <strong>Sweden</strong>, reservoir hydropower stations and run-of-the-river stations. The run-ofthe-river<br />
type of hydropower only has very limited regulating capacity. A regulating capacity<br />
is vital in order <strong>for</strong> the system to be operational and in the Nordic electricity system hydropower<br />
is the main regulating capacity.<br />
4.3.2 Wind power<br />
In <strong>Sweden</strong> the amount of electricity generated from wind power has developed from less<br />
than 1 TWh in 2006 to 3.5 TWh in 2010. The Swedish <strong>Energy</strong> Agency has a planning target of<br />
30 TWh in 2020 set in the energy policy laid out by the government in 2008 (Regeringskansliet<br />
2008a). The planning target means that the Swedish energy system should be ready to<br />
handle this expansion, but is not responsible <strong>for</strong> its actual taking place. The planning target<br />
says that 20 TWh should be land based, and 10 TWh offshore. This scenario does not push<br />
the wind power expansion rapidly enough to reach 30 TWh by 2020 but will achieve this level<br />
in 2030. The main reason <strong>for</strong> this is the importance of expanding with consideration <strong>for</strong> the<br />
local environment.<br />
During the period between 2030 and <strong>2050</strong> replacement of old wind turbines takes place<br />
which increases production without increasing the number of sites. Recent years’ expansion<br />
of wind power in <strong>Sweden</strong> has highlighted the challenges in terms of gaining acceptance<br />
<strong>for</strong> new wind power projects. From an environmental point of view there are a number of
ENERGY SCENARIO <strong>2050</strong> 55<br />
variables to take into consideration when assessing the impact of a wind power station on<br />
the local environment. It is not only the turbine structure that has an effect but also the<br />
infrastructure needed to service the wind turbines, and maintain and distribute the power<br />
generated. An expansion in the magnitude of 30 TWh will necessitate that a high level of<br />
environmental consideration be taken regarding the locations of the wind turbines and associated<br />
infrastructure.<br />
The scenario does not divide the energy generated from offshore and on-shore wind turbines.<br />
Offshore is presently more costly in terms of investments than <strong>for</strong> on-shore locations.<br />
However, it is reasonable to argue that in a not-so-distant future wind power will stand out<br />
as a commercial technology. Today, new projects depend on electricity certificates in order<br />
to be profitable.<br />
4.3.3 Solar power<br />
Solar photovoltaic (PV) will increase rapidly from 2020 and onwards to reach 32 TWh in <strong>2050</strong>.<br />
Experiences from other European countries have shown that the expansion of solar photovoltaic<br />
technology has the potential to make an impact in the energy system. The technology<br />
has historically been expensive but the learning curve of PV has displayed a significant<br />
decrease in cost per installed unit of power. Solar PV technology can potentially be expanded<br />
to even higher electricity outputs than the 32 TWh in the scenario.<br />
PV technology has the advantage of being possible to integrate in house construction and<br />
other unused surfaces. In global energy scenarios PV technology stands out as a major contributor<br />
(Deng et al. 2011). Because current PV technology requires a number of rare earth<br />
minerals, large expansion of production capacity it might lead to a shortage of these materials<br />
in the future. We anticipate there will also be an increased focus on research and development<br />
within this sector.<br />
4.3.4 New renewable energy technologies<br />
New renewable energy technologies refer to technologies such as wave power, bioenergy<br />
from algae, and so <strong>for</strong>th. The assumption has been to introduce these on a relatively low scale<br />
within this scenario as the scenario is mainly based on available technologies. This could be<br />
disputed as it is very likely that there will be technical breakthroughs within the area of energy<br />
systems and technologies be<strong>for</strong>e <strong>2050</strong>. However, this backcasting scenario is motivated<br />
by analysing the needs <strong>for</strong> change in demand structures and to see the strategically important<br />
changes in energy supply in terms of reaching these demands.<br />
4.3.5 Nuclear power<br />
Nuclear power generates a relatively large share of the Swedish electricity (~45%). Availability,<br />
i.e. time outside scheduled and non-scheduled maintenance and repair, of the reactors<br />
is a central variable in terms of the production from the power plants. During 2005, nuclear<br />
power in <strong>Sweden</strong> had a higher availability than the 80% that has been assumed in the model.<br />
According to plans within the nuclear power sector there will be new turbines with higher<br />
power output from 2020 in a number of the nuclear power stations. This has been included<br />
in the scenario.
ENERGY SCENARIO <strong>2050</strong> 56<br />
Nuclear power represents a non-renewable energy source and will be phased out be<strong>for</strong>e <strong>2050</strong><br />
according to this scenario. The lifetime <strong>for</strong> each nuclear reactor in this project is set at 50<br />
years and by 2030 five reactors have been phased out and in 2040 all nuclear reactors in <strong>Sweden</strong><br />
have been decommissioned.<br />
4.3.6 Electricity production in industry and district heating systems<br />
Electricity production in industry and in district heating systems 2010 to <strong>2050</strong> is determined<br />
by developments in industry and district heating demand and the technologies used. Most<br />
of the electricity produced in industry is generated in the pulp and paper industry. The electricity<br />
production decreases during the period with the assumed focus on DME-production<br />
in the pulp and paper industry and decreased pulp production. Electricity production at the<br />
district heating systems decreases as well because of decreased demand <strong>for</strong> district heating<br />
and the increased use of surplus heat and solar heat <strong>for</strong> district heating production. The<br />
increased supply to district heating of surplus heat and solar heat decrease the possible production<br />
of CHP.<br />
Electricity production in industry and district heating systems will still use some fossil fuels<br />
in <strong>2050</strong> as a consequence of coke gases from the steel industry being used <strong>for</strong> the producing<br />
of electricity and heat. The oil industry that currently provides heating to district heating in<br />
a number of cities in <strong>Sweden</strong> will not use fossil resources in <strong>2050</strong> and as a consequence the<br />
excess heat from these industries will be renewable in origin.<br />
4.3.7 Losses in transmission and distribution<br />
There are a number of losses linked to the transmission and distribution of electricity, as well<br />
as in the generation of electricity. The levels of the losses are summarized in Table 44.<br />
Table 44: Losses linked to electric power production<br />
Losses in transmission and distribution<br />
(share of electricity production)<br />
Efficiency in fuel based electricity production<br />
(CHP)<br />
2005 2010 2020 2030 2040 <strong>2050</strong><br />
8% 8% 7% 6% 6% 5%<br />
90% 90% 90% 90% 90% 90%<br />
Efficiency in fuel based power production 40% 40% 40% 40% 40% 40%<br />
Losses linked to hydro, wind and solar power are not operationalised in the model other than<br />
through technical innovations and advancements. In terms of <strong>for</strong> example hydropower there<br />
are a number of efficiency-increasing changes that can be made to the hydropower station,<br />
which mainly are linked to improving the turbines and generators.
4.4 Bioenergy, waste and peat<br />
ENERGY SCENARIO <strong>2050</strong> 57<br />
Bioenergy is a major contributor in the Swedish energy system. The contribution in terms<br />
of energy in 2009 was more than 110 TWh (Energimyndigheten 2010b). Bioenergy in the<br />
Swedish energy system displays remarkable growth. Since the early 90s the use of biofuels<br />
in the energy sector has almost doubled (Energimyndigheten 2010b). At the same time this<br />
has resulted in a growing pressure in <strong>for</strong>estry and more and more of the biomass is extracted<br />
from the <strong>for</strong>est ecosystems to be used as a source <strong>for</strong> energy or as other types of products.<br />
There are several studies made on the impacts seen in the ecosystem and <strong>for</strong>ests as well as<br />
the magnitude of these (see <strong>for</strong> example Dahlberg et al. 2006; Skogsstyrelsen 2008a; de Jong<br />
and Lönnberg 2010).<br />
In the scenario the ambition is to use resources as efficiently as possible. As a consequence<br />
of turning solid biomass into different types of energy carriers that can be used to provide<br />
energy services, the biomass used is often a residue or by-product from an alternative production<br />
(e.g. saw mill, paper and pulp industry etc). Table 45 shows the various potentials.<br />
Table 45: Bioenergy waste and peat potentials in the scenario (TWh)<br />
2010 2020 2030 2040 <strong>2050</strong><br />
Bioenergy from paper and wood<br />
industry residues*<br />
67 60 57 60 65<br />
whereof black liquor* 41 37 35 37 40<br />
whereof tree bark from pulp mills* 9 8 7 8 8<br />
whereof residues from saw mills* 18 15 15 16 17<br />
Bioenergy tops and branches<br />
(GROT)<br />
19 17 19 20 21<br />
Pulpwood not used <strong>for</strong> paper* 0 0.4 4.2 1,9 0<br />
Bioenergy round timber and small<br />
wood <strong>for</strong> domestic use<br />
16.5 13.5 13.5 13.5 13.5<br />
Bioenergy from agriculture and<br />
perennial crops (e.g. salix)<br />
1 15 15 15 15<br />
Bioenergy from agriculture used <strong>for</strong><br />
biogas production<br />
0 5 5 5 5<br />
Wastes and sewage used <strong>for</strong><br />
biogas production.<br />
1.4 1.5 1.5 1.5 1.5<br />
Wastes used in incineration 10.6 12.6 12.6 12.6 12.6<br />
Peat 3 3 2 1 0<br />
New innovations e.g. algae<br />
biomass<br />
0 0 0 0 5<br />
* These figures are calculated within the model. These numbers are to be considered as results<br />
from the scenarios and not potentials.<br />
The bioenergy levels presented in Table 45 are based on a <strong>for</strong>est management that would<br />
include more protected <strong>for</strong>est area and extensive <strong>for</strong>estry than the SKA 08 environment scenario<br />
(Skogsstyrelsen 2007b). The level of concern has been developed by WWF and considers<br />
both the protection of biodiversity in accordance to the decisions by the tenth meeting<br />
of the Conference of the Parties to the Convention on Biological Diversity in Nagoya, Japan<br />
2010 and in addition introduction of continued cover <strong>for</strong>estry practice on certain land areas.
ENERGY SCENARIO <strong>2050</strong> 58<br />
In <strong>Sweden</strong> the fuel category ‘tops and branches’ is usually referred to as GROT. GROT includes<br />
tops and branches from <strong>for</strong> example final fellings and thinnings, but does not include<br />
stumps. In the WWF adjusted scenario tops and branches is not to be removed from thinnings<br />
and hence the potential have been adjusted in accordance.<br />
Peat is a non-renewable resource and decreases gradually to zero in <strong>2050</strong>. The potential <strong>for</strong><br />
the categories calculated in the model is determined by the production volumes in the <strong>for</strong>estry<br />
industry. The production in the <strong>for</strong>estry industry is mainly determined by the available<br />
wood from <strong>for</strong>est <strong>for</strong> industrial purposes.<br />
The potentials <strong>for</strong> bioenergy from agriculture are perennial crops, bioenergy from agriculture<br />
used <strong>for</strong> biogas production, waste and sewage used <strong>for</strong> biogas production, waste used in<br />
incineration and innovations e.g. algae biomass.
<strong>Energy</strong> <strong>Scenario</strong> <strong>2050</strong> IVL report<br />
5 Results from the energy model<br />
5 Results from the energy model<br />
ENERGY SCENARIO <strong>2050</strong> 59<br />
The supply of primary energy sources is based on the demands in the different sectors calculated<br />
The considering supply of different primary energy technology sources mixes is based applied on and the the demands progress in of the introducing different sectors renewable<br />
calculated energy technologies. considering different For example, technology the introduction mixes applied of and biorefineries the progress on of a large introducing scale is<br />
first renewable seen after energy 2020. technologies. The demands For are example, based on the the introduction assumptions of and biorefineries processes described on a large in<br />
section scale 2.2 is first Functions seen after of the 2020. energy The model demands applied. are based and chapter on the assumptions 3 Demand side and in processes <strong>Sweden</strong>.<br />
The described supply side in section is also 2.2. dependent and chapter on 3. the The variables supply side and is inputs also dependent to the model on the presented variables in<br />
chapter and inputs 4 Supply. to the model presented in chapter 4.<br />
In Figure 3 the demands in the different sectors are presented along with actual statistics<br />
1970-2009<br />
In Figure<br />
(Energimyndigheten<br />
3 the demands in the<br />
2010b).<br />
different<br />
In<br />
sectors<br />
2008 and<br />
are<br />
2009<br />
presented<br />
the economic<br />
along with<br />
recession<br />
actual statistics<br />
gave effects<br />
1970-2009<br />
in the energy<br />
(Energimyndigheten<br />
demands which<br />
2010b).<br />
are seen<br />
In 2008<br />
in the<br />
and<br />
actual<br />
2009<br />
figures<br />
the economic<br />
<strong>for</strong> those<br />
recession<br />
years. The<br />
gave<br />
scenario<br />
effects<br />
takes<br />
in<br />
its<br />
the<br />
point<br />
energy<br />
of departure<br />
demands which<br />
in the<br />
are<br />
Swedish<br />
seen in<br />
<strong>Energy</strong><br />
the actual<br />
Agency<br />
figures<br />
long<br />
<strong>for</strong><br />
term<br />
those<br />
scenario<br />
years.<br />
(Ener-<br />
The<br />
gimyndigheten<br />
scenario takes<br />
2009)<br />
its point<br />
which<br />
of<br />
does<br />
departure<br />
not account<br />
in the Swedish<br />
<strong>for</strong> the<br />
<strong>Energy</strong><br />
recession<br />
Agency<br />
and<br />
long<br />
thus<br />
term<br />
there<br />
scenario<br />
is a gap<br />
between<br />
(Energimyndigheten<br />
actual figures<br />
2009)<br />
and scenario<br />
which does<br />
demand<br />
not account<br />
figures.<br />
<strong>for</strong> the recession and thus there is a gap<br />
between actual figures and scenario demand figures.<br />
450<br />
400<br />
350<br />
300<br />
250<br />
200<br />
150<br />
100<br />
50<br />
0<br />
1970 1990 2010 2030 <strong>2050</strong><br />
Figure Figure 3: Sector-wise 3: Sector-wise change in energy demands, actual 1970-2009 and scenario 2010, 2020, 2030,<br />
actual 2040 1970-2009 and <strong>2050</strong> and (TWh). scenario 2010, 2020, 2030, 2040 and <strong>2050</strong> (TWh).<br />
The The demand demand trend trend needs needs to show to show a decline a decline in all in all sectors sectors in in order order <strong>for</strong> <strong>for</strong> the the scenario scenario to to fulfil fulfil the<br />
targets the targets <strong>for</strong> <strong>2050</strong>. <strong>for</strong> As <strong>2050</strong>. was As described was described previously previously there is there a certain is a certain growth growth in terms in terms of energy of<br />
services energy used, services while used, the while primary the energy primary needed energy to needed provide to these provide energy these services energy services is reduced. is<br />
The reduced. demand The side demand is further side discussed is further in discussed section in 5.2. section 5.2.<br />
55<br />
Total<br />
Residential, services etc.<br />
Industry<br />
National transport
5.1 Supply<br />
ENERGY SCENARIO <strong>2050</strong> 60<br />
There is a need to start to increase the share of renewable energy as well as to establish<br />
industries that can produce biofuels in order to be able to reach the sustainable energy<br />
5.1 system Supply in <strong>2050</strong>. Several of the initiatives that are anticipated will take time to implement.<br />
The strategic focus must be on support and the creation of incentives <strong>for</strong> this to be<br />
There is a need to start to increase the share of renewable energy as well as to establish indus-<br />
realised.<br />
tries that can produce biofuels in order to be able to reach the sustainable energy system in<br />
<strong>2050</strong>. The Several supply of curve the does initiatives not necessarily that are anticipated match the demand will take curve time exactly to implement. but in the The design strategic of<br />
focus the must scenario, be on there support is no and time the when creation the of demand incentives curve <strong>for</strong> is this higher to be than realised. the supply. The<br />
The Swedish supply energy curve does system not is necessarily interlinked with match other the countries demand both curve in exactly terms of but trading in the fuels design and of<br />
the energy scenario, carriers there such is no as time electricity. when The the demand scenario curve has been is higher developed than to the cover supply. the The demand Swedish in<br />
energy <strong>Sweden</strong> system with is supply interlinked on a yearly with other basis in countries terms of both each in energy terms carrier of trading (biofuels, fuels and electricity energy<br />
carriers and heat). such as electricity. The scenario has been developed to cover the demand in <strong>Sweden</strong><br />
with supply on a yearly basis in terms of each energy carrier (biofuels, electricity and heat).<br />
The curve in Figure 4 represents the primary energy supply in the Swedish energy system<br />
The 2010-<strong>2050</strong> curve in Figure excluding 4 represents losses from the nuclear primary power energy but supply including in the other Swedish losses in energy the energy system<br />
2010-<strong>2050</strong> system. excluding losses from nuclear power but including other losses in the energy system.<br />
500<br />
450<br />
400<br />
350<br />
300<br />
250<br />
200<br />
150<br />
100<br />
50<br />
0<br />
2010 2020 2030 2040 <strong>2050</strong><br />
Crude oil and oil products<br />
Coal and coke<br />
Natural gas, gasworks gas<br />
Figure 4: Total <strong>Energy</strong> supply, excluding losses in nuclear (TWh)<br />
Figure 4: Total <strong>Energy</strong> supply, excluding losses in nuclear (TWh)<br />
The fossil and non-renewable energy sources are phased out and represent less than 5% of<br />
the primary energy supply in <strong>2050</strong>. In <strong>2050</strong> coal and coke is still used in the steel industry and<br />
the resulting by-products and heat are used to fill demands and thus there is a remnant of<br />
fossil energy in the system. There are mainly two processes that could speed up the removal<br />
of non-renewable energy sources in the Swedish energy system. The first one is the phasing<br />
56<br />
out of nuclear power. In the scenario, the lifetime of the existing nuclear power plants is set<br />
to 50 years but this is an estimation and could be carried through earlier.<br />
Peat<br />
Nuclear power<br />
Heat pumps (extracted heat)<br />
Solar heat<br />
Surplus heat from industry<br />
Waste<br />
Bioenergy<br />
New renewable energy tech<br />
Solar photovoltaic<br />
Wind power<br />
Hydro power
ENERGY SCENARIO <strong>2050</strong> 61<br />
Another option <strong>for</strong> reaching a higher share of renewables in the Swedish energy system is to<br />
replace more of the fossil energy used in the transport sector at an earlier stage. The transport<br />
sector is heavily dependent on fossil energy today and the transition towards more<br />
renewables in this sector will take off as production of biofuels in <strong>Sweden</strong> starts on a large<br />
scale, which is anticipated to take place after 2030. This is not scheduled earlier as the introduction<br />
of biorefineries takes time.<br />
The energy carriers electricity and district heating are used in the demand curves as resources<br />
to meet demand. These energy carriers will however have an origin that will change over<br />
time along with the change in the energy balance and technologies present <strong>for</strong> energy generation.<br />
In order to understand the demand curves and the resources used to generate the<br />
electricity and district heating the energy carrier fuel mix is presented below.<br />
5.1.1 Electricity<br />
The supply of electricity is part of a Nordic market and the connections are interlinked. However,<br />
this scenario is restricted to the production capacity in <strong>Sweden</strong>. There are a number of<br />
processes <strong>Energy</strong> <strong>Scenario</strong> that <strong>2050</strong> take place in Europe in order to harmonize the electricity markets IVL to report take<br />
advantages of synergetic effects as well as security in power supply. The scenario is designed<br />
to consider national demands and to be able to fulfil these with production within the geographic<br />
border of <strong>Sweden</strong>. The electricity demand is found in Figure 5.<br />
200<br />
150<br />
100<br />
50<br />
0<br />
2010 2020 2030 2040 <strong>2050</strong><br />
Figure 5: Demand of electricity in the in the Swedish Swedish energy energy system 2010-<strong>2050</strong> system 2010-<strong>2050</strong> (TWh) (TWh)<br />
In Figure 6 the electricity production per energy source is shown.<br />
200<br />
180<br />
160<br />
140<br />
120<br />
100<br />
80<br />
60<br />
40<br />
20<br />
Oil<br />
Coal and coke<br />
Natural gas<br />
Peat<br />
Nuclear power<br />
Waste<br />
Bioenergy<br />
Solar power<br />
New power gen<br />
Wind power
50<br />
0<br />
2010 2020 2030 2040 <strong>2050</strong><br />
Figure 5: Demand of electricity in the Swedish energy system 2010-<strong>2050</strong> (TWh)<br />
In In Figure 6 the electricity production per energy source is is shown.<br />
200<br />
180<br />
160<br />
140<br />
120<br />
100<br />
80<br />
60<br />
40<br />
20<br />
0<br />
2010 2020 2030 2040 <strong>2050</strong><br />
ENERGY SCENARIO <strong>2050</strong> 62<br />
Figure 6: Generation of electricity in <strong>Sweden</strong> 2010-<strong>2050</strong> (TWh)<br />
Figure 6: Generation of electricity in <strong>Sweden</strong> 2010-<strong>2050</strong> (TWh)<br />
Nuclear is phased out after its technical life time which is set at 50 years in this scenario. This<br />
means Nuclear that is phased during the out period after its towards technical 2040 life there time is which both is a set push at <strong>for</strong> 50 installing years in this new scenario. renewable<br />
electricity This means production that during capacity the period at the towards same time 2040 as there there is is both production a push <strong>for</strong> in the installing nuclear new power<br />
plants. renewable As a electricity result there production will be a surplus capacity of at electricity the same produced time as there in <strong>Sweden</strong> is production during this in the period<br />
(Table nuclear 46). power plants. As a result there will be a surplus of electricity produced in <strong>Sweden</strong><br />
during this period (Table 46).<br />
Table 46: Electricity production and demand (TWh)<br />
2010 2020 2030 2040 <strong>2050</strong><br />
Primary energy allocated to electricity production 147 174 166 129 153<br />
Losses in transmission and distribution 11 12 11 7 8<br />
Losses in fuel-based electricity production (cogeneration)<br />
3 2 2 2 2<br />
Electricity demand<br />
Import (+) / export (-) potential<br />
58<br />
134<br />
1<br />
121<br />
-39<br />
116<br />
-37<br />
113<br />
-7<br />
107<br />
-36<br />
In the demand curves presented in section 5.2 <strong>Energy</strong> demands in <strong>Sweden</strong> the mix <strong>for</strong> each<br />
year should be used. The share of renewable sources in the production mix is steadily increasing<br />
but slows in momentum when reaching close to 100% in 2040.<br />
Oil<br />
Coal and coke<br />
Natural gas<br />
Peat<br />
Nuclear power<br />
Waste<br />
Bioenergy<br />
Solar power<br />
New power gen<br />
Wind power<br />
Hydro power
Electricity demand 134 121 116 113 107<br />
Import (+) / export (-) potential 1 -39 -37 -7 -36<br />
Figure Figure 7: 7: Share of renewables renewables in in the the electricity electricity production production mix in <strong>Sweden</strong> mix in <strong>Sweden</strong><br />
ENERGY SCENARIO <strong>2050</strong> 63<br />
In the demand curves presented in section 5.2 the mix <strong>for</strong> each year should be used. The<br />
share of renewable sources in the production mix is steadily increasing but slows in<br />
momentum when reaching close to 100% in 2040.<br />
100%<br />
75%<br />
50%<br />
25%<br />
0%<br />
2010 2020 2030 2040 <strong>2050</strong><br />
The The share share of of renewables in in the the energy energy mix mix could could be increased be increased by phasing by phasing out out nuclear nuclear be<strong>for</strong>e<br />
reaching be<strong>for</strong>e reaching the lifetime the lifetime (50 years) (50 now years) set now in the set in energy the energy scenario. scenario. In 2030 In 2030 there there is a nuclear is a<br />
power nuclear input power of input 50 TWh of 50 and TWh a surplus and a surplus electricity electricity production production of 37 TWh. of 37 TWh.<br />
The The share of of intermittent power increases to to slightly more more than than 50% 50% in <strong>2050</strong>. in <strong>2050</strong>. The The issue issue of of<br />
handling the large share of intermittent power is is discussed in in more more detail detail in <strong>for</strong> in <strong>for</strong> example example<br />
Lund (2010). The The regulating capacity in in hydropower resource should be be prioritized over over power<br />
power production. production. Smart Smart grids, grids, including including the management the management of power of power peaks peaks by managing by managing demand<br />
loads demand (<strong>for</strong> loads example, (<strong>for</strong> plan example, certain plan recurring certain events recurring such events as the such start as of the large start compressors of large at<br />
certain compressors times), at are certain also times), needed are to also manage needed the to increase manage of the intermittent increase of intermittent power in the power electricity<br />
in supply. the electricity supply.<br />
5.1.2 District heating<br />
Compared to the global WWF energy scenario (Deng et al. 2011) district heating has been<br />
promoted as a discrete energy carrier as it fills such a central role in this scenario. In the<br />
scenario presented here, full advantage of the possibilities from this kind of energy distribution<br />
is taken. At the same time the demand in energy units <strong>for</strong> district heating will decrease<br />
during this period as a consequence not only of energy efficiency improvement measures in<br />
buildings, but also due to reduced need <strong>for</strong> 59 heating as a consequence of global warming. In<br />
parallel the need <strong>for</strong> cooling will increase. The source mix of district heating is displayed in<br />
Figure 8.
scenario presented here, full advantage of the possibilities from this kind of energy<br />
distribution is taken. At the same time the demand in energy units <strong>for</strong> district heating will<br />
decrease during this period as a consequence not only of energy efficiency improvement<br />
measures in buildings, but also due to reduced need <strong>for</strong> heating as a consequence of global<br />
warming. In parallel the need <strong>for</strong> cooling will increase. The source mix of district heating is<br />
displayed in Figure 8.<br />
60<br />
50<br />
40<br />
30<br />
20<br />
10<br />
Figure 8: 8: District heating, sources (TWh)<br />
ENERGY SCENARIO <strong>2050</strong> 64<br />
In In the the demand curves presented in in section 5.2 5.2 <strong>Energy</strong> the mix demands <strong>for</strong> each in year <strong>Sweden</strong> should the be mix used <strong>for</strong> each in<br />
year order should to interpret be used the in order mix of to fuels interpret in district the heating. mix of fuels in district heating.<br />
The<br />
The<br />
district<br />
district<br />
heating<br />
heating<br />
systems<br />
systems<br />
are<br />
are<br />
anticipated<br />
anticipated to<br />
to<br />
be<br />
be<br />
used<br />
used<br />
to<br />
to<br />
distribute<br />
distribute<br />
heat<br />
heat<br />
from<br />
from<br />
industries<br />
industries<br />
and<br />
and<br />
from<br />
from<br />
biofuel<br />
biofuel<br />
production.<br />
production.<br />
This<br />
This<br />
is especially<br />
is especially<br />
important<br />
important<br />
after<br />
after<br />
2030<br />
2030<br />
when<br />
when<br />
the<br />
the<br />
scenario<br />
scenario<br />
anticipates<br />
anticipates<br />
increased<br />
increased<br />
volumes<br />
volumes<br />
of DME<br />
of DME<br />
and SNG<br />
and SNG<br />
production<br />
production<br />
to substitute<br />
to substitute<br />
fossil<br />
fossil<br />
transport<br />
transport<br />
fuels.<br />
In<br />
fuels.<br />
Figure<br />
In<br />
8<br />
Figure<br />
surplus<br />
8<br />
energy<br />
surplus<br />
refers<br />
energy<br />
to<br />
refers<br />
energy<br />
to energy<br />
sources<br />
sources<br />
such as<br />
such<br />
gas and<br />
as gas<br />
other<br />
and<br />
fuels,<br />
other<br />
while<br />
fuels, while<br />
surplus<br />
heat<br />
surplus<br />
refers<br />
heat<br />
to heat.<br />
refers to heat.<br />
The ability to utilize district heating creates good opportunities to efficiently distribute and<br />
make<br />
The<br />
use<br />
ability<br />
of excess<br />
to utilize<br />
heat<br />
district<br />
from<br />
heating<br />
industrial<br />
creates<br />
processes<br />
good opportunities<br />
and biofuel production.<br />
to efficiently<br />
The<br />
distribute<br />
scenario<br />
and<br />
will<br />
require<br />
make use<br />
that<br />
of<br />
further<br />
excess heat<br />
expansion<br />
from industrial<br />
of district<br />
processes<br />
heating<br />
and<br />
systems<br />
biofuel<br />
in<br />
production.<br />
<strong>Sweden</strong> are<br />
The<br />
made,<br />
scenario<br />
as well<br />
will<br />
as<br />
reducing<br />
require<br />
the<br />
that<br />
energy<br />
further<br />
losses<br />
expansion<br />
in these<br />
of district<br />
distribution<br />
heating<br />
systems.<br />
systems in<br />
Compared<br />
<strong>Sweden</strong> are<br />
to many<br />
made,<br />
countries<br />
as well as<br />
in<br />
Europe<br />
reducing<br />
<strong>Sweden</strong><br />
the energy<br />
has the<br />
losses<br />
advantage<br />
in these<br />
of<br />
distribution<br />
having district<br />
systems.<br />
heating<br />
Compared<br />
systems<br />
to<br />
in<br />
many<br />
many<br />
countries<br />
of its cities<br />
in<br />
and<br />
Europe<br />
towns.<br />
<strong>Sweden</strong><br />
Utilizing<br />
has<br />
these<br />
the advantage<br />
to distribute<br />
of having<br />
excess<br />
district<br />
heat to<br />
heating<br />
various<br />
systems<br />
demands<br />
in<br />
is<br />
many<br />
an efficient<br />
of its cities<br />
route<br />
towards a renewable energy system. The ability to manage and operate the energy system in<br />
an efficient way and also to track environmental impacts and recycle ashes, etc. is improved<br />
through a more centralized production.<br />
60<br />
Oil<br />
Coal and surplus coke gases<br />
Natural gas<br />
Peat<br />
Bioenergy<br />
Heat pumps (extracted heat)<br />
Heat pumps (electricity)<br />
Solar heat<br />
Waste<br />
Surplus heat (biofuel prod)<br />
Surplus energy (biofuel prod)<br />
0<br />
Surplus heat (industry)<br />
2010 2020 2030 2040 <strong>2050</strong>
and towns. Utilizing these to distribute excess heat to various demands is an efficient route<br />
towards a renewable energy system. The ability to manage and operate the energy system in<br />
an efficient way and also to track environmental impacts and recycle ashes, etc. is improved<br />
through a more centralized production.<br />
5.2 <strong>Energy</strong> demands in <strong>Sweden</strong><br />
5.2 <strong>Energy</strong> demands in <strong>Sweden</strong><br />
ENERGY SCENARIO <strong>2050</strong> 65<br />
The The demand demand curve curve results results from from calculating calculating the energy the energy services services assessed assessed and existing and existing technology<br />
technology in the model. in the The model. demands The demands curve does curve not does necessarily not necessarily correspond correspond exactly exactly with the with supply<br />
the curve. supply The curve. non-overlapping The non-overlapping parts of the parts supply of the curve supply are surpluses curve are and surpluses could <strong>for</strong> and example could<br />
be <strong>for</strong> exported. example The be demand exported. curve The demand <strong>for</strong> the Swedish curve <strong>for</strong> energy the Swedish system energy is presented system is in presented Figure 9. in<br />
Figure 9.<br />
450<br />
400<br />
350<br />
300<br />
250<br />
200<br />
150<br />
100<br />
50<br />
0<br />
2010 2020 2030 2040 <strong>2050</strong><br />
Figure 9: Total final energy demand in the Swedish energy system 2010-<strong>2050</strong> (TWh)<br />
Figure 9: Total final energy demand in the Swedish energy system 2010-<strong>2050</strong> (TWh)<br />
District heating and electricity are energy carriers and the mix in each of these two is presented<br />
District<br />
in Figure<br />
heating<br />
6<br />
and<br />
and<br />
electricity<br />
Figure 8. The<br />
are<br />
gradient<br />
energy carriers<br />
in point<br />
and<br />
2010<br />
the<br />
does<br />
mix<br />
not<br />
in each<br />
account<br />
of these<br />
<strong>for</strong> the<br />
two<br />
trend<br />
is<br />
seen<br />
presented<br />
in previous<br />
in Figure<br />
years.<br />
6<br />
Figure<br />
and Figure<br />
3 displays<br />
8. The<br />
the<br />
gradient<br />
relatively<br />
in<br />
steady<br />
point 2010<br />
energy<br />
does<br />
demand<br />
not account<br />
in <strong>Sweden</strong>,<br />
<strong>for</strong> the<br />
and<br />
the<br />
trend<br />
decrease<br />
seen<br />
will<br />
in previous<br />
represent<br />
years.<br />
a major<br />
Figure<br />
break<br />
3 displays<br />
in the trend.<br />
the relatively<br />
It should,<br />
steady<br />
however,<br />
energy<br />
be<br />
demand<br />
pointed<br />
in<br />
out<br />
that<br />
<strong>Sweden</strong>,<br />
this break,<br />
and the<br />
operationalised<br />
decrease will<br />
through<br />
represent<br />
the<br />
a major<br />
energy<br />
break<br />
efficiency<br />
in the trend.<br />
improvement<br />
It should,<br />
target<br />
however,<br />
of 20%,<br />
be<br />
is<br />
set<br />
pointed<br />
in European<br />
out that<br />
policy<br />
this<br />
(European<br />
break, operationalised<br />
Commission<br />
through<br />
2010a). Final<br />
the energy<br />
energy<br />
efficiency<br />
demand<br />
improvement<br />
in <strong>Sweden</strong> will<br />
be<br />
target<br />
reduced<br />
of<br />
by<br />
20%,<br />
33%<br />
is<br />
according<br />
set in European<br />
to the scenario.<br />
policy (European Commission 2010a). Final energy<br />
demand in <strong>Sweden</strong> will be reduced by 33% according to the scenario.<br />
5.2.1 Demand in the industry sector<br />
In the industry sector a number of initiatives <strong>for</strong> energy efficiency improvement have taken<br />
place, but the scenario pushes this even further in order to reduce the energy needed without<br />
reducing production. The demand curve <strong>for</strong> the industry is found in Figure 10.<br />
61<br />
Oil products<br />
Coal and coke<br />
Natural gas, gasworks gas<br />
Geo heat to heat pumps<br />
Solar heat<br />
Biofuels (liquid/gases)<br />
Black liquors<br />
Solid bioenergy<br />
District heating<br />
Electricity
5.2.1 Demand in the industry sector<br />
Figure 10: 10: Total final energy demand in in the the Swedish Swedish industry industry sector sector 2010-<strong>2050</strong> 2010-<strong>2050</strong> (TWh) (TWh)<br />
ENERGY SCENARIO <strong>2050</strong> 66<br />
In the industry sector a number of initiatives <strong>for</strong> energy efficiency improvement have taken<br />
place, but the scenario pushes this even further in order to reduce the energy needed<br />
without reducing production. The demand curve <strong>for</strong> the industry is found in Figure 10.<br />
160<br />
140<br />
120<br />
100<br />
80<br />
60<br />
40<br />
20<br />
0<br />
2010 2020 2030 2040 <strong>2050</strong><br />
District District heating heating and and electricity are are energy energy carriers and and the the mix mix in in each each of of these these two two is pre- is<br />
sented presented in Figure in Figure 6 and 6 Figure and Figure 8. 8.<br />
The industrial sector in <strong>Sweden</strong> has a number of energy-intensive industries. In the scenario<br />
The industrial sector in <strong>Sweden</strong> has a number of energy-intensive industries. In the<br />
we have not considered major changes in the production mix. Changes and shifts in the<br />
scenario we have not considered major changes in the production mix. Changes and shifts<br />
type of production found in <strong>Sweden</strong>, <strong>for</strong> example that the paper industry shuts down, would<br />
in the type of production found in <strong>Sweden</strong>, <strong>for</strong> example that the paper industry shuts<br />
have great consequences <strong>for</strong> society and also the demand and supply side of the energy sys-<br />
down, would have great consequences <strong>for</strong> society and also the demand and supply side of<br />
tem. The paper and pulp industry is energy intensive with a high energy demand. But these<br />
the energy system. The paper and pulp industry is energy intensive with a high energy<br />
industries also generate electricity and surplus heat is sometimes fed into district heating<br />
demand. But these industries also generate electricity and surplus heat is sometimes fed<br />
systems. In the scenario it is proposed that biorefineries be introduced in the paper and pulp<br />
into district heating systems. In the scenario it is proposed that biorefineries be introduced<br />
industry. The solution proposed includes utilizing the surplus heat <strong>for</strong> district heating hence<br />
in the paper and pulp industry. The solution proposed includes utilizing the surplus heat<br />
the industries will become highly integrated with the energy system. In order <strong>for</strong> this option<br />
<strong>for</strong> district heating hence the industries will become highly integrated with the energy<br />
to be feasible there is a need to mutually ensure security in terms of energy deliveries, as well<br />
system. In order <strong>for</strong> this option to be feasible there is a need to mutually ensure security in<br />
as price mechanisms.<br />
terms of energy deliveries, as well as price mechanisms.<br />
5.2.2 Demand in the transport sector<br />
The 5.2.2 transport Demand sector displays in the transport a high dependence sector on fossil fuels today. This means that in<br />
order to reach the targets <strong>for</strong> <strong>2050</strong> a number of transitions in terms of sources of energy are<br />
needed. The transport In addition sector the displays transportation a high dependence technology on options fossil fuels display today. large This variations means that in terms in<br />
of order need <strong>for</strong> to reach energy the to targets supply <strong>for</strong> the <strong>2050</strong> same a number energy service of transitions i.e. the in transport terms of of sources an item of from energy a to<br />
b. are Thus needed. to supply In addition a certain the transport transportation a shift technology from technologies options that display require large a variations high input in of<br />
energy per transport work to more efficient is desired. Some types of transport are, however,<br />
difficult to shift as the infrastructure is not present or it is not technically feasible. The energy<br />
demands in the transportation sector are found in Figure 11<br />
62<br />
Oil products<br />
Coal and coke<br />
Natural gas, gasworks<br />
Biofuels (gases)<br />
Biofuels (liquid)<br />
Solid bioenergy<br />
Black liquors<br />
District heating<br />
Electricity
terms of need <strong>for</strong> energy to supply the same energy service i.e. the transport of an item<br />
from a to b. Thus to supply a certain transport a shift from technologies that require a high<br />
input of energy per transport work to more efficient is desired. Some types of transport<br />
ENERGY SCENARIO <strong>2050</strong> 67<br />
are, however, difficult to shift as the infrastructure is not present or it is not technically<br />
feasible. The energy demands in the transportation sector are found in Figure 11.<br />
120<br />
100<br />
80<br />
60<br />
40<br />
20<br />
0<br />
2010 2020 2030 2040 <strong>2050</strong><br />
Figure 11: 11: Total Total final final energy demand in the Swedish transport sector sector 2010-<strong>2050</strong> (TWh). (TWh). Petrol Petrol and and<br />
diesel categories are are here here pure pure fossil fossil sources, sources, the low-blend the low-blend content is content found in is biofuels found (liquid). in biofuels (liquid).<br />
The The supply mix mix found in electricity in electricity is presented is presented in in Figure 6. In 6. Figure In Figure 11 the 11 categories the categories petrol<br />
and petrol diesel and are diesel in a pure are in <strong>for</strong>m a pure and <strong>for</strong>m the low-blend and the low-blend content with content renewable with renewable origin is found origin in is the<br />
category found in biofuels the category (liquid). biofuels (liquid).<br />
The The policy policy goal goal of a fossil-independent of a fossil-independent transportation transportation fleet in fleet <strong>Sweden</strong> in <strong>Sweden</strong> in 2030 (Regerings- in 2030<br />
kansliet (Regeringskansliet 2008a) is interpreted 2008a) is interpreted as meaning as that meaning vehicles that at vehicles this point at this use point flex use fuel flex and fuel could<br />
there<strong>for</strong>e and could be there<strong>for</strong>e operated be on biofuels operated where on biofuels these are where present. these The are production present. The of production biofuels in of <strong>Sweden</strong><br />
biofuels has, according in <strong>Sweden</strong> to has, the according assumptions to the in assumptions the scenario, in not the really scenario, taken not off really at this taken point. off at The<br />
reason this point. is that The the reason technical is that route the technical <strong>for</strong> biofuel route production <strong>for</strong> biofuel anticipated production anticipated involves large involves investments<br />
large in investments the pulp and in paper the pulp industry. and paper In the industry. process In of achieving the process these of investments achieving these there<br />
are investments a number there of challenges are a number linked of to challenges create business linked to models create that business handle models the complexity that handle of<br />
biorefineries. the complexity of biorefineries.<br />
The scenario does not include cars and other vehicles operating on hydrogen, e.g. by using<br />
The<br />
fuel<br />
scenario<br />
cells. We<br />
does<br />
do<br />
not<br />
not<br />
include<br />
exclude<br />
cars<br />
this<br />
and<br />
technology<br />
other vehicles<br />
trajectory<br />
operating<br />
as a<br />
on<br />
solution<br />
hydrogen,<br />
in<br />
e.g.<br />
the<br />
by<br />
future<br />
using<br />
(<strong>for</strong><br />
a<br />
fuel<br />
review<br />
cells.<br />
of<br />
We<br />
backcasts<br />
do not<br />
and<br />
exclude<br />
<strong>for</strong>ecasts<br />
this technology<br />
towards a hydrogen<br />
trajectory<br />
economy<br />
as a solution<br />
see McDowall<br />
in the future<br />
and<br />
(<strong>for</strong><br />
Eames<br />
a<br />
2006).<br />
review<br />
Electricity<br />
of backcasts<br />
is considered<br />
and <strong>for</strong>ecasts<br />
as<br />
towards<br />
being used<br />
a hydrogen<br />
in the process<br />
economy<br />
of<br />
see<br />
producing<br />
McDowall<br />
the<br />
and<br />
hydrogen,<br />
Eames<br />
so<br />
the<br />
2006).<br />
hydrogen<br />
Electricity<br />
cum<br />
is<br />
fuel<br />
considered<br />
could be<br />
as<br />
seen<br />
being<br />
as<br />
used<br />
storage<br />
in the<br />
<strong>for</strong><br />
process<br />
electricity.<br />
of producing<br />
If the technology<br />
the hydrogen,<br />
becomes<br />
so<br />
accessible<br />
the hydrogen<br />
and the<br />
cum<br />
infrastructure<br />
fuel could be<br />
the<br />
seen<br />
production<br />
as storage <strong>for</strong><br />
and<br />
electricity.<br />
distribution<br />
If the<br />
of hydrogen<br />
technology<br />
is<br />
becomes<br />
developed<br />
then<br />
accessible<br />
this option<br />
and the<br />
might<br />
infrastructure<br />
play a role<br />
the<br />
in supplying<br />
production<br />
transport<br />
and distribution<br />
services<br />
of<br />
(a<br />
hydrogen<br />
discussion<br />
is<br />
of<br />
developed<br />
the hydrogen<br />
economy and EU is given in Bleischwitz and Bader 2010).<br />
The available statistics in <strong>Sweden</strong> on the transport of people are divided into long distance<br />
journeys and short distance journeys (less than 100 km) (Åkerman et al. 2000; Åkerman and<br />
Höjer 2006). In the scenario all journeys that are included are within the Swedish border.<br />
63<br />
Kerosene<br />
Oil <strong>for</strong> shipping<br />
Petrol<br />
Diesel<br />
Natural gas<br />
Biofuels (gases)<br />
Biofuels (liquid)<br />
Electricity<br />
Long distance journeys are to a great extent made by train, while car journeys in terms of<br />
person km are kept at present day levels (Table 14). Car journeys <strong>for</strong> short distance decrease,<br />
while there is still need to keep cars as an option <strong>for</strong> long distance journeys. Long distance<br />
journeys here are those travel services that cannot be satisfied through other, more energyefficient,<br />
transport technologies.
order. Long distance journeys are to a great extent made by train, while car journeys in<br />
terms of person km are kept at present day levels (Table 14). Car journeys <strong>for</strong> short<br />
distance decrease, while there is still need to keep cars as an option <strong>for</strong> long distance<br />
journeys. Long distance journeys here are those travel services that cannot be satisfied<br />
through other, more energy-efficient, transport technologies.<br />
ENERGY SCENARIO <strong>2050</strong> 68<br />
5.2.3 Demand in the household and service sector<br />
5.2.3 Demand in the household and service sector<br />
A steady A steady reduction reduction of of energy energy demand in in the household sector is is needed to to reach reach the the targets targets<br />
<strong>for</strong> <strong>for</strong> <strong>2050</strong>. <strong>2050</strong>. The The household household and and service sector is is already in in 2010 not not very very dependent dependent on on fossil fossil<br />
energy energy sources. sources. Oil Oil <strong>for</strong> <strong>for</strong> heating heating has has been been reduced reduced drastically drastically since since the the 70s 70s and and compared compared with<br />
many with other many European other European countries countries heat pumps heat pumps contribute contribute a substantial a substantial part part of of heating heating in in the<br />
sector. the sector.<br />
160<br />
140<br />
120<br />
100<br />
80<br />
60<br />
40<br />
20<br />
0<br />
2010 2020 2030 2040 <strong>2050</strong><br />
Figure 12: 12: Total final energy demand in in the the Swedish household and service and service sector 2010-<strong>2050</strong> sector 2010-<strong>2050</strong> (TWh) (TWh)<br />
District District heating and and electricity are are energy carriers and and the the mix mix in in each each of of these these two two is pre- is<br />
sented presented in Figure in Figure 6 and 6 Figure and Figure 8. The 8. The category category labelled labelled “heat ―heat pumps pumps (extracted (extracted heat)” heat)‖ in in Figure<br />
Figure 12 is the 12 is heat the that heat is that extracted is extracted from the from heat the sink heat used sink by used the by heat the pump. heat pump. This category This<br />
is category seldom found is seldom in statistics found in as statistics it is free as energy. it is free As a energy. consequence As a consequence going from direct going electric from<br />
heating direct to electric heat pump heating would to heat look pump like a would reduction look in like energy a reduction demands in energy in the demands house <strong>for</strong> in heating the<br />
as house less electricity <strong>for</strong> heating is used. as less In electricity fact no change is used. in In energy fact no demand change <strong>for</strong> in energy heating demand has been <strong>for</strong> made, heating but<br />
the has technology been made, to but supply the technology the energy to service supply has the changed. energy service The suggested has changed. path The is to suggested both look<br />
into reduction of energy demand in the house and to apply an efficient technology to supply<br />
the required energy service. In Figure 12 the electricity used <strong>for</strong> operating the heat pump is<br />
part of the electricity demand.<br />
64<br />
Oil<br />
Natural gas,<br />
gasworks gas<br />
Heat pumps<br />
(extracted heat)<br />
Solid bioenergy<br />
Solar heat<br />
District heating<br />
Electricity
5.3 Emissions of greenhouse gases<br />
ENERGY SCENARIO <strong>2050</strong> 69<br />
path is to both look into reduction of energy demand in the house and to apply an efficient<br />
technology to supply the required energy service. In Figure 12 the electricity used <strong>for</strong><br />
operating the heat pump is part of the electricity demand.<br />
5.3 Emissions of greenhouse gases<br />
From the supply scenario it is possible to calculate the corresponding emissions of GHG. The<br />
curve From in the Figure supply 13 is scenario based on it static is possible emission to calculate factors the linked corresponding to each source. emissions of GHG.<br />
The curve in Figure 13 is based on static emission factors linked to each source.<br />
Million ton CO 2<br />
90<br />
80<br />
70<br />
60<br />
50<br />
40<br />
30<br />
20<br />
10<br />
0<br />
1980 1990 2000 2010 2020 2030 2040 <strong>2050</strong><br />
Actual<br />
<strong>Scenario</strong><br />
Target (40% reduction)<br />
Figure Figure 13: 13: Total Total energy-related carbon carbon dioxide dioxide emissions, emissions, actual actual emissions emissions 1980-2009 1980-2009 (Energimyndigheten<br />
(Energimyndigheten<br />
2010b) 2010b) and scenario and scenario emissions emissions based on static based emission on static factors emission (Naturvårdsverket factors (Naturvårdsverket 2011) (Million 2011) ton<br />
(Million CO2) ton CO2)<br />
When When not not accounting <strong>for</strong> <strong>for</strong> carbon carbon dioxide dioxide emissions emissions from from renewable renewable energy energy sources, sources, i.e. these i.e.<br />
are these assumed are assumed as zero as emitters, zero emitters, reduction reduction in emissions in emissions follows follows the reduction the reduction in use in use of fossil of<br />
energy fossil in energy the energy in the energy system. system. In <strong>2050</strong> In the <strong>2050</strong> emissions the emissions are dominated are dominated by the by emissions the emissions from<br />
coal from and coal coke in and the coke steel in industry. the steel In industry. 2030 the reduction, In 2030 the compared reduction, to 1990 compared emissions to 1990 levels,<br />
has emissions been halved levels, and has in <strong>2050</strong> been the halved carbon and dioxide in <strong>2050</strong> emission the carbon is about dioxide 8 million emission ton is COabout 2. 8<br />
million ton CO2. In <strong>Sweden</strong> the environmental movement have argued that drastic cuts in emissions are<br />
needed In <strong>Sweden</strong> by 2020 the in environmental order to avoid movement climate effects have that argued would that result drastic in temperature cuts in emissions rise above are<br />
2°C needed (Naturskyddsföreningen by 2020 in order to 2007; avoid WWF climate 2007a; effects WWF that 2007b). would The result proposed in temperature level of emis- rise<br />
sions above reduction 2°C (Naturskyddsföreningen has been 40% domestic 2007; reduction WWF by 2007a; 2020. WWF This is 2007b). in line The with proposed what the level international<br />
of emissions environmental reduction community, has been 40% a range domestic of scientists reduction and by 2020. others This argue is in to line be a with minimum what<br />
level the <strong>for</strong> international developed environmental countries in order community, to be able a range to tackle of scientists the climate and others effects argue (WWF to 2007c; be a<br />
CAN minimum International level <strong>for</strong> 2009). developed In the countries scenario the in order reduction to be will able be to almost tackle 30% the climate in 2020 effects as compared<br />
(WWF to 1990 2007c; emission CAN International levels. This means 2009). that In the another scenario 6 million the reduction ton (mega will ton) be almost of CO2 30% in domestic<br />
in 2020 emissions as compared needs to to 1990 be further emission cut levels. by 2020 This to means reach this that goal. another The 6 focus million on ton this (mega report<br />
and scenario has been on achieving 100% renewable energy within the Swedish ecosystem<br />
capacity by <strong>2050</strong> at the latest and not specifically on how to reduce emissions 40% by 2020<br />
compared to 1990. Based on the scenario there are some general comments and suggestions<br />
on how to stimulate a process that would also reach this 40% reduction goal. For example<br />
there is need <strong>for</strong> pushing introduction of new 65 technologies, innovation and alternative energy<br />
carriers, as well as stimulating changes in consumption (the demand side).
ENERGY SCENARIO <strong>2050</strong> 70<br />
Fossil fuels are predominant in the transport sector and the industry sector and it is here<br />
that targeted short-term actions are needed. In the transport sector a stronger push to<br />
create a domestic biofuel production with targeted actions to substitute fossil energy would<br />
have impact on emission levels. The 6 Mton reduction is roughly equal to substituting 20<br />
TWh of fossil oil (30% of the fossil energy used in the transport sector 2020 according to<br />
the scenario). The industry (including steel industry) could also push <strong>for</strong> emission savings<br />
in different ways. For example bring investments in new and more efficient processes and<br />
implement energy efficiency work earlier in time would have an impact. It could be tempting<br />
to solve the target of 40% reduction with an increased import of biofuels while waiting<br />
<strong>for</strong> a domestic production to be established. This would, however, result in a substantially<br />
increased ecological footprints from Swedish consumption in other parts of the world (WWF<br />
2010) which is not in line with the point of departure in this scenario.<br />
However, changes, especially decreased transport, demands would generally result in a decreased<br />
use of fossil energy. The scenario considered changes in these variables towards more<br />
efficient transportation means, but not considered drastic cuts in the demand of transport<br />
services. There lies a large potential towards reaching the ambition of the scenario in adjusting<br />
the demand side. This would, however, create a number questions linked to how this<br />
would effect, or be affected by, changes in production and economic activities in general.<br />
Further work with stimulating introducing energy efficient technology and energy efficiency<br />
work would have an effect. The scenario already assumes relatively high levels of reductions<br />
in energy demand per service demand.<br />
The emissions described in Figure 13 are based on a static calculation method. This approach<br />
to carbon emission assessment is beginning to be disputed as it will not encompass the whole<br />
complex of effects that will occur as a consequence of changing the land use to start or expanding<br />
the production of biofuels (Fargione et al. 2008; Olsson 2009; Olsson 2010; Zanchi<br />
et al. 2010; McKechnie et al. 2011).<br />
For renewable energy sources one of the consequences of the static approach is that the carbon<br />
accumulated in the biomass (terrestrial carbon) will per default be seen as re-accumulated<br />
in the standing biomass in the end of the time, hence resulting in a zero net emission. It is<br />
well known, however, that emissions tend to change over time. In the case of bioenergy this<br />
is an issue <strong>for</strong> concern as the rotation times can be long and substantial amounts of carbon<br />
is stored in the biomass, especially <strong>for</strong>ests. Depending on how the biomass resources are<br />
managed the net emissions of carbon to the atmosphere as well as the accumulated carbon<br />
in the atmosphere will change.<br />
A special assessment of the emissions linked to the solid biofuel category branches and tops<br />
based on a dynamic perspective were carried out <strong>for</strong> the energy scenario presented in this<br />
report (detailed calculation and background is found in appendix 1).<br />
The solid biomass resource will to a great extent be used to substitute diesel and petroleum<br />
in the transport sector. Thus comparing the dynamic emissions with oil is representative.
A special assessment of the emissions linked to the solid biofuel category branches and<br />
tops based on a dynamic perspective were carried out <strong>for</strong> the energy scenario presented in<br />
this report (detailed calculation and background is found in appendix 1).<br />
ENERGY SCENARIO <strong>2050</strong> 71<br />
The solid biomass resource will to a great extent be used to substitute diesel and petroleum<br />
in the transport sector. Thus comparing the dynamic emissions with oil is representative.<br />
Based on on calculated calculated emissions emissions and and the decay the decay function, function, the remaining the remaining amount amount of atmospher- of<br />
ic atmospheric carbon is calculated carbon is and calculated presented and in presented Figure 14, in expressed Figure 14, in expressed Mton COin 2 (see Mton appendix CO2 (see 1 <strong>for</strong><br />
a appendix detailed presentation 1 <strong>for</strong> a detailed of presentation the calculations). of the calculations).<br />
Mton CO2<br />
140<br />
120<br />
100<br />
80<br />
60<br />
40<br />
20<br />
0<br />
Figure 14: Remaining carbon dioxide in the atmosphere based on the tops and branches variable in<br />
Figure 14: Remaining carbon dioxide in the atmosphere based on the tops and branches variable in the<br />
the renewable energy scenario. Oil is used as a comparison.<br />
renewable energy scenario. Oil is used as a comparison.<br />
A consequence of using bioenergy or oil will be an increase in the atmospheric concentrations<br />
A consequence of CO2. Using of tops using and bioenergy branches <strong>for</strong> or energy oil will instead be an of increase leaving in them the on atmospheric the ground to<br />
decompose concentrations leads of to CO net 2. emissions Using tops of and carbon branches dioxide <strong>for</strong> to energy the atmosphere. instead of leaving The reason them on <strong>for</strong> the this is<br />
the ground time lag to decompose between combustion-related leads to net emissions emissions of carbon compared dioxide to the to the emissions atmosphere. from decom- The<br />
position. reason <strong>for</strong> If tops this and is the branches time lag begin between to be combustion-related used in 2010 and follow emissions the scenario compared presented to the in<br />
section emissions 4.4 from Bioenergy, decomposition. waste and If peat, tops remaining and branches atmospheric begin to be carbon used in will 2010 be and 48 Mton follow CO2<br />
in the the scenario year <strong>2050</strong>. presented If oil in is section used instead 4.4, remaining as a comparative atmospheric source carbon <strong>for</strong> will energy be 48 throughout Mton CO2 the<br />
whole in the period, year <strong>2050</strong>. remaining If oil is atmospheric used instead carbon as a comparative will be 126 source Mton <strong>for</strong> CO2<br />
energy in the throughout year <strong>2050</strong>. the Using<br />
<strong>for</strong>est whole residues period, remaining such as tops atmospheric and branches carbon leads will to be an 126 increase Mton in COatmospheric 2 in the year carbon <strong>2050</strong>. Using dioxide,<br />
but <strong>for</strong>est using residues oil would such increase as tops atmospheric and branches carbon leads dioxide to an increase significantly in atmospheric more. The important carbon<br />
thing dioxide, to remember but using oil here would is that increase the calculations atmospheric above carbon describe dioxide a situation significantly of more. change The (from<br />
zero use of tops and branches to 19 TWh in 2010) which causes the rapid increase in the first<br />
years. If the aim is to tackle climate change and to reduce carbon emissions, changes in use<br />
of bioenergy will have impacts as described above. Different bioenergy will have different<br />
characteristics and the calculations here are valid <strong>for</strong> tops and branches from Swedish <strong>for</strong>-<br />
67<br />
estry specifically.<br />
Using tops and branches as a bioenergy source will have an impact on the net emissions of<br />
carbon dioxide to the atmosphere. However, if substituting oil, tops and branches will reduce<br />
the global net carbon dioxide emissions significantly. Still, biomass resources if used as a<br />
fuel will result in substantial emissions of terrestrial carbon dioxide and there are reasons<br />
to consider this when creating support structures and regulations of various biofuels. There<br />
might, <strong>for</strong> example, be other biomass alternatives that are even more beneficial <strong>for</strong> climate<br />
mitigation. For instance, the establishment of new <strong>for</strong>est on earlier crop land is likely to<br />
reduce atmospheric carbon and would have a net cooling effect (Zetterberg and Chen 2011).<br />
Oil<br />
Tops and branches
5.4 Rebound effects<br />
ENERGY SCENARIO <strong>2050</strong> 72<br />
The scenario is dependent on energy efficiency improvement activities taking place in the<br />
whole community. To put it in simple terms – the demand side peg does not fit into the<br />
supply side hole. There is thus a need to reduce the demand <strong>for</strong> energy in society and in<br />
production. To do this, energy efficiency improvement is promoted in all sectors. Most of<br />
this is made on market conditions, some of it will require support and regulation in order to<br />
happen but there is no doubt a huge potential.<br />
<strong>Energy</strong> efficiency improvement is often linked with the concept of the rebound effect (Gillingham<br />
et al. 2006; Herring 2006; Sanne 2006; Herring and Roy 2007; Gillingham et al. 2009;<br />
Madlener and Alcott 2009; Ehrhardt-Martinez and Laitner 2010; CAN Europe 2011). Rebound<br />
effects are effects that happen as a consequence of resources being made available<br />
after applying the energy efficiency improvement measure. Some of these rebound effects<br />
could reduce the positive impacts that the efficiency measures resulted in. There are both<br />
indirect and direct rebound effects; only the direct effects are possible to measure (Sanne<br />
2006). The discussion on the rebound effects tends on the one hand to address the matter<br />
from a theoretical point of view, and on the other hand based on empirical evidence. According<br />
to a review by Gillingham et al. (2006) the tendency was that criticism of the efficacy<br />
of energy efficiency improvement related to appliance standards was based on theoretical<br />
reasoning, while empirical studies tended to support the positive impacts from appliance<br />
standards. Sorrel et al. (2009) conclude that the direct rebound effects in energy efficiency<br />
improvement within household energy services in the OECD should in general be less than<br />
30%. The problem is to assess the magnitude of the rebound effects in relation to the energy<br />
efficiency improvement effect and to minimize these effects.<br />
To minimize the rebound effects there is need <strong>for</strong> targeted actions. The driving <strong>for</strong>ce that<br />
results in the rebound effect is that the saving creates a surplus of resources compared to the<br />
previous situation. For example, if you save on fuel costs as a consequence of a more efficient<br />
car, the result according to the rebound effect would be that you drive longer with your car<br />
and thus the saving from the energy efficiency improvement in the transport work is not as<br />
large as it could have been. Sanne (2006) discusses how to manage and minimize rebound<br />
effects and puts this into the context of handling surplus. Sanne puts <strong>for</strong>th four different<br />
approaches that are interlinked but which focus on different aspects of the ability to manage<br />
surplus:<br />
1. Regulate with money: Stimulate consumption towards a less damaging direction<br />
through monetary regulations.<br />
2. Remove resources, distribution of wealth: Remove resources from the own economic<br />
system in order to reduce the negative impacts from increased consumption. One<br />
example is increased development assistance.<br />
3. Invest in sustainable development: Use surplus to invest in strengthening the natural<br />
capital and improving ecosystem services to support long-term sustainability.<br />
4. Societal norms and values: Stimulating and steering production to become more sustainable<br />
and create human wellbeing rather than economic growth.
ENERGY SCENARIO <strong>2050</strong> 73<br />
These aspects are problematic in the sense that they conflict with general assumptions on<br />
economic growth and the creation of wealth. At the same time they focus on the need to link<br />
management of the surplus with energy efficiency improvement activities. In the case of the<br />
scenario presented in this report, the surplus is used to invest in sustainable development.<br />
Hence the energy that is “freed up” through energy efficiency improvement work is used to<br />
substitute fossil energy, as well as to manage the renewable energy sources within the carrying<br />
capacity of the ecosystem. This cannot be achieved unless regulations and stimulation of<br />
these processes are present.<br />
In this report the focus is set on the input parameters in terms of energy needed to per<strong>for</strong>m<br />
a certain energy service. The technology options, societal structures and feedback structures<br />
to users and producers are qualitative aspects linked to this variable. In the scenario rebound<br />
effects are supposed to be strategically managed in order to take advantage of the decrease in<br />
demand that the energy efficiency improvement creates. The assumption is that there is no<br />
direct surplus in the system, but rather a push to decrease the demand. Societal regulations<br />
and driving <strong>for</strong>ces are needed in order to make this happen.
<strong>Energy</strong> <strong>Scenario</strong> <strong>2050</strong> IVL report<br />
6 6 Cost and policy policy overview overview<br />
ENERGY SCENARIO <strong>2050</strong> 74<br />
This section aims to evaluate costs related to the measures put <strong>for</strong>th in the scenario, with a<br />
focus on the investments required to realize the scenario’s main trends11 This section aims to evaluate costs related to the measures put <strong>for</strong>th in the scenario, with a<br />
focus on the investments required to realize the scenario‘s main trends . The cost of each<br />
trend is compared to other costs in the sector that can be related to, and in some instances<br />
avoided by, realizing the scenario. It also includes a brief discussion on policy aspects of promoting<br />
these investments. The evaluation does not aim to include a comprehensive analysis<br />
of the total costs associated with realizing the required investments, but the overview is<br />
rather aimed at providing a reflection on the reasonability of the scenario from a financial<br />
and economic point of view. Hence the focus on the main trends, which puts an emphasis on<br />
the costs of increasing energy efficiency (EE) in the industry and building sectors, increasing<br />
the use of biofuels in the industry sector, increasing rail transports and new road vehicles,<br />
and biofuels and renewable energy sources (RES) on the supply side (Figure 15).<br />
11 . The cost of each<br />
trend is compared to other costs in the sector that can be related to, and in some instances<br />
avoided by, realizing the scenario. It also includes a brief discussion on policy aspects of<br />
promoting these investments. The evaluation does not aim to include a comprehensive<br />
analysis of the total costs associated with realizing the required investments, but the<br />
overview is rather aimed at providing a reflection on the reasonability of the scenario from<br />
a financial and economic point of view. Hence the focus on the main trends, which puts an<br />
emphasis on the costs of increasing energy efficiency (EE) in the industry and building<br />
sectors, increasing the use of biofuels in the industry sector, increasing rail transports and<br />
new road vehicles, and biofuels and renewable energy sources (RES) on the supply side<br />
(Figure 15).<br />
Main trends<br />
Industry<br />
Transport<br />
Buildings<br />
Supply side<br />
Figure 15: Main trends in the scenario <strong>for</strong> the transition towards a fossil-free society<br />
Figure 15: Main trends in the scenario <strong>for</strong> the transition towards a fossil-free society<br />
An important question in this section is who will carry the costs of the energy system‘s<br />
An<br />
transition.<br />
important<br />
This<br />
question<br />
includes<br />
in this<br />
the question<br />
section is<br />
of<br />
who<br />
whether<br />
will carry<br />
these<br />
the<br />
investments<br />
costs of the<br />
are<br />
energy<br />
motivated<br />
system’s<br />
and<br />
transition.<br />
feasible<br />
This<br />
<strong>for</strong> those<br />
includes<br />
who<br />
the<br />
will<br />
question<br />
implement<br />
of whether<br />
them.<br />
these<br />
An aspect<br />
investments<br />
equally<br />
are<br />
as<br />
motivated<br />
important<br />
and<br />
as the<br />
feasible<br />
monetary<br />
<strong>for</strong> those<br />
evaluation,<br />
who will<br />
within<br />
implement<br />
the scope<br />
them.<br />
of<br />
An<br />
this<br />
aspect<br />
section,<br />
equally<br />
is there<strong>for</strong>e<br />
as important<br />
whether<br />
as<br />
the<br />
the<br />
measures<br />
monetary<br />
evaluation,<br />
include commercial<br />
within the scope<br />
technologies<br />
of this section,<br />
or are<br />
is<br />
associated<br />
there<strong>for</strong>e<br />
with<br />
whether<br />
public<br />
the<br />
spending<br />
measures<br />
on<br />
include<br />
research,<br />
commercial<br />
development<br />
technologies<br />
and demonstration<br />
or are associated<br />
(RD&D).<br />
with public<br />
This introduces<br />
spending on<br />
the<br />
research,<br />
question<br />
development<br />
of which policy<br />
and<br />
demonstration (RD&D). This introduces the question of which policy instruments will be<br />
required to provide financing and incentivisation so as to promote the necessary measures<br />
and investments.<br />
11 Exchange rates used: SEK/USD = 7; SEK/Euro = 10.<br />
11 Exchange rates used: SEK/USD = 7; SEK/Euro = 10.<br />
70<br />
Improved EE<br />
Increased use of renewables<br />
Shift towards rail transports<br />
New road vehicles<br />
Improved EE in residential buildings<br />
Improved EE in commercial buildings<br />
Biofuels<br />
Wind power<br />
Solar energy
6.1 Costs<br />
ENERGY SCENARIO <strong>2050</strong> 75<br />
The overview of costs has been carried out similarly to that of the WWF’s international analysis<br />
(Deng et al. 2011), so as to provide a possibility <strong>for</strong> comparisons. This includes, inter<br />
alia, that the analysis mainly account <strong>for</strong> costs during the year in which the investments<br />
occur, thus excluding the financial analyses commonly associated with long-term decisionmaking.<br />
The two differ, however, in the sense that this report focuses on an overview of main<br />
trends, while the counterpart carried out a cost analysis <strong>for</strong> all costs and savings. Moreover,<br />
it should be highlighted that the calculations herein do not provide an analysis of the most<br />
cost-efficient way to reach the scenario. Furthermore, as the project has focused on producing<br />
a scenario on required measures and not a business-as-usual scenario, the cost evaluation<br />
does not include potential savings due to development. However, costs are compared to<br />
other relevant costs <strong>for</strong> each main trend.<br />
Other aspects of the evaluation are that we do not include any costs <strong>for</strong> the decreased use of<br />
any particular energy carrier. We disregard the influence of policy instruments as the effect,<br />
or even presence, of these up to <strong>2050</strong> is deemed to be associated with too large uncertainties.<br />
We do not calculate <strong>for</strong> any changes in industrial or building energy use until existing<br />
technologies have reached their economic life-time, i.e. no costs are associated with reducing<br />
the use of a specific fuel in these sectors.<br />
While we have aimed at finding Swedish data <strong>for</strong> the calculations, this has proven difficult.<br />
The results should there<strong>for</strong>e be interpreted with international differences in mind.<br />
6.1.1 Industry<br />
Industrial energy efficiency improvements do not affect the use of electricity to any great<br />
extent but rather reduce the need to introduce RES as replacing existing use of fossil fuels.<br />
Regarding economic evaluations of energy efficiency improvement investments, they commonly<br />
indicate easily-obtained gains and cost-negative or cost-neutral measures (i.e. having<br />
positive or neutral economic effects <strong>for</strong> the company). Calculating costs <strong>for</strong> energy efficiency<br />
improvements <strong>for</strong> Swedish industry is difficult in the light of a large array of measures that<br />
can be carried out. Nevertheless, the SEK 708 million invested under PFE has resulted in<br />
savings of 1.45 TWh, pointing to an average energy efficiency improvement cost of 0.5 SEK/<br />
kWh. While this corresponds to the electricity tax avoided and consequently must be considered<br />
from this economic perspective, it points to significant energy efficiency improvement<br />
potential at low costs.<br />
WWF’s international energy scenario estimates that the increased costs arising from easilyobtained<br />
gains and decreased costs due to learning effects will level each other out, which<br />
would mean that this cost situation would be constant. However, the Swedish industry sector<br />
is often regarded as having high energy efficiency compared to its international counterparts,<br />
which could point to a different situation in <strong>Sweden</strong>. Yet technological development is<br />
seen to provide continuous cost efficiency potentials, which is also supported by an expected<br />
development where fuel prices and environmental policy instruments increase the benefit of<br />
energy efficiency improvement investments.
would mean that this cost situation would be constant. However, the Swedish industry<br />
sector is often regarded as having high energy efficiency compared to its international<br />
counterparts, which could point to a different situation in <strong>Sweden</strong>. Yet technological<br />
ENERGY SCENARIO <strong>2050</strong> 76<br />
development is seen to provide continuous cost efficiency potentials, which is also<br />
supported by an expected development where fuel prices and environmental policy<br />
instruments increase the benefit of energy efficiency improvement investments.<br />
The introduction of additional RES in the industry sector is is seen seen as as mainly associated with with<br />
heat production, even though other RES are needed <strong>for</strong> <strong>for</strong> the the industry in addition. in addition. The The costs costs<br />
<strong>for</strong> <strong>for</strong> this transition are based on on IEA’s IEA‘s <strong>Energy</strong> <strong>Energy</strong> Technology Perspectives, which which over over the the period<br />
to period <strong>2050</strong> to identify <strong>2050</strong> identify the costs the of costs different of different options options as constant as constant in the range in the 0.10-0.48 range 0.10-0.48 SEK/kWh<br />
(IEA SEK/kWh 2008). No (IEA learning 2008). No effects learning are included effects are that included exceed that this exceed price range. this price As drawn range. from As a<br />
global drawn energy from a technology global energy outlook, technology the figures outlook, do not the specifically figures do not represent specifically the costs represent in <strong>Sweden</strong><br />
the but costs may in <strong>Sweden</strong> nevertheless but may be seen nevertheless as relevant be seen in light as relevant of a diverse in light national of a diverse industry national sector.<br />
industry sector.<br />
MSEK<br />
3 000<br />
2 500<br />
2 000<br />
1 500<br />
1 000<br />
500<br />
0<br />
2010-2020 2020-2030 2030-2040 2040-<strong>2050</strong><br />
Figure 16: Costs of increasing biofuels biofuels in industry in industry per decade per decade<br />
The total costs <strong>for</strong> the industrial transition would range range between 2,200 2,200 MSEK MSEK and and 10,000 10,000<br />
MSEK with an an average cost range per annum of of 55-250 MSEK (Figure 16).<br />
In In a a comparison to the industry sector‘s sector’s carbon carbon dioxide dioxide taxes taxes during during 2008 2008 of 2,000 of 2,000 MSEK MSEK<br />
(SCB (SCB 2011), 2011), switching switching to to RES RES provides provides economic economic benefits benefits <strong>for</strong> <strong>for</strong> the the industry sector sector (Figure 17).<br />
This 17). situation This situation is further is further improved improved if taking if taking lower lower prices prices <strong>for</strong> biofuels <strong>for</strong> biofuels than than fossil fossil fuels fuels into account.<br />
into account. Moreover, Moreover, while industry while industry currently currently receives receives carbon carbon dioxide dioxide tax subventions, tax subventions, the sectors<br />
the that sectors are that not are included not included under under the European the European Emission Emission Trading Trading Scheme Scheme (EU-ETS) (EU-ETS) will see<br />
these will see subventions these subventions decrease decrease and face and full face taxes full from taxes 2015. from However, 2015. However, the trading the sectors trading will<br />
receive sectors a will full receive tax deduction a full tax and deduction only face and the only emission face the rights emission prices rights of the prices EU-ETS. of the NevertheEUless, as many reports point towards increasing emission rights prices, the overall picture is<br />
that the industrial benefits of fuel-switching will improve.<br />
72<br />
Costs (low)<br />
Costs (high)
ENERGY SCENARIO <strong>2050</strong> 77<br />
ETS. Nevertheless, as many reports point towards increasing emission rights prices, the<br />
overall picture is that the industrial benefits of fuel-switching will improve.<br />
Transition to<br />
RES (biofuels)<br />
55-250<br />
MSEK<br />
Carbon dioxide<br />
taxes<br />
2 000<br />
MSEK<br />
Figure 17: Cost Figure comparison 17: Cost between comparison a transition between a transition to RES (biofuels) to RES (biofuels) and carbon and carbon dioxide dioxide tax costs tax costs per<br />
per annum annum<br />
6.1.2 Transport 6.1.2 Transport<br />
The main transport trends of the scenario are increased rail transports as well as the introduction<br />
of electric The main vehicles transport (EVs) <strong>for</strong> trends person of the transports scenario and are a increased transition rail towards transports renewable as well as the<br />
fuels, such as DME introduction or equivalent, of electric <strong>for</strong> goods vehicles transports (EVs) <strong>for</strong> by lorries, person as transports well as air and transport a transition and towards<br />
shipping. The renewable costs <strong>for</strong> increased fuels, such rail as transports DME or equivalent, are calculated <strong>for</strong> goods based transports on SIKA statistics by lorries, of as towell<br />
as air<br />
day’s costs <strong>for</strong> transport rail investments and shipping. plus operations The costs and <strong>for</strong> maintenance, increased rail and transports the increase are calculated in ton ki- based on<br />
lometres (tkm) SIKA and passenger statistics of kilometres today‘s costs (pkm) <strong>for</strong> (SIKA rail investments 2009a). Increasing plus operations the rail and transports maintenance, and<br />
is not seen to the include increase the deployment in ton kilometres of non-commercial (tkm) and passenger technologies kilometres at any large (pkm) scale. (SIKA 2009a).<br />
Increasing the rail transports is not seen to include the deployment of non-commercial<br />
The costs <strong>for</strong> freight rail transport (i.e. tkm) are calculated based on the share of tkm on rail-<br />
<strong>Energy</strong> <strong>Scenario</strong> <strong>2050</strong> technologies at any large scale.<br />
IVL report<br />
ways while the costs <strong>for</strong> pkm are based on the share of rail transports not associated with<br />
tkm (which <strong>for</strong><br />
The<br />
example<br />
costs <strong>for</strong><br />
includes<br />
freight<br />
trams<br />
rail transport<br />
and metros),<br />
(i.e. tkm)<br />
so as<br />
are<br />
to<br />
calculated<br />
accurately<br />
based<br />
reflect<br />
on<br />
the<br />
the<br />
increase<br />
share of tkm on<br />
and nature of<br />
railways<br />
freight versus<br />
while the<br />
person<br />
costs<br />
transports.<br />
<strong>for</strong> pkm are<br />
This<br />
based<br />
division<br />
on the<br />
is an<br />
share<br />
assumption<br />
of rail transports<br />
as the relative<br />
not associated<br />
costs <strong>for</strong> these<br />
with<br />
transports<br />
tkm (which<br />
may<br />
<strong>for</strong><br />
differ.<br />
example includes trams and metros), so as to accurately reflect the<br />
increase and nature of freight versus person transports. This division is an assumption as<br />
5 000<br />
the relative costs <strong>for</strong> these transports may differ.<br />
MSEK<br />
4 000<br />
3 000<br />
2 000<br />
1 000<br />
0<br />
2010-2020 2020-2030 2030-2040 2040-<strong>2050</strong><br />
Figure 18: Costs of increasing rail rail transports per decade per decade<br />
The result is is a total operational cost increase of of SEK SEK 23,000 million over over the the period period and and an an<br />
73<br />
average of of SEK 600 600 million per year. This can can be be compared to to the total costs of of operating the<br />
rail the system rail system in 2008 in 2008 of SEK of SEK 18,000 18,000 million million (SIKA (SIKA 2009a). 2009a). Seeing Seeing that that the the costs costs <strong>for</strong> <strong>for</strong> truck truck transtransports<br />
are typically three times that of rail transport, an increase in capacity, flexibility<br />
and reliability of the rail system should be the preferable development <strong>for</strong> transport<br />
consumers.<br />
tkm<br />
pkm
Figure 18: Costs of increasing rail transports per decade<br />
The result is a total operational cost increase of SEK 23,000 million over the period and an<br />
average of SEK 600 million per year. This can be compared to the total costs of operating<br />
the rail system in 2008 of SEK 18,000 million (SIKA 2009a). Seeing that the costs <strong>for</strong> truck<br />
transports are typically three times that of rail transport, an increase in capacity, flexibility<br />
and reliability of the rail system should be the preferable development <strong>for</strong> transport<br />
ports are typically three times that of rail transport, an increase in capacity, flexibility and<br />
consumers.<br />
reliability of the rail system should be the preferable development <strong>for</strong> transport consumers.<br />
Rail transports Truck transports<br />
0.2 SEK<br />
per tkm<br />
0.6 SEK<br />
per tkm<br />
Figure Figure 19: Cost 19: comparison Cost comparison between between rail rail and and truck transports per ton ton kilometre (tkm) (tkm)<br />
ENERGY SCENARIO <strong>2050</strong> 78<br />
Regarding Regarding road traffic, road traffic, the scenario the scenario assumes assumes a constant a constant number number of cars of cars (4.3 (4.3 million), million), while while<br />
EVs assume a gradually larger share of the fleet. Based on estimations of EV cost develop-<br />
<strong>Energy</strong> <strong>Scenario</strong> EVs assume <strong>2050</strong> a gradually larger share of the fleet. Based on estimations IVL of EV report cost<br />
ments developments in the IEA <strong>Energy</strong> in the Technology IEA <strong>Energy</strong> Perspectives, Technology the Perspectives, additional the cost additional is SEK 175,000 cost is per SEK<br />
vehicle 175,000 in 2015 per and vehicle about in SEK 2015 54,000 and about per vehicle SEK 54,000 in 2030–<strong>2050</strong> per vehicle (IEA in 2008). 2030–<strong>2050</strong> There (IEA is conse- 2008).<br />
quently There an expectation is consequently of large an expectation learning rates of large in the learning introduction rates in of the EVs, introduction which similarly of EVs,<br />
implies which large similarly variations implies in costs large depending variations on in costs which depending rates are assumed. on which rates are assumed.<br />
MSEK<br />
160 000<br />
140 000<br />
120 000<br />
100 000<br />
80 000<br />
60 000<br />
40 000<br />
20 000<br />
0<br />
Figure 20: Costs per decade decade of of introducing introducing electric electric vehicles vehicles<br />
The<br />
The<br />
additional<br />
additional<br />
costs<br />
costs<br />
of<br />
of<br />
introducing<br />
introducing<br />
EVs<br />
EVs<br />
are<br />
are<br />
thus<br />
thus<br />
about<br />
about<br />
SEK<br />
SEK<br />
400,000<br />
400,000<br />
million<br />
million<br />
and the<br />
and<br />
average<br />
the<br />
yearly<br />
average<br />
cost<br />
yearly<br />
is SEK<br />
cost<br />
10,000<br />
is SEK<br />
million,<br />
10,000<br />
where<br />
million,<br />
the<br />
where<br />
latter<br />
the<br />
figure<br />
latter<br />
has<br />
figure<br />
large<br />
has<br />
variations<br />
large variations<br />
and uncertain-<br />
and<br />
ties<br />
uncertainties<br />
over time due<br />
over<br />
to<br />
time<br />
the<br />
due<br />
expected<br />
to the<br />
cost<br />
expected<br />
decrease<br />
cost<br />
(Figure<br />
decrease<br />
20).<br />
(Figure<br />
The costs<br />
20).<br />
can<br />
The<br />
be compared<br />
costs can be<br />
to the<br />
current<br />
compared<br />
yearly<br />
to the<br />
spending<br />
current<br />
on<br />
yearly<br />
fuel, which<br />
spending<br />
at present<br />
on fuel,<br />
prices<br />
which<br />
(approx.<br />
at present<br />
14 SEK/litre)<br />
prices (approx.<br />
reach<br />
14<br />
about<br />
SEK<br />
SEK/litre)<br />
14,000 million.<br />
reach about<br />
Seeing<br />
SEK<br />
that<br />
14,000<br />
the fuel<br />
million.<br />
costs <strong>for</strong><br />
Seeing<br />
EVs<br />
that<br />
should<br />
the<br />
typically<br />
fuel costs<br />
be<br />
<strong>for</strong><br />
significantly<br />
EVs should<br />
lower<br />
than<br />
typically<br />
current<br />
be significantly<br />
fuel costs and<br />
lower<br />
even<br />
than<br />
lower<br />
current<br />
than<br />
fuel<br />
future<br />
costs<br />
costs<br />
and<br />
of<br />
even<br />
diesel<br />
lower<br />
and<br />
than<br />
petroleum,<br />
future costs<br />
the<br />
of<br />
additional<br />
diesel<br />
vehicle<br />
and petroleum,<br />
purchasing<br />
the<br />
costs<br />
additional<br />
are expected<br />
vehicle<br />
to be<br />
purchasing<br />
increasingly<br />
costs<br />
offset.<br />
are expected to be<br />
increasingly offset.<br />
Additional costs<br />
of EV in 2030<br />
74<br />
2010-2020 2020-2030 2030-2040 2040-<strong>2050</strong><br />
Potential fuel<br />
cost<br />
Additional costs<br />
of EV in <strong>2050</strong><br />
100<br />
75<br />
50<br />
25<br />
0<br />
%<br />
Potential fuel<br />
cost<br />
EV cost<br />
Rate EV
uncertainties over time due to the expected cost decrease (Figure 20). The costs can be<br />
compared to the current yearly spending on fuel, which at present prices (approx. 14<br />
SEK/litre) reach about SEK 14,000 million. Seeing that the fuel costs <strong>for</strong> EVs should<br />
typically be significantly lower than current fuel costs and even lower than future costs of<br />
ENERGY SCENARIO <strong>2050</strong> 79<br />
diesel and petroleum, the additional vehicle purchasing costs are expected to be<br />
increasingly offset.<br />
Additional costs<br />
of EV in 2030<br />
Potential fuel<br />
cost<br />
54 000<br />
SEK 108 000<br />
SEK<br />
Additional costs<br />
of EV in <strong>2050</strong><br />
46 000<br />
SEK<br />
Potential fuel<br />
cost<br />
108 000<br />
SEK<br />
Figure Figure 21: 21: Cost Cost comparison between additional investment investment costs of costs EVs of and EVs ten-year spending on fuels in<br />
and different ten-year scenarios spending on fuels in different scenarios<br />
One One way way of looking of looking at the at the costs costs on the on the level level of vehicle of vehicle owners, owners, is that is that the the additional costs costs per<br />
vehicle per vehicle in 2030 in is less 2030 than is less half than of the half spending of the spending on fuels over on fuels a ten-year over a period, ten-year if calculating period, if<br />
with calculating a yearly transport with a yearly length transport of 1,500 length km, an of improved 1,500 km, fuel an improved consumption fuel of consumption 0.4 l/km and of a<br />
future 0.4 fuel l/km price and of a future 18 SEK/l fuel (Figure price of 21). 18 The SEK/l cost (Figure spread 21). would The naturally cost spread increase would with naturally longer<br />
transports increase and with higher longer transports fuel prices and and higher similarly fuel prices decrease and with similarly lower decrease fuel consumption. with lower fuel An<br />
alternative scenario may <strong>for</strong> example include increased fuel costs due to higher oil prices. Assuming<br />
that fuel prices in <strong>2050</strong> are 24 SEK/l, i.e. double that of current fuel prices, and a fuel<br />
efficiency improvement to 0.3 l/km, ten-year fuel spending would be equal to the previous<br />
scenario. However, this should then be compared to an expected additional EV price of SEK<br />
75<br />
46,000. The additional costs <strong>for</strong> EV vehicles can consequently be regarded as offset under<br />
varying scenarios. An additional example is that fuel consumption at a fuel price of 18 SEK/l<br />
must fall to 0.21 l/km to balance the additional costs <strong>for</strong> EVs in 2030.<br />
The scenario puts <strong>for</strong>th that fuel consumption in goods transports by lorries will develop<br />
towards lorries using a larger share of DME in particular and to a lesser extent electricity,<br />
gas and FAME. We do not include any particular additional costs associated with this development,<br />
but rather that the replacement of trucks will follow a general transition on the<br />
market towards models equipped with engines using these other fuels. The cost benefits are<br />
also seen to follow a positive trajectory under the assumption that the price of fossil fuels<br />
will increase relative to that of biofuels. Electrified lorries are, similarly to the private car<br />
example above, seen to be economically viable in the future under a range of scenarios.<br />
6.1.3 Buildings<br />
The third sector included the main trends is energy efficiency improvement in buildings, divided<br />
between residential and commercial buildings. At present, residential buildings represent<br />
an 80% share of the total energy consumption in the building sector, which is expected<br />
to remain roughly constant to <strong>2050</strong>. During the same period, the average energy consumption<br />
per m 2 is expected to be cut in half in both building sectors. Hence, the largest ef<strong>for</strong>ts<br />
are to be made in residential buildings. The costs of accomplishing these savings are calcu-
ENERGY SCENARIO <strong>2050</strong> 80<br />
<strong>Energy</strong><br />
<strong>Energy</strong><br />
<strong>Scenario</strong><br />
<strong>Scenario</strong><br />
<strong>2050</strong><br />
<strong>2050</strong><br />
IVL report<br />
IVL report<br />
lated through the average costs of increasing energy efficiency in the two building sectors<br />
(Deng et al. 2011). Learning effects are seen to reduce costs by 10% each ten-year period. As<br />
in the industry case, the increased costs arising from easily-obtained gains and the decreased<br />
costs due to growth functions are estimated to level each other out.<br />
MSEK<br />
200 000<br />
200 000<br />
150 000<br />
150 000<br />
MSEK<br />
100 000<br />
100 000<br />
50 000<br />
50 000<br />
0<br />
0<br />
2010-2020<br />
2010-2020<br />
2020-2030<br />
2020-2030<br />
2030-2040<br />
2030-2040<br />
2040-<strong>2050</strong><br />
2040-<strong>2050</strong><br />
Residential<br />
Residential<br />
Commercial<br />
Commercial<br />
Figure 22: Investments per decade to increase energy efficiency in the building sector<br />
Figure<br />
Figure<br />
22: Investments<br />
22: Investments<br />
per decade<br />
per decade<br />
to increase<br />
to increase<br />
energy<br />
energy<br />
efficiency<br />
efficiency<br />
in the building<br />
in the building<br />
sector<br />
sector<br />
Thus the total additional costs <strong>for</strong> increasing energy efficiency in the building sector over the<br />
period Thus<br />
Thus<br />
the amount total<br />
the<br />
additional<br />
total additional<br />
to SEK 890,000 costs<br />
costs<br />
<strong>for</strong> million increasing<br />
<strong>for</strong> increasing<br />
(Figure energy<br />
energy<br />
22). efficiency<br />
efficiency<br />
The average in the<br />
in<br />
annual building<br />
the building<br />
cost sector<br />
sector<br />
is about over<br />
over<br />
SEK<br />
22,000 the period<br />
the period<br />
million amount<br />
amount<br />
(Figure to SEK<br />
to SEK<br />
23). The 890,000<br />
890,000<br />
cost million<br />
million<br />
can be (Figure<br />
(Figure<br />
compared 22). to The<br />
22).<br />
the average<br />
The average<br />
expenses annual<br />
annual<br />
on cost energy is<br />
cost<br />
about<br />
is about<br />
that are<br />
saved SEK<br />
SEK<br />
as 22,000<br />
22,000<br />
a result million<br />
million<br />
of the (Figure<br />
(Figure<br />
efficiency 23). The<br />
23).<br />
measures. cost<br />
The<br />
can<br />
cost<br />
<strong>Energy</strong> be<br />
can<br />
compared<br />
be compared<br />
demands to the<br />
to<br />
in electricity expenses<br />
the expenses<br />
on and energy<br />
on energy<br />
heat that<br />
that<br />
(fig 12)<br />
are are demands saved<br />
are saved<br />
as a that result<br />
as a result<br />
will of have the<br />
of<br />
efficiency<br />
the efficiency<br />
a cost associated measures.<br />
measures.<br />
to <strong>Energy</strong><br />
<strong>Energy</strong><br />
them. The demands<br />
demands<br />
extracted in electricity<br />
in electricity<br />
heat in heat and heat<br />
and<br />
pumps (fig<br />
heat (fig<br />
and<br />
solar 12) are<br />
12)<br />
heat demands<br />
are demands<br />
are part that of will<br />
that<br />
energy have<br />
will<br />
efficiency a<br />
have<br />
cost<br />
a<br />
associated<br />
cost associated<br />
measures. to them.<br />
to them.<br />
The energy The extracted<br />
The extracted<br />
removed heat through in<br />
heat<br />
heat<br />
in<br />
the pumps<br />
heat pumps<br />
energy<br />
efficiency and solar<br />
and solar<br />
measures heat are<br />
heat<br />
part<br />
are<br />
are compared of<br />
part<br />
energy<br />
of energy<br />
to efficiency<br />
efficiency<br />
the baseline measures.<br />
measures.<br />
(2010). The Over energy<br />
The energy<br />
the 40 removed<br />
removed<br />
year period through<br />
through<br />
the demand the<br />
the<br />
is energy<br />
energy<br />
reduced efficiency<br />
efficiency<br />
with of measures<br />
measures<br />
almost 1,100 are compared<br />
are compared<br />
TWh. The to annual the<br />
to<br />
baseline<br />
the baseline<br />
saving (2010).<br />
(2010).<br />
in energy Over<br />
Over<br />
expenses the 40<br />
the<br />
year<br />
40<br />
is period<br />
year period<br />
thus SEK<br />
27,000 the demand<br />
the demand<br />
million is per reduced<br />
is reduced<br />
year. with This of<br />
with<br />
points almost<br />
of almost<br />
to 1,100<br />
1,100<br />
potential TWh.<br />
TWh.<br />
cost The benefits annual<br />
The annual<br />
of saving<br />
saving<br />
realizing in energy<br />
in energy<br />
the scenario expenses<br />
expenses<br />
as is<br />
is<br />
the<br />
energy thus SEK<br />
thus SEK<br />
efficiency 27,000<br />
27,000<br />
improvement million<br />
million<br />
per year.<br />
per year.<br />
measures, This points<br />
This points<br />
in contrast to potential<br />
to potential<br />
to electricity cost benefits<br />
cost benefits<br />
purchases, of realizing<br />
of realizing<br />
is a single the<br />
the<br />
investment<br />
scenario<br />
scenario<br />
cost as the<br />
as<br />
(Figure energy<br />
the energy<br />
23). efficiency<br />
efficiency<br />
improvement<br />
improvement<br />
measures,<br />
measures,<br />
in contrast<br />
in contrast<br />
to electricity<br />
to electricity<br />
purchases,<br />
purchases,<br />
is a single<br />
is a single<br />
investment<br />
investment<br />
cost (Figure<br />
cost (Figure<br />
23).<br />
23).<br />
Saved energy<br />
Improving EE Saved energy<br />
Improving EE<br />
expenses<br />
expenses<br />
22 000<br />
22 000<br />
MSEK<br />
MSEK<br />
27 000<br />
27 000<br />
MSEK<br />
MSEK<br />
Figure<br />
Figure 23: Cost<br />
23: comparison<br />
Cost comparison<br />
of of energy energy of energy<br />
efficiency efficiency<br />
improvement improvement<br />
investments<br />
investments and electricity<br />
and electricity and costs electricity in<br />
costs<br />
buildings<br />
in buildings costs per<br />
per<br />
in annum buildings annum per annum<br />
Realizing<br />
Realizing<br />
the technical<br />
the technical<br />
and economic<br />
and economic<br />
energy<br />
energy<br />
savings<br />
savings<br />
potential<br />
potential<br />
in the<br />
in<br />
building<br />
the building<br />
sector<br />
sector<br />
has<br />
has<br />
however<br />
however<br />
proved<br />
proved<br />
to be<br />
to<br />
difficult<br />
be difficult<br />
due to<br />
due<br />
various<br />
to various<br />
market<br />
market<br />
failures<br />
failures<br />
and barriers.<br />
and barriers.<br />
It is there<strong>for</strong>e<br />
It is there<strong>for</strong>e
ENERGY SCENARIO <strong>2050</strong> 81<br />
<strong>Energy</strong> <strong>Scenario</strong> <strong>2050</strong> IVL report<br />
Realizing the technical and economic energy savings potential in the building sector has<br />
however proved to be difficult due to various market failures and barriers. It is there<strong>for</strong>e important<br />
to implement policies that provide in<strong>for</strong>mation, incentives or rules in order <strong>for</strong> all<br />
stakeholders in the building sector to invest in and demand more energy efficient buildings<br />
despite a potentially higher investment cost.<br />
6.1.4 Supply side<br />
The final sector included in the main trends is the transition towards an increased share of<br />
RES in the electricity supply sector. The cost <strong>for</strong> this transition is based on the individual increased<br />
production costs per MWh, added production capacity in MWh, and learning rates.<br />
Cost estimations <strong>for</strong> these technologies vary (see <strong>for</strong> example Henryson 2010) and we have<br />
used an average of several sources, which roughly corresponds to that of the IPCC Special<br />
Report Renewable <strong>Energy</strong> Sources (IPCC 2011a) 12 important to implement policies that provide in<strong>for</strong>mation, incentives or rules in order <strong>for</strong><br />
all stakeholders in the building sector to invest in and demand more energy efficient<br />
buildings despite a potentially higher investment cost.<br />
6.1.4 Supply side<br />
The final sector included in the main trends is the transition towards an increased share of<br />
RES in the electricity supply sector. The cost <strong>for</strong> this transition is based on the individual<br />
increased production costs per MWh, added production capacity in MWh, and learning<br />
rates. Cost estimations <strong>for</strong> these technologies vary (see <strong>for</strong> example Henryson 2010) and<br />
we have used an average of several sources, which roughly corresponds to that of the IPCC<br />
Special Report Renewable <strong>Energy</strong> Sources (IPCC<br />
.<br />
2011a)<br />
We have set the current costs <strong>for</strong> wind<br />
power production at SEK 645/MWh (based on one-third being offshore and two-thirds being<br />
onshore) and photovoltaic at SEK 2,000/MWh. Similar to the other trends which include<br />
technologies that are currently under development, the costs on the supply side will depend<br />
on how fast the technologies develop. We have set the learning rates <strong>for</strong> the technologies<br />
included to 0.9 <strong>for</strong> wind, and 0.8 <strong>for</strong> solar power.<br />
The increase in production is given by the scenario. The technical and economic life is set to<br />
20 years. As a consequence, the increase of wind and solar power seen in the period 2010-<br />
2020 will have to be replaced with new energy generating capacity in 2030-2040, this has<br />
been taken into account in the calculations.<br />
12 . We have set the current costs<br />
<strong>for</strong> wind power production at SEK 645/MWh (based on one-third being offshore and<br />
two-thirds being onshore) and photovoltaic at SEK 2,000/MWh. Similar to the other<br />
trends which include technologies that are currently under development, the costs on the<br />
supply side will depend on how fast the technologies develop. We have set the learning<br />
rates <strong>for</strong> the technologies included to 0.9 <strong>for</strong> wind, and 0.8 <strong>for</strong> solar power.<br />
The increase in production is given by the scenario. The technical and economic life is set<br />
to 20 years. As a consequence, the increase of wind and solar power seen in the period<br />
2010-2020 will have to be replaced with new energy generating capacity in 2030-2040, this<br />
has been taken into account in the calculations.<br />
MSEK<br />
35 000<br />
30 000<br />
25 000<br />
20 000<br />
15 000<br />
10 000<br />
5 000<br />
0<br />
2010-2020 2020-2030 2030-2040 2040-<strong>2050</strong><br />
Figure 24: Costs per decade of increasing production of electricity production by wind<br />
and<br />
Figure<br />
photovoltaic<br />
24: Costs per decade of increasing production of electricity production by wind and photovoltaic<br />
The 12 total Cost estimates costs <strong>for</strong> available the increased in the literature electricity are produced production using from a variety wind of methods. and solar The power estimates during in the this<br />
period IPCC amount special report to SEK are levelised 110.000 cost million, of energy, with i.e. representing an average the annual cost of generating cost of SEK energy 2,800 from million. different<br />
sources over their lifetimes. It is calculated as the per-unit price at which energy must be generated from a<br />
specific source over its lifetime <strong>for</strong> the investment to break even. It includes initial investment, operations and<br />
maintenance, cost of fuel, and cost of capital. It excludes downstream costs such as costs of delivery to enduser,<br />
integration or environmental externalities. Effects of economic policy instruments credits are not<br />
12 Cost estimates available in the literature are produced using a variety of methods. The estimates in the IPCC special report are levelised cost of energy, i.e.<br />
included.<br />
representing the cost of generating energy from different sources over their lifetimes. It is calculated as the per-unit price at which energy must be generated<br />
from a specific source over its lifetime <strong>for</strong> the investment to break even. It includes initial investment, operations and maintenance, cost of fuel, and<br />
cost of capital. It excludes downstream costs such as costs of delivery to end-user, integration or environmental externalities. Effects of economic policy<br />
instruments credits are not included.<br />
78<br />
Wind power<br />
PV
ENERGY SCENARIO <strong>2050</strong> 82<br />
The costs associated with producing biofuels will not only depend on the maturity of the<br />
technology but among other things also the cost of feedstock used in the process. Learning<br />
curves linked to the production cost of advanced biofuels, excluding taxes, could already in<br />
2030 level the production cost of the same quantity of petrol and diesel (see <strong>for</strong> example IEA<br />
2011). A rough estimate of the production cost of all petrol and diesel used in <strong>Sweden</strong> 2010<br />
was SEK 40,000 million (9,500 million litres and SEK 4.2/litre, the figure excludes taxes but<br />
includes the production marginal at the refinery).<br />
6.2 Policies<br />
The main trends analysed above point to significant costs of dealing with the transition that<br />
the scenario put <strong>for</strong>th. However, the examples also elucidate that the costs are reasonable<br />
given the comparisons and that many measures can be argued as profitable. Moreover, as we<br />
neither include external environmental costs and benefits of the transition nor the effects of<br />
policy instruments, the economic benefits of the transition should typically be larger than<br />
those shown in this overview.<br />
A key aspect in the overview is that the technologies which are the main energy suppliers up<br />
to <strong>2050</strong> consist chiefly of mature technologies. Hence, the expansion of these technologies<br />
could predominately be made on market terms and not result in any significant public costs<br />
in support of technology development. This is further supported by a small role <strong>for</strong> bridging<br />
technologies and energy sources. The economic situation would, of course, be quite different<br />
in a scenario that includes public support <strong>for</strong> large scale commercialization of new technologies.<br />
A large portion of the scenario’s costs will thus be put on the private sector, which emphasizes<br />
the need <strong>for</strong> policy instruments to catalyse investment and bridge market failures.<br />
These instruments should, seeing the role of mature technologies, include a focus on incentives<br />
<strong>for</strong> investments (e.g. subsidies, subventions, taxes and a carbon price). However,<br />
parallel to incentive policies there is also a need <strong>for</strong> policies that provide financial support<br />
<strong>for</strong> technology RDD&D, seeing that some specific technologies that are not yet mature also<br />
play a significant role in specific sectors. It is also important that potential policy barriers <strong>for</strong><br />
investments (such as short-term policies) are dealt with in order not to delay investments.<br />
A key point is that the final costs <strong>for</strong> the transition will mainly be borne by society, seeing<br />
that the increased costs of deploying these technologies by means of policies and other market<br />
<strong>for</strong>ces eventually will be put on the end consumers. The question of whether the scenario<br />
is economically feasible would then be answered by the purchasing power of the end-consumers<br />
and the profitability of choices in low-carbon solutions. As is shown above, one could<br />
easily postulate that many of these choices would have an economic rationale; especially in<br />
a scenario where, <strong>for</strong> example, oil prices and environmental policy instruments increasingly<br />
affect the pricing of those choices.
7 Conclusions<br />
ENERGY SCENARIO <strong>2050</strong> 83<br />
The aim of this report was to present a backcasting scenario that describes an energy system<br />
based on renewable energy sources. The supply of energy sources should be secured within<br />
<strong>Sweden</strong> and produced with a high level of environmental concern. The results from the backcasting<br />
exercise shows that it is possible to reach an energy system based closely to 100% on<br />
renewable energy. The scenario developed is based on the final goal in <strong>2050</strong> and between the<br />
present and <strong>2050</strong> there are three checkpoints (2020, 2030, and 2040).<br />
The scenario indicates that electricity is not the limiting factor in the Swedish energy system.<br />
Provided that energy efficiency improvement activities and the expansion of new renewables<br />
take place there will be a substantial electricity surplus during the period 2020 and<br />
2030. In 2040 the surplus has been reduced as a result of nuclear phase-out, however net<br />
surplus picks up again in <strong>2050</strong>.<br />
One of the major challenges is to substitute the fuels used in transport. The transport sector<br />
is heavily reliant on fossil-based fuels. The transition from fossil fuels to renewables requires<br />
a production capacity <strong>for</strong> biofuels in <strong>Sweden</strong>. The scenario has opted <strong>for</strong> biorefineries<br />
where a high level of efficiency can be reached. Heat from these industries can be distributed<br />
through district heating: electricity and biofuels are important energy carriers. The scenario<br />
has strong measures <strong>for</strong> limiting the use of primary bioenergy feedstock due to environmental<br />
concerns. In some cases the scenario has opted <strong>for</strong> a route where electricity is used to provide<br />
heat through heat pumps as well as pushing <strong>for</strong> transport methods that use electricity<br />
in order to reduce demands <strong>for</strong> bioenergy.<br />
District heating demand is anticipated to decrease as a consequence of energy efficiency<br />
improvement measures and global warming. At the same time the market share <strong>for</strong> district<br />
heating will increase and a large proportion of the future cooling demand is produced by district<br />
heating by absorption cooling. It is vital that the district heating sector can contribute<br />
to recover the surplus heat from industry and future biofuel production.<br />
Even though energy efficiency improvement measures take place in all sectors of society,<br />
the scenario has not taken full advantage of these opportunities. There are a number of efficiency<br />
measures that are linked to <strong>for</strong> example city planning that would result in changes in<br />
need <strong>for</strong> transport and a range of in<strong>for</strong>mation and technology options that would also have<br />
an impact on the need <strong>for</strong> transport. Changes in consumption patterns, daily routines and<br />
aspirations will have major impacts in the demand side of the energy system. It is important<br />
that we become more efficient in our way of living in general.<br />
In order <strong>for</strong> energy efficiency improvement processes to be initiated there will be a need <strong>for</strong><br />
incentives and regulations. The scenario acknowledges the challenges that reside in avoiding<br />
high levels of rebound effects as the energy demands are reduced and a surplus is created.<br />
The scenario has taken its point of departure in using existing technologies. Even though<br />
the technology is available today, and the knowledge of the need to act is present, progress is<br />
slow and there is a need to initiate these processes of change promptly. Research and devel-
ENERGY SCENARIO <strong>2050</strong> 84<br />
opment is needed not only on technologies and production processes, but also on business<br />
models and how to create strong and cost-effective regulations and incentives <strong>for</strong> change to<br />
happen.<br />
The scenario is based on the Swedish energy system and demand in <strong>Sweden</strong>. Still, this energy<br />
system is interlinked with Nordic and European energy systems. Many of the resources that<br />
we use in the energy system today are purchased on a global market and originate from all<br />
around the globe. The scenario presented in this study acts as an input to discussions on<br />
these higher levels. Pinpointing the crucial aspects in order to reach a renewable energy<br />
system based on accessible resources will make the identification of areas where the need <strong>for</strong><br />
cooperation and harmonization of the energy and support systems one step closer.
8 References<br />
Akhtarzand, M., P. Axegård, A. Bergek, H. Frank,<br />
H. Haegermark, M. Leijon, T. Levander, P. Lindblad,<br />
E. Lindroth, G. Svensson and L. Magnusson<br />
(2003). Energi <strong>2050</strong> - närmare solen, Rapport från<br />
panelen för långsiktsframsyn, Kungliga Ingenjörsvetenksapsakademin<br />
(IVA), Stockholm.<br />
Aleklett, K., M. Höök, K. Jakobsson, M. Lardelli, S.<br />
Snowden and B. Söderbergh (2010). “The Peak<br />
of the Oil Age – Analyzing the world oil production<br />
Reference <strong>Scenario</strong> in World <strong>Energy</strong> Outlook<br />
2008.” <strong>Energy</strong> Policy 38(3): 1398-1414.<br />
Alv<strong>for</strong>s, P., J. Arnell, N. Berglin, L. Björnsson, P.<br />
Börjesson, M. Grahn, S. Harvey, C. Hoffstedt, K.<br />
Holmgren, K. Jelse, P. Klintbom, H. Kusar, G. Lidén,<br />
M. Magnusson, K. Pettersson, T. Rydberg, K.<br />
Sjöström, H. Stålbrand, O. Wallberg, E. Wetterlund,<br />
G. Zacchi and O. Öhrman (2010). Research<br />
and development challenges <strong>for</strong> Swedish biofuel<br />
actors – three illustrative examples, Improvement<br />
potential discussed in the context of Well-to-Tank<br />
analyses, Chalmers, Physical Resource Theory, Gothenburg.<br />
Azar, C. and K. Lindgren (1998). Energiläget <strong>2050</strong>,<br />
Avdelningen för Fysisk Resursteori, Chalmers<br />
Tekniska Högskola, Göteborg.<br />
Berglund, M. and P. Börjesson (2003). Energianalys av<br />
biogassystem, Rapport 44, Institutionen <strong>for</strong> teknik<br />
och samhälle, Lund. Maj.<br />
Bertenstam, A.-L. (2011). Personal communication Efficiencies<br />
and implementation of heat pumps, Svenska<br />
Värmepumpföreningen, Svenska Värmepumpföreningen.<br />
Beurskens, L. W. M. and M. Hekkenberg (2011).<br />
Renewable <strong>Energy</strong> Projections as Published in the<br />
National Renewable <strong>Energy</strong> Action Plans of the European<br />
Member States, ECN-E--10-069, <strong>Energy</strong> Research<br />
Centre of the Netherlands (ECN), Petten,<br />
the Netherlands. February.<br />
Bleischwitz, R. and N. Bader (2010). “Policies <strong>for</strong> the<br />
transition towards a hydrogen economy: the EU<br />
case.” <strong>Energy</strong> Policy 38(10): 5388-5398.<br />
Boverket (2008). Hälften bort! Energieffektivisering i<br />
befintlig bebyggelse, Karlskrona.<br />
Bryntse, G. and M. Mattison (2010). Nationell Handlingsplan<br />
för Förnybara Energikällor - Sverige, RE-<br />
PAP <strong>Sweden</strong> Köping. Mars.<br />
ENERGY SCENARIO <strong>2050</strong> 85<br />
Börjeson, L., M. Höjer, K. Dreborg, T. Ekvall and<br />
G. Finnveden (2006). “<strong>Scenario</strong> types and techniques:<br />
Towards a user’s guide.” Futures 38(7): 723-<br />
739.<br />
C.I.R.E.D, Enerdata and LEPii (2009). Carbon Constrained<br />
<strong>Scenario</strong>s, Final report, FONDDRI. May.<br />
CAN Europe (2011). <strong>Energy</strong> Efficiency and Savings:<br />
Clearing the fog. Everything you always wanted to<br />
know but were afraid to ask about Europe’s First <strong>Energy</strong><br />
Source, Climate Action Network (CAN) Europe,<br />
Brussels. March.<br />
CAN International (2009). Fair, Ambitious & Binding -<br />
Essentials <strong>for</strong> a Successful Climate Deal, Climate Action<br />
Network (CAN) International, Washington.<br />
Carlsson-Kanyama, A., G. Assefa, G. Peters and A.<br />
Wadeskog (2007). Koldioxidutsläpp till följd av<br />
Sveriges import och konsumtion: beräkningar med<br />
olika metoder TRITA-IM: 2007:11, Avdelningen för<br />
industriell ekologi, Kungliga tekniska högskolan<br />
(KTH), Stockholm. April.<br />
COM (2008). 20 20 by 2020 Europe’s climate change<br />
opportunity. Brussels, Commission of the European<br />
Communities: 12.<br />
Dahlberg, A., G. Egnell, J. Berg, L. Rytter and O.<br />
Westling (2006). Miljöeffekter av skogsbränsleuttag<br />
och askåterföring i Sverige, En syntes av Energimyndighetens<br />
<strong>for</strong>skningsprogram 1997 till 2004 ER<br />
2006:44, Statens Energimyndighet, Eskilstuna.<br />
de Jong, J. and L. Lönnberg, Eds. (2010). Konsekvenser<br />
av skogsbränsleuttag. En syntes av Energimyndighetens<br />
<strong>for</strong>skningsprogram inom Skogsbränsle och<br />
Miljö 2005 – 2009. Eskilstuna, Energimyndigheten.<br />
Delucchi, M. A. and M. Z. Jacobson (2010). “Providing<br />
all global energy with wind, water, and solar<br />
power, Part II: Reliability, system and transmission<br />
costs, and policies.” <strong>Energy</strong> Policy(In press).<br />
Deng, Y., S. Cornelissen and S. Klaus (2011). Part 2:<br />
The Ecofys <strong>Energy</strong> <strong>Scenario</strong> WWF International,<br />
Ecofys and Office <strong>for</strong> Metropolitan Architecture<br />
(OMA), Gland, Switzerland. February<br />
Dreborg, K. H. (1996). “Essence of Backcasting.” Futures<br />
28(9): 813-828.
Ebinger, J. and W. Vergara (2011). Climate Impacts on<br />
<strong>Energy</strong> Systems. Key Issues <strong>for</strong> energy sector adaptation.<br />
Washington, The World Bank and <strong>Energy</strong> Sector<br />
Management Assistance Program (ESMAP).<br />
Ecofys and WWF (2008). The potential global CO2 reductions<br />
from ICT use, Solna.<br />
Edenhofer, O., R. Pichs-Madruga, Y. Sokona, K.<br />
Seyboth, D. Arvizu, T. Bruckner, J. Christensen,<br />
J.-M. Devernay, A. Faaij, M. Fischedick, B. Goldstein,<br />
G. Hansen, J. Huckerby, A. Jäger-Waldau, S.<br />
Kadner, D. Kammen, V. Krey, A. Kumar, A. Lewis,<br />
O. Lucon, P. Matschoss, L. Maurice, C. Mitchell,<br />
W. Moomaw, J. Moreira, A. Nadai, L. J. Nilsson,<br />
J. Nyboer, A. Rahman, J. Sathaye, J. Sawin, R.<br />
Schaeffer, T. Schei, S. Schlömer, R. Sims, A. Verbruggen,<br />
C. von Stechow, K. Urama, R. Wiser, F.<br />
Yamba and T. Zwickel (2011). Summary <strong>for</strong> Policy<br />
Makers. IPCC Special Report on Renewable <strong>Energy</strong><br />
Sources and Climate Change Mitigation. O. Edenhofer,<br />
R. Pichs-Madruga, Y. Sokonaet al. Cambridge,<br />
United Kingdom and New York, NY, USA.,<br />
Cambridge University Press.<br />
Ehrhardt-Martinez, K. and J. A. Laitner (2010). “Rebound,<br />
Technology and People: Mitigating the Rebound<br />
Effect with <strong>Energy</strong>-Resource Management<br />
and People-Centered Initiatives.” ACEEE Summer<br />
Study on <strong>Energy</strong> Efficiency in Buildings(Panel 7, Paper<br />
18).<br />
Energimyndigheten (2009). Långtidsprognos 2008 ER<br />
2009:14, Statens Energimyndighet, Eskilstuna.<br />
Energimyndigheten (2010a). Energiläget 2010 ET<br />
2010:45, Eskilstuna.<br />
Energimyndigheten (2010b). Energiläget i siffror 2010<br />
ET2010:46, Statens Energimyndighet, Eskilstuna.<br />
November.<br />
Energimyndigheten (2010c). Transportsektorns energianvändning<br />
2009 ES2010:04, Statens Energimyndighet,<br />
Eskilstuna. April.<br />
Energimyndigheten (2011a). Energistatistik för lokaler<br />
2009 ES 2011:03, Statens Energimyndighet,<br />
Eskilstuna.<br />
Energimyndigheten (2011b). Energistatistik för<br />
flerbostadshus 2009 ES 2011:02, Statens Energimyndighet,<br />
Eskilstuna. Januari.<br />
Energimyndigheten (2011c). Energistatistik för<br />
småhus 2009 ES 2011:01, Statens Energimyndighet,<br />
Eskilstuna. Januari.<br />
ENERGY SCENARIO <strong>2050</strong> 86<br />
EREC (2010). Re-thinking <strong>2050</strong> - a 100% Renewable<br />
<strong>Energy</strong> Vision <strong>for</strong> the European Union, European Renewable<br />
<strong>Energy</strong> Council (EREC), Brussels. April.<br />
Eriksson, H. and G. Hallsby (1992). Biomass fuels<br />
– effects on the carbon dioxide budget R 1992:10,<br />
NUTEK, Stockholm.<br />
Erlandsson, M. and P. Levin (2005). “Environmental<br />
assessment of rebuilding and possible per<strong>for</strong>mance<br />
improvements effect on a national scale.”<br />
Journal of Building and the Environment 40: 1459–<br />
1471.<br />
European Commission (2003). Directive 2003/87/EC<br />
of the European Union and of the Council of 13 October<br />
2009 establishing a scheme <strong>for</strong> greenhouse gas<br />
emission allowance trading within the Community<br />
and amending Council Directive 96/61/EC 2003/87/<br />
EC, European Commission, Brussels.<br />
European Commission (2010a). <strong>Energy</strong> Efficiency<br />
Plan 2011, Communication from the Commission<br />
to the European Parliament, the Council, the European<br />
Economic and Social Committee and the<br />
Committee of the Regions COM(2011) 109 final,<br />
European Commission, Brussels. 8.3.2011.<br />
European Commission (2010b). <strong>Energy</strong> 2020 - A strategy<br />
<strong>for</strong> competitive, sustainable and secure energy,<br />
Communication from the Commission to the European<br />
Parliament, the Council, the European<br />
Economic and Social Committee and the Committee<br />
of the Regions COM(2010) 639 final, European<br />
Commission, Brussels. 11.11.2010.<br />
European Commission (2010c). A resource-efficient<br />
Europe – Flagship initiative under the Europe 2020<br />
Strategy, Communication from the Commission<br />
to the European Parliament, the Council, the European<br />
Economic and Social Committee and the<br />
Committee of the Regions COM(2011)21, European<br />
Commission, Brussels. 26.1.2011.<br />
European Parliament (2000). “Directive 2000/60/<br />
EC of the European Parliament and of the Council<br />
of 23 October 2000 establishing a framework <strong>for</strong><br />
Community action in the field of water policy.” Official<br />
Journal of the European Union(L327/1).<br />
European Parliament (2008). “Directive 2008/98/EC<br />
of the European Parliament and of the Councilof<br />
19 November 2008 on waste and repealing certain<br />
Directives.” Official Journal of the European Union<br />
51(L312/3): 28.
European Parliament (2009) “Directive 2009/28/EC<br />
of the European Parliament and of the Council of<br />
23 April 2009 on the promotion of the use of energy<br />
from renewable sources and amending and<br />
subsequently repealing Directives 2001/77/EC and<br />
2003/30/EC.” Official Journal of the European Union<br />
52, 62 DOI: doi:10.3000/17252555.L_2009.140.eng.<br />
European Union (2010). EU energy and transport<br />
in figures - Statistical pocketbook 2010, Statistical<br />
pocketbook 2010, European Union, Brussels.<br />
EWEA (2011). EU <strong>Energy</strong> Policy to <strong>2050</strong> - Achieving 80-<br />
95% emissions reductions, Report, European Wind<br />
<strong>Energy</strong> Association (EWEA), Brussels. March.<br />
Fargione, J., J. Hill, D. TIlman, S. Polasky and P. Hawthorne<br />
(2008). “Land Clearing and the Biofuel Carbon<br />
Debt.” Science 319(29 February): 1235-1238.<br />
Fridell, E. (2011). Personal communication Personal<br />
communication on energy efficiency in transport sector,<br />
interview, Gothenburg. April.<br />
Gillingham, K., R. Newell and K. Palmer (2006). “<strong>Energy</strong><br />
Efficiency Policies: A Retrospective Examination.”<br />
Annual Review of Environment and Resources<br />
31(1): 161-192.<br />
Gillingham, K., R. G. Newell and K. Palmer (2009).<br />
<strong>Energy</strong> Efficiency Economics and Policy, Discussion<br />
Paper RFF DP 09-13, Resources <strong>for</strong> the Future,<br />
Washington. April.<br />
Gode, J., L. Hagberg, T. Rydberg, H. Rådberg and E.<br />
Särnholm (2008). Effektiv produktion av biodrivmedel,<br />
Rapport 2008:8, Fjärrsyn, Stockholm.<br />
Gode, J. and A. Jarnehammar (2007). Analys av<br />
värme- och kylbehov för bygg- och fastighetssektorn<br />
i Sverige SOU2007_60, bilaga B11.<br />
Gode, J., E. Särnholm, L. Zetterberg, J. Arnell and T.<br />
Zetterberg (2010). Swedish long-term low carbon<br />
scenario - Exploratory study on opportunities and<br />
barriers, IVL Svenska Miljöinstitutet, Stockholm.<br />
Haegermark, H. (1996). Ett uthålligt elsystem <strong>for</strong><br />
Sverige, El<strong>for</strong>sk, Stockholm. April.<br />
Hagberg, L. and K. Holmgren (2008). The climate Impact<br />
of future energy peat production, Report B1796,<br />
IVL Swedish Environment Research Institute,<br />
Stockholm.<br />
Henryson, J. (2010). Kostnader <strong>for</strong> ny elproduktion - en<br />
jämförelse mellan olika aktörers bedömningar, Rapport,<br />
Förnybart.nu, Stockholm. 1 November.<br />
ENERGY SCENARIO <strong>2050</strong> 87<br />
Herland, E. (2005). LRFs Energiscenario till år 2020,<br />
Förnybar Energi från Jord- och Skogsbruket ger Nya<br />
Affärer och Bättre Miljö, LRF, Stockholm. Fberuari.<br />
Herring, H. (2006). “<strong>Energy</strong> efficiency—a critical<br />
view.” <strong>Energy</strong> 31(1): 10-20.<br />
Herring, H. and R. Roy (2007). “Technological innovation,<br />
energy efficient design and the rebound<br />
effect.” Technovation 27(4): 194-203.<br />
Holmberg, j. and K.-H. Robért (2000). “Backcasting<br />
from non-overlapping sustainability principles - A<br />
framework <strong>for</strong> strategic planning.” International<br />
Journal of Sustainable Development and World Ecological<br />
Economics 7: 291-308.<br />
IEA (2008). <strong>Energy</strong> technology perspectives 2008,<br />
Report, International <strong>Energy</strong> Agency (IEA), Paris.<br />
IEA (2010). World <strong>Energy</strong> Outlook 2010, International<br />
<strong>Energy</strong> Agency (IEA), Paris, france.<br />
IEA (2011). Technology Roadmap, Biofuels <strong>for</strong> Transport,<br />
International <strong>Energy</strong> Agency (IEA), Paris.<br />
Illum, K. (2006). A Viable <strong>Energy</strong> Strategy <strong>for</strong> the Nordic<br />
Countries 2006 - 2030 A viable investment budget<br />
<strong>for</strong> the renewal and consolidation of the energy<br />
resource base, the reduction of CO2 emission, and the<br />
phasing out of nuclear power, Paper presented as a<br />
background, Greenpeace, Copenhagen. February.<br />
IPCC, Ed. (2007a). Summary <strong>for</strong> policymakers. Climate<br />
Change 2007: The Physical Science Basis. Contribution<br />
of Working Group I to the Fourth Assessment<br />
Report of the Intergovernmental Panel on<br />
Climate Change. Cambridge and New York, Cambridge<br />
University Press.<br />
IPCC (2007b). Climate Change 2007: The Physical Science<br />
Basis. Contribution of WG I to the Fourth Assessment<br />
Report of the Intergovernmental Panel on<br />
Climate Change. S. Solomon, D. Qin, M. Manning,<br />
Z. Chen, M. Marquis, K.B. Averyt, M. Tignor and<br />
H.L. Miller Cambridge University Press, Cambridge.<br />
IPCC (2011a). Summary <strong>for</strong> Policy Makers. IPCC<br />
Special Report on Renewable <strong>Energy</strong> Sources and<br />
Climate Change Mitigation. O. Edenhofer, R. Pichs-Madruga,<br />
Y. Sokonaet al. Cambridge, United<br />
Kingdom and New York, NY, USA., Cambridge<br />
University Press.<br />
IPCC, Ed. (2011b). IPCC Special Report on Renewable<br />
<strong>Energy</strong> Sources and Climate Change Mitigation.<br />
Cambridge, United Kingdom and New York, NY,<br />
USA., Cambridge University Press.
Jacobson, M. Z. and M. A. Delucchi (2010). “Providing<br />
all global energy with wind, water, and solar<br />
power, Part I: Technologies, energy resources,<br />
quantities and areas of infrastructure, and materials.”<br />
<strong>Energy</strong> Policy(In press).<br />
Jeffries, B. (2011). The <strong>Energy</strong> Report 100% Renewable<br />
<strong>Energy</strong> by <strong>2050</strong>. S. Singer, WWF International,<br />
EcoFys and Office <strong>for</strong> Metropolitan Architecture<br />
(OMA), Gland, Switzerland. February.<br />
Jönsson, J. and J. Algehed (2009). “Pathways to a<br />
sustainable European pulp and paper inustry:<br />
Trade-offs between different technologies and<br />
system solutions <strong>for</strong> kraft pulp mills.” Chemical<br />
engineering transactions 18, 2009: 6.<br />
Kirkinen, J., T. Palosuo, K. Holmgren and I. Savolainen<br />
(2008). “Greenhouse Impact Due to the Use of<br />
Combustible Fuels: Life Cycle Viewpoint and Relative<br />
Radiative Forcing Commitment. .” Environmental<br />
Management 42: 458-469.<br />
Lagerquist, M. (2011). Personal communication Industry<br />
energy statistics, E-mail. March.<br />
Lindholm, E.-L., S. Berg and P.-A. Hansson (2010).<br />
Skörd av skogsbränslen i ett livscykelperspektiv, SLU<br />
report 023, Swedish University of Agricultural Sciences,<br />
Uppsala.<br />
Lund, H. (2010). Renewable <strong>Energy</strong> Systems, The<br />
Choice and Modeling of 100% Renewable Solutions.<br />
London, Elsevier.<br />
Lynas, M. (2008). Six Degrees, Our future on a Hotter<br />
Planet. London, Harpercollins Publishers.<br />
Löfgren, E.-L. and S. Y. Wänn (2009). Persontransportprognoser<br />
2020 och 2040, Banverket<br />
Vägverket, Borlänge. 2009-02-06.<br />
Löfgren, E.-L. and S. Yngström-Wänn (2009). Persontransportprognoser<br />
2020 och 2040, Banverket and<br />
Vägverket, Borlänge. 2009-02-06.<br />
Madlener, R. and B. Alcott (2009). “<strong>Energy</strong> rebound<br />
and economic growth: A review of the main issues<br />
and research needs.” <strong>Energy</strong> 34(3): 370-376.<br />
Mathiesen, B. V., H. Lund and K. Karlsson (2009).<br />
Background Report The IDA Climate Plan <strong>2050</strong>,<br />
Danish Society of Engineers (IDA), Köpenhamn.<br />
August.<br />
McDowall, W. and M. Eames (2006). “Forecasts, scenarios,<br />
visions, backcasts and roadmaps to the<br />
hydrogen economy: A review of the hydrogen futures<br />
literature.” <strong>Energy</strong> Policy 34(11): 1236-1250.<br />
ENERGY SCENARIO <strong>2050</strong> 88<br />
McKechnie, J., J. Colombo, J. Chen, W. Mabee and<br />
H. L. MacLean (2011). “Forest Bioenergy or Forest<br />
Carbon? Assessing Trade-Offs in Greenhouse Gas<br />
Mitigation with Wood-Based Fuel.” Environmental<br />
Science and Technology 45: 789-795.<br />
McKinsey&Company (2008). Möjligheter och kostnader<br />
för att reducera växthusgasutsläpp i Sverige,<br />
McKinsey & Company, Stockholm. April.<br />
Meadows, D. H., D. L. Meadows, J. Randers and W.<br />
W. Behrens (1972). The Limits to Growth. New York,<br />
Universe Books.<br />
Melgaard, S. (2006). Ett nordiskt energiscenario,<br />
Greenpeace, Stockholm. November.<br />
Meyer, N. I., O. Benestad, L. Embort and E. Selvig<br />
(1993). “Sustainable energy scenarios <strong>for</strong> the<br />
Scandinavian countries “ Renewable <strong>Energy</strong> 3(2-3):<br />
127-136.<br />
Millennium Ecosystem Assessment (2005). Ecosystems<br />
and Human Well-being: Synthesis., World Resources<br />
Institute, Island Press, Washington D.C. .<br />
Minx, J., K. Scott, G. Peters and J. Barrett (2008). An<br />
Analysis of <strong>Sweden</strong>’s Carbon Footprint, Världsnaturfonden,<br />
WWF, Stockholm.<br />
Modi, V., S. McDade, D. Lallement and J. Saghir<br />
(2005). <strong>Energy</strong> Services <strong>for</strong> the Millennium Development<br />
Goals, <strong>Energy</strong> Sector Management Assistance<br />
Programme (ESMAP), United Nations Development<br />
Programme (UNDP), UN Millennium<br />
Project, and World Bank, New York.<br />
Naturskyddsföreningen (2007). Minus 40 procent till<br />
2020 - så går det till, Rapport, Naturskyddsföreningen,<br />
Stockholm.<br />
Naturvårdsverket (2005). Framtidsstudier - erfarenheter<br />
och möjligheter. Med perspektiv från Avdelningen<br />
för hållbar samhällsutveckling, Naturvårdsverket,<br />
Swedish Environmental Protection Agency<br />
(Naturvårdsverket), Stockholm.<br />
Naturvårdsverket (2010). Swedish Consumption and<br />
the Global Environment, Swedish Environmental<br />
Protection Agency (Naturvårdsverket), Stockholm.<br />
Naturvårdsverket. (2011). “Emissionsfaktorer<br />
koldioxid.” Retrieved 4 May, 2011, from<br />
www.naturvardsverket.se/sv/Start/Klimat/Utslappsminskning/Berakna-utslapp/Emissionsfaktorer-koldioxid/.
Nilsson, H. (2008). Energieffektivisering på riktigt -<br />
Tio steg mot ett energismartare Sverige, Rapport,<br />
Naturskyddsföreningen, Stockholm.<br />
Nilsson, H. and A. Wolf (2011). Energieffektivisera på<br />
riktigt - Åtta punkter för ett energismart Sverige,<br />
Rapport, Naturskyddsföreningen, EEF (Energieffektiviseringsföretagen)<br />
och Energirådgivarna,<br />
Stockholm. May.<br />
Nilsson, L. (2011). Personal communication Detailed<br />
energy statistics <strong>for</strong> household and service. March.<br />
Nowacki, J.-E. (2011). Personal communication Efficiency<br />
and implementation of heat pumps, Svenska<br />
Värmepumpsföreningen, Svenska Värmepumpsföreningen.<br />
Odenberger, M. and F. Johnsson (2010). “Pathways<br />
<strong>for</strong> the European electricity supply system to<br />
<strong>2050</strong>—The role of CCS to meet stringent CO2<br />
reduction targets.” International Journal of Greenhouse<br />
Gas Control 4(2): 327-340.<br />
Olsson, R. (2009). Boreal Forest and Climate Change.<br />
Air Pollution and Climate Series. R. Pape 23, Air<br />
Pollution & Climate Change Secretariat (AirClim),<br />
Göteborg. November.<br />
Olsson, R. (2010). Boreal Forest and Climate Change<br />
- Regional Perspectives. Air Pollution and Climate<br />
Series. R. Pape 25, Air Pollution & Climate Change<br />
Secretariat (AirClim), Göteborg.<br />
Profu (2010). Scenarier <strong>for</strong> utvecklingen av el- och energisystemet<br />
till <strong>2050</strong> - resultat av modellkörningar<br />
med energisystemsmodellen MARKAL-Nordic och<br />
andra kompletterade analyser, Ett underlag för<br />
Svensk Energis <strong>2050</strong>-studie, Profu, Göteborg.<br />
Juni.<br />
PWC (2010). 100% renewable electricity, A roadmap to<br />
<strong>2050</strong> <strong>for</strong> Europe and North Africa, Pricewaterhouse<br />
Coopers (PWC), United Kingdom.<br />
Regeringskansliet (2008a). En sammanhållen klimat-<br />
och energipolitik - Energi Regeringens proposition<br />
2008/08:163, Regeringskansliet, Stockholm. 30<br />
juni.<br />
Regeringskansliet (2008b). En sammanhållen klimat-<br />
och energipolitik - Klimat Regeringens proposition<br />
2008/08:162, Regeringskansliet, Stockholm. 30<br />
juni.<br />
Regeringskansliet (2010). Sveriges Nationella Handlingsplan<br />
för främjande av förnybar energi enligt<br />
Direktiv 2009/28/EG och Kommissionens beslut av<br />
den 30.6.2009., Näringsdepartementet, Regeringskansliet,<br />
Stockholm. 30 juni.<br />
ENERGY SCENARIO <strong>2050</strong> 89<br />
Repo, A., M. Tuomi and J. Liski (2010). “Indirect carbon<br />
dioxide emissions from producing bioenergy<br />
from <strong>for</strong>est harvest residues.” GCB Bioenergy 3:<br />
107-115.<br />
Robinson, J. B. (1982). “<strong>Energy</strong> Backcasting, a Proposed<br />
Method of Policy Analysis.” <strong>Energy</strong> Policy<br />
December: 337-344.<br />
Rockstrom, J., W. Steffen, K. Noone, Å. Persson, F. S.<br />
Chapin, E. F. Lambin, T. M. Lenton, M. Scheffer, C.<br />
Folke, H. J. Schellnhuber, B. Nykvist, C. A. de Wit,<br />
T. Hughes, S. van der Leeuw, H. Rodhe, S. Sörlin, P.<br />
K. Snyder, R. Costanza, U. Svedin, M. Falkenmark,<br />
L. Karlberg, R. W. Corell, V. J. Fabry, J. Hansen,<br />
B. Walker, D. Liverman, K. Richardson, P. Crutzen<br />
and J. A. Foley (2009). “A safe operating space <strong>for</strong><br />
humanity.” Nature 461(sep): 472-475.<br />
Sanne, C. (2006). Rekyleffekten och effektivitetsfällan<br />
- att jaga sin egen svans i miljöpolitiken, Rapport<br />
5623, Naturvårdsverket, Stockholm. November.<br />
SCB (2010). “Yearbook of Housing and Building Statistics<br />
2010.”<br />
SCB. (2011, 18 mars). “Statistikdatabasen.” from<br />
www.ssd.scb.se.<br />
Schlamadinger, B., M. Apps, F. Bohlin, L. Gustavsson,<br />
G. Jungmeier, G. Marland, K. Pingoud and<br />
I. Savolainen (1997). “Towards a Methodology <strong>for</strong><br />
Greenhouse Ga Balances of bioenergy Systems in<br />
Comparison with Fossil <strong>Energy</strong> systems.” Biomass<br />
and Bioenergy 13(6): 359-375.<br />
Shell (2008). Shell energy scenarios to <strong>2050</strong>, Shell, The<br />
Hague, the Netherlands.<br />
SIKA. (2009a). “Tabellbilaga till SIKA basfakta.” Retrieved<br />
May 5, 2011, from www.sika-institute.se/<br />
Templates/Page____1785.aspx<br />
SIKA (2009b). SIKA Basfakta 2008 2009:28, Stockholm.<br />
Skogsindustrierna. (2011). “<strong>Energy</strong> efficiency in Forest<br />
industry.” from http://www.skogsindustrierna.org/web/Mal_fyra_med_uppfoljning.aspx.<br />
Skogsstyrelsen (2007a). Rundvirkes- och skogsbränslebalanser<br />
2007, Swedish Forest Agency, Jönköping.<br />
Skogsstyrelsen (2007b). Rundvirkes- och skogsbränslebalanser<br />
för år 2007 - SKA-VB-08, Meddelande<br />
4-2008, Skogstyrelsen, Jönköping. December.<br />
Skogsstyrelsen (2008a). Rekommendationer vid uttag<br />
av avverkningsrester och askåterföring, Meddelande<br />
2, Skogsstyrelsen, Jönköping. Juni.
Skogsstyrelsen (2008b). Skogliga konsekvensanalyser<br />
2008 - SKA-VB 08 2008:25, Swedish Forest Agency.<br />
Skogsstyrelsen (2010). Skogsstatistiska årsboken 2010,<br />
Jönköping. September.<br />
Sorrell, S., J. Dimitropoulos and M. Sommerville<br />
(2009). “Empirical estimates of the direct rebound<br />
effect: A review.” <strong>Energy</strong> Policy 37(4): 1356-1371.<br />
SOU (1995). Omställning av energisystemet : slutbetänkande,<br />
Statens Offentliga Utredningar (SOU)<br />
1995:139, Fritze, Stockholm.<br />
Stern, N. (2006). The Economics of Climate Change: The<br />
Stern Review - Executive summary, Her Majesty’s<br />
(HM) Treasury, London.<br />
<strong>Sweden</strong>.se. (2011). “<strong>Sweden</strong>.se - the Official gateway<br />
to <strong>Sweden</strong>.” Retrieved 25 May, 2011, from www.<br />
sweden.se.<br />
Svenfelt, Å., R. Engström and Ö. Svane (2010). “Decreasing<br />
energy use in buildings by 50% by <strong>2050</strong><br />
— A backcasting study using stakeholder groups.”<br />
Technological Forecasting and Social Change.<br />
Svensk Energi (2010). På väg mot ett koldioxidneutralt<br />
samhälle med el i tankarna!, Svensk Energi, Stockholm.<br />
Juni.<br />
Svensk Fjärrvärme. (2011). “Svensk Fjärrvärme -<br />
tillförd energi.” Retrieved 4 May, from http://<br />
www.svenskfjarrvarme.se/Statistik--Pris/Fjarrvarme/Energitill<strong>for</strong>sel/.<br />
Teske, S., A. Zervous, C. Lins and J. Muth (2010a).<br />
<strong>Energy</strong> [r]evolution, Towards a Fully Renewable <strong>Energy</strong><br />
Supply in the EU-27. C. Aubrey, Greenpeace<br />
International and European Renewable <strong>Energy</strong><br />
Council (EREC), Amsterdam. June.<br />
Teske, S., A. Zervous, C. Lins and J. Muth (2010b).<br />
<strong>Energy</strong> [r]evolution, a Sustainable World <strong>Energy</strong><br />
Outlook. C. Aubrey, Greenpeace International and<br />
European Renewable <strong>Energy</strong> Council (EREC), Amsterdam.<br />
June.<br />
Trafikanalys (2010). Bantrafik 2009 Statistik 2010:21,<br />
Östersund, Borlänge.<br />
ULCOS. (2011). “Ultra - Low Carbon dioxide Steelmaking.”<br />
from www.ulcos.org.<br />
UNDP (2005). Energizing the Millennium Development<br />
Goals - A Guide to <strong>Energy</strong>’s Role in Reducing Poverty,<br />
United Nations Development Programme<br />
(UNDP=, New York. August.<br />
ENERGY SCENARIO <strong>2050</strong> 90<br />
UNEP (2011). Towards a Green Economy, Pathways to<br />
Sustainable Development and Poverty Eradication,<br />
UNEP.<br />
WEC (2007). Deciding the Future: <strong>Energy</strong> Policy <strong>Scenario</strong>s<br />
to <strong>2050</strong>, World <strong>Energy</strong> Council (WEC), London.<br />
September.<br />
Wiberg, R. (2007). Energiförbrukning i massa- och pappersindustrin<br />
2007, ÅF-process och Skogsindustrierna,<br />
Stockholm.<br />
Wikström, P., H. Edwards, S. Hildemar and S.<br />
Yngström-Wänn (2009). Prognoser för godstransporter<br />
2020, PM, Banverket och Vägverket, Borlänge.<br />
2009-02-09.<br />
World Bank (2010). World Development Report 2010,<br />
Development and Climate Change. Washington, the<br />
World Bank.<br />
World Bank (2011). Atlas of Global Development - A<br />
visual guide to the world’s greatest challenges. Washington,<br />
The World Bank.<br />
WWF (2007a). EUs klimat och energipaket inte tillräckligt<br />
tufft, Press release, WWF <strong>Sweden</strong> (WWF),<br />
Stockholm. 17 Nov.<br />
WWF (2007b). WWF om FNs klimatrapport: Sverige<br />
måste gå före hemma och i världen, Press release,<br />
WWF <strong>Sweden</strong> (WWF), Stockholm. 17 Nov.<br />
WWF (2007c). Scientists’ statement on 40% emissions<br />
reduction target <strong>for</strong> developed countries, WWF-UK,<br />
Godalming, Surrey.<br />
WWF (2010). Living Planet Report 2010, Biodiversity,<br />
biocapacity and development, Living Planet Report<br />
2010, WWF International, Gland, Switzerland.<br />
WWF (2011). Personal communication Potential bioenergy<br />
production from Swedish <strong>for</strong>ests, adjusted<br />
scenario based on SKA08, excel calculations WWF<br />
<strong>Sweden</strong>, Stockholm, WWF <strong>Sweden</strong>. March.<br />
Zanchi, G., N. Pena and N. Bird (2010). The Upfront<br />
Carbon Debt of Bioenergy, Joanneum Research,<br />
Graz, Austria. May.<br />
Zetterberg, L. and D. Chen (2011). The time aspect of<br />
bioenergy – Climate Impacts of Bioenergy due to Differences<br />
in Carbon Uptake rates, IVL B-Report 1989,<br />
IVL Swedish Environmental Research Institute,<br />
Stockholm. July.
Zetterberg, L. and O. Hansen (1998). Nettoemissioner<br />
av koldioxid till atmosfären vid användning<br />
av hyggesrester för el- och värmeproduktion, Report<br />
B1298, IVL Swedish Environment Research Institute,<br />
Stockholm.<br />
Zimmermann, J. P. (2009). End-use metering campaign<br />
in 400 households In <strong>Sweden</strong> - Assessment of the Potential<br />
Electricity Savings, Enertech, FELINES S/<br />
RIMANDOULE.<br />
Ågren, G., M. Svensson and M. Olsson (2010). Carbon<br />
balances and biofuel production at land use changes,<br />
Project report 32273-1, Swedish <strong>Energy</strong> Agency,<br />
Eskilstuna.<br />
Ågren, R.-M., S. Lindmark and R. Gorosch (2008).<br />
Halva Energin, hela välfärden, Faktaunderlag till<br />
Höstkonferens 89070, Naturskyddsföreningen,<br />
Stockholm.<br />
ENERGY SCENARIO <strong>2050</strong> 91<br />
Åkerman, J., G. Henriksson, S. Hunhammar, M.<br />
Höjer, D. Jonsson, Å. Moberg and P. Steen (2000).<br />
Destination framtiden - Vägar mot ett bärkraftigt<br />
transportsystem, KFB Rapport 2000:66, Kommunikations<strong>for</strong>skningsberedningen<br />
(KFB), Stockholm.<br />
Åkerman, J. and M. Höjer (2006). “How much<br />
transport can the climate stand?—<strong>Sweden</strong> on a<br />
sustainable path in <strong>2050</strong>.” <strong>Energy</strong> Policy 34(14):<br />
1944-1957.<br />
Åkerman, J., K. Isaksson, J. Johansson and L.<br />
Hedberg (2007). Tvågradersmålet i sikte? Scenarier<br />
<strong>for</strong> det svenska energi- och transportsystemet till år<br />
<strong>2050</strong>, Rapport 5754, Naturvårdsverket, Stockholm.<br />
Oktober.
ENERGY SCENARIO <strong>2050</strong> 92<br />
Appendix 1: Impacts on carbon emissions and<br />
atmospheric carbon from using branches and tops <strong>for</strong> energy<br />
This chapter is a special focus on carbon emissions from the use of <strong>for</strong>est residues,<br />
specifically tops and branches from final felling 13 . The objective here is to estimate<br />
the impacts on emissions and atmospheric carbon from using tops and<br />
branches in the Swedish energy scenario 2010-<strong>2050</strong> presented in this report. As<br />
there are long rotation times in boreal <strong>for</strong>ests some of the diagrams and results<br />
here have a time frame of 100 years.<br />
1. Why do tops and branches have a climate impact?<br />
When biofuels are combusted the carbon that once was bound in the growing <strong>for</strong>est is released,<br />
thus closing the biogenic carbon cycle. For this reason biofuels have been considered<br />
carbon neutral. For instance, in the EU emission trading system, carbon emissions from<br />
biofuels are not accounted <strong>for</strong> (European Commission 2003). However, Eriksson and Hallsby<br />
(1992) showed that using logging residues <strong>for</strong> energy, instead of leaving them on the ground,<br />
could lead to lower carbon storage in litter and soils. However, this effect is of transient<br />
character. If the residues were left on the ground, they would decompose and release carbon<br />
to the atmosphere. Using tops and branches <strong>for</strong> energy can there<strong>for</strong>e be seen as shifting the<br />
emissions earlier in time compared to the reference case of leaving them on the ground to<br />
decompose (Zetterberg and Hansen 1998; Lindholm et al. 2010). Figure 25 shows an example<br />
of estimated net emissions from using branches <strong>for</strong> energy, based on simulations of carbon<br />
stock changes in Southern Finland (Repo et al. 2010).<br />
13 Tops and branches are usually referred to as GROT in Swedish. GROT does not include stubs but can include tops and branches from <strong>for</strong> example final<br />
fellings but also thinnings. In the WWF adjusted scenario tops and branches cannot be removed from thinnings.
<strong>Energy</strong> <strong>Scenario</strong> <strong>2050</strong> IVL report<br />
g CO2/MJ<br />
100<br />
90<br />
80<br />
70<br />
60<br />
50<br />
40<br />
30<br />
20<br />
10<br />
0<br />
1<br />
6<br />
11<br />
16<br />
21<br />
26<br />
31<br />
36<br />
41<br />
46<br />
51<br />
56<br />
61<br />
66<br />
71<br />
76<br />
81<br />
86<br />
91<br />
96<br />
years after combustion<br />
ENERGY SCENARIO <strong>2050</strong> 93<br />
Figure 25: 25: An An example of of net emissions from using using branches branches (2 cm) (2 <strong>for</strong> cm) energy. <strong>for</strong> energy. Data is Data based is on based on<br />
simulations of carbon stock changes from from using using spruce spruce branches branches (2 cm) in (2 Southern cm) in Southern Finland (Repo Finland et al.<br />
(Repo 2010). et al. The 2010). initial The emission initial pulse emission from combustion pulse from is reduced combustion over time is due reduced to avoided over reference time due case to avoided<br />
reference emission case (leaving emission the branches (leaving on the the ground branches to decompose). on the ground to decompose).<br />
2. Emissions<br />
Emissions<br />
2. Emissions<br />
are calculated based on data on biogenic carbon stock changes. We define the net<br />
emissions from a biofuel as the emissions from the case of utilization minus the emissions<br />
Emissions are calculated based on data on biogenic carbon stock changes. We define the<br />
from a reference case:<br />
net emissions from a biofuel as the emissions from the case of utilization minus the<br />
emissions Enet = Efrom U-ERef a reference case:<br />
(1)<br />
This follows E the recommendations by Schlamadinger et al. (1997) and is applied by <strong>for</strong> in-<br />
net = EU-ERef (1)<br />
stance Lindholm et al (2010), Kirkinen et al (2008), Zetterberg and Hansén (1998) and Hagberg<br />
This and follows Holmgren the recommendations (2008). by Schlamadinger et al. (1997) and is applied by <strong>for</strong><br />
instance Lindholm et al (2010), Kirkinen et al (2008), Zetterberg and Hansén (1998) and<br />
Emissions, E, are calculated based on carbon stock change data, SC. If we assume that a<br />
Hagberg and Holmgren (2008).<br />
reduction of carbon stock results in an immediate emission, E, to the atmosphere, the emissions,<br />
Emissions,<br />
E(t), will<br />
E,<br />
be<br />
are<br />
equal<br />
calculated<br />
to the time<br />
based<br />
derivative<br />
on carbon<br />
of<br />
stock<br />
the carbon<br />
change<br />
stock<br />
data,<br />
change,<br />
SC. If we<br />
with<br />
assume<br />
opposite<br />
that<br />
sign:<br />
a<br />
reduction of carbon stock results in an immediate emission, E, to the atmosphere, (2) the<br />
emissions, E(t), will be equal to the time derivative of the carbon stock change, with<br />
where<br />
opposite<br />
the prime<br />
sign:<br />
symbol is used to signify the time derivative. Using (2) into (1) the net emissions,<br />
Enet will be:<br />
* ( ) ( )+<br />
E (<br />
net = ) SC’ Ref-SC’ U<br />
( ) (3) (2)<br />
95
where the prime symbol is used to signify the time derivative. Using (2) into (1) the net<br />
emissions, Enet will be:<br />
E net = SC‘ Ref-SC‘ U<br />
ENERGY SCENARIO <strong>2050</strong> 94<br />
3. 3. Remaining CO2 in CO2 atmosphere in atmosphere<br />
A pulse emission of CO2 results in an increase of atmospheric CO2. However, the remaining<br />
mass A pulse from this emission emission of CO pulse 2 results decreases in an over increase time, as of in atmospheric figure 2. CO2. However, the<br />
remaining mass from this emission pulse decreases over time, as in figure 2.<br />
kg<br />
1,20<br />
1,00<br />
0,80<br />
0,60<br />
0,40<br />
0,20<br />
0,00<br />
1 6 11 16 21 26 31 36 41 46 51 56 61 66 71 76 81 86 91 96<br />
Figure 26: Remaining amount of CO2 after a 1 kg pulse emission at t=0. Data from IPCC (2007b)<br />
The “decay” of atmospheric carbon is due to a number of processes that transport carbon<br />
from the atmosphere to other carbon pools, including uptake in ocean surface water and<br />
transport from surface water to deeper ocean.<br />
The Intergovernmental Panel on Climate Change, IPCC (2007b) has presented a carbon decay<br />
function as a combination of several exponential decay functions:<br />
CO2(t) = CO2(t=0)* [0.217 + 0.259 * e-t/172.9 +0.338 * e-t/18.51 + 0.186 * e-t/1.186 Figure 26: Remaining amount of CO2 after a 1 kg pulse emission at t=0. Data from IPCC (2007b)<br />
The ―decay‖ of atmospheric carbon is due to a number of processes that transport carbon<br />
from the atmosphere to other carbon pools, including uptake in ocean surface water and<br />
transport from surface water to deeper ocean.<br />
The Intergovernmental Panel on Climate Change, IPCC (2007b) has presented a carbon<br />
decay function as a combination of several exponential decay functions:<br />
] (4)<br />
CO<br />
4. System 2(t) = CO<br />
boundaries 2(t=0)* [0.217 + 0.259 * e<br />
In this study we investigate the impact on carbon emissions due to using tops and branches<br />
as a fuel in a Swedish energy system. We have only considered fluxes of biogenic carbon associated<br />
with growth, combustion, decomposition and changes of biogenic carbon pools in<br />
trees and soil. We have not included emissions from (fossil) fuel used in equipment <strong>for</strong> logging,<br />
collection, transport, refining and storage of fuels. Nor have we considered energy conversion<br />
losses, <strong>for</strong> instance in the production of electricity, heat or transport fuels. We have<br />
not considered substitution effects, such as the emissions avoided when biofuels replace fossil<br />
fuels. We have not included other greenhouse gases than CO2. Furthermore, possible effects<br />
on subsequent <strong>for</strong>est growth after removal of tops and branches are not accounted <strong>for</strong>.<br />
-t/172.9 +0.338 * e -t/18.51 + 0.186 * e -t/1.186 ] (4)<br />
4. System boundaries<br />
In this study we investigate the impact on carbon emissions due to using tops and branches<br />
as a fuel in a Swedish energy system. We have only considered fluxes of biogenic carbon<br />
associated with growth, combustion, decomposition and changes of biogenic carbon pools<br />
in trees and soil. We have not included emissions from (fossil) fuel used in equipment <strong>for</strong><br />
96<br />
Years<br />
(3)
conversion losses, <strong>for</strong> instance in the production of electricity, heat or transport fuels. We<br />
have not considered substitution effects, such as the emissions avoided when biofuels<br />
replace fossil fuels. We have not included other greenhouse gases than CO 2. Furthermore,<br />
ENERGY SCENARIO <strong>2050</strong> 95<br />
possible effects on subsequent <strong>for</strong>est growth after removal of tops and branches are not<br />
accounted <strong>for</strong>.<br />
5. 5. Carbon Carbon stock stock changes changes <strong>for</strong> use of tops <strong>for</strong> and use branches of tops and branches<br />
Emissions data <strong>for</strong> use of tops and branches are based on numerical simulations of carbon<br />
Emissions data <strong>for</strong> use of tops and branches are based on numerical simulations of carbon<br />
stock changes made by the “Q-model” (Ågren et al. 2010), presented in Figure 27. The data<br />
stock changes made by the ―Q-model‖ (Ågren et al. 2010), presented in Figure 27. The data<br />
provides carbon stock changes in the ecosystem (soil and trees) <strong>for</strong> two different manage-<br />
provides carbon stock changes in the ecosystem (soil and trees) <strong>for</strong> two different<br />
ment regimes:<br />
management regimes:<br />
• A reference case with no extraction of <strong>for</strong>est residues (tops and branches);<br />
A reference case with no extraction of <strong>for</strong>est residues (tops and branches);<br />
• Forest residues: 80% of tops and branches are removed at each harvest.<br />
Forest residues: 80% of tops and branches are removed at each harvest.<br />
Mg C/ha<br />
250<br />
230<br />
210<br />
190<br />
170<br />
150<br />
130<br />
110<br />
90<br />
70<br />
0<br />
12<br />
24<br />
36<br />
48<br />
60<br />
72<br />
84<br />
96<br />
108<br />
120<br />
132<br />
144<br />
156<br />
168<br />
180<br />
192<br />
204<br />
216<br />
228<br />
240<br />
252<br />
264<br />
276<br />
288<br />
300<br />
Years<br />
Reference case (no harvest) Harvest of branches and tops<br />
Figure 27: 27: Simulated carbon stock changes in in a a Swedish spruce spruce <strong>for</strong>est, <strong>for</strong>est, assuming two different utilization<br />
assuming cases. Data two is different from Ågren utilization et al. (2010) cases. Data is from Ågren et al. (2010)<br />
The The jaggedness jaggedness of of the the curve curve is due is due to to thinning thinning events. events. We We use use the the second second generation data data <strong>for</strong><br />
our <strong>for</strong> calculations, our calculations, from from 100 to 100 200 to years. 200 years.<br />
6. <strong>Energy</strong> scenario and emission factors<br />
The energy scenario <strong>for</strong> utilization of tops and branches is based on the Swedish energy<br />
scenario <strong>for</strong> the period 2010- <strong>2050</strong>, which has been developed in this project. We have made<br />
the assumption that after <strong>2050</strong> energy use is continued at the same level as in <strong>2050</strong> until the<br />
year 2110, see Figure 28<br />
97
6. <strong>Energy</strong> scenario and emission factors<br />
The energy scenario <strong>for</strong> utilization of tops and branches is based on the Swedish energy<br />
scenario <strong>for</strong> the period 2010- <strong>2050</strong>, which has been developed in this project. We have<br />
made the assumption that after <strong>2050</strong> energy use is continued at the same level as in <strong>2050</strong><br />
until the year 2110, see Figure 28<br />
Tops and branches TWh/a<br />
ENERGY SCENARIO <strong>2050</strong> 96<br />
Figure 28: Use of tops and branches in the energy scenario (TWh).<br />
Figure 28: Use of tops and branches in the energy scenario (TWh).<br />
In this report, the combustion-related emission factors are based on Repo et al. (2010) which<br />
is 94.4<br />
In<br />
g<br />
this<br />
CO<br />
report,<br />
2/MJ <strong>for</strong><br />
the<br />
tops<br />
combustion-related<br />
and branches. For<br />
emission<br />
oil, we<br />
factors<br />
assume<br />
are<br />
an<br />
based<br />
emission<br />
on Repo<br />
factor<br />
et<br />
of<br />
al.<br />
76.26<br />
(2010)<br />
g<br />
CO2/MJ,<br />
which<br />
which<br />
is 94.4<br />
is<br />
g<br />
the<br />
CO<br />
value 2/MJ<br />
used<br />
<strong>for</strong> tops<br />
in the<br />
and<br />
Swedish<br />
branches.<br />
national<br />
For oil,<br />
communication<br />
we assume an emission<br />
to the UNFCCC<br />
factor of<br />
(Naturvårdsverket<br />
76.26 g CO2/MJ, 2011).<br />
which is the value used in the Swedish national communication to the<br />
UNFCCC (Naturvårdsverket 2011).<br />
7. Emissions from using 1 MJ tops and branches at t=0<br />
Net emissions from using tops and branches are calculated as the difference between the two<br />
7. Emissions from using 1 MJ tops and branches at t=0<br />
curves in Figure 27, carbon stock changes from using tops and branches minus carbon stock<br />
changes Net from emissions not using from them. using The tops resulting and branches net emissions are calculated are shown as the in difference Figure 29. between the<br />
two curves 100 in Figure 27, carbon stock changes from using tops and branches minus carbon<br />
stock changes from not using them. The resulting net emissions are shown in Figure 29.<br />
<strong>Energy</strong> <strong>Scenario</strong> <strong>2050</strong> IVL report<br />
g CO2/MJ<br />
25<br />
20<br />
15<br />
10<br />
5<br />
0<br />
2010 2020 2030 2040 <strong>2050</strong><br />
90<br />
80<br />
70<br />
60<br />
50<br />
40<br />
30<br />
20<br />
10<br />
0<br />
0 10 20 30 40 50<br />
years 98<br />
60 70 80 90<br />
Figure 29: Net emissions from using 1 MJ tops and branches <strong>for</strong> energy at t=0.<br />
Figure 29: Net emissions from using 1 MJ tops and branches <strong>for</strong> energy at t=0.<br />
Just after combustion, emissions are 94 g CO2/MJ. This corresponds exactly to the carbon<br />
Just after combustion, emissions are 94 g CO2/MJ. This corresponds exactly to the carbon<br />
content of the fuel. However, directly after combustion, the net emissions decrease over<br />
content of the fuel. However, directly after combustion, the net emissions decrease over<br />
time. This is a result of the avoided reference case emissions – leaving the tops and branches<br />
time. This is a result of the avoided reference case emissions – leaving the tops and<br />
branches on the ground to decompose. This means that in contrast to emission factors of<br />
fossil fuels, the emission factor <strong>for</strong> tops and branches has a dynamic, time-dependent<br />
character. After 10 years, emissions from tops and branches are reduced to 40 g CO2/MJ; after 30 years to 10 g/MJ and after 100 years 5 g CO /MJ. For comparison, coal has an
ENERGY SCENARIO <strong>2050</strong> 97<br />
on the ground to decompose. This means that in contrast to emission factors of fossil fuels,<br />
the emission factor <strong>for</strong> tops and branches has a dynamic, time-dependent character. After 10<br />
years, emissions from tops and branches are reduced to 40 g CO 2/MJ; after 30 years to 10 g/<br />
MJ and after 100 years 5 g CO 2/MJ. For comparison, coal has an emission factor of 93 g CO 2,<br />
oil 76 g CO 2/MJ and natural gas 56 g CO 2/MJ (Naturvårdsverket 2011).<br />
The jaggedness of the curve is a result from thinning events at 33, 48 and 65 years. In the<br />
energy scenario presented in this report the tops and branches potential does not include<br />
resources from thinning. There is no available emission data <strong>for</strong> that scenario, so thinning is<br />
included here and the reader is kindly asked to keep this difference in mind.<br />
8. Calculated emissions <strong>for</strong> the energy scenario<br />
<strong>Energy</strong> <strong>Scenario</strong> <strong>2050</strong> IVL report<br />
Based on the net emissions from using one unit of tops and branches <strong>for</strong> energy (Figure<br />
29), emissions from our energy scenario are calculated and shown in Figure 30, expressed in<br />
Mton CO2. Here we introduce the theoretical concept of an energy source with no net emissions.<br />
This is done to show what happens to the accumulated carbon emissions when the<br />
emissions cease. Four different scenarios are presented:<br />
1. Tops and branches continued. Here, we assume tops and branches are used<br />
1. Tops throughout and branches the whole continued. period 2010-2109. Here, we assume tops and branches are used throughout<br />
the whole period 2010-2109.<br />
2. Oil continued. We assume oil is used throughout the whole period 2010-2109.<br />
2. Oil continued. We assume oil is used throughout the whole period 2010-2109.<br />
3. 3. Tops and and branches → emission free. free. We We assume tops and and branches are used until the<br />
year the year <strong>2050</strong>, <strong>2050</strong>, and and then then replaced replaced by an by energy an energy source source that that has has no no net net emissions.<br />
4. 4. Oil Oil → emission free. We We assume oil oil is is used until the year <strong>2050</strong>, and then replaced<br />
by by an an energy source that has no net emissions.<br />
Mton CO2<br />
600<br />
500<br />
400<br />
300<br />
200<br />
100<br />
0<br />
Oil continued<br />
Oil→emission free<br />
Tops and branches<br />
continued<br />
Tops and<br />
branches→emission free<br />
Figure<br />
Figure<br />
30:<br />
30:<br />
Calculated<br />
Calculated accumulated<br />
accumulated<br />
emissions<br />
emissions<br />
<strong>for</strong> the<br />
<strong>for</strong><br />
four<br />
the<br />
scenarios.<br />
four scenarios.<br />
All scenarios lead to net emissions. Using tops and branches leads to considerable emissions,<br />
but<br />
All<br />
using<br />
scenarios<br />
oil would<br />
lead<br />
increase<br />
to net emissions.<br />
atmospheric<br />
Using<br />
carbon<br />
tops<br />
significantly<br />
and branches<br />
more.<br />
leads to considerable<br />
emissions, but using oil would increase atmospheric carbon significantly more.<br />
<strong>Scenario</strong> 1. Tops and branches continued. If tops and branches are used as energy<br />
throughout the whole period, accumulated emissions from this scenario will be 88 Mton<br />
CO 2 in the year <strong>2050</strong> and 139 Mton in the year 2110. This corresponds to 1.4 Mton CO 2
ENERGY SCENARIO <strong>2050</strong> 98<br />
<strong>Scenario</strong> 1. Tops and branches continued. If tops and branches are used as energy throughout<br />
the whole period, accumulated emissions from this scenario will be 88 Mton CO2 in the<br />
year <strong>2050</strong> and 139 Mton in the year 2110. This corresponds to 1.4 Mton CO2 per year during<br />
<strong>Energy</strong> <strong>Scenario</strong> <strong>2050</strong> IVL report<br />
this 100 year period, or 19 g CO2/MJ. <strong>Scenario</strong> 2. Oil continued. However, using oil instead of tops and branches would lead to<br />
significantly higher emissions than tops and branches. If oil is used as energy throughout the<br />
whole period, accumulated emissions will be 209 Mton CO2 in the year <strong>2050</strong> and 540 Mton<br />
in the<br />
<strong>Scenario</strong><br />
year 2110.<br />
3. Tops<br />
This<br />
and<br />
corresponds<br />
branches<br />
to<br />
→<br />
5.4<br />
emission<br />
Mton CO<br />
free. 2 per<br />
If<br />
year<br />
tops<br />
during<br />
and branches<br />
this 100<br />
are<br />
year<br />
used<br />
period,<br />
2010or<br />
74 g<br />
<strong>2050</strong><br />
CO2/MJ. and then replaced by emissions free energy, accumulated emissions will be 28 Mton<br />
<strong>Scenario</strong> CO2 in 3. the Tops year and 2110. branches The sudden → emission decrease in free. accumulated If tops and emissions branches in are the used year <strong>2050</strong> 2010-<strong>2050</strong> is a<br />
and result then from replaced avoided by emissions in free the energy, reference accumulated case of leaving emissions the tops will and be branches 28 Mton on COthe 2 in<br />
the ground year 2110. to decompose. The sudden decrease in accumulated emissions in the year <strong>2050</strong> is a result from<br />
avoided emissions in the reference case of leaving the tops and branches on the ground to<br />
decompose.<br />
<strong>Scenario</strong> 4. Oil → emission free. If oil is used 2010-<strong>2050</strong> and then replaced by emissionfree<br />
energy, accumulated emissions will be 209 Mton CO2 in the year 2110.<br />
<strong>Scenario</strong> 4. Oil → emission free. If oil is used 2010-<strong>2050</strong> and then replaced by emission-free<br />
energy, accumulated emissions will be 209 Mton CO2 in the year 2110.<br />
9. Remaining carbon in the atmosphere<br />
9. Remaining carbon in the atmosphere<br />
Based Based on on our our calculated calculated emissions emissions (Figure (Figure 30), 30), and the decay decay function function (Figure (Figure 29) 29) the the<br />
remaining remaining amount amount of of atmospheric atmospheric carbon carbon is is calculated calculated and and shown shown in in Figure Figure 31, 31, expressed expressed in<br />
Mton in Mton CO CO<br />
2. 2.<br />
Mton CO2<br />
300<br />
250<br />
200<br />
150<br />
100<br />
50<br />
0<br />
Oil continued<br />
Oil→emission free<br />
Tops and branches<br />
continued<br />
Tops and<br />
branches→emission<br />
free<br />
Figure Figure 31: 31: Remaining carbon in the atmosphere from from our our four four scenarios scenarios<br />
All<br />
All<br />
scenarios<br />
scenarios<br />
lead<br />
lead<br />
to<br />
to<br />
increased<br />
increased<br />
atmospheric<br />
atmospheric<br />
concentrations<br />
concentrations<br />
of<br />
of<br />
CO<br />
CO2. Due to the uptake of at-<br />
2. Due to the uptake of<br />
mospheric<br />
atmospheric<br />
carbon<br />
carbon<br />
in ocean<br />
in ocean<br />
water and<br />
water<br />
other<br />
and<br />
sink<br />
other<br />
processes<br />
sink processes<br />
about 40-50%<br />
about<br />
of<br />
40-50%<br />
the accumulated<br />
of the<br />
emissions<br />
accumulated<br />
remain<br />
emissions<br />
in the atmosphere<br />
remain in the<br />
after<br />
atmosphere<br />
100 years.<br />
after<br />
Using<br />
100<br />
tops<br />
years.<br />
and<br />
Using<br />
branches<br />
tops and<br />
leads<br />
branches<br />
to an increase<br />
leads<br />
in<br />
to<br />
atmospheric<br />
an increase<br />
carbon,<br />
in atmospheric<br />
but using<br />
carbon,<br />
oil would<br />
but<br />
increase<br />
using oil<br />
atmospheric<br />
would increase<br />
carbon<br />
atmospheric<br />
significantly<br />
more.<br />
carbon significantly more.<br />
<strong>Scenario</strong> 1. Tops and branches continued. If tops and branches are used as energy<br />
throughout the whole period, remaining atmospheric carbon will be 48 Mton CO 2 in the<br />
year <strong>2050</strong> and 59 Mton in the year 2110.
ENERGY SCENARIO <strong>2050</strong> 99<br />
<strong>Scenario</strong> 1. Tops and branches continued. If tops and branches are used as energy throughout<br />
the whole period, remaining atmospheric carbon will be 48 Mton CO 2 in the year <strong>2050</strong><br />
and 59 Mton in the year 2110.<br />
<strong>Scenario</strong> 2. Oil continued. If oil is used as energy throughout the whole period, remaining<br />
atmospheric carbon will be 126 Mton CO 2 in the year <strong>2050</strong> and 262 Mton in the year 2110.<br />
If emissions cease in the year <strong>2050</strong>, there will be a very prompt decrease in atmospheric mass<br />
from both the tops and branches scenario (3. Tops and branches → emission free) and the<br />
oil-scenario (4. Oil → emission free). The decrease in remaining atmospheric mass from the<br />
oil-scenario (4. Oil → emission free) is due to uptake of atmospheric carbon in ocean water<br />
and other sink processes. For the tops and branches scenario, the sudden decrease in atmospheric<br />
mass is due to two processes; first as a result of avoided emissions from the reference<br />
case, and secondly due to the same atmospheric sink processes as in the oil scenario.<br />
<strong>Scenario</strong> 3. Tops and branches → emission free. If tops and branches are used 2010-<strong>2050</strong><br />
and then replaced by emission-free energy, remaining atmospheric carbon will be 5 Mton<br />
CO 2 in the year 2110.<br />
<strong>Scenario</strong> 4. Oil → emission free. If oil is used 2010-<strong>2050</strong> and then replaced by emission-free<br />
energy, remaining atmospheric carbon will be 81 Mton CO2 in the year 2110.<br />
10. Concluding remarks on the dynamic perspective of emissions from use of tops and<br />
branches<br />
We have investigated the impact on emissions and atmospheric carbon from using tops and<br />
branches in a Swedish energy scenario in 2010-2110. This scenario has also been compared<br />
with an alternative scenario of using oil instead of tops and branches. We conclude that:<br />
Using tops and branches <strong>for</strong> energy instead of leaving them on the ground to decompose<br />
leads to net emissions of carbon to the atmosphere. The reason <strong>for</strong> this is the time lag between<br />
combustion-related emissions compared to the emissions from decomposition.<br />
Our estimates indicate that using tops and branches <strong>for</strong> energy at a level of about 19-21 TWh<br />
per year <strong>for</strong> 100 years will lead to net accumulated emissions of approximately 139 Mton<br />
CO2, or 19 g/MJ fuel. We estimate that the remaining amount of atmospheric carbon from<br />
the use of tops and branches in this scenario after 100 years will be 59 Mton CO 2. In <strong>2050</strong> the<br />
same figure is 48 Mton CO 2. This difference between net accumulated emissions and remaining<br />
amount of atmospheric carbon is due to the uptake of atmospheric carbon in ocean water<br />
and other sink processes.<br />
However, using the same amount of oil would increase the accumulated emissions by a factor<br />
of approximately 4 over the same period, corresponding to 540 Mton CO 2, or 74 g CO 2/MJ<br />
oil after 100 years. The remaining amount of carbon in the atmosphere from this emission<br />
scenario will be 262 Mton CO 2 after 100 years. In <strong>2050</strong> the figure <strong>for</strong> oil continued would be<br />
126 Mton CO2.<br />
If emissions cease in the year <strong>2050</strong>, <strong>for</strong> instance due to changing to a completely emissionfree<br />
energy source, the impact on atmospheric carbon decreases significantly. For tops and<br />
branches, if emissions cease in the year <strong>2050</strong>, the remaining amount of atmospheric carbon
ENERGY SCENARIO <strong>2050</strong> 100<br />
will be 5 Mton in the year 2110. For oil, if emissions cease in the year <strong>2050</strong>, the remaining<br />
amount of atmospheric carbon will be 81 Mton in the year 2110.<br />
This study has found that using tops and branches <strong>for</strong> energy will increase the net emissions<br />
of carbon and increase the atmospheric carbon concentrations. However, as compared to using<br />
oil, tops and branches will reduce the global carbon emissions significantly. Moreover, in<br />
spite of the relative climate benefits of tops and branches there may be other biomass alternatives<br />
that are even more beneficial <strong>for</strong> climate mitigation. For instance, the establishment<br />
of new <strong>for</strong>est on earlier crop land is likely to reduce atmospheric carbon and would have a<br />
net cooling effect (Zetterberg and Chen 2011). Above conclusions, however, do not account<br />
<strong>for</strong> emissions in production, transports and conversion losses nor <strong>for</strong> possible subsequent<br />
effects on subsequent <strong>for</strong>est growth.