Sladek et al., 2007 - Duke Institute for Genome Sciences & Policy
Sladek et al., 2007 - Duke Institute for Genome Sciences & Policy
Sladek et al., 2007 - Duke Institute for Genome Sciences & Policy

Create successful ePaper yourself
Turn your PDF publications into a flip-book with our unique Google optimized e-Paper software.
Vol 445 | 22 February <strong>2007</strong> | doi:10.1038/nature05616<br />
ARTICLES<br />
A genome-wide association study<br />
identifies novel risk loci <strong>for</strong> type 2 diab<strong>et</strong>es<br />
Robert <strong>Sladek</strong> 1,2,4 , Ghislain Rocheleau 1 *, Johan Rung 4 *, Christian Dina 5 *, Lishuang Shen 1 , David Serre 1 ,<br />
Philippe Boutin 5 , Daniel Vincent 4 , Alexandre Belisle 4 , Samy Hadjadj 6 , Beverley B<strong>al</strong>kau 7 , Barbara Heude 7 ,<br />
Guillaume Charpentier 8 , Thomas J. Hudson 4,9 , Alexandre Montp<strong>et</strong>it 4 , Alexey V. Pshezh<strong>et</strong>sky 10 , Marc Prentki 10,11 ,<br />
Barry I. Posner 2,12 , David J. B<strong>al</strong>ding 13 , David Meyre 5 , Constantin Polychronakos 1,3 & Philippe Froguel 5,14<br />
Type 2 diab<strong>et</strong>es mellitus results from the interaction of environment<strong>al</strong> factors with a combination of gen<strong>et</strong>ic variants, most of<br />
which were hitherto unknown. A systematic search <strong>for</strong> these variants was recently made possible by the development of<br />
high-density arrays that permit the genotyping of hundreds of thousands of polymorphisms. We tested 392,935<br />
single-nucleotide polymorphisms in a French case–control cohort. Markers with the most significant difference in genotype<br />
frequencies b<strong>et</strong>ween cases of type 2 diab<strong>et</strong>es and controls were fast-tracked <strong>for</strong> testing in a second cohort. This identified<br />
four loci containing variants that confer type 2 diab<strong>et</strong>es risk, in addition to confirming the known association with the TCF7L2<br />
gene. These loci include a non-synonymous polymorphism in the zinc transporter SLC30A8, which is expressed exclusively in<br />
insulin-producing b-cells, and two linkage disequilibrium blocks that contain genes potenti<strong>al</strong>ly involved in b-cell<br />
development or function (IDE–KIF11–HHEX and EXT2–ALX4). These associations explain a substanti<strong>al</strong> portion of disease risk<br />
and constitute proof of principle <strong>for</strong> the genome-wide approach to the elucidation of complex gen<strong>et</strong>ic traits.<br />
The rapidly increasing prev<strong>al</strong>ence of type 2 diab<strong>et</strong>es mellitus (T2DM) is<br />
thought to be due to environment<strong>al</strong> factors, such as increased availability<br />
of food and decreased opportunity and motivation <strong>for</strong> physic<strong>al</strong><br />
activity, acting on gen<strong>et</strong>ic<strong>al</strong>ly susceptible individu<strong>al</strong>s. The heritability<br />
of T2DM is one of the best established among common diseases and,<br />
consequently, gen<strong>et</strong>ic risk factors <strong>for</strong> T2DM have been the subject of<br />
intense research 1 . Although the gen<strong>et</strong>ic causes of many monogenic<br />
<strong>for</strong>ms of diab<strong>et</strong>es (maturity ons<strong>et</strong> diab<strong>et</strong>es in the young, neonat<strong>al</strong> mitochondri<strong>al</strong><br />
and other syndromic types of diab<strong>et</strong>es mellitus) have been<br />
elucidated, few variants leading to common T2DM have been clearly<br />
identified and individu<strong>al</strong>ly confer only a sm<strong>al</strong>l risk (odds ratio < 1.1–<br />
1.25) of developing T2DM 1 . Linkage studies have reported many<br />
T2DM-linked chromosom<strong>al</strong> regions and have identified putative, causative<br />
gen<strong>et</strong>ic variants in CAPN10 (ref. 2), ENPP1 (ref. 3), HNF4A (refs<br />
4, 5) and ACDC (<strong>al</strong>so c<strong>al</strong>led ADIPOQ) 6 . In par<strong>al</strong>lel, candidate-gene<br />
studies have reported many T2DM-associated loci, with coding variants<br />
in the nuclear receptor PPARG (P12A) 7 and the potassium channel<br />
KCNJ11 (E23K) 8 being among the very few that have been convincingly<br />
replicated. The strongest known (odds ratio < 1.7) T2DM association 9<br />
was recently mapped to the transcription factor TCF7L2 and has been<br />
consistently replicated in multiple populations 10–20 .<br />
Subjects and study design<br />
The recent availability of high-density genotyping arrays, which combine<br />
the power of association studies with the systematic nature of a<br />
genome-wide search, led us to undertake a two-stage, genome-wide<br />
association study to identify addition<strong>al</strong> T2DM susceptibility loci<br />
(Supplementary Fig. 1). In the first stage of this study, we obtained<br />
genotypes <strong>for</strong> 392,935 single-nucleotide polymorphisms (SNPs) in<br />
1,363 T2DM cases and controls (Supplementary Table 1). In order to<br />
enrich <strong>for</strong> risk <strong>al</strong>leles 21 , the diab<strong>et</strong>ic subjects studied in stage 1 were<br />
selected to have at least one affected first degree relative and age at<br />
ons<strong>et</strong> under 45 yr (excluding patients with maturity ons<strong>et</strong> diab<strong>et</strong>es in<br />
the young). Furthermore, in order to decrease phenotypic h<strong>et</strong>erogeneity<br />
and to enrich <strong>for</strong> variants d<strong>et</strong>ermining insulin resistance and<br />
b-cell dysfunction through mechanisms other than severe obesity, we<br />
initi<strong>al</strong>ly studied diab<strong>et</strong>ic patients with a body mass index (BMI)<br />
,30 kg m 22 . Control subjects were selected to have fasting blood<br />
glucose ,5.7 mmol l 21 in DESIR, a large prospective cohort <strong>for</strong> the<br />
study of insulin resistance in French subjects 22 .<br />
Genotypes <strong>for</strong> each study subject were obtained using two plat<strong>for</strong>ms:<br />
Illumina Infinium Human1 BeadArrays, which assay 109,365<br />
SNPs chosen using a gene-centred design; and Human Hap300<br />
BeadArrays, which assay 317,503 SNPs chosen to tag haplotype<br />
blocks identified by the Phase I HapMap 23 . Of the 409,927 markers<br />
that passed qu<strong>al</strong>ity control (Supplementary Tables 2 and 3), genotypes<br />
were obtained <strong>for</strong> an average of 99.2% (Human1) and 99.4%<br />
(Hap300) of markers <strong>for</strong> each subject with a reproducibility of<br />
.99.9% (both plat<strong>for</strong>ms). Forty-three subjects were removed from<br />
an<strong>al</strong>ysis because of evidence of intercontinent<strong>al</strong> admixture (Supplementary<br />
Fig. 3) and an addition<strong>al</strong> four because their genotyped<strong>et</strong>ermined<br />
gender disagreed with clinic<strong>al</strong> records. In tot<strong>al</strong>, T2DM<br />
association was tested <strong>for</strong> 100,764 (Human1) and 309,163 (Hap300)<br />
SNPs representing 392,935 unique loci (Fig. 1). Because of unequ<strong>al</strong><br />
m<strong>al</strong>e/fem<strong>al</strong>e ratios in our cases and controls, we an<strong>al</strong>ysed the 12,666<br />
sex-chromosome SNPs separately <strong>for</strong> each gender.<br />
1 2 3 4<br />
Departments of Human Gen<strong>et</strong>ics, Medicine and Pediatrics, Faculty of Medicine, McGill University, Montre<strong>al</strong> H3H 1P3, Canada. McGill University and <strong>Genome</strong> Quebec Innovation<br />
Centre, Montre<strong>al</strong> H3A 1A4, Canada.<br />
*These authors contributed equ<strong>al</strong>ly to this work.<br />
5 CNRS 8090-<strong>Institute</strong> of Biology, Pasteur <strong>Institute</strong>, Lille 59019 Cedex, France. 6 Endocrinology and Diab<strong>et</strong>ology, University Hospit<strong>al</strong>, Poitiers<br />
86021 Cedex, France. 7 INSERM U780-IFR69, Villejuif 94807, France. 8 Endocrinology-Diab<strong>et</strong>ology Unit, Corbeil-Essonnes Hospit<strong>al</strong>, Corbeil-Essonnes 91100, France. 9 Ontario<br />
<strong>Institute</strong> <strong>for</strong> Cancer Research, Toronto M5G 1L7, Canada. 10 Montre<strong>al</strong> Diab<strong>et</strong>es Research Center, Montre<strong>al</strong> H2L 4M1, Canada. 11 Molecular Nutrition Unit and the Department of<br />
Nutrition, University of Montre<strong>al</strong> and the Centre Hospit<strong>al</strong>ier de l’Université de Montré<strong>al</strong>, Montre<strong>al</strong> H3C 3J7, Canada. 12 Polypeptide Hormone Laboratory and Department of Anatomy<br />
and Cell Biology, Montre<strong>al</strong> H3A 2B2, Canada. 13 Department of Epidemiology & Public He<strong>al</strong>th, Imperi<strong>al</strong> College, St Mary’s Campus, Norfolk Place, London W2 1PG, UK. 14 Section of<br />
Genomic Medicine, Imperi<strong>al</strong> College London W12 0NN, and Hammersmith Hospit<strong>al</strong>, Du Cane Road, London W12 0HS, UK.<br />
©<strong>2007</strong> Nature Publishing Group<br />
881
ARTICLES NATURE | Vol 445 |22 February <strong>2007</strong><br />
An<strong>al</strong>ysis<br />
Markers were selected <strong>for</strong> assessment in a second cohort using significance<br />
thresholds on the basis of the divergence b<strong>et</strong>ween the<br />
observed and expected P-v<strong>al</strong>ues (Supplementary Figs 4 and 5).<br />
These included 28 autosom<strong>al</strong> SNPs from the Human1 chip<br />
(P , 1 3 10 24 ; Supplementary Table 4) and 43 autosom<strong>al</strong> SNPs from<br />
the Hap300 chip (P , 5 3 10 25 ; Supplementary Table 5) <strong>for</strong> a tot<strong>al</strong> of<br />
66 unique SNPs representing 44 unique loci. No X-linked marker<br />
attained significance, a result that may be due to reduced power of the<br />
gender-specific an<strong>al</strong>ysis. P-v<strong>al</strong>ues c<strong>al</strong>culated using 10,000 permutations<br />
of the disease state labels identified the same significant associations<br />
(Supplementary Tables 4 and 5). Our stage 1 results included<br />
the known T2DM association 9 with the TCF7L2 SNP rs7903146<br />
(P 5 3.2 3 10 217 ). Sever<strong>al</strong> other SNPs at that locus <strong>al</strong>so attained<br />
genome-wide significance after correcting <strong>for</strong> 392,935 tests. In contrast,<br />
none of the other previously identified T2DM genes did so (<strong>for</strong><br />
example, PPARG), which is not surprising because our stage 1 had<br />
limited power to d<strong>et</strong>ect their modest effect and <strong>al</strong>so the arrays did not<br />
include the best-associated variants at these loci. However, SNPs<br />
tagging four out of seven of these loci attained significance at<br />
P , 0.05 (Supplementary Table 6).<br />
Because one of the loci showing the strongest T2DM association<br />
(rs932206) maps 200 kilobases (kb) telomeric to the lactase gene on<br />
2q21, a region displaying recent positive selection and a north-tosouth<br />
minor <strong>al</strong>lele frequency (MAF) gradient in Europe, we suspected<br />
a spurious association due to population stratification 24 .<br />
This was tested with princip<strong>al</strong> component an<strong>al</strong>ysis using 20,323 markers<br />
with MAF $ 0.1, perfectly genotyped in <strong>al</strong>l samples on the<br />
Human Hap300 chip, showing no T2DM association in stage 1<br />
(P . 0.01) and separated by at least 100 kb. Using the first princip<strong>al</strong><br />
component as a covariate <strong>for</strong> ancestry differences b<strong>et</strong>ween cases and<br />
controls, we tested <strong>for</strong> association b<strong>et</strong>ween rs932206 and disease<br />
status. Our result suggests that this apparent association is largely<br />
5<br />
3<br />
1<br />
5<br />
3<br />
1<br />
5<br />
3<br />
1<br />
5<br />
3<br />
1<br />
5<br />
3<br />
1<br />
5<br />
3<br />
1<br />
5<br />
3<br />
1<br />
5<br />
3<br />
1<br />
5<br />
3<br />
1<br />
5<br />
3<br />
1<br />
5<br />
3<br />
1<br />
5<br />
3<br />
1<br />
5<br />
3<br />
1<br />
5<br />
3<br />
1<br />
5<br />
3<br />
1<br />
attributable to ancestry differences (P 5 0.0016 after adjusting <strong>for</strong><br />
stratification). However, the selection responsible <strong>for</strong> the European<br />
gradient may be related to m<strong>et</strong>abolic fitness and T2DM risk, and<br />
there<strong>for</strong>e the observed association may not be spurious. Similar testing<br />
of the other significant loci did not reve<strong>al</strong> evidence of stratification<br />
and the correction did not affect the statistic<strong>al</strong> significance of<br />
their association with T2DM.<br />
We thus prioritized 59 SNPs showing significant association in<br />
stage 1, including one of the eight significant TCF7L2 markers, <strong>for</strong><br />
rapid confirmation on a larger cohort, using the Sequenom iPlex<br />
assay (Supplementary Fig. 1). We successfully obtained genotypes<br />
from 2,617 T2DM cases and 2,894 controls <strong>for</strong> 57 SNPs (see<br />
Supplementary In<strong>for</strong>mation). Unlike the stage 1 sample, the affected<br />
individu<strong>al</strong>s used in stage 2 were not required to have a family history<br />
of T2DM or to be lean (however, severely obese subjects were<br />
excluded by requiring BMI , 35 kg m 22 ). We <strong>al</strong>so relaxed the inclusion<br />
criteria <strong>for</strong> control subjects to include individu<strong>al</strong>s with norm<strong>al</strong><br />
fasting glucose levels according to 1997 American Diab<strong>et</strong>es<br />
Association (ADA) criteria (,6.1 mM). The SNPs selected <strong>for</strong> rapid<br />
v<strong>al</strong>idation were an<strong>al</strong>ysed an<strong>al</strong>ogously to stage 1 (Supplementary<br />
Table 7). In tot<strong>al</strong>, eight SNPs representing five unique loci showed<br />
significant association after Bonferroni correction was applied <strong>for</strong> the<br />
57 SNPs tested, based on P-v<strong>al</strong>ues c<strong>al</strong>culated using 10,000,000 permutations<br />
of the disease state labels (Table 1). Because the v<strong>al</strong>idation<br />
stage samples were selected on the basis of more relaxed inclusion<br />
criteria than the stage 1 samples, we used a logistic regression model<br />
to investigate the effect of phenotypic variables on T2DM association.<br />
The W<strong>al</strong>d test was used to assess effects of age, sex and<br />
BMI on the association b<strong>et</strong>ween marker and disease, as it is asymptotic<strong>al</strong>ly<br />
equiv<strong>al</strong>ent to the Armitage trend test used to d<strong>et</strong>ect association<br />
in stages 1 and 2. None of the associations (Supplementary<br />
Table 7) was substanti<strong>al</strong>ly changed by considering the effects of these<br />
covariates.<br />
1 2 3 4 5<br />
6 7 8 9 10<br />
11 12 13 14 15<br />
16 17 18<br />
19 20<br />
21 22 X<br />
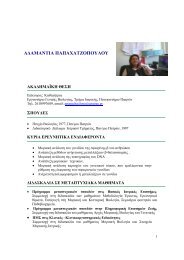
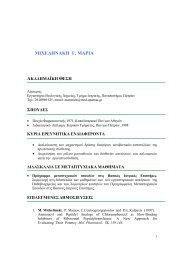
Figure 1 | Graphic<strong>al</strong> summary of stage 1 association results. T2DM<br />
association was d<strong>et</strong>ermined <strong>for</strong> SNPs on the Human1 and Hap300 chips. The<br />
x axis represents the chromosome position from pter; the y axis shows<br />
882<br />
©<strong>2007</strong> Nature Publishing Group<br />
5<br />
3<br />
1<br />
5<br />
3<br />
1<br />
5<br />
3<br />
1<br />
5<br />
3<br />
1<br />
5<br />
3<br />
1<br />
15<br />
10<br />
5<br />
2log10[pMAX], the P-v<strong>al</strong>ue obtained by the MAX statistic, <strong>for</strong> each SNP<br />
(Note the different sc<strong>al</strong>e on the y axis of the chromosome 10 plot.). SNPs that<br />
passed the cutoff <strong>for</strong> a fast-tracked second stage are highlighted in red.<br />
5<br />
3<br />
1<br />
5<br />
3<br />
1
NATURE | Vol 445 |22 February <strong>2007</strong> ARTICLES<br />
Table 1 | Confirmed association results<br />
SNP Chromosome Position<br />
(nucleotides)<br />
Risk<br />
<strong>al</strong>lele<br />
Major<br />
<strong>al</strong>lele<br />
MAF<br />
(case)<br />
MAF<br />
(ctrl)<br />
Odds ratio<br />
(h<strong>et</strong>)<br />
Odds ratio<br />
(hom)<br />
Identification of four novel T2DM loci<br />
Our fast-track stage 2 genotyping confirmed the reported association<br />
<strong>for</strong> rs7903146 (TCF7L2) on chromosome 10, and in addition identified<br />
significant associations <strong>for</strong> seven SNPs representing four new<br />
T2DM loci (Table 1). In <strong>al</strong>l cases, the strongest association <strong>for</strong> the<br />
MAX statistic (see M<strong>et</strong>hods) was obtained with the additive model.<br />
PAR ls Stage 2<br />
pMAX<br />
Stage 2 pMAX<br />
(perm)<br />
Stage 1<br />
pMAX<br />
Stage 1 pMAX<br />
(perm)<br />
rs7903146 10 114,748,339 T C 0.406 0.293 1.65 6 0.19 2.77 6 0.50 0.28 1.0546 1.5 3 10 234 ,1.0 3 10 27<br />
3.2 3 10 217 ,3.3 3 10 210<br />
TCF7L2<br />
rs13266634 8 118,253,964 C C 0.254 0.301 1.18 6 0.25 1.53 6 0.31 0.24 1.0089 6.1 3 10 28<br />
5.0 3 10 27<br />
2.1 3 10 25<br />
1.8 3 10 25<br />
SLC30A8<br />
rs1111875 10 94,452,862 G G 0.358 0.402 1.19 6 0.19 1.44 6 0.24 0.19 1.0069 3.0 3 10 26<br />
7.4 3 10 26<br />
9.1 3 10 26<br />
7.3 3 10 26<br />
HHEX<br />
rs7923837 10 94,471,897 G G 0.335 0.377 1.22 6 0.21 1.45 6 0.25 0.20 1.0065 7.5 3 10 26<br />
2.2 3 10 25<br />
3.4 3 10 26<br />
2.5 3 10 26<br />
HHEX<br />
rs7480010 11 42,203,294 G A 0.336 0.301 1.14 6 0.13 1.40 6 0.25 0.08 1.0041 1.1 3 10 24<br />
2.9 3 10 24<br />
1.5 3 10 25<br />
1.2 3 10 25<br />
LOC387761<br />
rs3740878 11 44,214,378 A A 0.240 0.272 1.26 6 0.29 1.46 6 0.33 0.24 1.0046 1.2 3 10 24<br />
2.8 3 10 24<br />
1.8 3 10 25<br />
1.3 3 10 25<br />
EXT2<br />
rs11037909 11 44,212,190 T T 0.240 0.271 1.27 6 0.30 1.47 6 0.33 0.25 1.0045 1.8 3 10 24<br />
4.5 3 10 24<br />
1.8 3 10 25<br />
1.3 3 10 25<br />
EXT2<br />
rs1113132 11 44,209,979 C C 0.237 0.267 1.15 6 0.27 1.36 6 0.31 0.19 1.0044 3.3 3 10 24<br />
8.1 3 10 24<br />
3.7 3 10 25<br />
2.9 3 10 25<br />
EXT2<br />
Significant T2DM associations were confirmed <strong>for</strong> eight SNPs in five loci. Allele frequencies, odds ratios (with 95% confidence interv<strong>al</strong>s) and PAR were c<strong>al</strong>culated using only the stage 2 data. Allele<br />
frequencies in the controls were very close to those reported <strong>for</strong> the CEU s<strong>et</strong> (European subjects genotyped in the HapMap project). Induced sibling recurrent risk ratios (ls) were estimated using<br />
stage 2 genotype counts <strong>for</strong> the control subjects and assuming a T2DM prev<strong>al</strong>ence of 7% in the French population. hom, homozygous; h<strong>et</strong>, h<strong>et</strong>erozygous; major <strong>al</strong>lele, the <strong>al</strong>lele with the higher<br />
frequency in controls; pMAX, P-v<strong>al</strong>ue of the MAX statistic from the x 2 distribution; pMAX (perm), P-v<strong>al</strong>ue of the MAX statistic from the permutation-derived empiric<strong>al</strong> distribution (pMAX and<br />
pMAX (perm) are adjusted <strong>for</strong> variance inflation); risk <strong>al</strong>lele, the <strong>al</strong>lele with higher frequency in cases compared with controls.<br />
a b<br />
4<br />
2<br />
0<br />
–log 10 [P]<br />
–log 10 [P]<br />
4<br />
6<br />
8<br />
8<br />
3<br />
9<br />
2<br />
s<br />
r<br />
4<br />
2<br />
0<br />
0<br />
8<br />
8<br />
9<br />
1<br />
0<br />
3<br />
s<br />
r<br />
8<br />
6<br />
6<br />
9<br />
6<br />
4<br />
6<br />
s<br />
r<br />
5<br />
8<br />
8<br />
9<br />
1<br />
0<br />
3<br />
s<br />
r<br />
2<br />
9<br />
2<br />
5<br />
0<br />
5<br />
0<br />
1<br />
s<br />
r<br />
6<br />
4<br />
6<br />
1<br />
0<br />
0<br />
1<br />
s<br />
r<br />
9<br />
1<br />
5<br />
1<br />
8<br />
7<br />
1<br />
1<br />
s<br />
r<br />
2<br />
6<br />
9<br />
7<br />
4<br />
0<br />
2<br />
s<br />
r<br />
7<br />
5<br />
0<br />
1<br />
1<br />
0<br />
7<br />
s<br />
r<br />
4<br />
7<br />
8<br />
4<br />
9<br />
3<br />
1<br />
s<br />
r<br />
4<br />
3<br />
7<br />
3<br />
3<br />
8<br />
7<br />
s<br />
r<br />
1<br />
5<br />
6<br />
8<br />
6<br />
8<br />
s<br />
r<br />
1<br />
2<br />
5<br />
5<br />
0<br />
5<br />
1<br />
s<br />
r<br />
7<br />
4<br />
9<br />
2<br />
6<br />
0<br />
2<br />
s<br />
r<br />
*<br />
5<br />
0<br />
5<br />
0<br />
0<br />
0<br />
7<br />
s<br />
r<br />
*<br />
*<br />
3<br />
9<br />
2<br />
5<br />
0<br />
5<br />
0<br />
1<br />
s<br />
r<br />
2<br />
1<br />
7<br />
3<br />
3<br />
8<br />
7<br />
s<br />
r<br />
5<br />
7<br />
8<br />
4<br />
9<br />
3<br />
1<br />
s<br />
r<br />
4<br />
1<br />
3<br />
5<br />
0<br />
5<br />
0<br />
1<br />
s<br />
r<br />
4<br />
7<br />
6<br />
9<br />
6<br />
4<br />
6<br />
s<br />
r<br />
4<br />
5<br />
7<br />
7<br />
1<br />
8<br />
7<br />
s<br />
r<br />
5<br />
7<br />
6<br />
9<br />
6<br />
4<br />
6<br />
s<br />
r<br />
*<br />
rs2464592<br />
rs2466299<br />
rs13266634<br />
rs2466295<br />
0<br />
1<br />
3<br />
5<br />
0<br />
5<br />
0<br />
1<br />
s<br />
r<br />
c d<br />
3<br />
9<br />
2<br />
6<br />
6<br />
4<br />
2<br />
s<br />
r<br />
0<br />
4<br />
9<br />
2<br />
8<br />
2<br />
0<br />
1<br />
s<br />
r<br />
8<br />
7<br />
9<br />
8<br />
7<br />
5<br />
1<br />
s<br />
r<br />
1<br />
8<br />
6<br />
9<br />
6<br />
4<br />
6<br />
s<br />
r<br />
8<br />
1<br />
3<br />
6<br />
6<br />
4<br />
2<br />
s<br />
r<br />
*<br />
6<br />
1<br />
3<br />
6<br />
6<br />
4<br />
2<br />
s<br />
r<br />
2<br />
2<br />
2<br />
5<br />
9<br />
9<br />
1<br />
s<br />
r<br />
0<br />
4<br />
1<br />
5<br />
0<br />
0<br />
7<br />
s<br />
r<br />
0<br />
3<br />
6<br />
1<br />
6<br />
9<br />
s<br />
r<br />
9<br />
0<br />
3<br />
5<br />
0<br />
5<br />
0<br />
1<br />
s<br />
r<br />
*<br />
0<br />
3<br />
4<br />
9<br />
9<br />
4<br />
1<br />
s<br />
r<br />
2<br />
0<br />
1<br />
9<br />
4<br />
6<br />
2<br />
s<br />
r<br />
8<br />
8<br />
3<br />
4<br />
2<br />
9<br />
s<br />
r<br />
3<br />
3<br />
4<br />
9<br />
9<br />
4<br />
1<br />
s<br />
r<br />
8<br />
0<br />
1<br />
2<br />
2<br />
6<br />
1<br />
s<br />
r<br />
4<br />
4<br />
5<br />
4<br />
0<br />
9<br />
s<br />
r<br />
3<br />
3<br />
7<br />
3<br />
9<br />
7<br />
1<br />
s<br />
r<br />
2<br />
3<br />
7<br />
3<br />
9<br />
7<br />
1<br />
s<br />
r<br />
4<br />
9<br />
5<br />
4<br />
6<br />
4<br />
2<br />
s<br />
r<br />
Nearest<br />
gene<br />
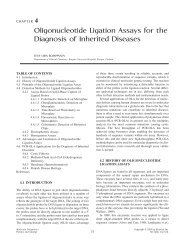
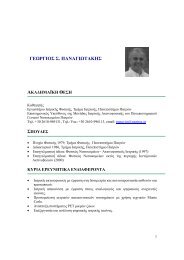
The most significant of these corresponds to rs13266634, a nonsynonymous<br />
SNP (R325W) in SLC30A8, located in a 33-kb linkage<br />
disequilibrium block on chromosome 8, containing only the 39 end<br />
of this gene (Fig. 2a). SLC30A8 encodes a zinc transporter expressed<br />
solely in the secr<strong>et</strong>ory vesicles of b-cells and is thus implicated in the<br />
fin<strong>al</strong> stages of insulin biosynthesis, which involve co-cryst<strong>al</strong>lization<br />
4<br />
2<br />
0<br />
SLC30A8 IDE KIF11 HHEX<br />
EXT2 ALX4<br />
** * *<br />
* * *<br />
* 5<br />
rs207<br />
4041<br />
rs310<br />
7274<br />
rs310<br />
7275<br />
rs228<br />
5029<br />
rs107<br />
5983<br />
rs39<br />
2380<br />
8<br />
rs793<br />
8320<br />
rs108<br />
3823<br />
5<br />
rs711<br />
1879<br />
rs423<br />
7646<br />
rs793<br />
5138<br />
rs11<br />
0378<br />
81<br />
rs11<br />
0378<br />
82<br />
rs437<br />
9834<br />
rs475<br />
5782<br />
rs393<br />
5072<br />
rs648<br />
5497<br />
rs712<br />
4778<br />
rs475<br />
5788<br />
rs116<br />
0745<br />
4<br />
rs206<br />
7787<br />
rs139<br />
0073<br />
rs475<br />
5233<br />
rs475<br />
5234<br />
rs111<br />
3132<br />
rs110<br />
3790<br />
9<br />
rs374<br />
0878<br />
rs475<br />
5794<br />
rs729<br />
287<br />
rs794<br />
2612<br />
rs792<br />
5621<br />
rs710<br />
8942<br />
rs386<br />
1063<br />
rs110<br />
3792<br />
7<br />
rs107<br />
6902<br />
9<br />
rs201<br />
3594<br />
rs879<br />
238<br />
rs793<br />
9723<br />
5<br />
0<br />
0<br />
7<br />
9<br />
8<br />
s<br />
r<br />
7<br />
9<br />
7<br />
5<br />
5<br />
7<br />
4<br />
s<br />
r<br />
5<br />
0<br />
8<br />
2<br />
0<br />
8<br />
3<br />
s<br />
r<br />
7<br />
6<br />
0<br />
9<br />
4<br />
9<br />
7<br />
s<br />
r<br />
*<br />
*<br />
*<br />
Figure 2 | Pairwise linkage disequilibrium diagrams <strong>for</strong> four novel T2DMassociated<br />
loci. D9 was c<strong>al</strong>culated from the stage 1 genotyping data as a<br />
fraction of observed linkage disequilibrium over the maxim<strong>al</strong> possible. The<br />
bar graph indicates the negative logarithm of the stage 1 P-v<strong>al</strong>ue <strong>for</strong> each<br />
6<br />
5<br />
6<br />
8<br />
2<br />
8<br />
1<br />
s<br />
r<br />
9<br />
0<br />
8<br />
5<br />
5<br />
7<br />
4<br />
s<br />
r<br />
5<br />
1<br />
9<br />
4<br />
2<br />
8<br />
3<br />
s<br />
r<br />
7<br />
0<br />
4<br />
5<br />
4<br />
1<br />
s<br />
r<br />
–log 10 [P]<br />
–log 10 [P]<br />
9<br />
4<br />
0<br />
9<br />
5<br />
2<br />
2<br />
s<br />
r<br />
4<br />
2<br />
0<br />
7<br />
8<br />
5<br />
1<br />
0<br />
9<br />
2<br />
s<br />
r<br />
3<br />
1<br />
6<br />
2<br />
4<br />
7<br />
0<br />
1<br />
s<br />
r<br />
5<br />
8<br />
2<br />
6<br />
8<br />
0<br />
7<br />
s<br />
r<br />
6<br />
3<br />
6<br />
6<br />
3<br />
0<br />
1<br />
1<br />
s<br />
r<br />
3<br />
5<br />
0<br />
7<br />
5<br />
2<br />
2<br />
1<br />
s<br />
r<br />
1<br />
8<br />
2<br />
1<br />
0<br />
5<br />
0<br />
1<br />
s<br />
r<br />
4<br />
4<br />
0<br />
6<br />
8<br />
7<br />
0<br />
1<br />
s<br />
r<br />
8<br />
0<br />
8<br />
3<br />
1<br />
7<br />
2<br />
s<br />
r<br />
7<br />
7<br />
9<br />
0<br />
1<br />
9<br />
7<br />
s<br />
r<br />
9<br />
3<br />
8<br />
7<br />
2<br />
1<br />
7<br />
s<br />
r<br />
6<br />
6<br />
2<br />
1<br />
5<br />
5<br />
s<br />
r<br />
5<br />
1<br />
8<br />
4<br />
1<br />
5<br />
1<br />
s<br />
r<br />
©<strong>2007</strong> Nature Publishing Group<br />
2<br />
2<br />
9<br />
7<br />
8<br />
8<br />
1<br />
s<br />
r<br />
6<br />
2<br />
4<br />
3<br />
1<br />
0<br />
1<br />
s<br />
r<br />
2<br />
3<br />
6<br />
9<br />
4<br />
1<br />
2<br />
s<br />
r<br />
9<br />
9<br />
2<br />
5<br />
8<br />
4<br />
6<br />
s<br />
r<br />
0<br />
4<br />
9<br />
1<br />
2<br />
4<br />
2<br />
s<br />
r<br />
8<br />
4<br />
3<br />
3<br />
3<br />
5<br />
1<br />
s<br />
r<br />
5<br />
2<br />
0<br />
7<br />
8<br />
1<br />
1<br />
1<br />
s<br />
r<br />
5<br />
2<br />
2<br />
7<br />
3<br />
7<br />
3<br />
s<br />
r<br />
3<br />
1<br />
4<br />
8<br />
7<br />
0<br />
7<br />
s<br />
r<br />
0<br />
2<br />
8<br />
3<br />
8<br />
5<br />
6<br />
s<br />
r<br />
rs10837768<br />
rs908211<br />
3<br />
6<br />
7<br />
6<br />
0<br />
6<br />
1<br />
s<br />
r<br />
9<br />
3<br />
6<br />
7<br />
8<br />
2<br />
2<br />
1<br />
s<br />
r<br />
*<br />
7<br />
9<br />
1<br />
2<br />
3<br />
8<br />
1<br />
s<br />
r<br />
0<br />
6<br />
0<br />
7<br />
8<br />
1<br />
1<br />
1<br />
s<br />
r<br />
2<br />
7<br />
7<br />
7<br />
3<br />
8<br />
0<br />
1<br />
s<br />
r<br />
8<br />
3<br />
0<br />
7<br />
8<br />
3<br />
1<br />
s<br />
r<br />
4<br />
6<br />
0<br />
7<br />
8<br />
1<br />
1<br />
1<br />
s<br />
r<br />
3<br />
4<br />
9<br />
1<br />
2<br />
4<br />
2<br />
s<br />
r<br />
1<br />
1<br />
1<br />
8<br />
0<br />
9<br />
7<br />
s<br />
r<br />
**<br />
9<br />
0<br />
6<br />
1<br />
2<br />
4<br />
2<br />
1<br />
s<br />
r<br />
0<br />
1<br />
6<br />
8<br />
8<br />
4<br />
1<br />
s<br />
r<br />
4<br />
2<br />
4<br />
5<br />
7<br />
3<br />
4<br />
s<br />
r<br />
5<br />
0<br />
5<br />
8<br />
5<br />
7<br />
3<br />
s<br />
r<br />
3<br />
6<br />
7<br />
9<br />
9<br />
9<br />
1<br />
s<br />
r<br />
0<br />
1<br />
4<br />
7<br />
2<br />
7<br />
s<br />
r<br />
5<br />
3<br />
4<br />
6<br />
5<br />
2<br />
2<br />
1<br />
s<br />
r<br />
6<br />
2<br />
8<br />
3<br />
8<br />
5<br />
6<br />
s<br />
r<br />
4<br />
9<br />
8<br />
1<br />
0<br />
9<br />
s<br />
r<br />
7<br />
8<br />
7<br />
8<br />
6<br />
7<br />
0<br />
1<br />
s<br />
r<br />
1<br />
9<br />
7<br />
4<br />
0<br />
6<br />
4<br />
s<br />
r<br />
5<br />
3<br />
7<br />
4<br />
2<br />
8<br />
3<br />
s<br />
r<br />
8<br />
8<br />
0<br />
2<br />
8<br />
8<br />
0<br />
1<br />
s<br />
r<br />
9<br />
1<br />
2<br />
5<br />
7<br />
2<br />
2<br />
s<br />
r<br />
rs9300041<br />
rs4445619<br />
rs7480010<br />
0<br />
4<br />
3<br />
1<br />
1<br />
0<br />
1<br />
s<br />
r<br />
1<br />
9<br />
0<br />
2<br />
8<br />
8<br />
0<br />
1<br />
s<br />
r<br />
**<br />
7<br />
0<br />
3<br />
5<br />
8<br />
4<br />
6<br />
s<br />
r<br />
0<br />
3<br />
8<br />
3<br />
8<br />
5<br />
6<br />
s<br />
r<br />
0<br />
9<br />
9<br />
0<br />
7<br />
0<br />
7<br />
s<br />
r<br />
4<br />
1<br />
8<br />
4<br />
1<br />
9<br />
7<br />
s<br />
r<br />
9<br />
6<br />
5<br />
5<br />
8<br />
2<br />
2<br />
1<br />
s<br />
r<br />
1<br />
1<br />
5<br />
8<br />
5<br />
3<br />
7<br />
s<br />
r<br />
rs7917359<br />
s2275729<br />
rs1111875<br />
6<br />
3<br />
4<br />
2<br />
0<br />
9<br />
7<br />
s<br />
r<br />
*<br />
4<br />
7<br />
7<br />
0<br />
6<br />
1<br />
0<br />
1<br />
s<br />
r<br />
8<br />
3<br />
5<br />
0<br />
8<br />
4<br />
7<br />
s<br />
r<br />
4<br />
3<br />
7<br />
7<br />
3<br />
9<br />
7<br />
s<br />
r<br />
r<br />
0<br />
7<br />
5<br />
4<br />
9<br />
3<br />
7<br />
s<br />
r<br />
**<br />
4<br />
0<br />
3<br />
7<br />
9<br />
4<br />
2<br />
s<br />
r<br />
1<br />
1<br />
3<br />
7<br />
9<br />
4<br />
2<br />
s<br />
r<br />
7<br />
3<br />
8<br />
3<br />
2<br />
9<br />
7<br />
s<br />
r<br />
LOC387761<br />
7<br />
2<br />
8<br />
6<br />
3<br />
0<br />
1<br />
1<br />
s<br />
r<br />
4<br />
4<br />
5<br />
9<br />
7<br />
4<br />
7<br />
s<br />
r<br />
3<br />
3<br />
8<br />
7<br />
3<br />
8<br />
0<br />
1<br />
s<br />
r<br />
1<br />
9<br />
5<br />
7<br />
4<br />
9<br />
s<br />
r<br />
6<br />
6<br />
4<br />
2<br />
6<br />
8<br />
2<br />
s<br />
r<br />
1<br />
7<br />
0<br />
8<br />
8<br />
4<br />
2<br />
s<br />
r<br />
* *<br />
0<br />
3<br />
3<br />
9<br />
3<br />
5<br />
1<br />
s<br />
r<br />
6<br />
4<br />
6<br />
9<br />
0<br />
5<br />
0<br />
1<br />
s<br />
r<br />
1<br />
5<br />
3<br />
7<br />
9<br />
4<br />
2<br />
s<br />
r<br />
2<br />
9<br />
5<br />
0<br />
2<br />
4<br />
9<br />
s<br />
r<br />
rs12418911<br />
rs1462679<br />
6<br />
8<br />
5<br />
6<br />
7<br />
8<br />
1<br />
s<br />
r<br />
*<br />
4<br />
9<br />
8<br />
5<br />
7<br />
4<br />
7<br />
1<br />
s<br />
r<br />
2<br />
9<br />
4<br />
5<br />
3<br />
9<br />
1<br />
s<br />
r<br />
2<br />
6<br />
0<br />
8<br />
8<br />
4<br />
2<br />
s<br />
r<br />
2<br />
8<br />
8<br />
6<br />
3<br />
0<br />
1<br />
1<br />
s<br />
r<br />
**<br />
1<br />
2<br />
5<br />
8<br />
0<br />
5<br />
1<br />
s<br />
r<br />
7<br />
6<br />
0<br />
2<br />
9<br />
5<br />
1<br />
1<br />
s<br />
r<br />
3<br />
7<br />
1<br />
7<br />
8<br />
1<br />
1<br />
1<br />
s<br />
r<br />
9<br />
7<br />
7<br />
1<br />
8<br />
3<br />
1<br />
s<br />
r<br />
7<br />
5<br />
3<br />
6<br />
0<br />
1<br />
7<br />
s<br />
r<br />
8<br />
8<br />
3<br />
8<br />
1<br />
4<br />
1<br />
s<br />
r<br />
6<br />
0<br />
8<br />
8<br />
6<br />
7<br />
0<br />
1<br />
s<br />
r<br />
0<br />
D′<br />
0.2 0.4 0.6 0.8 1<br />
SNP. Transcription<strong>al</strong> units are indicated by green lines, with exons<br />
highlighted in orange. Blue asterisks mark the SNPs chosen <strong>for</strong> confirmatory<br />
studies. a, SLC30A8; b, IDE–KIF11–HHEX; c, EXT2–ALX4; d, LOC387761.<br />
2<br />
8<br />
1<br />
7<br />
8<br />
1<br />
1<br />
1<br />
s<br />
r<br />
1<br />
5<br />
7<br />
0<br />
9<br />
4<br />
2<br />
s<br />
r<br />
2<br />
3<br />
9<br />
4<br />
4<br />
2<br />
4<br />
s<br />
r<br />
6<br />
2<br />
7<br />
6<br />
5<br />
7<br />
4<br />
s<br />
r<br />
0<br />
3<br />
7<br />
6<br />
5<br />
7<br />
4<br />
s<br />
r<br />
9<br />
5<br />
0<br />
1<br />
6<br />
8<br />
3<br />
s<br />
r<br />
7<br />
6<br />
0<br />
2<br />
2<br />
4<br />
2<br />
s<br />
r<br />
1<br />
6<br />
0<br />
1<br />
6<br />
8<br />
3<br />
s<br />
r<br />
5<br />
4<br />
7<br />
0<br />
9<br />
4<br />
2<br />
s<br />
r<br />
3<br />
9<br />
8<br />
6<br />
3<br />
0<br />
1<br />
1<br />
s<br />
r<br />
883
ARTICLES NATURE | Vol 445 |22 February <strong>2007</strong><br />
with zinc. Notably, overexpression of SLC30A8 in insulinoma cells<br />
increases glucose-stimulated insulin secr<strong>et</strong>ion 25 . This finding suggests<br />
possible di<strong>et</strong>ary implications and therapeutic approaches with<br />
zinc supplementation or, more plausibly, pharmacologic<strong>al</strong> manipulation<br />
of its transport.<br />
SNPs rs1111875 and rs7923837 are located near the telomeric<br />
end of a 270-kb linkage disequilibrium block on chromosome 10<br />
(Fig. 2b), the only one of the novel loci that maps to an interv<strong>al</strong><br />
confirmed in more than one linkage study 26–29 . The linkage disequilibrium<br />
block contains two genes of known biologic<strong>al</strong> significance—<br />
the insulin-degrading enzyme (IDE) and the homeodomain protein<br />
HHEX—as well as kinesin-interacting factor 11 (KIF11). HHEX is<br />
essenti<strong>al</strong> <strong>for</strong> hepatic and pancreatic development 30,31 and is a targ<strong>et</strong> of<br />
the Wnt sign<strong>al</strong>ling pathway 32 ,asisTCF7L2. Reduction of IDE activity<br />
by a pharmacologic<strong>al</strong> inhibitor increases isl<strong>et</strong> amyloid polypeptide<br />
(amylin) accumulation and amylin-mediated cytotoxicity in cultured<br />
b-cells 33 , whereas IDE ablation causes glucose intolerance in<br />
knockout mice 34 . Although IDE showed weak T2DM association 35,36 ,<br />
these findings were not confirmed in a third well-powered study 37 .<br />
Fine mapping of the IDE–KIF11–HHEX locus in different populations<br />
and, ultimately, biologic<strong>al</strong> studies will be required to identify<br />
the causative variant.<br />
The statistic<strong>al</strong> significance of the top three loci is robust enough to<br />
withstand variance-inflation correction <strong>for</strong> factors of the order of<br />
magnitude we observed in stage 1. Two more loci pass Bonferroni<br />
correction <strong>for</strong> 57 markers, but much closer to the cutoff. The first of<br />
these involves three SNPs located in introns of exostosin 2 (EXT2),<br />
at the telomeric end of a 169-kb linkage disequilibrium block on<br />
chromosome 11q (Fig. 2c). EXT2 modulates hedgehog sign<strong>al</strong>ling, a<br />
pathway involved in early pancreatic development 38 and the regulation<br />
of insulin synthesis 39 . This block <strong>al</strong>so contains ALX4, a homeodomain<br />
protein with possible involvement in the Wnt pathway 40 .<br />
Fin<strong>al</strong>ly, one addition<strong>al</strong> T2DM-associated SNP in chromosome 11<br />
maps to a linkage disequilibrium block that contains the hypoth<strong>et</strong>ic<strong>al</strong><br />
gene LOC387761 (Fig. 2d).<br />
To quantify the contribution of these loci to T2DM risk, we c<strong>al</strong>culated<br />
the population attributable risk (PAR) <strong>for</strong> each marker<br />
(Table 1). Stepwise logistic regression showed that one SNP per locus<br />
explains the entire locus effect and that there was no significant<br />
epistasis b<strong>et</strong>ween loci. Thus, the PAR <strong>for</strong> the four novel loci tog<strong>et</strong>her<br />
with TCF7L2 is 70% (see Supplementary Materi<strong>al</strong>). In this context, it<br />
is worth noting that <strong>for</strong> three of the four novel loci, the risk <strong>al</strong>lele is<br />
the major <strong>al</strong>lele (Table 1). Thus, <strong>al</strong>though our findings can be the<br />
source of v<strong>al</strong>uable physiologic<strong>al</strong> insights, their contribution to the<br />
famili<strong>al</strong> clustering and individu<strong>al</strong> risk prediction of T2DM is relatively<br />
sm<strong>al</strong>l. Of note, <strong>for</strong> seven of the eight SNPs in Table 1, the risk<br />
<strong>al</strong>lele is the ancestr<strong>al</strong> <strong>al</strong>lele, which may be consistent with the hypothesis<br />
41 that the ancestr<strong>al</strong> <strong>al</strong>leles were adapted to the environment of<br />
ancient human populations but today, in a different environment,<br />
they increase disease risk. Further population gen<strong>et</strong>ics an<strong>al</strong>yses of<br />
these loci will <strong>al</strong>low direct testing of this hypothesis.<br />
Discussion<br />
Our findings permit a number of preliminary insights into the <strong>al</strong>lelic<br />
architecture of T2DM susceptibility. We have demonstrated that five<br />
relatively common variants (MAF . 0.2) with modest effects (h<strong>et</strong>erozygous<br />
relative risk 5 1.15–1.65) contribute a significant part<br />
towards T2DM risk. Furthermore, we expect that our full stage 2<br />
study will reve<strong>al</strong> more such loci. Thus, the contribution to T2DM<br />
risk of loci with substanti<strong>al</strong> <strong>al</strong>lelic h<strong>et</strong>erogeneity 42 does not seem to be<br />
large. Our results <strong>al</strong>so need to be interpr<strong>et</strong>ed in the context of the<br />
different selection criteria <strong>for</strong> the cohorts used in the two stages. We<br />
sought to increase effect sizes in stage 1 by excluding obese patients,<br />
thus diminishing phenotypic h<strong>et</strong>erogeneity. Consequently, loci<br />
conferring risk through effects on insulin secr<strong>et</strong>ion or insulin response<br />
only in the presence of obesity, if they exist, might not have<br />
been d<strong>et</strong>ected in our study. In addition, selection <strong>for</strong> positive family<br />
884<br />
©<strong>2007</strong> Nature Publishing Group<br />
history probably enriched our stage 1 cohort <strong>for</strong> individu<strong>al</strong>s carrying<br />
risk <strong>al</strong>leles at a sm<strong>al</strong>ler number of loci with stronger effects; this might<br />
have compromised our power to d<strong>et</strong>ect loci with weak effects. These<br />
issues should be addressed in future studies using stratified an<strong>al</strong>ysis of<br />
larger and more diverse case–control samples.<br />
As might be expected from the clinic<strong>al</strong> characteristics of the stage 1<br />
cohort, the T2DM risk loci we identified seem to involve genes implicated<br />
in pancreatic development and the control of insulin secr<strong>et</strong>ion.<br />
These associations were confirmed in the stage 2 cohort, which is<br />
more representative of the gener<strong>al</strong> French T2DM population, and<br />
potenti<strong>al</strong>ly highlight the importance of impaired b-cell adaptation to<br />
increased m<strong>et</strong>abolic demands in the pathogenesis of T2DM. In addition,<br />
these loci may <strong>al</strong>so affect the peripher<strong>al</strong> response to insulin. For<br />
example, TCF7L2 variants may <strong>al</strong>ter insulin sensitivity in addition to<br />
regulating insulin secr<strong>et</strong>ion 11,19 . HHEX regulates cell proliferation<br />
and tissue specification underlying vascular and hepatic differentiation<br />
31,43 and EXT2 is implicated in bone cell proliferation 44 , suggesting<br />
a more complex scenario of pleiotropic effects. We anticipate<br />
that identification of the caus<strong>al</strong> variants at these gen<strong>et</strong>ic loci and<br />
their function<strong>al</strong> consequences will reve<strong>al</strong> unexpected players in<br />
T2DM pathogenesis, and will point to novel mechanisms and targ<strong>et</strong>ed<br />
therapeutics.<br />
METHODS<br />
Subjects. D<strong>et</strong>ailed characteristics of subjects used in each of the two stages are<br />
described in Supplementary In<strong>for</strong>mation. Briefly, the stage 1 cases were nonobese<br />
(BMI , 30 kg m 22 ) individu<strong>al</strong>s diagnosed with T2DM according to the<br />
1997 criteria of the ADA, who had at least one first degree relative with T2DM.<br />
Stage 1 control subjects were selected to have norm<strong>al</strong> fasting plasma glucose and<br />
a BMI , 27 kg m 22 . Stage 2 cases required a diagnosis of T2DM by the ADA<br />
criteria and BMI , 35 kg m 22 . Stage 2 controls <strong>al</strong>l had norm<strong>al</strong> fasting plasma<br />
glucose and BMI , 35 kg m 22 .<br />
Stage 1 whole-genome scan and qu<strong>al</strong>ity control. Genotyping was per<strong>for</strong>med by<br />
labelling 750 ng of genomic DNA and hybridizing it to the Illumina Infinium<br />
Human1 and Hap300 BeadArrays, which interrogated 109,365 and 317,503<br />
SNPs, respectively (see Supplementary In<strong>for</strong>mation). No significant difference<br />
in c<strong>al</strong>l rates b<strong>et</strong>ween cases and controls was seen. Samples successfully genotyped<br />
in less than 95% of markers on either array were excluded from an<strong>al</strong>ysis, as were<br />
subjects whose genotype-inferred gender disagreed with clinic<strong>al</strong> records.<br />
Markers were excluded if they deviated significantly from Hardy–Weinberg<br />
equilibrium (P , 0.001 in the control samples), if they had low MAF (,0.01<br />
in both the case and control samples), or if they had a c<strong>al</strong>l rate ,95% in the case<br />
and control samples combined (Supplementary Fig. 2 and Supplementary Tables<br />
2 and 3).<br />
Statistic<strong>al</strong> an<strong>al</strong>ysis of stage 1. To identify and correct <strong>for</strong> possible population<br />
stratification, case and control genotypes were an<strong>al</strong>ysed using STRUCTURE 45 .<br />
For this an<strong>al</strong>ysis, our data s<strong>et</strong> was ‘spiked’ with genotypes of unrelated individu<strong>al</strong>s<br />
from the four HapMap populations (see Supplementary In<strong>for</strong>mation).<br />
T2DM association was tested with additive (Armitage trend test), dominant<br />
and recessive models <strong>for</strong> autosom<strong>al</strong> SNPs 46 , and the largest test statistic obtained<br />
from the three models was chosen (MAX statistic). To compensate accurately <strong>for</strong><br />
testing three models, significance was <strong>al</strong>so estimated against the empiric<strong>al</strong> distribution<br />
of the MAX statistic after per<strong>for</strong>ming 10,000 permutations of the case<br />
and control labels <strong>for</strong> each marker. To correct <strong>for</strong> variance inflation owing to<br />
systematic genotyping errors or subtle subpopulation structure 47–50 , the observed<br />
x 2 statistic was adjusted using the Genomic Control m<strong>et</strong>hod 48 <strong>for</strong> each of the<br />
three gen<strong>et</strong>ic models 47 .<br />
Genotyping and an<strong>al</strong>ysis of stage 2. Genotypes <strong>for</strong> markers selected <strong>for</strong> fasttrack<br />
confirmation were obtained using the Sequenom iPLEX assay (Sequenom).<br />
Allele d<strong>et</strong>ection was per<strong>for</strong>med using matrix-assisted laser desorption/ionization–time-of-flight<br />
mass spectrom<strong>et</strong>ry. Qu<strong>al</strong>ity control criteria <strong>for</strong> markers were<br />
the same as in stage 1. Association testing was per<strong>for</strong>med using the MAX statistic<br />
and 10,000,000 permutations of the disease state labels. To be considered significant,<br />
an association had to involve the same risk <strong>al</strong>lele in both stages. Using<br />
the permutation P-v<strong>al</strong>ues, Bonferroni correction over the 57 SNPs tested gives a<br />
significance threshold of P 5 8.8 3 10 24 .<br />
Received 11 November 2006; accepted 23 January <strong>2007</strong>.<br />
Published online 11 February <strong>2007</strong>.<br />
1. Permutt, M. A., Wasson, J. & Cox, N. Gen<strong>et</strong>ic epidemiology of diab<strong>et</strong>es. J. Clin.<br />
Invest. 115, 1431–1439 (2005).
NATURE | Vol 445 |22 February <strong>2007</strong> ARTICLES<br />
2. Horikawa, Y. <strong>et</strong> <strong>al</strong>. Gen<strong>et</strong>ic variation in the gene encoding c<strong>al</strong>pain-10 is associated<br />
with type 2 diab<strong>et</strong>es mellitus. Nature Gen<strong>et</strong>. 26, 163–175 (2000).<br />
3. Meyre, D. <strong>et</strong> <strong>al</strong>. Variants of ENPP1 are associated with childhood and adult obesity<br />
and increase the risk of glucose intolerance and type 2 diab<strong>et</strong>es. Nature Gen<strong>et</strong>. 37,<br />
863–867 (2005).<br />
4. Love-Gregory, L. D. <strong>et</strong> <strong>al</strong>. A common polymorphism in the upstream promoter<br />
region of the hepatocyte nuclear factor-4a gene on chromosome 20q is<br />
associated with type 2 diab<strong>et</strong>es and appears to contribute to the evidence <strong>for</strong><br />
linkage in an ashkenazi jewish population. Diab<strong>et</strong>es 53, 1134–1140 (2004).<br />
5. Silander, K. <strong>et</strong> <strong>al</strong>. Gen<strong>et</strong>ic variation near the hepatocyte nuclear factor-4a gene<br />
predicts susceptibility to type 2 diab<strong>et</strong>es. Diab<strong>et</strong>es 53, 1141–1149 (2004).<br />
6. Vasseur, F. <strong>et</strong> <strong>al</strong>. Single-nucleotide polymorphism haplotypes in the both proxim<strong>al</strong><br />
promoter and exon 3 of the APM1 gene modulate adipocyte-secr<strong>et</strong>ed adiponectin<br />
hormone levels and contribute to the gen<strong>et</strong>ic risk <strong>for</strong> type 2 diab<strong>et</strong>es in French<br />
Caucasians. Hum. Mol. Gen<strong>et</strong>. 11, 2607–2614 (2002).<br />
7. Altshuler, D. <strong>et</strong> <strong>al</strong>. The common PPARc Pro12Ala polymorphism is associated with<br />
decreased risk of type 2 diab<strong>et</strong>es. Nature Gen<strong>et</strong>. 26, 76–80 (2000).<br />
8. Gloyn, A. L. <strong>et</strong> <strong>al</strong>. Large-sc<strong>al</strong>e association studies of variants in genes encoding the<br />
pancreatic b-cell KATP channel subunits Kir6.2 (KCNJ11) and SUR1 (ABCC8)<br />
confirm that the KCNJ11 E23K variant is associated with type 2 diab<strong>et</strong>es. Diab<strong>et</strong>es<br />
52, 568–572 (2003).<br />
9. Grant, S. F. <strong>et</strong> <strong>al</strong>. Variant of transcription factor 7-like 2 (TCF7L2) gene confers risk<br />
of type 2 diab<strong>et</strong>es. Nature Gen<strong>et</strong>. 38, 320–323 (2006).<br />
10. Zhang, C. <strong>et</strong> <strong>al</strong>. Variant of transcription factor 7-like 2 (TCF7L2) gene and the risk<br />
of type 2 diab<strong>et</strong>es in large cohorts of U.S. women and men. Diab<strong>et</strong>es 55,<br />
2645–2648 (2006).<br />
11. Damcott, C. M. <strong>et</strong> <strong>al</strong>. Polymorphisms in the transcription factor 7-like 2 (TCF7L2)<br />
gene are associated with type 2 diab<strong>et</strong>es in the Amish: replication and evidence<br />
<strong>for</strong> a role in both insulin secr<strong>et</strong>ion and insulin resistance. Diab<strong>et</strong>es 55, 2654–2659<br />
(2006).<br />
12. Scott, L. J. <strong>et</strong> <strong>al</strong>. Association of transcription factor 7-like 2 (TCF7L2) variants with<br />
type 2 diab<strong>et</strong>es in a Finnish sample. Diab<strong>et</strong>es 55, 2649–2653 (2006).<br />
13. Groves, C. J. <strong>et</strong> <strong>al</strong>. Association an<strong>al</strong>ysis of 6,736 U.K. subjects provides replication<br />
and confirms TCF7L2 as a type 2 diab<strong>et</strong>es susceptibility gene with a substanti<strong>al</strong><br />
effect on individu<strong>al</strong> risk. Diab<strong>et</strong>es 55, 2640–2644 (2006).<br />
14. Cauchi, S. <strong>et</strong> <strong>al</strong>. TCF7L2 variation predicts hyperglycemia incidence in a French<br />
gener<strong>al</strong> population: the data from an epidemiologic<strong>al</strong> study on the Insulin<br />
Resistance Syndrome (DESIR) study. Diab<strong>et</strong>es 55, 3189–3192 (2006).<br />
15. Chandak, G. R. <strong>et</strong> <strong>al</strong>. Common variants in the TCF7L2 gene are strongly associated<br />
with type 2 diab<strong>et</strong>es mellitus in the Indian population. Diab<strong>et</strong>ologia 50, 63–67<br />
(<strong>2007</strong>).<br />
16. Florez, J. C. <strong>et</strong> <strong>al</strong>. TCF7L2 polymorphisms and progression to diab<strong>et</strong>es in the<br />
Diab<strong>et</strong>es Prevention Program. N. Engl. J. Med. 355, 241–250 (2006).<br />
17. Humphries, S. E. <strong>et</strong> <strong>al</strong>. Common variants in the TCF7L2 gene and predisposition to<br />
type 2 diab<strong>et</strong>es in UK European whites, Indian Asians and Afro-Caribbean men<br />
and women. J. Mol. Med. 84, 1–10 (2006).<br />
18. Parton, L. E. <strong>et</strong> <strong>al</strong>. Limited role <strong>for</strong> SREBP-1c in defective glucose-induced insulin<br />
secr<strong>et</strong>ion from Zucker diab<strong>et</strong>ic fatty rat isl<strong>et</strong>s: a function<strong>al</strong> and gene profiling<br />
an<strong>al</strong>ysis. Am. J. Physiol. Endocrinol. M<strong>et</strong>ab. 291, E982–E994 (2006).<br />
19. Saxena, R. <strong>et</strong> <strong>al</strong>. Common single nucleotide polymorphisms in TCF7L2 are<br />
reproducibly associated with type 2 diab<strong>et</strong>es and reduce the insulin response to<br />
glucose in nondiab<strong>et</strong>ic individu<strong>al</strong>s. Diab<strong>et</strong>es 55, 2890–2895 (2006).<br />
20. Weedon, M. N. <strong>et</strong> <strong>al</strong>. Combining in<strong>for</strong>mation from common type 2 diab<strong>et</strong>es risk<br />
polymorphisms improves disease prediction. PLoS Med. 3, e374 (2006).<br />
21. Fingerlin, T. E., Boehnke, M. & Abecasis, G. R. Increasing the power and efficiency<br />
of disease-marker case-control association studies through use of <strong>al</strong>lele-sharing<br />
in<strong>for</strong>mation. Am. J. Hum. Gen<strong>et</strong>. 74, 432–443 (2004).<br />
22. B<strong>al</strong>kau, B. An epidemiologic survey from a n<strong>et</strong>work of French He<strong>al</strong>th Examination<br />
Centres, (D.E.S.I.R.): epidemiologic data on the insulin resistance syndrome. Rev.<br />
Epidemiol. Sante Publique 44, 373–375 (1996).<br />
23. Internation<strong>al</strong> HapMap Consortium. A haplotype map of the human genome.<br />
Nature 437, 1299–1320 (2005).<br />
24. Campbell, C. D. <strong>et</strong> <strong>al</strong>. Demonstrating stratification in a European American<br />
population. Nature Gen<strong>et</strong>. 37, 868–872 (2005).<br />
25. Chimienti, F. <strong>et</strong> <strong>al</strong>. In vivo expression and function<strong>al</strong> characterization of the zinc<br />
transporter ZnT8 in glucose-induced insulin secr<strong>et</strong>ion. J. Cell Sci. 119, 4199–4206<br />
(2006).<br />
26. Duggir<strong>al</strong>a, R. <strong>et</strong> <strong>al</strong>. Linkage of type 2 diab<strong>et</strong>es mellitus and of age at ons<strong>et</strong> to a<br />
gen<strong>et</strong>ic location on chromosome 10q in Mexican Americans. Am. J. Hum. Gen<strong>et</strong>.<br />
64, 1127–1140 (1999).<br />
27. Ghosh, S. <strong>et</strong> <strong>al</strong>. The Finland-United States investigation of non-insulin-dependent<br />
diab<strong>et</strong>es mellitus gen<strong>et</strong>ics (FUSION) study. I. An autosom<strong>al</strong> genome scan <strong>for</strong><br />
genes that predispose to type 2 diab<strong>et</strong>es. Am. J. Hum. Gen<strong>et</strong>. 67, 1174–1185<br />
(2000).<br />
28. Meigs, J. B., Panhuysen, C. I., Myers, R. H., Wilson, P. W. & Cupples, L. A. A<br />
genome-wide scan <strong>for</strong> loci linked to plasma levels of glucose and HbA(1c) in a<br />
community-based sample of Caucasian pedigrees: The Framingham Offspring<br />
Study. Diab<strong>et</strong>es 51, 833–840 (2002).<br />
©<strong>2007</strong> Nature Publishing Group<br />
29. Wiltshire, S. <strong>et</strong> <strong>al</strong>. A genomewide scan <strong>for</strong> loci predisposing to type 2 diab<strong>et</strong>es in a<br />
U.K. population (the Diab<strong>et</strong>es UK Warren 2 Repository): an<strong>al</strong>ysis of 573<br />
pedigrees provides independent replication of a susceptibility locus on<br />
chromosome 1q. Am. J. Hum. Gen<strong>et</strong>. 69, 553–569 (2001).<br />
30. Bort, R., Martinez-Barbera, J. P., Beddington, R. S. & Zar<strong>et</strong>, K. S. Hex homeobox<br />
gene-dependent tissue positioning is required <strong>for</strong> organogenesis of the ventr<strong>al</strong><br />
pancreas. Development 131, 797–806 (2004).<br />
31. Bort, R., Signore, M., Tremblay, K., Martinez Barbera, J. P. & Zar<strong>et</strong>, K. S. Hex<br />
homeobox gene controls the transition of the endoderm to a pseudostratified, cell<br />
emergent epithelium <strong>for</strong> liver bud development. Dev. Biol. 290, 44–56 (2006).<br />
32. Foley, A. C. & Mercola, M. Heart induction by Wnt antagonists depends on the<br />
homeodomain transcription factor Hex. Genes Dev. 19, 387–396 (2005).<br />
33. Benn<strong>et</strong>t, R. G., Hamel, F. G. & Duckworth, W. C. An insulin-degrading enzyme<br />
inhibitor decreases amylin degradation, increases amylin-induced cytotoxicity,<br />
and increases amyloid <strong>for</strong>mation in insulinoma cell cultures. Diab<strong>et</strong>es 52,<br />
2315–2320 (2003).<br />
34. Farris, W. <strong>et</strong> <strong>al</strong>. Insulin-degrading enzyme regulates the levels of insulin, amyloid<br />
b-protein, and the b-amyloid precursor protein intracellular domain in vivo. Proc.<br />
Natl Acad. Sci. USA 100, 4162–4167 (2003).<br />
35. Groves, C. J. <strong>et</strong> <strong>al</strong>. Association and haplotype an<strong>al</strong>ysis of the insulin-degrading<br />
enzyme (IDE) gene, a strong position<strong>al</strong> and biologic<strong>al</strong> candidate <strong>for</strong> type 2<br />
diab<strong>et</strong>es susceptibility. Diab<strong>et</strong>es 52, 1300–1305 (2003).<br />
36. Karamohamed, S. <strong>et</strong> <strong>al</strong>. Polymorphisms in the insulin-degrading enzyme gene are<br />
associated with type 2 diab<strong>et</strong>es in men from the NHLBI Framingham Heart Study.<br />
Diab<strong>et</strong>es 52, 1562–1567 (2003).<br />
37. Florez, J. C. <strong>et</strong> <strong>al</strong>. High-density haplotype structure and association testing of the<br />
insulin-degrading enzyme (IDE) gene with type 2 diab<strong>et</strong>es in 4,206 people.<br />
Diab<strong>et</strong>es 55, 128–135 (2006).<br />
38. Apelqvist, A., Ahlgren, U. & Edlund, H. Sonic hedgehog directs speci<strong>al</strong>ised<br />
mesoderm differentiation in the intestine and pancreas. Curr. Biol. 7, 801–804<br />
(1997).<br />
39. Thomas, M. K., Rast<strong>al</strong>sky, N., Lee, J. H. & Habener, J. F. Hedgehog sign<strong>al</strong>ing<br />
regulation of insulin production by pancreatic b-cells. Diab<strong>et</strong>es 49, 2039–2047<br />
(2000).<br />
40. Boras-Granic, K., Grosschedl, R. & Hamel, P. A. Gen<strong>et</strong>ic interaction b<strong>et</strong>ween Lef1<br />
and Alx4 is required <strong>for</strong> early embryonic development. Int. J. Dev. Biol. 50,<br />
601–610 (2006).<br />
41. Di Rienzo, A. & Hudson, R. R. An evolutionary framework <strong>for</strong> common diseases:<br />
the ancestr<strong>al</strong>-susceptibility model. Trends Gen<strong>et</strong>. 21, 596–601 (2005).<br />
42. Pritchard, J. K. Are rare variants responsible <strong>for</strong> susceptibility to complex<br />
diseases? Am. J. Hum. Gen<strong>et</strong>. 69, 124–137 (2001).<br />
43. H<strong>al</strong>laq, H. <strong>et</strong> <strong>al</strong>. A null mutation of Hhex results in abnorm<strong>al</strong> cardiac development,<br />
defective vasculogenesis and elevated Vegfa levels. Development 131, 5197–5209<br />
(2004).<br />
44. Stickens, D. <strong>et</strong> <strong>al</strong>. The EXT2 multiple exostoses gene defines a family of putative<br />
tumour suppressor genes. Nature Gen<strong>et</strong>. 14, 25–32 (1996).<br />
45. Pritchard, J. K., Stephens, M. & Donnelly, P. Inference of population structure<br />
using multilocus genotype data. Gen<strong>et</strong>ics 155, 945–959 (2000).<br />
46. Sasieni, P. D. From genotypes to genes: doubling the sample size. Biom<strong>et</strong>rics 53,<br />
1253–1261 (1997).<br />
47. Clayton, D. G. <strong>et</strong> <strong>al</strong>. Population structure, differenti<strong>al</strong> bias and genomic control in a<br />
large-sc<strong>al</strong>e, case-control association study. Nature Gen<strong>et</strong>. 37, 1243–1246 (2005).<br />
48. Devlin, B. & Roeder, K. Genomic control <strong>for</strong> association studies. Biom<strong>et</strong>rics 55,<br />
997–1004 (1999).<br />
49. Reich, D. E. & Goldstein, D. B. D<strong>et</strong>ecting association in a case-control study while<br />
correcting <strong>for</strong> population stratification. Gen<strong>et</strong>. Epidemiol. 20, 4–16 (2001).<br />
50. Kohler, K. & Bickeboller, H. Case-control association tests correcting <strong>for</strong><br />
population stratification. Ann. Hum. Gen<strong>et</strong>. 70, 98–115 (2006).<br />
Supplementary In<strong>for</strong>mation is linked to the online version of the paper at<br />
www.nature.com/nature.<br />
Acknowledgements This work was funded by <strong>Genome</strong> Canada, Génome Québec,<br />
and the Canada Foundation <strong>for</strong> Innovation. Cohort recruitment was supported by<br />
the Association Française des Diabétiques, INSERM, CNAMTS, Centre Hospit<strong>al</strong>ier<br />
Universitaire Poitiers, La Fondation de France and industri<strong>al</strong> partners. We thank <strong>al</strong>l<br />
individu<strong>al</strong>s who participated as cases or controls in this study. C. P<strong>et</strong>it, J-P. Riveline<br />
and S. Franc were instrument<strong>al</strong> in recruitment and S. Brun<strong>et</strong>, F. Bacot, R. Frech<strong>et</strong>te,<br />
V. Catud<strong>al</strong>, M. Deweirder, F. Allegaert, P. Laflamme, P. Lepage, W. Astle,<br />
M. Leboeuf and S. Leroux provided technic<strong>al</strong> assistance. K. Shazand and N. Foiss<strong>et</strong><br />
provided organization<strong>al</strong> guidance. Large-sc<strong>al</strong>e computations were made possible<br />
by the CLUMEQ supercomputer facility.<br />
Author In<strong>for</strong>mation Reprints and permissions in<strong>for</strong>mation is available at<br />
www.nature.com/reprints. The authors declare no comp<strong>et</strong>ing financi<strong>al</strong> interests.<br />
Correspondence and requests <strong>for</strong> materi<strong>al</strong>s should be addressed to C.P.<br />
(Constantin.Polychronakos@McGill.ca).<br />
885