Annular Hurricanes - RAMMB - Colorado State University
Annular Hurricanes - RAMMB - Colorado State University
Annular Hurricanes - RAMMB - Colorado State University

Create successful ePaper yourself
Turn your PDF publications into a flip-book with our unique Google optimized e-Paper software.
204 WEATHER AND FORECASTING<br />
VOLUME 18<br />
1. Introduction<br />
2003 American Meteorological Society<br />
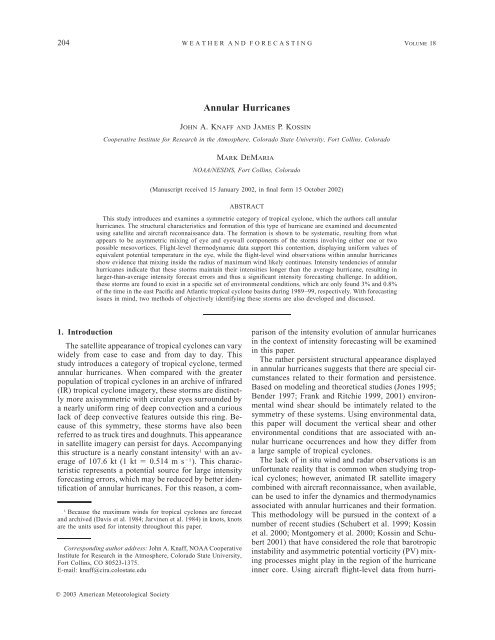
<strong>Annular</strong> <strong>Hurricanes</strong><br />
JOHN A. KNAFF AND JAMES P. KOSSIN<br />
Cooperative Institute for Research in the Atmosphere, <strong>Colorado</strong> <strong>State</strong> <strong>University</strong>, Fort Collins, <strong>Colorado</strong><br />
MARK DEMARIA<br />
NOAA/NESDIS, Fort Collins, <strong>Colorado</strong><br />
(Manuscript received 15 January 2002, in final form 15 October 2002)<br />
ABSTRACT<br />
This study introduces and examines a symmetric category of tropical cyclone, which the authors call annular<br />
hurricanes. The structural characteristics and formation of this type of hurricane are examined and documented<br />
using satellite and aircraft reconnaissance data. The formation is shown to be systematic, resulting from what<br />
appears to be asymmetric mixing of eye and eyewall components of the storms involving either one or two<br />
possible mesovortices. Flight-level thermodynamic data support this contention, displaying uniform values of<br />
equivalent potential temperature in the eye, while the flight-level wind observations within annular hurricanes<br />
show evidence that mixing inside the radius of maximum wind likely continues. Intensity tendencies of annular<br />
hurricanes indicate that these storms maintain their intensities longer than the average hurricane, resulting in<br />
larger-than-average intensity forecast errors and thus a significant intensity forecasting challenge. In addition,<br />
these storms are found to exist in a specific set of environmental conditions, which are only found 3% and 0.8%<br />
of the time in the east Pacific and Atlantic tropical cyclone basins during 1989–99, respectively. With forecasting<br />
issues in mind, two methods of objectively identifying these storms are also developed and discussed.<br />
The satellite appearance of tropical cyclones can vary<br />
widely from case to case and from day to day. This<br />
study introduces a category of tropical cyclone, termed<br />
annular hurricanes. When compared with the greater<br />
population of tropical cyclones in an archive of infrared<br />
(IR) tropical cyclone imagery, these storms are distinctly<br />
more axisymmetric with circular eyes surrounded by<br />
a nearly uniform ring of deep convection and a curious<br />
lack of deep convective features outside this ring. Because<br />
of this symmetry, these storms have also been<br />
referred to as truck tires and doughnuts. This appearance<br />
in satellite imagery can persist for days. Accompanying<br />
this structure is a nearly constant intensity 1 with an average<br />
of 107.6 kt (1 kt 0.514 m s 1 ). This characteristic<br />
represents a potential source for large intensity<br />
forecasting errors, which may be reduced by better identification<br />
of annular hurricanes. For this reason, a com-<br />
1 Because the maximum winds for tropical cyclones are forecast<br />
and archived (Davis et al. 1984; Jarvinen et al. 1984) in knots, knots<br />
are the units used for intensity throughout this paper.<br />
Corresponding author address: John A. Knaff, NOAA Cooperative<br />
Institute for Research in the Atmosphere, <strong>Colorado</strong> <strong>State</strong> <strong>University</strong>,<br />
Fort Collins, CO 80523-1375.<br />
E-mail: knaff@cira.colostate.edu<br />
parison of the intensity evolution of annular hurricanes<br />
in the context of intensity forecasting will be examined<br />
in this paper.<br />
The rather persistent structural appearance displayed<br />
in annular hurricanes suggests that there are special circumstances<br />
related to their formation and persistence.<br />
Based on modeling and theoretical studies (Jones 1995;<br />
Bender 1997; Frank and Ritchie 1999, 2001) environmental<br />
wind shear should be intimately related to the<br />
symmetry of these systems. Using environmental data,<br />
this paper will document the vertical shear and other<br />
environmental conditions that are associated with annular<br />
hurricane occurrences and how they differ from<br />
a large sample of tropical cyclones.<br />
The lack of in situ wind and radar observations is an<br />
unfortunate reality that is common when studying tropical<br />
cyclones; however, animated IR satellite imagery<br />
combined with aircraft reconnaissance, when available,<br />
can be used to infer the dynamics and thermodynamics<br />
associated with annular hurricanes and their formation.<br />
This methodology will be pursued in the context of a<br />
number of recent studies (Schubert et al. 1999; Kossin<br />
et al. 2000; Montgomery et al. 2000; Kossin and Schubert<br />
2001) that have considered the role that barotropic<br />
instability and asymmetric potential vorticity (PV) mixing<br />
processes might play in the region of the hurricane<br />
inner core. Using aircraft flight-level data from hurri-
APRIL 2003 KNAFF ET AL.<br />
205<br />
canes, Kossin and Eastin (2001) showed that radial profiles<br />
of vorticity and equivalent potential temperature<br />
( e) often undergo rapid and dramatic changes from a<br />
barotropically unstable regime (i.e., 2 /r 2 0 and<br />
e/r 0), which they refer to as regime 1, to a barotropically<br />
stable regime (i.e., 2 /r 2 0 and e/r<br />
0), or regime 2, and they hypothesized that these<br />
changes may result from horizontal mixing processes.<br />
The current study concentrates upon six annular hurricanes<br />
that have been observed in the Atlantic (1995–<br />
99) and eastern North Pacific (1997–99) tropical cyclone<br />
basins. A factor in determining the number and location<br />
of storms investigated in this study is the availability<br />
of a tropical cyclone IR satellite dataset, which exists<br />
for 1995–2001 in the Atlantic and 1997–2001 in the<br />
eastern Pacific. Additionally, uniform measurements of<br />
environmental conditions calculated for the purpose of<br />
intensity forecasting are available from 1989 to 1999.<br />
We know that annular hurricane have occurred in other<br />
tropical cyclone basins; however, neither of these datasets<br />
is readably available in other tropical cyclone basins.<br />
It is the desire to perform quantitative analysis<br />
involving both the environmental conditions and the IR<br />
brightness temperatures that excludes annular hurricanes<br />
in other basins and earlier times from this study.<br />
In addition to the IR imagery and the environmental<br />
conditions, a variety of other datasets is also used to<br />
investigate these axisymmetric storms.<br />
The structural and intensity characteristics of annular<br />
hurricanes suggest methods to objectively identify them<br />
may be both possible and useful. The identification of<br />
annular hurricanes, especially in a real-time forecast setting,<br />
may possibly be utilized to improve intensity estimations<br />
and forecasts. For this reason objective identification<br />
techniques, which use structural and environmental<br />
characteristics found during the course of this<br />
study, will also be explored.<br />
To begin the examination of annular hurricanes, section<br />
2 offers descriptions of the various datasets that are<br />
used in this study. Following this brief discussion of<br />
datasets, the features of annular hurricanes, including<br />
their axisymmetry, intensity characteristics and forecast<br />
errors, formation, and associated environmental conditions,<br />
will be shown in section 3. Using the evolutionary,<br />
structural, and environmental characteristics of<br />
these storms detailed in section 3, section 4 discusses<br />
the development of objective techniques to better identify<br />
these hurricanes in a real-time forecasting setting.<br />
The final section will present a summary of this study<br />
along with a few concluding remarks and relevant observations.<br />
2. Datasets<br />
Several datasets are used to study annular hurricanes.<br />
Half-hourly Geostationary Operational Environmental<br />
Satellite (GOES) images are used to examine cloud<br />
structures. These images have a 4-km horizontal reso-<br />
lution after being remapped to a Mercator projection.<br />
This IR dataset includes all storms for the period 1995–<br />
2001 in the Atlantic, and 1997–2001 in the eastern Pacific,<br />
for this reason in this study we concentrate on<br />
annular hurricanes that occurred after 1995. The dataset<br />
is part of a tropical cyclone IR image archive maintained<br />
at the National Oceanic and Atmospheric Administration’s<br />
(NOAA) Cooperative Institute for Research in the<br />
Atmosphere (Zehr 2000).<br />
The track and intensity of each storm come from digital<br />
databases of best-track information discussed in Davis<br />
et al. (1984) and Jarvinen et al. (1984), which are<br />
maintained at the National Hurricane Center (NHC).<br />
The Atlantic best-track dataset starts in 1870 and the<br />
east Pacific best-track dataset starts in 1945. Another<br />
dataset referred to as the extended Atlantic best-track<br />
dataset exists for the years 1988–2001 and contains additional<br />
storm-scale information including radii of significant<br />
(maximum, and 34, 50, and 64 kt) winds, and<br />
eye size. The extended Atlantic best-track data (De-<br />
Maria et al. 2001) are used to discuss structural differences<br />
between annular hurricanes and the Atlantic mean,<br />
since reliable estimates of these structural quantities,<br />
namely wind radii and eye size, often do not exist for<br />
other basins, where routine reconnaissance is unavailable.<br />
For these comparison purposes, eye sizes of annular<br />
hurricanes were estimated using the IR imagery.<br />
To compare the life cycle of tropical cyclones with<br />
intensities greater than 64 kt with the life cycle of annular<br />
hurricanes, we rely upon the past work of Emanuel<br />
(2000) who showed that the life cycles of Atlantic hurricanes<br />
and west Pacific typhoons are remarkably similar.<br />
Unfortunately, Emanuel (2000) did not examine<br />
east Pacific hurricanes explicitly; however, the remarkable<br />
similarity between the intensity evolutions in these<br />
two quite different basins suggest, that the intensity evolution<br />
in the eastern Pacific is likely similar.<br />
The rate at which tropical cyclones weaken is also of<br />
interest. To determine standard weakening rates, two<br />
methods are used: one from empirics and another from<br />
theory. The weakening of tropical cyclones is a fundamental<br />
aspect of the Dvorak method for tropical cyclone<br />
intensity analysis (Dvorak 1984). The rate of<br />
weakening is given in terms of T numbers, which are<br />
related to current intensities. The rules associated with<br />
this method limit the number of T numbers that is allowed<br />
to change in a 24-h period, which is a maximum<br />
filling rate. These same rules give guidelines for average<br />
and slower than average weakening rates. These empirically<br />
derived rates are compared to those created<br />
using the theory of Eliassen and Lystad (1977), which<br />
has been applied to tropical cyclones in Montgomery<br />
et al. (2001). In this theory vortex spindown is controlled<br />
by the toroidal circulations (u, w) forced by the<br />
Ekman layer, and offers a maximum weakening rate<br />
under the assumption that inertial toroidal oscillations<br />
are neglected.<br />
Two sorties of flight-level data are available for ex-
206 WEATHER AND FORECASTING<br />
VOLUME 18<br />
amining annular hurricanes. These are the periods containing<br />
0000 UTC 4 September 1995 for Hurricane Luis<br />
and 0600 UTC 15 August 1999 for Hurricane Dora.<br />
These aircraft reconnaissance data were collected by the<br />
Fifty-third Weather Reconnaissance Squadron and are<br />
available in a 10-s temporal resolution. Each sortie contained<br />
three transects of the storm.<br />
Environmental conditions associated with annular<br />
hurricanes are obtained using the predictors calculated<br />
for the Statistical Hurricane Intensity Prediction Scheme<br />
(SHIPS), which are available at 12-h increments<br />
(DeMaria and Kaplan 1994a, 1999). The SHIPS atmospheric<br />
information is derived from National Centers<br />
for Environmental Prediction (NCEP) global model<br />
analyses through 1999. In this process the storm circulation<br />
is removed using a Laplacian filter, which performs<br />
a linear interpolation across a circular area encompassed<br />
by radius R and effectively removes the<br />
storm-scale circulation from the environmental flow.<br />
This filter is applied to the original model as described<br />
in DeMaria and Kaplan (1999) and the data were saved<br />
ina2 latitude–longitude grid (2.5 prior to 1996). In<br />
this filtering process R 800 km at 1000 hPa and<br />
decreases linearly to R 500 km at 100 hPa. Once this<br />
filter has been applied to the analyses, which effectively<br />
removes the storm-scale circulation from the environmental<br />
flow, average environmental factors are calculated<br />
within 1000 km of the storm center, except for<br />
vertical wind shear, which is averaged within a distance<br />
of 600 km. Since the current formulation of SHIPS no<br />
longer uses the Laplacian filter to create area-average<br />
predictors, our analysis is limited to storms that formed<br />
prior to 1999.<br />
Environmental factors calculated for the SHIPS model<br />
include temperature, zonal wind, relative eddy momentum<br />
flux convergence (REFC) and divergence at<br />
200 hPa, vorticity at 850 hPa, and vertical wind shear<br />
between 200 and 850 hPa and 500 and 850 hPa. The<br />
REFC is calculated from<br />
<br />
2 2<br />
REFC r (r UV), L L<br />
(1)<br />
r<br />
where r is the radius from storm center, U is the radial<br />
wind, V is the tangential wind, the overbar represents<br />
an azimuthal average with respect to the storm center,<br />
the primes represent deviations from that average, and<br />
the subscript L indicates a coordinate system moving<br />
with the storm. If not calculated in a motion-following<br />
coordinate, storm motion would result in a positive<br />
REFC. Point values of SST used by SHIPS are derived<br />
from weekly SST fields described in Reynolds and<br />
Smith (1994). Since the environments of tropical cyclones<br />
has been well examined in the literature we<br />
choose to use a combined Atlantic and east Pacific tropical<br />
cyclone climatology for the purposes of identifying<br />
the characteristic environments associated with the average<br />
annular hurricane. In doing so the authors recognize<br />
that some biases may be introduced into the results<br />
of this study.<br />
The authors also recognize that the operational analyses<br />
carry with them a host of errors and uncertainties.<br />
However, as described in Molinari et al. (1992), these<br />
analyses possess sufficient quality to deduce large-scale<br />
environmental factors such as vertical wind shear and<br />
fluxes of angular momentum. Further proof of the usefulness<br />
of these analyses with respect to tropical cyclone<br />
studies comes from the ability of SHIPS to provide skillful<br />
hurricane intensity predictions using data derived<br />
from these analyses (DeMaria and Kaplan 1999).<br />
3. Features of annular hurricanes<br />
Before the features associated with annular hurricanes<br />
can be examined, annular hurricane cases must be identified.<br />
The IR imagery is the visual means by which we<br />
determine whether a storm is an annular hurricane. An<br />
annular hurricane is identified if the hurricane persists<br />
for at least 3 h in an axisymmetric state defined by the<br />
following: 1) the hurricane has a normal-to-large-sized<br />
circular eye surrounded by a single band of deep convection<br />
containing the inner-core region and 2) the hurricane<br />
has little or no convective activity beyond this<br />
annulus of convection. The use of digital IR data also<br />
allows for the development of an objective technique of<br />
identifying storms with these characteristics, which will<br />
be addressed in section 4. Note that a hurricane is considered<br />
an annular hurricane only when these conditions<br />
are met; before and after the annular phase, the hurricane<br />
is considered an asymmetric storm. The six hurricanes<br />
that meet these subjective criteria during our period of<br />
study are listed in Table 1 along with ranges of satellite<br />
estimates of the range of eye sizes and best-track-determined<br />
intensities. Further details on the characteristics of<br />
these storms are described in sections 4a–d.<br />
a. Axisymmetry<br />
The first feature that separates annular hurricanes<br />
from the general population of hurricanes is the degree<br />
of axisymmetry displayed in IR imagery. Figure 1<br />
shows IR images of each of the annular hurricanes listed<br />
in Table 1. Many of the defining attributes of an annular<br />
hurricane are displayed in this figure. First, annular hurricanes<br />
have nearly circular eyes and these eyes have<br />
larger radii (see Table 1) than the Atlantic average of<br />
23 km (sample size 415, standard deviation 5.3<br />
km), as determined from the extended Atlantic best track<br />
for storms with intensities greater than 85 kt. The second<br />
feature that all annular hurricanes have is a nearly symmetric<br />
annulus of deep convection (IR brightness temperatures)<br />
surrounding the circular eye, although some<br />
small asymmetries in cloud-top temperature within this<br />
annulus still exist as shown in the enhanced images<br />
shown in Fig. 1. This result is confirmed by quantitative<br />
analysis that shows that the standard deviation of brightness<br />
temperature relative to the symmetric mean is much<br />
smaller than that of the typical hurricane for radii within
APRIL 2003 KNAFF ET AL.<br />
207<br />
TABLE 1. A list of annular hurricanes, the basin in which they occurred, the dates (calendar and yearday) during which they exhibited<br />
annular hurricane characteristics, and the number of hours they exhibited annular hurricane characteristics. Also listed for reference are the<br />
eye size range and the intensity range these storms experienced during each annular phase.<br />
Storm<br />
and year Basin<br />
<strong>Annular</strong> period<br />
(calendar)<br />
Luis, 1995 Atlantic 1800 UTC 3 Sep–<br />
0400 UTC 4 Sep<br />
Edouard, 1996 Atlantic 0000 UTC 25 Aug–<br />
0000 UTC 26 Aug<br />
Darby, 1998 East Pacific 1200 UTC 26 Jul–<br />
1800 UTC 27 Jul<br />
Howard, 1998 East Pacific 1800 UTC 24 Aug–<br />
0300 UTC 27 Aug<br />
Beatriz, 1999 East Pacific 1800 UTC 12 Jul–<br />
1800 UTC 13 Jul<br />
Dora, 1999 East Pacific 1800 UTC 10 Aug–<br />
0300 UTC 12 Aug<br />
0300 UTC 15 Aug–<br />
0300 UTC 16 Aug<br />
the eyewall region. The final feature that is most specific<br />
to annular hurricanes is the general lack of deep convective<br />
features, including spiral bands, beyond the annulus<br />
of deep convection surrounding the eye. Some<br />
spiral-shaped features do appear in Fig. 1. However,<br />
most of these show characteristics of thick cirrus bands<br />
associated with upper-level outflow jets as indicated by<br />
the scallops along their edges and the transverse banding<br />
seen at cloud top (see Bader et al. 1995, chapter 3), and<br />
are likely not associated with near-surface-based, deep<br />
convection. The use of IR brightness temperatures in<br />
this study however, results in the possibility that spiral<br />
bands not visible in IR imagery do exist under the cirrus<br />
canopy. The existence of spiral bands is best examined<br />
using radar data, which are not available. Passive microwave<br />
data could have been utilized for this study,<br />
providing single images during the annular phases, but<br />
were not. There is at least one example where there is<br />
the existence of a spiral band under the cirrus canopy;<br />
however, spiral bands are still generally lacking when<br />
compared to other intense tropical cyclones.<br />
The annular nature of these storms usually occurs<br />
only during a short period of their life cycle. Figure 2<br />
shows time versus radius plots of the azimuthal mean<br />
IR brightness temperatures for the Atlantic and eastern<br />
Pacific annular hurricanes, with the two Atlantic cases,<br />
Luis and Edouard, at the top. Horizontal lines indicate<br />
the beginning (earliest) and end (latest) of each annular<br />
phase. Also note that Hurricane Dora had two separate<br />
annular periods. There are several interesting features<br />
in these figures that relate to the shape and behavior of<br />
the azimuthal mean brightness temperatures. In the Atlantic<br />
(east Pacific) cases, the cold cloud area (10C,<br />
shaded in Fig. 2) expands (contracts) as the storms move<br />
westward. This is likely related to the SST gradients,<br />
where SSTs increase to the west in the Atlantic and<br />
decrease to the west in the east Pacific. It is also interesting<br />
that the Atlantic storms seem to experience their<br />
annular state earlier in their life cycle and have their<br />
<strong>Annular</strong> period<br />
(yearday) Hours<br />
Eye size<br />
range (km)<br />
Intensity range<br />
(kt)<br />
246.75–247.14 10 62–64 120–125<br />
238.00–239.00 24 32–35 120–125<br />
207.50–208.75 30 41–43 90–100<br />
236.75–239.13 57 44–54 115–85<br />
193.75–194.75 24 41–44 100–105<br />
222.75–224.13 33 36–38 115–120<br />
227.13–228.13 24 36–39 80–95<br />
maximum intensity later, while the eastern Pacific<br />
storms transition to an annular state after reaching maximum<br />
intensity. However, this interesting observation is<br />
far from a conclusion being based upon just six cases.<br />
These observations suggest that the environment (i.e.,<br />
SSTs, vertical wind shear) is likely playing a role in<br />
determining the location and frequency of annular hurricanes.<br />
In most of these storms, a strong, diurnal signal in<br />
the outward-flowing cirrus canopies occurs in the 200–<br />
400-km radial regions, as is documented in Kossin<br />
(2002). These diurnal oscillations, examples of which<br />
are indicated in Fig. 2 by the letter Ds, appear to suddenly<br />
diminish in radial extent in many of these storms<br />
during the period when these storms become annular<br />
hurricanes. The interesting radial contraction of these<br />
oscillations associated with the annular phase of these<br />
storms is particularly evident in Howard, Beatriz, and<br />
Dora. These oscillations are observed to expand to<br />
greater radii following the times that annular characteristics<br />
were observed in Luis, Edouard, and Dora and<br />
contract with the first eye formation in Darby, Howard,<br />
and Beatriz. The transitions both to and from this annular<br />
state are rather abrupt. Most evident are the relatively<br />
large eye features and the notable decrease in<br />
cold cloud features, indicated by brightness temperatures<br />
(B t) between 10 and 60C, beyond the annulus<br />
of deep convection (B t 60C) surrounding the eye<br />
in the region where spiral banding is most often observed<br />
in the IR.<br />
b. Intensity characteristics<br />
Typically, hurricanes in the Atlantic experience their<br />
peak intensity for very short periods, and then with time<br />
fill rather rapidly (Emanuel 2000). In contrast, annular<br />
hurricanes subsequent to maximum intensity fill more<br />
slowly. In Fig. 3, the time series of intensity, normalized<br />
by peak intensity, for typical hurricanes unaffected by
208 WEATHER AND FORECASTING<br />
VOLUME 18<br />
FIG. 1. Color-enhanced IR images of (top left) Hurricane Luis at 2015 UTC 3 Sep, (top right) Hurricane Edouard at 1345 UTC 25 Aug,<br />
(middle left) Hurricane Darby at 1530 UTC 25 Jul, (middle right) Hurricane Howard at 0000 UTC 25 Aug, (bottom left) Hurricane Beatriz<br />
at 1830 UTC 12 Jul, and (bottom right) Hurricane Dora at 0830 UTC 11 Aug during the period in which they were annular hurricanes.<br />
Each image projection is Mercator and has been magnified by a factor of 2 to a 2-km resolution. The resulting spatial scale is 1280 km <br />
960 km for each panel. The temperature scale for the color enhancement used on the imagery is shown at the bottom.
APRIL 2003 KNAFF ET AL.<br />
209<br />
FIG. 2. Time vs radius of azimuthally averaged IR brightness temperature for the entire life cycles of the annular<br />
hurricanes listed in Table 1. The top panels display results from the Atlantic annular hurricanes (left) Luis and (right)<br />
Edouard. The middle panels display (left) Darby and (right) Howard. The bottom panel shows (left) Beatriz and<br />
(right) Dora. The diurnal oscillations discussed in the text, which are located in the 200–400-km radial band, are<br />
indicated by a series of Ds at the daily maxima. Horizontal lines indicate the beginning and end of annular periods<br />
(see Table 1). Notice that Hurricane Dora had two annular periods and that the timescale is different for each storm.<br />
land or cold water in the Atlantic from Emanuel (2000)<br />
is compared with the average time series of intensity of<br />
the eastern Pacific and Atlantic annular hurricanes listed<br />
in Table 1. Unlike the typical Atlantic hurricane (Emanuel<br />
2000), Fig. 3 shows that annular hurricanes tend to<br />
experience a long period of intensity steadiness with a<br />
relatively slowly decreasing intensity following their<br />
maximum intensity.<br />
The Dvorak (1984) method provides estimates of<br />
maximum, average, and slow 24-h weakening rates for
210 WEATHER AND FORECASTING<br />
VOLUME 18<br />
FIG. 3. Composite time series of the intensity (normalized by peak<br />
intensity) associated with average Atlantic hurricanes that did not<br />
encounter cold water or make landfall (56 cases) as reported by Emanuel<br />
(2000) and annular hurricanes (6 cases), normalized by mean<br />
maximum intensity. Compositing was done relative to the time of<br />
maximum intensity.<br />
storms with similar intensities as the annular hurricanes<br />
in this study. The maximum rate of weakening is 1.5 T<br />
numbers per day, which corresponds to an approximately<br />
40-kt decrease of intensity per day for storms<br />
with similar intensities as annular hurricanes. The average<br />
(slow) weakening that this method uses is 1 (0.5)<br />
T numbers per day, which corresponds to approximately<br />
20 kt (12 kt) per day for these same intensities. For<br />
instance, for a storm with a maximum intensity of 90<br />
kt, these weakening rates would correspond to 0.61 for<br />
maximum weakening, 0.72 for average weakening, and<br />
0.85 for slow weakening at 24 h after maximum intensity<br />
in Fig. 3. Note the mean maximum intensity of the<br />
sample in Emanuel (2000) is 88.6 kt and the 24-h weakening<br />
is 14.7 kt, corresponding to a value of 0.86 in<br />
Fig. 3—or slowly weakening. Using the theory dis-<br />
TABLE 2. Forecast biases and errors associated with the 1995–99 hurricane seasons in the Atlantic and eastern Pacific as compared with<br />
those of the annular hurricanes. Values are represented in knots.<br />
Forecast length (h) 12 24 36 48 72<br />
Forecast biases<br />
<strong>Annular</strong> cases (SHIPS)<br />
<strong>Annular</strong> cases (NHC)<br />
No. of forecasts (annular)<br />
1995–99 (SHIPS)<br />
1995–99 (NHC official)<br />
No. of forecasts (1995–99)<br />
Forecast errors<br />
Annual cases (SHIPS)<br />
<strong>Annular</strong> cases (NHC)<br />
1995–99 (SHIPS)<br />
1995–99 (NHC)<br />
4.0<br />
2.5<br />
110<br />
0.1<br />
0.3<br />
1544<br />
9.3<br />
7.5<br />
8.1<br />
6.7<br />
9.2<br />
6.0<br />
98<br />
0.1<br />
0.8<br />
1399<br />
15.0<br />
13.0<br />
12.5<br />
11.1<br />
cussed in Montgomery et al. (2001) to estimate maximum<br />
weakening rates was interesting, producing results<br />
remarkably similar to those of Dvorak (1984) (the storm<br />
was assumed to have a depth of 15.5 km, the boundary<br />
layer was 0.5 km deep, the reduction factor was 0.8,<br />
and the drag coefficient was set equal to 2.0 10 3 ).<br />
Using this method a 90-kt storm would weaken nearly<br />
23 kt in 24 h, which in Fig. 3 would correspond to a<br />
value of 0.74 at 24 h after maximum intensity. Clearly,<br />
annular hurricanes fall in the category of weakening<br />
very slowly.<br />
Because the intensity evolution of annular hurricanes<br />
is different than that found by Emanuel (2000), the forecast<br />
error characteristics are also different. Table 2<br />
shows the average forecast intensity biases and errors<br />
for all the cases during the years 1995–99 in the Atlantic<br />
and eastern Pacific, along with corresponding biases and<br />
errors associated with the annular hurricanes. Results<br />
are shown from the SHIPS model and the official NHC<br />
forecast at 12, 24, 36, 48, and 72 h. The verification for<br />
the Atlantic and eastern Pacific annular hurricanes was<br />
performed by restricting the best track to cases 24 h<br />
before and 48 h after the annular periods identified in<br />
Table 1. The large negative forecast biases associated<br />
with these annular hurricanes are shown in both the<br />
SHIPS and NHC official forecast verification. The biases<br />
range from 10 to 3 times greater than those for the<br />
1995–99 sample. The associated forecast errors are also<br />
10%–40% greater, depending on forecast period. It is<br />
also notable that the forecasters (NHC) make remarkably<br />
better intensity forecasts than the SHIPS guidance<br />
in these cases, apparently by forecasting greater future<br />
intensities for these storms. The comparably better NHC<br />
forecasts also suggest that an objective technique for<br />
identifying annular hurricanes, and conditions associated<br />
with their formation, may improve statistically<br />
based intensity models such as SHIPS.<br />
c. <strong>Annular</strong> hurricane formation<br />
Figure 4 shows a sequence of IR images from Hurricane<br />
Howard (1998) that depicts one example of an-<br />
14.8<br />
10.8<br />
86<br />
0.8<br />
1.7<br />
1247<br />
19.6<br />
17.0<br />
15.6<br />
13.8<br />
20.8<br />
17.1<br />
74<br />
2.1<br />
2.7<br />
1100<br />
23.2<br />
21.8<br />
18.2<br />
16.4<br />
24.1<br />
18.9<br />
50<br />
3.7<br />
2.3<br />
867<br />
26.7<br />
22.1<br />
20.7<br />
19.1
APRIL 2003 KNAFF ET AL.<br />
211<br />
nular hurricane formation. An eye became evident in<br />
the IR imagery during 22 August and persisted for more<br />
than a day. During this period, the eye was 12–16 km<br />
in diameter (Fig. 4a). At 0630 UTC 24 August, a mass<br />
of relatively cloud-free air was observed to intrude into<br />
the storm center (Fig. 4b) and subsequently consolidate<br />
to form a new, and larger, eye (Fig. 4c). After this time,<br />
and during the remainder of 24 August, a rapid and<br />
dramatic rearrangement of the IR pattern in Howard’s<br />
inner core was observed to occur (Figs. 4d–k). At 1530<br />
UTC, the eye–eyewall interface became highly asymmetric<br />
as the cold clouds associated with the eyewall<br />
appeared to mix inward, and at 1630 UTC, there appeared<br />
to be two possible mesovortices rotating together<br />
cyclonically around the eye. The nature of mesovortices<br />
embedded in a vortex is to act as ‘‘mixmasters’’; that<br />
is, they efficiently mix the air in their near surroundings.<br />
In a nondivergent barotropic framework discussed in<br />
Schubert et al. (1999) recently formed mesovortices surrounding<br />
the eye mix low potential vorticity located in<br />
the eye into the high potential vorticity region associated<br />
with the eyewall. One could speculate that this appeared<br />
to be occurring during 1700–1900 UTC, as the mesovortices<br />
were apparently advecting eyewall air into the<br />
eye while orbiting each other in the eye. At the end of<br />
this dramatic event (Fig. 4k), the IR pattern was indicative<br />
of an annular hurricane, as discussed in section<br />
1a. It is remarkable that in less than 24 h, the diameter<br />
of Howard’s eye increased by a factor of more than 4<br />
as the eye diameter increased from 12 to 88 km.<br />
Another example of annular hurricane formation is<br />
offered in Fig. 5, which shows the transition of Hurricane<br />
Luis (1995) into an annular hurricane. The transition<br />
of Luis is less dramatic, but has several similarities<br />
to Howard. In Fig. 5a Luis has a nearly circular<br />
eye and one major spiral band to its north and northeast.<br />
There also appears to be an undulation along the inner<br />
eyewall of the storm in Fig. 5a, possibly indicating the<br />
existence of a mesovortex. An hour latter (Fig. 5b), there<br />
is an elongated region of warmer cloud-top temperatures<br />
to the north and northeast of the eyewall that appears<br />
associated with aforementioned mesovortex feature that<br />
has now rotated to the northeast inner eyewall. In Fig.<br />
5c the warm cloud tops are associated with a noticeable<br />
break in the eyewall, which over the next 4 h (0915–<br />
1315 UTC; Figs. 5d–i) rotates around the storm center,<br />
displaying at times what could be described as a banded<br />
eye structure. An hour latter (1415 UTC; Fig. 5j), a<br />
large area of cold cloud appears in the inner southeast<br />
region of the eyewall, which dissipates as it rotates<br />
around the eye, as shown in Fig. 5k, 3 h later. Over the<br />
next 3 h the eye expands to have a diameter of 120<br />
km, increasing by a factor of approximately 2.<br />
Although the specific details can vary between the<br />
annular cases, rearrangements involving possible mesovortices<br />
were observed in all of the other annular<br />
hurricanes considered in this study with storms undergoing<br />
a similar succession of events with one or two<br />
possible mesovortices transforming a smaller eye into<br />
a larger eye. Luis, Edouard, and Dora had one possible<br />
mesovortex associated with their transition while Howard,<br />
Darby, and Beatriz had two of these features that<br />
were associated with their transition to an annular hurricane.<br />
The transition timescales of these cases were<br />
quite similar with most transitions taking 24 h. The<br />
storms that had two possible mesovortices appeared to<br />
undergo transition in a more dramatic fashion in the IR<br />
imagery while transitions involving one mesovortex appeared<br />
to be less abrupt.<br />
All of these transitions could be viewed as an eyewall<br />
replacement process (i.e., a smaller eyewall is replaced<br />
by a larger eyewall). While the formation of concentric<br />
eyewalls is likely a symmetric process (e.g., Willoughby<br />
et al. 1982), and the mechanisms that cause the formation<br />
of concentric rings of convection and tangential<br />
winds are still in dispute, the dissipation of the primary<br />
eyewall once the outer eyewall has become dominant<br />
has been has been modeled using simple 2D barotropic<br />
dynamics (Kossin et al. 2000). The results of this modeling<br />
effort show that the existence of a secondary ring<br />
of elevated vorticity (secondary eyewall) along with its<br />
strength and proximity to the inner vorticity maximum<br />
(primary eyewall) affects the details of the dissipation<br />
of the primary eyewall. Several long-lived structural<br />
configurations can result, including long-lived vorticity<br />
rings (i.e., eyewalls) near the radii of the initial secondary<br />
vorticity maximum.<br />
Radial profiles of vorticity and e from <strong>Hurricanes</strong><br />
Luis and Dora, the only storms with reconnaissance data<br />
available during their annular phase, are rather intriguing.<br />
Figure 6 shows the tangential wind, angular velocity,<br />
e, and vorticity for Hurricane Luis for the radial<br />
legs occurring between 2230 and 2308 UTC 3 September.<br />
These profiles are very similar to those of Hurricane<br />
Dora (not shown for brevity), nothing that Dora was a<br />
smaller and weaker annular hurricane when observed<br />
by reconnaissance aircraft on 15 August. The tangential<br />
wind () has a U-shaped profile (i.e., 2 /r 2 0) with<br />
a number of visible steplike features as the profile transitions<br />
from the middle of the eye to the radius of maximum<br />
wind with a very steep transition occurring just<br />
inside the radius of maximum wind. In the angular velocity<br />
and vorticity fields, the steplike features in the<br />
tangential winds appear as local maxima and thus the<br />
Rayleigh necessary condition for barotropic instability<br />
is satisfied. The e indicates that the eyewall is generally<br />
well mixed with respect to this conserved variable, with<br />
local maxima and minima roughly corresponding to the<br />
local minima and maxima in the angular velocity field.<br />
These steplike features in the tangential winds may be<br />
evidence of PV filamentation (e.g., Ritchie and Holland<br />
1993). In the context of a recent paper by Kossin and<br />
Eastin (2001), the annular hurricanes seem to be neither<br />
in regime 1 (barotropically unstable) nor in regime 2<br />
(barotropically stable), but rather in between these regimes.<br />
Evidence that a dramatic PV mixing event has
212 WEATHER AND FORECASTING<br />
VOLUME 18<br />
FIG. 4. The transition of Hurricane Howard from a hurricane with a small eye (12 km diameter) to an annular<br />
hurricane. Times on the individual panels are shown in the upper left of each panel and the temperature enhancement<br />
used in all the images is shown in the upper-right panel of this figure. Description of the evolution is given in<br />
the text.<br />
FIG. 5. The transition of Hurricane Luis to an annular hurricane. Times are shown in the bottom center of each panel and the temperature<br />
enhancement used in all the images is shown at the bottom of this figure. Description of the evolution is given in the text.<br />
→
APRIL 2003 KNAFF ET AL.<br />
213
214 WEATHER AND FORECASTING<br />
VOLUME 18<br />
FIG. 6. Cross sections of (a) tangential wind, (b) angular velocity,<br />
(c) e, and (d) vorticity calculated from flight-level (10 000 ft) reconnaissance<br />
data of Hurricane Luis for 2230–2308 UTC 3 Sep 1995.<br />
occurred is shown by the nearly uniform eye e values.<br />
However, a U-shaped tangential wind field is evidence<br />
that the possibility for barotropic instability still exists.<br />
The existence of this wind profile coupled with the observation<br />
of the relatively long-lived nature of annular<br />
hurricanes allows us to speculate that as the vorticity is<br />
continuously being increased in association with the<br />
convection near the eyewall, it also may be being mixed<br />
contemporaneously into the eye by possible PV filamentation<br />
as indicated in the radial profiles.<br />
This limited evidence produces more questions than<br />
it answers. Though some of the dynamic and thermodynamic<br />
structure of annular hurricanes can be observed<br />
using reconnaissance data, the three-dimensional details<br />
of the formation of annular hurricanes are well beyond<br />
both the scope of this paper and the quality of the presently<br />
available data. The existing evidence suggests that<br />
annular hurricane formation is likely preceded by a dramatic<br />
horizontal mixing event as shown in Figs. 4 and<br />
5. The mixing probably results in fairly uniform radial<br />
profiles of e in the larger than average eye of an annular<br />
hurricane. It also appears as if the mixing process is on<br />
going as indicated by the local maxima and minima in<br />
the angular velocity and vorticity fields. Interestingly,<br />
the evidence of continued mixing may help to explain<br />
the nearly steady intensities associated with annular hurricanes,<br />
but the existing observations do not contain<br />
enough quantitative detail to further investigate these<br />
processes. We also know that all storms that develop<br />
barotropic instability do not become annular hurricanes,<br />
which implies that in addition to barotropic instability,<br />
other conditions must be satisfied. With this in mind,<br />
the next section discusses environmental conditions associated<br />
with annular hurricanes.<br />
d. Typical environmental conditions<br />
The environmental conditions associated with the annular<br />
phase of each of the hurricanes listed in Table 1<br />
are examined using 12-hourly data derived from NCEP<br />
operational atmospheric and oceanic analyses as described<br />
in section 2. Specifically, they include SST, 200hPa<br />
zonal winds, 200-hPa temperatures, vertical wind<br />
shear in a deep layer (200–850 hPa) and a shallow layer<br />
(500–850 hPa), 850-hPa vorticity, 200-hPa divergences<br />
and 200-hPa REFC. Also calculated for this study are<br />
the maximum potential intensity (MPI) 2 of the hurricane<br />
based upon SST [method of DeMaria and Kaplan<br />
(1994b)], storm intensity, and intensity as a percentage<br />
of MPI. All environmental values, except SST and vertical<br />
wind shear, are area averaged within a 1000-km<br />
circle. Wind shear calculations are averaged within a<br />
600-km circular area and SST values are calculated at<br />
2 Note that the values for MPI in the 25.4–28.5C temperature<br />
range are not much different (1–6 kt greater) from values obtained<br />
using the method of Whitney and Hobgood (1997), developed specifically<br />
for the eastern Pacific.
APRIL 2003 KNAFF ET AL.<br />
215<br />
the storm center. For interpretation purposes, positive<br />
200-hPa REFC indicates that the storm-relative asymmetric<br />
radial and tangential winds, resulting from the<br />
storm interacting with the environment, are negatively<br />
correlated resulting in a positive tangential wind tendency<br />
at 200 hPa (e.g., REFC is positive and large when<br />
the storm moves toward an upper-level trough).<br />
Table 3 compares the environmental conditions of the<br />
annular hurricanes with those of the combined 1995–<br />
99 Atlantic and eastern North Pacific sample. This table<br />
helps to determine the ranges of observed values as well<br />
as the assignment of statistical importance of the means.<br />
Statistical significance of the means in determined using<br />
the Student’s t test and a 95% confidence level. Statistical<br />
significance in Table 3 is indicated by the use of<br />
boldface italic print. The mean intensity of these annular<br />
hurricanes (107.6 kt) is significantly stronger than the<br />
sample mean. Average SSTs for annular hurricanes were<br />
26.9C with a much smaller range of values than the<br />
sample mean, yet the mean is not significantly different<br />
than the sample. Despite the rather modest values of<br />
SSTs, all of the annular hurricanes had cloud-top temperatures<br />
colder than 55C at all times, indicating that<br />
the tops of clouds are at their lowest near 200 hPa. Also,<br />
in all of the cases the SSTs are fairly constant with a<br />
tendency to decrease with time. <strong>Annular</strong> hurricanes have<br />
intensities that are 83.5% of their MPI, much larger than<br />
the sample mean of 42.5%, suggesting that the environment<br />
is very conductive to tropical cyclone maintenance.<br />
This contention is supported by the average<br />
vertical wind shear, which is small in both the deep layer<br />
(850–200 hPa) and the shallow layer (850–500 hPa).<br />
The zonal and meridional components of the vertical<br />
wind shears in these two layers indicate that the shear<br />
associated with annular hurricanes is easterly for the<br />
deep layer and east-southeasterly for the shallow layer.<br />
The 200-hPa mean zonal winds associated with annular<br />
hurricanes are also statistically significant and easterly,<br />
with a mean value of 5.0ms 1 and standard deviation<br />
of 1.2 m s 1 . Likewise, the 200-hPa mean temperatures<br />
are colder than the sample mean. The values of 200hPa<br />
REFC are very near zero, which is also true for the<br />
sample mean, and showed little variability, indicating<br />
interactions with the environment, particularly upperlevel<br />
troughs, are likely not important. The conditions<br />
at 200 hPa suggest a location in the Tropics, slightly<br />
equatorward of an upper-level ridge.<br />
There are eight environmental factors that are associated<br />
with all the annular hurricanes in this study. These<br />
factors are listed in Table 4 with their acceptable ranges,<br />
which are derived from the observed means plus or<br />
minus two standard deviations (95% confidence with<br />
n 25). Also listed in Table 4 are the percentages that<br />
each of these conditions existed in each basin as determined<br />
during the years 1989–99 in the NCEP analyses.<br />
The final row of Table 4 lists the percentage of time all<br />
eight environmental conditions existed simultaneously<br />
in each basin in the same analyses. Individually the<br />
TABLE 3. Average environmental conditions associated with the individual cases of Atlantic and eastern Pacific annular hurricanes along with the 1995–99 sample mean values. Listed are<br />
temperatures, wind speeds, two layers of total zonal and meridional vertical wind shears, maximum potential intensity (MPI), intensity, storm REFC, 850-hPa vorticity, and 200-hPa divergence.<br />
Units of these quantities are listed in the column headings. ‘‘Deep’’ and ‘‘shallow’’ in the table refer to values of wind shears between levels 200 and 850 and 500 and 850 hPa, respectively.<br />
Boldface italic indicates statistical significance.<br />
Intensity<br />
(kt) %MPI<br />
MPI<br />
(kt)<br />
850-hPa<br />
vorticity<br />
(106 s1 )<br />
200-hPa<br />
divergence<br />
(106 s1 )<br />
200-hPa<br />
REFC<br />
(m s1 day1 )<br />
Shallow<br />
shear<br />
(m s1 Shallow<br />
U<br />
) (m s1 Shallow<br />
V<br />
) (m s1 )<br />
<strong>Annular</strong> hurricanes (sample size 25)<br />
Deep<br />
V<br />
(m s1 )<br />
Deep<br />
U<br />
(m s1 )<br />
Deep<br />
shear<br />
(m s1 )<br />
200-hPa<br />
T<br />
(C)<br />
200-hPa<br />
U<br />
(m s1 )<br />
SST<br />
(C)<br />
26.9 5.0 55.7 2.7 2.6 0.7 2.8 2.6 1.0 0.0 22<br />
41 128.9 107.6 83.5<br />
0.8 1.2 0.5 1.9 2.3 2.1 1.2 1.2 1.1 0.4 25<br />
38<br />
8.9 12.0 7.6<br />
28.5 2.9 54.5 7.4 1.2 5.9 4.8 0.1 3.1 1.0 75 101 148.9 125 95.9<br />
25.4 6.9 56.5 0.8 6.4 2.6 0.8 4.7 0.7 1.0 20 30 113.2 90 66.0<br />
1995–99 sample mean (sample size 1516)<br />
Mean 27.6 0.9 55.3 7.1 2.4 0.1 3.2 0.2 0.2 1.1 24.6 29 139.3 58.3 42.5<br />
Std dev 1.8 6.6 1.0 4.1 6.7 4.1 1.8 3.2 1.7 3.3 23.4 45 19.26 28.3 20.7<br />
Max 30.8 26.9 52.7 24.4 24.4 16.5 0.1 11.3 7.6 20.0 126 190 165.0 155.0 97.4<br />
Min 19.1 14.9 60.3 0.1 17.0 13.8 12.1 9.6 5.5 16.0 39 111 81.51 20.0 12.6<br />
Mean<br />
Std dev<br />
Max<br />
Min
216 WEATHER AND FORECASTING<br />
VOLUME 18<br />
TABLE 4. List of the eight environmental conditions derived from<br />
the 1989–99 NCEP analyses associated with annular hurricanes. Listed<br />
is the condition on the left followed by the percentage of occurrence<br />
in association with tropical cyclones in each basin. The number<br />
of 12-hourly cases that existed in each basin during this 12-yr period<br />
is given in parentheses. Ranges for the environmental conditions are<br />
determined from Table 3 (the means plus or minus two standard<br />
deviations). The last category (all) refers to the percentage of time<br />
all eight of the factors existed at the same time, as is the case with<br />
the six annular hurricanes examined in this study. The all category<br />
represents the percentage of time that environmental conditions conducive<br />
to the formation of annular hurricanes have existed in each<br />
basin.<br />
Parameter<br />
Atlantic<br />
(1424) (%)<br />
East Pacific<br />
(1876) (%)<br />
1) Weak vertical wind shear,<br />
deep shear 6.5 m s 1<br />
and shallow shear 5.2 m<br />
s 1 41.5 67.5<br />
2) Easterly 200-hPa U, 2.5 U<br />
7.4 m s 1 13.1 42.9<br />
3) 200-hPa T, 54.7 T <br />
56.7C 70.8 64.9<br />
4) Environmental interaction,<br />
|REFC| 2ms 1 day 1 46.9 76.8<br />
5) SSTs, 25.2 SST 28.6C 63.6 50.8<br />
6) Easterly deep shear 2 U <br />
7.2ms 1 25.0 67.5<br />
7) Southeast shallow shear,<br />
0.2 U 5.0 m s 1 ,<br />
3.2 V 1.2 m s 1 13.5 51.7<br />
8) Intensity VMAX 85 kt 16.5 21.1<br />
All (1–8) 0.8 3.0<br />
conditions associated with annular hurricanes are quite<br />
common, with the most limiting overall factor being<br />
intensity. However, the simultaneous combination of the<br />
environmental conditions shown to be associated with<br />
annular hurricanes is quite rare in both basins during<br />
the 1989–99 period, with 0.8% and 3.0% of the cases<br />
exhibiting these conditions in the Atlantic and eastern<br />
Pacific basins, respectively. It is interesting to note that<br />
the percentages of easterly 200-hPa zonal wind as well<br />
as easterly shear are about three times higher in the<br />
eastern Pacific than in the Atlantic. This climatological<br />
difference coupled with a greater number of storms occurring<br />
annually in the east Pacific likely would explain<br />
the greater possibility of annular hurricane occurrence<br />
in that basin.<br />
Using the 36-h period following the annular phases<br />
of these six hurricanes, seven periods in all (since Dora<br />
experienced two annular periods) were examined to determine<br />
what environmental factors changed that possibly<br />
caused the demise of each annular phase. Using<br />
the eight factors and the ranges for each listed in Table<br />
4, Table 5 was constructed. For the 36-h period following<br />
each annular hurricane’s demise the NCEP analyses<br />
are examined to determine if the eight environmental<br />
factors are within the ranges expected for annular hurricanes.<br />
If an environmental factor is out of range, an<br />
X is placed in the table for that factor. Dora I and Dora<br />
II refer to the first and second annular periods for Hur-<br />
ricane Dora. In most case the directional component of<br />
either or both of the 200–850-or the 500–850-hPa shear<br />
was related to the demise of these annular hurricanes<br />
including Luis, Edouard, Beatriz, Howard, and Dora (I<br />
and II). In the case of Luis, Edouard, and Dora II, westerly<br />
200-hPa winds accompanied these changes. In the<br />
case of Dora I, 200-hPa winds became too easterly.<br />
Howard became asymmetric as it encountered modest<br />
northeast wind shear in the 500–850-hPa layer as it also<br />
encountered colder water. Beatriz, during its encounter<br />
with colder water, slowed and was sheared too strongly<br />
from the east in the 500–850-hPa layer. Dora I lost its<br />
annular characteristics when it experienced a period of<br />
southerly shear, while the demise of Darby appears to<br />
be solely related to that storm encountering cold water.<br />
As anticipated the vertical wind shear direction and<br />
magnitude appears to play a roll in the demise of annular<br />
hurricanes while the SST seems to also be a factor, too<br />
warm in Luis and too cold in Howard, Beatriz, and<br />
Darby.<br />
According to these observations, the typical annular<br />
hurricane has an intensity of approximately 85% of its<br />
empirically derived MPI and exists in a favorable hurricane<br />
environment characterized by 1) weak easterly<br />
or southeasterly vertical wind shear, 2) easterly flow and<br />
relatively cold temperatures at 200 hPa, 3) occurrence<br />
within a narrow range (25.4–28.5C) of SSTs that are<br />
nearly constant, and 4) a lack of 200-hPa relative eddy<br />
flux convergence caused by the environment. Furthermore,<br />
as the environment changes and the environmental<br />
factors listed in Table 4 are no longer satisfied, particularly<br />
the vertical wind shear (direction and magnitude),<br />
and to a lesser degree the SST, these storms loss<br />
their annular characteristics.<br />
4. Objective identification techniques<br />
The annular hurricane cases listed in Table 1 were<br />
determined by the visual inspection and qualitative evaluation<br />
of the IR imagery. Because annular hurricanes<br />
have intensities greater than 85 kt and display intensity<br />
change characteristics that are different from the average<br />
hurricane resulting in significant intensity forecast errors,<br />
their identification in an operational setting would<br />
likely be useful for improving intensity forecasts. While<br />
the subjective identification method used in this study<br />
is adequate for the purposes of describing annular hurricanes<br />
and their environments in a postanalysis setting,<br />
there is a need for a systematic and objective technique<br />
for identifying these storms. Building on the characteristics<br />
of annular hurricanes discussed in section 3, the<br />
development of two objective identification techniques<br />
is explored in this section.<br />
The first approach is to use the digital values of the<br />
IR imagery to create an index. Figure 2 shows that the<br />
radial extent of the cirrus canopy, indicated by the cold<br />
values of azimuthally averaged IR temperatures, is much<br />
smaller and that there is evidence of a warm eye feature
APRIL 2003 KNAFF ET AL.<br />
217<br />
TABLE 5. Table illustrating what factors were related to the demise of each annular phase of the six annular hurricanes listed in Table 1.<br />
Listed across the top are the eight environmental conditions, labeled 1–8, which correspond to the same labels in Table 4, that are found to<br />
be consistently present during the annular phases of these storms. Listed are the three 12-hourly analyses following each annular period. An<br />
X in a column indicates that the condition associated with that column is no longer being satisfied; see Table 4 for explanation of the<br />
conditions associated with each column.<br />
Hours<br />
1<br />
Shear<br />
magnitude<br />
2<br />
U200<br />
3<br />
200-hPa<br />
temp<br />
4<br />
REFC<br />
5<br />
SST<br />
6<br />
Easterly<br />
200–850hPa<br />
shear<br />
7<br />
Southeast<br />
500–850hPa<br />
shear<br />
8<br />
Intensity<br />
Luis<br />
12<br />
X<br />
X<br />
24<br />
X<br />
X<br />
36 X X X<br />
Edouard<br />
X<br />
X<br />
X<br />
12<br />
X<br />
24<br />
X<br />
36 X<br />
Darby<br />
X X<br />
12<br />
X<br />
24<br />
X<br />
36<br />
X X<br />
Howard<br />
12<br />
X<br />
X<br />
24<br />
X<br />
X<br />
X<br />
X<br />
36<br />
X<br />
X<br />
X<br />
X<br />
Beatriz<br />
12<br />
X<br />
24<br />
X<br />
X<br />
36<br />
X X<br />
X<br />
Dora I<br />
12<br />
X<br />
24<br />
X<br />
X<br />
36<br />
X<br />
X<br />
Dora II<br />
12<br />
X<br />
X<br />
24<br />
X<br />
X<br />
X<br />
36<br />
X<br />
X<br />
X<br />
during the annular hurricane periods (see Table 1 for<br />
exact times). Using the information shown visually in<br />
Fig. 2, a simple index can be created by comparing the<br />
azimuthally averaged radial profiles of IR brightness<br />
temperature with the average profiles of the annular hurricanes.<br />
Since annular hurricanes have different sizes<br />
and have different ranges of IR temperatures associated<br />
with their cloud tops as shown in Fig. 2, the profiles of<br />
azimuthally averaged IR temperature need to be normalized<br />
to a common size and a common average cloudtop<br />
temperature. The brightness temperatures are normalized<br />
by subtracting the r 0tor 444 km radial<br />
average of the azimuthally averaged brightness tem-<br />
perature ( B )<br />
from the azimuthally averaged brightness<br />
t<br />
temperature at each radii (B t(r)), creating an anomaly<br />
value (b t):<br />
b B (r) B . (2)<br />
t t t<br />
The normalized radius (R) is created by subtracting the<br />
radius of the coldest azimuthally averaged brightness<br />
temperature within 600 km of the radius (r Bt min) from<br />
the physical radius (r) and dividing by the r Bt min:<br />
<br />
r rBt min<br />
R . (3)<br />
r Bt min<br />
These procedures result in a normalized radial profile<br />
of normalized brightness temperature where the coldest<br />
normalized brightness temperature is located at the origin<br />
of normalized radius (R 0). The averaged normalized<br />
radial profile of normalized brightness temperature<br />
(i.e., R versus b t) along with the normalized radial<br />
profiles of normalized brightness temperature of the six<br />
annular hurricanes that make up the average are shown<br />
in Fig. 7.<br />
In order to compare a given azimuthally averaged<br />
brightness temperature profile to the average one shown<br />
in Fig. 7, referred to as the mean profile, an identical<br />
normalization procedure must be performed on the azimuthally<br />
averaged IR brightness temperature profile of
218 WEATHER AND FORECASTING<br />
VOLUME 18<br />
FIG. 7. Average normalized radial profiles of normalized brightness temperatures for each<br />
annular hurricane along with the six-storm average indicated by the thick dark line. See text for<br />
the radius and temperature normalization procedures.<br />
the tropical cyclone image under consideration or the<br />
test profile. The comparison is accomplished by 1) computing<br />
the amount of the variance the test profile explains<br />
in the mean profile, 2) calculating the mean absolute<br />
temperature difference between the mean and test<br />
profiles, and 3) testing for a large warm eye in the imagery.<br />
Using dependent data from the six annular hurricanes<br />
involved in this study, it was found that a value<br />
of 50% of explained variance and a mean absolute difference<br />
of 14C did a proficient job of distinguishing<br />
the annular phase of these hurricanes from the rest of<br />
their life cycle. Using the imagery of the storms listed<br />
in Table 1, it was also found that a large warm eye could<br />
be distinguished using the radial profile of azimuthally<br />
averaged brightness temperature. The existence of a<br />
large warm eye requires that the radius of the coldest<br />
azimuthally averaged brightness temperature (r Bt min) be<br />
greater than 54 km and that the warmest brightness temperature<br />
inside r Bt min be warmer than 0C. In evaluating<br />
the imagery, the annular hurricane index was set to a<br />
value of 1.0 if all of these requirements were met for a<br />
3-h period of time and otherwise assigned a value of<br />
0.0.<br />
Figure 8 shows time series plots of this simple index<br />
along with the times listed in Table 1 (dark horizontal<br />
bar) for the six hurricanes discussed in this study. This<br />
method proved dependable in identifying the annular<br />
hurricane phases of the six storms that made up the<br />
dependent sample included in this study, particularly<br />
those occurring in the eastern Pacific basin, noting that<br />
the IR datasets for Luis and Edouard were of a slightly<br />
poorer quality. Although the times where the index was<br />
positive did not exactly line up with the subjective times,<br />
the index did identify each storm. This objective method<br />
was also evaluated on all of the storms in the IR tropical<br />
cyclone archive through 1999. The storms that were<br />
identified by this method as being annular are listed in<br />
Table 6 along with the number of hours they were identified<br />
as having annular characteristics. In these diagnostic<br />
trials, 17 storms were identified as having annular<br />
characteristics out of a possible 63 hurricanes and only<br />
6 were subjectively identified as being annular hurricanes<br />
(i.e., Table 1). This evaluation indicates that this<br />
method correctly classifies hurricanes as being annular<br />
or not 52 out of 63 times (83% of the time). The exact<br />
time of annular occurrence however proved more difficult<br />
to predict with a success rate of approximately<br />
25%. Reviewing the imagery associated with these 17<br />
storms, most of the false alarms are associated with two<br />
factors: 1) large warm eyes with ragged edges that appear<br />
in the azimuthal average as symmetric (i.e., Felix,<br />
Hortense, Nora, Kay, Cindy, and Gert) and 2) very intense<br />
hurricanes (i.e., Guillermo, Mitch, and Floyd). Interesting<br />
is the observation that these storms, while<br />
clearly not annular hurricanes, experiences rather steady<br />
intensities during these times. On the other hand, Georges<br />
was considered when the storms in the IR archive<br />
were being subjectively evaluated, and had many of the<br />
characteristics of an annular hurricane, but it was not<br />
selected because its eye was a little smaller than average<br />
and was continuously contracting during the period it<br />
displayed an annular ring of convection with little spiral<br />
band activity.<br />
The second approach to creating an objective method
APRIL 2003 KNAFF ET AL.<br />
219<br />
FIG. 8. Results of the objective annular hurricane indices are shown along with the annular<br />
hurricane periods determined from a subjective analysis of IR data. A thick horizontal bar indicates<br />
the subjectively determined time periods for each annular hurricane (i.e., those in Table 1). The<br />
vertical bars indicate the results from the objective IR annular hurricane index, where a value of<br />
1 indicates that an annular hurricane exists according to the rules of this index. Also shown are<br />
the 12-hourly results of the environmental annular hurricane index, which are indicated by asterisks<br />
at each 12-h point where the environmental conditions were found favorable for annular hurricanes.<br />
Thin lines connect the asterisks if these conditions last longer than one 12-h period.<br />
for identifying annular hurricanes is to inspect the environmental<br />
conditions for times when the environmental<br />
conditions associated with annular hurricanes exist.<br />
Table 4 lists the required environmental conditions for<br />
annular hurricanes along their expected ranges, as<br />
shown in Table 3.<br />
Using the same 1989–99 data, a search for time periods<br />
during which all of these environmental factors
220 WEATHER AND FORECASTING<br />
VOLUME 18<br />
TABLE 6. A list of storms identified as annular using the digital IR values in the imagery. Listed is the year, the storm name, the basin,<br />
the dates and times of identification, and the number of hours contained in each period.<br />
Year Storm Basin Dates Hours<br />
1995 Felix Atlantic 0600 UTC 20 Aug–1000 UTC 20 Aug 5<br />
1995 Luis Atlantic 1800 UTC 31 Aug–0400 UTC 1 Sep<br />
0300 UTC 3 Sep–0500 UTC 3 Sep<br />
2200 UTC 3 Sep–1100 UTC 4 Sep<br />
1700 UTC 4 Sep–1900 UTC 4 Sep<br />
1996<br />
Edouard<br />
Atlantic<br />
2300 UTC 24 Aug–2200 UTC 25 Aug<br />
1996<br />
Hortense<br />
Atlantic<br />
2200 UTC 12 Sep–0100 UTC 13 Sep<br />
1997 Guillermo East Pacific 1400 UTC 5 Aug–1500 UTC 5 Aug<br />
1997<br />
1998<br />
1998<br />
1998<br />
1998<br />
Nora<br />
Georges<br />
Mitch<br />
Darby<br />
Georgette<br />
East Pacific<br />
Atlantic<br />
Atlantic<br />
East Pacific<br />
East Pacific<br />
1900 UTC 5 Aug–2000 UTC 5 Aug<br />
0200 UTC 22 Sep–1500 UTC 22 Sep<br />
1300 UTC 19 Sep–0900 UTC 20 Sep<br />
1600 UTC 26 Oct–0100 UTC 27 Oct<br />
1700 UTC 17 Jul–1900 UTC 18 Jul<br />
1300 UTC 14 Aug–2100 UTC 14 Aug<br />
1998 Howard East Pacific 0200 UTC 25 Aug–1900 UTC 25 Aug<br />
0500 UTC 26 Aug–2300 UTC 26 Aug<br />
0800 UTC 27 Aug–1000 UTC 27 Aug<br />
1998<br />
Kay<br />
East Pacific<br />
0500 UTC 15 Oct–1000 UTC 15 Oct<br />
1999<br />
Cindy<br />
Atlantic<br />
2300 UTC 27 Aug–1700 UTC 28 Aug<br />
1999 Floyd Atlantic 0000 UTC 13 Sep–0400 UTC 13 Sep<br />
1300 UTC 14 Sep–1700 UTC 14 Sep<br />
1999 Gert Atlantic 1600 UT 18 Sep–0400 UTC 19 Sep 13<br />
1999 Beatriz East Pacific 1900 UTC 12 Jul–0300 UTC 13 Jul<br />
0700 UTC 13 Jul–2100 UTC 13 Jul<br />
0100 UTC 14 Jul–1700 UTC 14 Jul<br />
1999 Dora East Pacific 1700 UTC 10 Aug–0200 UTC 12 Aug<br />
0800 UTC 12 Aug–1200 UTC 12 Aug<br />
1500 UTC 12 Aug–1200 UTC 13 Aug<br />
0800 UTC 15 Aug–2200 UTC 15 Aug<br />
0900 UTC 16 Aug–1100 UTC 16 Aug<br />
TABLE 7. A list of annular hurricanes identified by the simultaneous<br />
existence of all of the environmental conditions associated with annular<br />
hurricanes, which are listed in Table 4. Listed are the year, the<br />
storm’s name, and the number of 12-h periods for which these conditions<br />
existed in the environment.<br />
Year Storm No. of 12-h periods<br />
1989 Ismael<br />
Octave<br />
Raymond<br />
1990 Hernan<br />
Iselle<br />
Marie<br />
Odile<br />
1992 Frank<br />
Georgette<br />
Orlene<br />
1993 Jova<br />
Kenneth<br />
Lidia<br />
1995 Barbara<br />
Luis<br />
1996 Douglas<br />
Edouard<br />
1<br />
1<br />
3<br />
2<br />
4<br />
2<br />
1<br />
3<br />
4<br />
1<br />
2<br />
1<br />
2<br />
6<br />
1998 Darby 4<br />
Howard 3<br />
1999 Beatriz<br />
5<br />
Dora<br />
9<br />
Eugene<br />
1<br />
7<br />
1<br />
4<br />
11<br />
3<br />
14<br />
3<br />
24<br />
4<br />
2<br />
2<br />
14<br />
21<br />
10<br />
26<br />
9<br />
18<br />
19<br />
3<br />
6<br />
19<br />
5<br />
5<br />
9<br />
15<br />
17<br />
35<br />
5<br />
22<br />
15<br />
3<br />
are occurring simultaneously forms the basis of an objective<br />
technique for identifying annular hurricanes. Using<br />
this environmental index for the years 1989–99, 22<br />
storms were identified as having environmental conditions<br />
similar to annular hurricanes, 20 of which occurred<br />
in the eastern Pacific, as shown in Table 7. In the Atlantic,<br />
the only storms identified where Luis and<br />
Edouard. It also appears that there are certain years when<br />
the environment is conducive to annular hurricane formation.<br />
An interesting sidebar is the observation that<br />
annular hurricanes in the eastern Pacific are more likely<br />
to occur in years when the eastern and central equatorial<br />
Pacific have negative SST anomalies.<br />
Unfortunately, it is impossible to verify this method<br />
since the IR archive does not exist prior to 1995 in the<br />
Atlantic and 1997 in the east Pacific. It is, however,<br />
noteworthy that during the period when IR data were<br />
available that of the 63 hurricane cases, only 1 case was<br />
misidentified (Eugene 1999), suggesting this method is<br />
dependable. Figure 8 illustrates the periods identified<br />
using this method as asterisks for each 12-hourly positive<br />
index values. If more than one consecutive 12hour<br />
period is identified, the asterisks are connected with<br />
a thin line. Results from this index show that the environmental<br />
conditions seem to lead the formation of<br />
annular hurricanes as determined subjectively (i.e., Ta-
APRIL 2003 KNAFF ET AL.<br />
221<br />
ble 1) and by the objective (IR) method (i.e., Table 4).<br />
This observation is consistent with recent theoretical<br />
work (e.g., Jones 1995; Bender 1997; Frank and Ritchie<br />
1999, 2001) that show that wind shear is not only the<br />
major modulator of asymmetric and axisymmetric convective<br />
structure in hurricanes, but also that the structural<br />
changes lag the onset of the shear or lack thereof.<br />
Two methods of objectively identifying annular hurricanes<br />
were developed and discussed in this section.<br />
These results, while preliminary, suggest that the identification<br />
of annular hurricanes is a possibility in a realtime<br />
operational setting using either of these methods.<br />
These encouraging results coupled with the intensity<br />
forecasting biases occurring with these storms, discussed<br />
in section 3b, suggest that future research is<br />
needed to determine if the identification of annular hurricanes<br />
is useful in improving intensity forecasts.<br />
5. Summary and concluding remarks<br />
The appearance of tropical cyclones in IR imagery<br />
differs greatly from case to case and over time. The<br />
main focus of this study discusses a category of tropical<br />
cyclone, termed annular hurricanes. When annular hurricanes<br />
are compared with the greater population of<br />
tropical cyclones, as observed in an infrared (IR) data<br />
archive of tropical cyclones, they appear distinctly symmetric<br />
about their center. Their appearance in IR imagery<br />
is characterized by large circular eye features surrounded<br />
by a nearly uniform ring of deep convection<br />
and a distinct lack of deep convective features (i.e.,<br />
spiral bands) outside this ring.<br />
During 1995–99 six hurricanes (two Atlantic and four<br />
eastern Pacific) were subjectively determined to be annular<br />
hurricanes (Fig. 1). It was found that these storms<br />
have several features in addition to axisymmetry that<br />
separate them from other storms, including systematic<br />
formation characteristics, steady intensities, and their<br />
existence in only specific environmental conditions.<br />
The evidence presented here suggests that annular<br />
hurricane formation is preceded by a dramatic asymmetric<br />
mixing event in which possible mesovortices mix<br />
eyewall air into the eye and vice versa, as shown in Fig.<br />
4, culminating in the formation of the axisymmetric<br />
storms with large eyes (i.e., annular hurricanes). The<br />
observed thermodynamic structures of two storms sampled<br />
by aircraft (Luis and Dora) as characterized by<br />
more uniformly distributed values of e in the eye suggest<br />
that a dramatic horizontal mixing event had recently<br />
occurred. At the same time the observed wind field suggests<br />
that some eye-to-eyewall mixing is still occurring,<br />
as shown by the steplike features in the tangential wind<br />
that are associated with local vorticity and angular velocity<br />
peaks.<br />
Once annular hurricanes have formed, they can maintain<br />
their annular shape for days if specific environmental<br />
conditions (see Table 4) are maintained. <strong>Annular</strong><br />
hurricanes are also rather intense, averaging 108 kt,<br />
which corresponds to roughly 85% of their MPI with<br />
respect to SST. As a result, annular hurricanes pose an<br />
interesting challenge when forecasting intensity change.<br />
Unlike typical tropical cyclones of hurricane strength,<br />
annular hurricanes tend to experience a long period of<br />
nearly steady intensities with a relatively slowly decreasing<br />
intensity following their maximum intensity as<br />
shown in Fig. 3. As a result of this intensity change<br />
characteristic, intensity forecast errors are larger for<br />
these storms than for the 1995–99 mean, with large<br />
negative biases, suggesting that the forecasts overestimate<br />
the future rate of filling (see Table 2).<br />
Composite analysis reveals that the typical annular<br />
hurricane exists in a very favorable hurricane environment.<br />
Such an environment is characterized by the combination<br />
of 1) weak easterly or southeasterly vertical<br />
wind shear, 2) easterly flow and relatively cold temperatures<br />
at 200 hPa, 3) a narrow range (25.4–28.5C)<br />
of SSTs that are nearly constant, and 4) a lack of 200hPa<br />
relative eddy flux convergence due to environmental<br />
interactions (see Tables 3 and 4 for details). These<br />
individual characteristics are quite commonly observed,<br />
but the combination of these factors is quite rare occurring<br />
0.8% and 3.0% of the time in the Atlantic and<br />
eastern Pacific tropical cyclone basins, respectively.<br />
A secondary topic of this paper was the objective<br />
identification of annular hurricanes. Two approaches<br />
were discussed. The first approach utilizes the digital<br />
brightness temperature information contained in the IR<br />
imagery. Once azimuthal means of brightness temperature<br />
were created, they were normalized to a common<br />
size and mean brightness temperature, and then compared<br />
to the mean normalized radial brightness temperature<br />
profile of annular hurricanes to form an index.<br />
The second approach used the environmental conditions<br />
to determine whether an annular hurricane could exist.<br />
This required that all of the eight factors listed in Table<br />
4 had to be satisfied. Both techniques seem to work<br />
well, suggesting that such information could be examined<br />
for possible improvements to intensity forecasting.<br />
Although the main purpose of this paper was the documentation<br />
of annular hurricanes, several questions<br />
about these storms remain. The striking symmetry in<br />
IR imagery raises the question, What caused the symmetry?<br />
One possibility is the weak and southeasterly<br />
vertical wind shear associate with these systems. It has<br />
been shown that vertical wind shear leads to systematic<br />
asymmetries in vertical motion, precipitation, and convection<br />
(Bender 1997; Frank and Ritchie 1999; Willoughby<br />
et al. 1984). <strong>Annular</strong> hurricanes show little<br />
evidence of convective asymmetries. Furthermore,<br />
Bender’s (1997) modeling study shows that vertical<br />
wind shear can be caused by the differential advection<br />
of planetary vorticity by the baroclinic hurricane vortex.<br />
This shear, which is due to the effect, has similar<br />
magnitude but opposite direction to the large-scale environmental<br />
vertical shear associated with the annular<br />
hurricanes. In this study the environmental wind has
222 WEATHER AND FORECASTING<br />
VOLUME 18<br />
been filtered to remove the storm-scale circulation within<br />
600-km radius but not all of the effects of the gyres.<br />
However, the filtering reduces the magnitude of gyres<br />
by about a factor of 2 for an average-sized hurricane<br />
that has gyres extending to 800–1000 km. Furthermore,<br />
even if the storm-scale circulations were not effectively<br />
eliminated through this filtering process, the<br />
-gyre-induced vertical wind shear would likely be<br />
poorly sampled at the grid spacing (2–2.5 latitude) of<br />
the NCEP analysis data (Franklin et al. 1996). Based<br />
upon these observations one could speculate that the<br />
environmental vertical wind shear associated with annular<br />
hurricanes (weak southeasterly) is compensating<br />
for vertical wind shear resulting from tropical cyclone<br />
gyres weakening with height, and thus allowing for<br />
greater storm axisymmetry.<br />
Other questions arise from this study that are not so<br />
easily answered and that are beyond the scope of this<br />
study. Why is there a relative reduction of prominent<br />
outer bands? And, why do these storms display slower<br />
filling rates than other hurricanes? The observations discussed<br />
in this paper simply cannot answer these rather<br />
complicated questions. The role of dynamics and thermodynamics<br />
in hurricanes and their interwoven nature<br />
suggests that these questions as they relate to annular<br />
hurricanes are likely better answered by simple diagnostic<br />
modeling studies.<br />
In summary, nature produces a nearly symmetric hurricane<br />
referred to as annular hurricanes in this study.<br />
The documentation of these annular hurricanes shows<br />
how they are similar to and different than the general<br />
population of tropical cyclones. Using the observations<br />
presented here, particularly the environmental conditions<br />
associated with these storms, modeling studies<br />
specifically designed to focus on the formation and evolutionary<br />
characteristics of these storms can be designed<br />
and, hopefully, will lead to even greater physical understanding.<br />
The differences between annular hurricanes<br />
and the greater population of hurricanes have also been<br />
used to classify these systems both subjectively and objectively.<br />
While the ultimate usefulness of such discrimination<br />
is beyond the scope of this study, it does<br />
suggest a future research topic answering the question,<br />
Does the identification of annular hurricanes lead to<br />
better intensity forecasts?<br />
Acknowledgments. The authors thank Kerry Emanuel<br />
for supplying his portion of the data for Fig. 3, Wayne<br />
Schubert for his very helpful comments, Ray Zehr for<br />
continuing to maintain and improve the CIRA/NESDIS<br />
tropical cyclone IR archive, and the three anonymous<br />
reviewers whose helpful comments greatly improved the<br />
manuscript. National Oceanic and Atmospheric Administration<br />
Grant NA67RJ0152 supported the research efforts<br />
of J. Knaff and J. Kossin.<br />
REFERENCES<br />
Bader, M. J., G. S. Forbes, J. R. Grant, R. B. E. Lilley, and A. J.<br />
Waters, 1995: Images in Weather Forecasting: A Practical Guide<br />
for Interpreting Satellite and Radar Imagery. Cambridge <strong>University</strong><br />
Press, 499 pp.<br />
Bender, M. A., 1997: The effects of relative flow on asymmetric<br />
structures in hurricanes. J. Atmos. Sci., 54, 703–724.<br />
Davis, M. A. S., G. M. Brown, and P. Leftwich, 1984: A tropical<br />
cyclone data tape for the eastern and central North Pacific basins,<br />
1949–1983. NOAA Tech. Memo. NWS NHC 25, 15 pp.<br />
DeMaria, M., and J. Kaplan, 1994a: A statistical hurricane intensity<br />
prediction scheme (SHIPS) for the Atlantic basin. Wea. Forecasting,<br />
9, 209–220.<br />
——, and ——, 1994b: Sea surface temperature and the maximum<br />
intensity of Atlantic tropical cyclones. J. Climate, 7, 1324–1334.<br />
——, and ——, 1999: An updated statistical hurricane intensity prediction<br />
scheme (SHIPS) for the Atlantic and eastern North Pacific<br />
basins. Wea. Forecasting, 14, 326–337.<br />
——, J. Demuth, and J. A. Knaff, 2001: Validation of an Advanced<br />
Microwave Sounder Unit (AMSU) tropical cyclone intensity and<br />
size estimation algorithm. Preprints, 11th Conf. on Satellite Meteorology<br />
and Oceanography, Madison, WI, Amer. Meteor. Soc.,<br />
300–303.<br />
Dvorak, V. F., 1984: Tropical cyclone intensity analysis using satellite<br />
data. NOAA Tech. Rep. NESDIS 11, Washington, DC, 47 pp.<br />
[Available from National Technical Information Service, 5285<br />
Port Royal Rd., Springfield, VA 22161.]<br />
Eliassen, A., and M. Lystad, 1977: The Ekman layer of a circular<br />
vortex: A numerical and theoretical study. Geophys. Norv., 31,<br />
1–16.<br />
Emanuel, K., 2000: A statistical analysis of tropical cyclone intensity.<br />
Mon. Wea. Rev., 128, 1139–1152.<br />
Frank, W. M., and E. A. Ritchie, 1999: Effects of environmental flow<br />
upon tropical cyclone structure. Mon. Wea. Rev., 127, 2044–<br />
2061.<br />
——, and ——, 2001: Effects of vertical wind shear on the intensity<br />
and structure of numerically simulated hurricanes. Mon. Wea.<br />
Rev., 129, 2249–2269.<br />
Franklin, J. L., S. E. Feuer, J. Kaplan, and S. D. Aberson, 1996:<br />
Tropical cyclone motion and surrounding flow relationships:<br />
Searching for beta gyres in Omega dropwindsonde datasets.<br />
Mon. Wea. Rev., 124, 64–84.<br />
Jarvinen, B. R., C. J. Neumann, and M. A. S. Davis, 1984: A tropical<br />
cyclone data tape for the North Atlantic basin, 1886–1983: Contents,<br />
limitations, and uses. NOAA Tech. Memo. NWS NHC 22,<br />
Coral Gables, FL, 21 pp.<br />
Jones, S. C., 1995: The evolution of vortices in a vertical shear. Part<br />
I: Initially barotropic vortices. Quart. J. Roy. Meteor. Soc., 121,<br />
821–851.<br />
Kossin, J. P., 2002: Daily hurricane variability inferred from GOES<br />
infrared imagery. Mon. Wea. Rev., 130, 2260–2270.<br />
——, and M. D. Eastin, 2001: Two distinct regimes in the kinematic<br />
and thermodynamic structure of the hurricane eye and eyewall.<br />
J. Atmos. Sci., 58, 1079–1090.<br />
——, and W. H. Schubert, 2001: Mesovortices, polygonal flow patterns,<br />
and rapid pressure falls in hurricane-like vortices. J. Atmos.<br />
Sci., 58, 2196–2209.<br />
——, ——, and M. T. Montgomery, 2000: Unstable interactions between<br />
a hurricane’s primary eyewall and a secondary ring of<br />
enhanced vorticity. J. Atmos. Sci., 57, 3893–3917.<br />
Molinari, J., D. Vollaro, and F. Robasky, 1992: Use of ECMWF<br />
operational analyses for studies of the tropical cyclone environment.<br />
Meteor. Atmos. Phys., 47 (2–4), 127–144.<br />
Montgomery, M. T., J. M. Hidalgo, and P. D. Reasor, 2000: A semispectral<br />
numerical method for modeling the vorticity dynamics<br />
of the near-core of hurricane-like vortices. Atmospheric Science<br />
Paper 695, Dept. of Atmospheric Science, <strong>Colorado</strong> <strong>State</strong> <strong>University</strong>,<br />
56 pp. [Available from Dept. of Atmospheric Science,<br />
<strong>Colorado</strong> <strong>State</strong> <strong>University</strong>, Fort Collins, CO 80523.]<br />
——, H. D. Snell, and Z. Yang, 2001: Axisymmetric spindown dynamics<br />
of hurricane-like vortices. J. Atmos. Sci., 58, 421–435.<br />
Reynolds, R. W., and T. M. Smith, 1994: Improved global sea surface
APRIL 2003 KNAFF ET AL.<br />
223<br />
temperature analyses using optimum interpolation. J. Climate,<br />
7, 929–948.<br />
Ritchie, E., and G. J. Holland, 1993: On the interaction of tropical<br />
cyclone scale vortices. Part II: Discrete vortex patches. Quart.<br />
J. Roy. Meteor. Soc., 119, 1363–1379.<br />
Schubert, W. H., M. T. Montgomery, R. K. Taft, T. A. Guinn, S. R.<br />
Fulton, J. P. Kossin, and J. P. Edwards, 1999: Polygonal eyewalls,<br />
asymmetric eye contraction, and potential vorticity mixing in<br />
hurricanes. J. Atmos. Sci., 56, 1197–1223.<br />
Whitney, L. D., and J. S. Hobgood, 1997: The relationship between<br />
sea surface temperatures and maximum intensities of tropical<br />
cyclones in the eastern North Pacific Ocean. J. Climate, 10,<br />
2921–2930.<br />
Willoughby, H. E., J. A. Clos, and M. G. Shoreibah, 1982: Concentric<br />
eye walls, secondary wind maxima, and the evolution of the<br />
hurricane vortex. J. Atmos. Sci., 39, 395–411.<br />
——, F. D. Marks Jr., and R. J. Feinberg, 1984: Stationary and moving<br />
convective bands in hurricanes. J. Atmos. Sci., 41, 3189–3211.<br />
Zehr, R. M., 2000: Tropical cyclone research using large infrared<br />
image data sets. Preprints, 24th Conf. on <strong>Hurricanes</strong> and Tropical<br />
Meteorology, Fort Lauderdale, FL, Amer. Meteor. Soc., 486–<br />
487.