

1 KOZENY-CARMAN EQUATION REVISITED Jack Dvorkin -- 2009 ...
1 KOZENY-CARMAN EQUATION REVISITED Jack Dvorkin -- 2009 ...
1 KOZENY-CARMAN EQUATION REVISITED Jack Dvorkin -- 2009 ...

You also want an ePaper? Increase the reach of your titles
YUMPU automatically turns print PDFs into web optimized ePapers that Google loves.
€<br />
€<br />
of the original block to those of the highest-porosity Fontainebleau sample.<br />
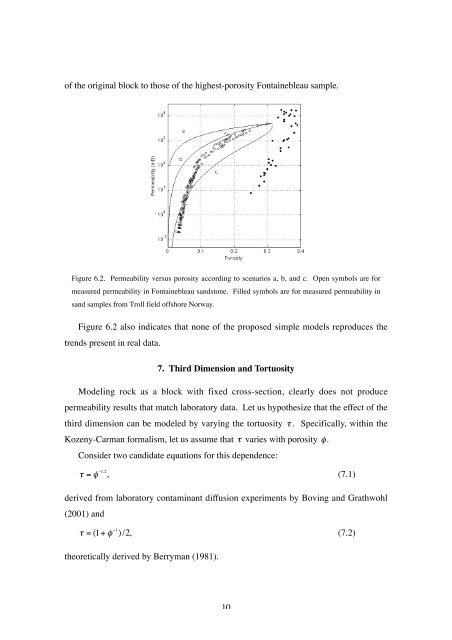
Figure 6.2. Permeability versus porosity according to scenarios a, b, and c. Open symbols are for<br />
measured permeability in Fontainebleau sandstone. Filled symbols are for measured permeability in<br />
sand samples from Troll field offshore Norway.<br />
Figure 6.2 also indicates that none of the proposed simple models reproduces the<br />
trends present in real data.<br />
7. Third Dimension and Tortuosity<br />
Modeling rock as a block with fixed cross-section, clearly does not produce<br />
permeability results that match laboratory data. Let us hypothesize that the effect of the<br />
third dimension can be modeled by varying the tortuosity<br />
Kozeny-Carman formalism, let us assume that τ varies with porosity φ.<br />
Consider two candidate equations for this dependence:<br />
€<br />
10<br />
τ . Specifically, within the<br />
τ = φ €<br />
€<br />
−1.2 , (7.1)<br />
derived from laboratory contaminant diffusion experiments by Boving and Grathwohl<br />
(2001) and<br />
τ = (1+ φ −1 ) /2, (7.2)<br />
theoretically derived by Berryman (1981).


