04 Part 1 - BFI - British Film Institute
04 Part 1 - BFI - British Film Institute
04 Part 1 - BFI - British Film Institute

You also want an ePaper? Increase the reach of your titles
YUMPU automatically turns print PDFs into web optimized ePapers that Google loves.
Intro_20<strong>04</strong>_14.qxd 19/11/<strong>04</strong> 2:32 pm Page 24<br />
Employment statistics<br />
1. Under Articles 5(1), 5(2) and 5(3) of the Race Relations Act 1976 (Statutory Duties) Order 2001, the fund has<br />
a duty to monitor, by reference to the racial groups to which they belong, and to report annually:<br />
The numbers of:<br />
i) staff in post; and<br />
ii) applicants for employment, training and promotion, from each such group.<br />
2. Results of Monitoring carried out in 2003-<strong>04</strong>:<br />
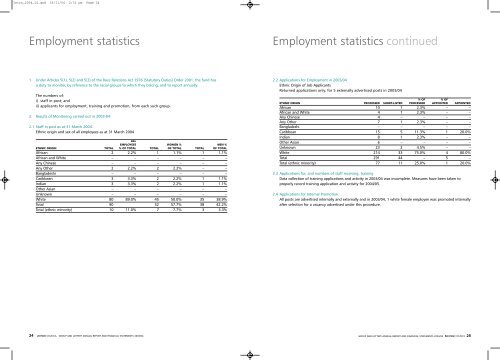
2.1 Staff in post as at 31 March 20<strong>04</strong>.<br />
Ethnic origin and sex of all employees as at 31 March 20<strong>04</strong><br />
ALL<br />
EMPLOYEES WOMEN % MEN %<br />
ETHNIC ORIGIN TOTAL % OF TOTAL TOTAL OF TOTAL TOTAL OF TOTAL<br />
African 2 2.2% 1 1.1% 1 1.1%<br />
African and White – – – – – –<br />
Any Chinese – – – – – –<br />
Any Other 2 2.2% 2 2.2% – –<br />
Bangladeshi – – – – – –<br />
Caribbean 3 3.3% 2 2.2% 1 1.1%<br />
Indian 3 3.3% 2 2.2% 1 1.1%<br />
Other Asian – – – – – –<br />
Unknown – – – – – –<br />
White 80 89.0% 45 50.0% 35 38.9%<br />
Total 90 52 57.7% 38 42.2%<br />
Total (ethnic minority) 10 11.0% 7 7.7% 3 3.3%<br />
Employment statistics continued<br />
2.2 Applications for Employment in 2003/<strong>04</strong><br />
Ethnic Origin of Job Applicants<br />
Returned applications only, for 5 externally advertised posts in 2003/<strong>04</strong><br />
% OF % OF<br />
ETHNIC ORIGIN PROCESSED SHORT-LISTED PROCESSED APPOINTED APPOINTED<br />
African 10 1 2.3% – –<br />
African and White 4 1 2.3% – –<br />
Any Chinese 4 – – – –<br />
Any Other 7 1 2.3% – –<br />
Bangladeshi – – – – –<br />
Caribbean 15 5 11.3% 1 20.0%<br />
Indian 8 1 2.3% – –<br />
Other Asian 6 – – – –<br />
Unknown 23 2 4.5% – –<br />
White 214 33 75.0% 4 80.0%<br />
Total 291 44 – 5 –<br />
Total (ethnic minority) 77 11 25.0% 1 20.0%<br />
2.3 Applications for, and numbers of staff receiving, training<br />
Data collection of training applications and activity in 2003/<strong>04</strong> was incomplete. Measures have been taken to<br />
properly record training application and activity for 20<strong>04</strong>/05.<br />
2.4 Applications for Internal Promotion<br />
All posts are advertised internally and externally and in 2003/<strong>04</strong>, 1 white female employee was promoted internally<br />
after selection for a vacancy advertised under this procedure.<br />
24 GROUP AND LOTTERY ANNUAL REPORT AND FINANCIAL STATEMENTS 2003/<strong>04</strong> GROUP AND LOTTERY ANNUAL REPORT AND FINANCIAL STATEMENTS 2003/<strong>04</strong><br />
25