King et al. (2003a) - ResearchGate
King et al. (2003a) - ResearchGate
King et al. (2003a) - ResearchGate

You also want an ePaper? Increase the reach of your titles
YUMPU automatically turns print PDFs into web optimized ePapers that Google loves.
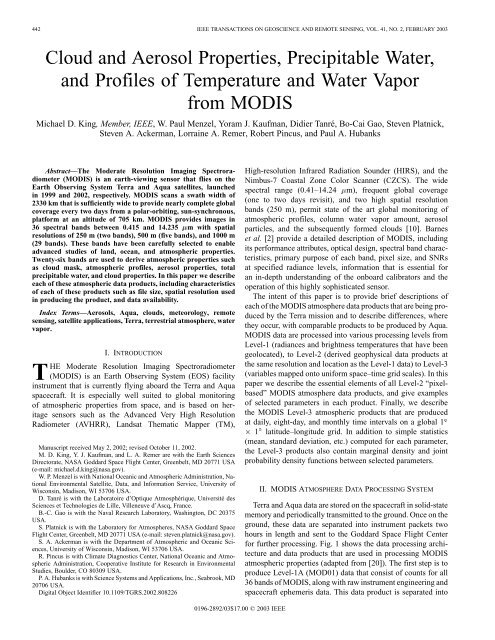
442 IEEE TRANSACTIONS ON GEOSCIENCE AND REMOTE SENSING, VOL. 41, NO. 2, FEBRUARY 2003<br />
Cloud and Aerosol Properties, Precipitable Water,<br />
and Profiles of Temperature and Water Vapor<br />
from MODIS<br />
Michael D. <strong>King</strong>, Member, IEEE, W. Paul Menzel, Yoram J. Kaufman, Didier Tanré, Bo-Cai Gao, Steven Platnick,<br />
Steven A. Ackerman, Lorraine A. Remer, Robert Pincus, and Paul A. Hubanks<br />
Abstract—The Moderate Resolution Imaging Spectroradiom<strong>et</strong>er<br />
(MODIS) is an earth-viewing sensor that flies on the<br />
Earth Observing System Terra and Aqua satellites, launched<br />
in 1999 and 2002, respectively. MODIS scans a swath width of<br />
2330 km that is sufficiently wide to provide nearly compl<strong>et</strong>e glob<strong>al</strong><br />
coverage every two days from a polar-orbiting, sun-synchronous,<br />
platform at an <strong>al</strong>titude of 705 km. MODIS provides images in<br />
36 spectr<strong>al</strong> bands b<strong>et</strong>ween 0.415 and 14.235 m with spati<strong>al</strong><br />
resolutions of 250 m (two bands), 500 m (five bands), and 1000 m<br />
(29 bands). These bands have been carefully selected to enable<br />
advanced studies of land, ocean, and atmospheric properties.<br />
Twenty-six bands are used to derive atmospheric properties such<br />
as cloud mask, atmospheric profiles, aerosol properties, tot<strong>al</strong><br />
precipitable water, and cloud properties. In this paper we describe<br />
each of these atmospheric data products, including characteristics<br />
of each of these products such as file size, spati<strong>al</strong> resolution used<br />
in producing the product, and data availability.<br />
Index Terms—Aerosols, Aqua, clouds, m<strong>et</strong>eorology, remote<br />
sensing, satellite applications, Terra, terrestri<strong>al</strong> atmosphere, water<br />
vapor.<br />
I. INTRODUCTION<br />
THE Moderate Resolution Imaging Spectroradiom<strong>et</strong>er<br />
(MODIS) is an Earth Observing System (EOS) facility<br />
instrument that is currently flying aboard the Terra and Aqua<br />
spacecraft. It is especi<strong>al</strong>ly well suited to glob<strong>al</strong> monitoring<br />
of atmospheric properties from space, and is based on heritage<br />
sensors such as the Advanced Very High Resolution<br />
Radiom<strong>et</strong>er (AVHRR), Landsat Thematic Mapper (TM),<br />
Manuscript received May 2, 2002; revised October 11, 2002.<br />
M. D. <strong>King</strong>, Y. J. Kaufman, and L. A. Remer are with the Earth Sciences<br />
Directorate, NASA Goddard Space Flight Center, Greenbelt, MD 20771 USA<br />
(e-mail: michael.d.king@nasa.gov).<br />
W. P. Menzel is with Nation<strong>al</strong> Oceanic and Atmospheric Administration, Nation<strong>al</strong><br />
Environment<strong>al</strong> Satellite, Data, and Information Service, University of<br />
Wisconsin, Madison, WI 53706 USA.<br />
D. Tanré is with the Laboratoire d’Optique Atmosphérique, Université des<br />
Sciences <strong>et</strong> Technologies de Lille, Villeneuve d’Ascq, France.<br />
B.-C. Gao is with the Nav<strong>al</strong> Research Laboratory, Washington, DC 20375<br />
USA.<br />
S. Platnick is with the Laboratory for Atmospheres, NASA Goddard Space<br />
Flight Center, Greenbelt, MD 20771 USA (e-mail: steven.platnick@nasa.gov).<br />
S. A. Ackerman is with the Department of Atmospheric and Oceanic Sciences,<br />
University of Wisconsin, Madison, WI 53706 USA.<br />
R. Pincus is with Climate Diagnostics Center, Nation<strong>al</strong> Oceanic and Atmospheric<br />
Administration, Cooperative Institute for Research in Environment<strong>al</strong><br />
Studies, Boulder, CO 80309 USA.<br />
P. A. Hubanks is with Science Systems and Applications, Inc., Seabrook, MD<br />
20706 USA.<br />
Digit<strong>al</strong> Object Identifier 10.1109/TGRS.2002.808226<br />
0196-2892/03$17.00 © 2003 IEEE<br />
High-resolution Infrared Radiation Sounder (HIRS), and the<br />
Nimbus-7 Coast<strong>al</strong> Zone Color Scanner (CZCS). The wide<br />
spectr<strong>al</strong> range (0.41–14.24 m), frequent glob<strong>al</strong> coverage<br />
(one to two days revisit), and two high spati<strong>al</strong> resolution<br />
bands (250 m), permit state of the art glob<strong>al</strong> monitoring of<br />
atmospheric profiles, column water vapor amount, aerosol<br />
particles, and the subsequently formed clouds [10]. Barnes<br />
<strong>et</strong> <strong>al</strong>. [2] provide a d<strong>et</strong>ailed description of MODIS, including<br />
its performance attributes, optic<strong>al</strong> design, spectr<strong>al</strong> band characteristics,<br />
primary purpose of each band, pixel size, and SNRs<br />
at specified radiance levels, information that is essenti<strong>al</strong> for<br />
an in-depth understanding of the onboard c<strong>al</strong>ibrators and the<br />
operation of this highly sophisticated sensor.<br />
The intent of this paper is to provide brief descriptions of<br />
each of the MODIS atmosphere data products that are being produced<br />
by the Terra mission and to describe differences, where<br />
they occur, with comparable products to be produced by Aqua.<br />
MODIS data are processed into various processing levels from<br />
Level-1 (radiances and brightness temperatures that have been<br />
geolocated), to Level-2 (derived geophysic<strong>al</strong> data products at<br />
the same resolution and location as the Level-1 data) to Level-3<br />
(variables mapped onto uniform space–time grid sc<strong>al</strong>es). In this<br />
paper we describe the essenti<strong>al</strong> elements of <strong>al</strong>l Level-2 “pixelbased”<br />
MODIS atmosphere data products, and give examples<br />
of selected param<strong>et</strong>ers in each product. Fin<strong>al</strong>ly, we describe<br />
the MODIS Level-3 atmospheric products that are produced<br />
at daily, eight-day, and monthly time interv<strong>al</strong>s on a glob<strong>al</strong> 1<br />
1 latitude–longitude grid. In addition to simple statistics<br />
(mean, standard deviation, <strong>et</strong>c.) computed for each param<strong>et</strong>er,<br />
the Level-3 products <strong>al</strong>so contain margin<strong>al</strong> density and joint<br />
probability density functions b<strong>et</strong>ween selected param<strong>et</strong>ers.<br />
II. MODIS ATMOSPHERE DATA PROCESSING SYSTEM<br />
Terra and Aqua data are stored on the spacecraft in solid-state<br />
memory and periodic<strong>al</strong>ly transmitted to the ground. Once on the<br />
ground, these data are separated into instrument pack<strong>et</strong>s two<br />
hours in length and sent to the Goddard Space Flight Center<br />
for further processing. Fig. 1 shows the data processing architecture<br />
and data products that are used in processing MODIS<br />
atmospheric properties (adapted from [20]). The first step is to<br />
produce Level-1A (MOD01) data that consist of counts for <strong>al</strong>l<br />
36 bands of MODIS, <strong>al</strong>ong with raw instrument engineering and<br />
spacecraft ephemeris data. This data product is separated into
KING <strong>et</strong> <strong>al</strong>.: CLOUD AND AEROSOL PROPERTIES, PRECIPITABLE WATER, AND PROFILES OF TEMPERATURE 443<br />
Fig. 1. MODIS atmosphere data processing architecture and products (adapted from [20]).<br />
5-min granules, and, hence, <strong>al</strong>l Level-1B, geolocated, and subsequently<br />
processed pixel-level data are processed into 5-min<br />
granules ( 2000 km in length <strong>al</strong>ong the orbit<strong>al</strong> track), producing<br />
some 244 granules (or files) per day per data product.<br />
Following Level-1A, c<strong>al</strong>ibration is applied using the onboard<br />
c<strong>al</strong>ibrators, space looks, and instrument performance data, and<br />
these Level-1B (MOD02) data are stored in three separate files,<br />
one each for 250-, 500-, and 1000-m bands. Since many <strong>al</strong>gorithms<br />
that follow in the subsequent processing chain require a<br />
combination of spectr<strong>al</strong> bands having inherently different spati<strong>al</strong><br />
resolutions, a Level-1B product is produced at 250-m resolution<br />
(daytime, two bands), 500 m (daytime, five bands plus two 250-m
444 IEEE TRANSACTIONS ON GEOSCIENCE AND REMOTE SENSING, VOL. 41, NO. 2, FEBRUARY 2003<br />
TABLE I<br />
MODIS ATMOSPHERE DATA PRODUCTS,RESPONSIBLE INVESTIGATOR,PROCESSING LEVEL,PRODUCT ID, SPATIAL RESOLUTION,FILE FREQUENCY, AND FILE SIZE.<br />
a MODxx PRODUCTS APPLY TO TERRA, AND MYDxx PRODUCTS APPLY TO AQUA. b DAYTIME RETRIEVALS OF CLOUD OPTICAL AND MICROPHYSICAL PROPERTIES<br />
ARE PERFORMED AT 1-km RESOLUTION, WHILE DAYTIME AND NIGHTTIME CLOUD-TOP ALTITUDE AND CLOUD-TOP PRESSURE ARE PROCESSED AT 5 km [21]<br />
bands aggregated to equiv<strong>al</strong>ent 500-m bands), and 1000 m (daytime,<br />
36 bands <strong>al</strong>l at 1000 m or aggregated to that resolution from<br />
the finer resolution bands). At night, only the therm<strong>al</strong> bands are<br />
recorded so the MOD02 1-km granules are sm<strong>al</strong>ler in size (17<br />
bands) than during the daytime when <strong>al</strong>l 36 bands are recorded.<br />
Geolocation of each pixel is <strong>al</strong>so contained in the MOD02 file,<br />
but only every fifth pixel and every fifth scan line. For full resolution<br />
navigation, a separate geolocation (MOD03) data file is<br />
produced at a 1-km spati<strong>al</strong> resolution, containing geod<strong>et</strong>ic coordinates,<br />
ground elevation, and viewing geom<strong>et</strong>ry.<br />
All of the data products described in this paper are Level-2<br />
and Level-3 products that ultimately require well c<strong>al</strong>ibrated<br />
and geolocated data from MOD02 and MOD03. These data<br />
products include the cloud mask (MOD35) for distinguishing<br />
clear sky from clouds, atmospheric profiles (MOD07), aerosol<br />
product (MOD04), precipitable water product (MOD05),<br />
cloud product (MOD06), and gridded time-averaged (Level-3)<br />
atmosphere products on a daily, eight-day, and monthly mean<br />
basis (MOD08 products). Table I lists the MODIS atmosphere<br />
data products, responsible investigators, processing level,<br />
product ID used in ordering data from the EOS data system,<br />
spati<strong>al</strong> resolution, file frequency, and file size. All of these<br />
data products are archived and distributed by the Goddard<br />
Distributed Active Archive Center (DAAC). Data products<br />
from Terra use the product ID MODxx, whereas those from<br />
Aqua use the product ID MYDxx (e.g., MYD06).<br />
III. CLOUD MASK<br />
The cloud mask (MOD35) <strong>al</strong>gorithm classifies each pixel<br />
as either confident clear, probably clear, probably cloudy, or<br />
cloudy. The cloud mask consists of 48 bits of output that include<br />
information on individu<strong>al</strong> cloud test results, the processing path,<br />
ancillary information (e.g., land/sea tag), and addition<strong>al</strong> information<br />
(e.g., thin cirrus d<strong>et</strong>ected, heavy aerosol). The cloud<br />
mask <strong>al</strong>gorithm [1] uses a series of threshold tests applied to<br />
20 of the 36 MODIS bands to identify the presence of clouds<br />
in the instrument field-of-view. The specific tests executed are a<br />
function of surface type, including land, water, snow/ice, desert,<br />
and coast<strong>al</strong>, and are different during the day and night. Each<br />
cloud d<strong>et</strong>ection test r<strong>et</strong>urns a confidence level that the pixel is<br />
clear ranging in v<strong>al</strong>ue from one (high confidence clear) to zero<br />
(low confidence clear). Tests capable of d<strong>et</strong>ecting similar cloud<br />
conditions are grouped tog<strong>et</strong>her and a minimum confidence is<br />
d<strong>et</strong>ermined for each group. The fin<strong>al</strong> cloud mask is then d<strong>et</strong>ermined<br />
from the product of the results from each group. This<br />
approach is clear-sky conservative in the sense that if any test<br />
is highly confident that the scene is cloudy, the fin<strong>al</strong> clear-sky<br />
confidence is zero. The first eight bits of the cloud mask provide<br />
a summary adequate for many processing applications.<br />
Fig. 2 shows an example of the cloud mask result for a daytime<br />
granule over Western Austr<strong>al</strong>ia on June 4, 2001. The “true<br />
color” image is a composite image of MODIS bands 1, 4, and 3<br />
(0.645, 0.555, and 0.469 m, respectively). The accompanying<br />
cloud mask image shows the fin<strong>al</strong> result of the cloud mask <strong>al</strong>gorithm<br />
with confident clear (blue), probably clear (green), probably<br />
cloudy (yellow), and cloudy (white). Most of the region is<br />
flagged as confident clear or probably clear. Some of the land<br />
near the coast is flagged as probably clear while the true-color<br />
composite suggests the region to be clear. This results from a<br />
combination of thin cirrus, haze, and varying surface radiative<br />
properties. Experience gained in comparing the cloud mask re-
KING <strong>et</strong> <strong>al</strong>.: CLOUD AND AEROSOL PROPERTIES, PRECIPITABLE WATER, AND PROFILES OF TEMPERATURE 445<br />
Fig. 2. Cloud mask over Western Austr<strong>al</strong>ia on June 4, 2001 at 0155 UTC. Panel (a) is a true color composite of one MODIS granule using bands at 0.645, 0.555,<br />
and 0.469 "m. Panel (b) is the cloud mask derived for this scene, showing the various confidence levels of cloud identified in this scene.<br />
sults with collocated surface lidar systems suggest that the confident<br />
clear and probably clear designations are invariably clear,<br />
whereas the probably cloudy and cloudy designations are invariably<br />
cloudy, with the probably cloudy designation arising near<br />
the edge of clouds or where there is thin cirrus present in the<br />
atmosphere. Subsequent <strong>al</strong>gorithms are given the results of the<br />
individu<strong>al</strong> tests and may choose to use these to further d<strong>et</strong>ermine<br />
wh<strong>et</strong>her to process the pixel, as different <strong>al</strong>gorithms show<br />
different sensitivities to these cloud mask results.<br />
IV. ATMOSPHERIC PROFILES<br />
The atmospheric profiles (MOD07) <strong>al</strong>gorithm performs<br />
statistic<strong>al</strong> r<strong>et</strong>riev<strong>al</strong>s of atmospheric temperature and moisture<br />
layers, tot<strong>al</strong> precipitable water, tot<strong>al</strong> column ozone, and<br />
stability indices. While MODIS is not per se a sounding instrument,<br />
the information content of the high spati<strong>al</strong> resolution<br />
infrared multispectr<strong>al</strong> radiance observations can improve upon<br />
a priori definitions of atmospheric state by providing b<strong>et</strong>ter<br />
delineation of horizont<strong>al</strong> gradients. The MODIS clear-sky<br />
r<strong>et</strong>riev<strong>al</strong>s are performed over land and ocean for both day and<br />
night when at least 20% of the radiances measured within a<br />
5 5 field-of-view area (approximately 5-km resolution) are<br />
cloud-free. The r<strong>et</strong>riev<strong>al</strong> m<strong>et</strong>hods employed here are partly<br />
based on the work of the Internation<strong>al</strong> Advanced TIROS<br />
Operation<strong>al</strong> Vertic<strong>al</strong> Sounder (ATOVS) Processing Package<br />
(IAPP) [15] and the Geostationary Operation<strong>al</strong> Environment<strong>al</strong><br />
Satellite (GOES) sounder <strong>al</strong>gorithms [16], [13], [14].<br />
The operation<strong>al</strong> MODIS atmospheric profile <strong>al</strong>gorithm is a<br />
statistic<strong>al</strong> regression. The <strong>al</strong>gorithm uses 12 infrared bands with<br />
wavelengths b<strong>et</strong>ween 4.47 m (band 24) and 14.24 m (band<br />
36). Surface emissivity effects in the shortwave infrared bands<br />
are mitigated by regressing against band differences (e.g.,<br />
instead of and we use the difference –<br />
in the regression, where represents brightness temperature<br />
at wavelength ). An extension of the NOAA-88 datas<strong>et</strong><br />
containing more than 8400 glob<strong>al</strong> radiosonde profiles of<br />
temperature, moisture, and ozone is used to d<strong>et</strong>ermine the<br />
regression coefficients. MODIS infrared band radiances are<br />
c<strong>al</strong>culated from the radiosonde observations of the atmospheric<br />
state, and the regression coefficients are generated from these<br />
c<strong>al</strong>culated radiances/atmospheric profile pairs. The radiative<br />
transfer c<strong>al</strong>culation of the MODIS spectr<strong>al</strong> band radiances is<br />
performed using a transmittance model c<strong>al</strong>led the Pressure layer<br />
Fast Algorithm for Atmospheric Transmittances [4]; this model<br />
has 101 pressure level vertic<strong>al</strong> coordinates from 0.05–1100 hPa.<br />
The c<strong>al</strong>culations take into account the satellite zenith angle,<br />
absorption by well-mixed gases (including nitrogen, oxygen,<br />
and carbon dioxide), water vapor (including the water vapor<br />
continuum), m<strong>et</strong>hane, carbon monoxide, nitrogen dioxide, and<br />
ozone. In addition, MODIS instrument noise is added into the<br />
c<strong>al</strong>culated spectr<strong>al</strong> band radiances.<br />
To perform the r<strong>et</strong>riev<strong>al</strong>, the regression coefficients are applied<br />
to actu<strong>al</strong> MODIS measurements to obtain the estimated<br />
atmospheric profiles, the integration of which yields the tot<strong>al</strong><br />
precipitable water (TPW) 1 or tot<strong>al</strong> column ozone. The advantage<br />
of this approach is that it does not need MODIS radiances<br />
collocated in time and space with atmospheric profile data, as it<br />
requires only historic<strong>al</strong> profile observations. To address radiative<br />
transfer model uncertainties and residu<strong>al</strong> instrument c<strong>al</strong>ibration<br />
anom<strong>al</strong>ies, radiance bias adjustments are made in the r<strong>et</strong>riev<strong>al</strong><br />
<strong>al</strong>gorithm; these are c<strong>al</strong>culated season<strong>al</strong>ly from MODIS<br />
observed clear-sky radiance composites and glob<strong>al</strong> model atmospheric<br />
an<strong>al</strong>yses.<br />
Fig. 3 shows the temperatures r<strong>et</strong>rieved from the<br />
Terra-MODIS radiances on May 22, 2001 at 0500 UTC<br />
at levels (a) 850 hPa, (b) 700 hPa, and (c) 500 hPa over the<br />
1 Atmospheric profile r<strong>et</strong>riev<strong>al</strong>s are saved at only 20 levels in the MOD07<br />
data product; however, the integration to TPW is performed from the origin<strong>al</strong><br />
r<strong>et</strong>rieved profiles with 101 levels. Thus, integration of the 20-level profiles will<br />
not necessarily result in the same v<strong>al</strong>ue reported in the TPW field.
446 IEEE TRANSACTIONS ON GEOSCIENCE AND REMOTE SENSING, VOL. 41, NO. 2, FEBRUARY 2003<br />
Fig. 3. Atmospheric temperatures r<strong>et</strong>rieved from Terra-MODIS radiances on May 22, 2001 at (a) 850 hPa, (b) 700 hPa, and (c) 500 hPa.<br />
Midwestern United States. At this time, the cold front associated<br />
with a low-pressure system centered in northern Wisconsin<br />
extended southward through Illinois, Missouri, and eastern<br />
Texas. The tongue of cool air behind this front can be seen<br />
pushing into the centr<strong>al</strong> and upper Midwest, and the pattern<br />
extends up through <strong>al</strong>l three levels in the atmosphere shown.<br />
Preliminary ev<strong>al</strong>uation of the Aqua-MODIS atmospheric<br />
profiles <strong>al</strong>gorithm (MYD07) indicates its performance is comparable<br />
to that of Terra. Fig. 4 shows one example from the<br />
Aqua infrared temperature and moisture r<strong>et</strong>riev<strong>al</strong>s. The tot<strong>al</strong><br />
precipitable water (in centim<strong>et</strong>ers) from September 4, 2002<br />
at 1750 UTC indicates a sharp moisture boundary <strong>al</strong>ong the<br />
east coast of the United States associated with the cold front<br />
of a low-pressure system in eastern Canada. The associated<br />
GOES-8 Sounder precipitable water shows gener<strong>al</strong> agreement,<br />
but it does not have the spati<strong>al</strong> resolution to capture the sharp<br />
moisture boundary. A cross-section drawn through the strongest<br />
moisture gradient highlights the vertic<strong>al</strong> structure of this front.<br />
Moist air, with mixing ratios up to 15 g kg , exists through<br />
700 hPa to the south of the front, then the air dries out sharply<br />
around 38.4 latitude. The vertic<strong>al</strong> structure in the temperature<br />
field shows less structure than the moisture, and the temperature<br />
difference across the front is <strong>al</strong>so less pronounced; however,<br />
warmer surface temperatures are evident at latitudes south of<br />
the front.<br />
Comparisons of MODIS atmospheric products with other observations<br />
collocated in time and space are facilitated by speci<strong>al</strong>ized<br />
instrumentation at the Southern Great Plains (SGP) Atmospheric<br />
Radiation Measurement-Cloud and Radiation Testbed<br />
(ARM-CART) site in Oklahoma. Terra and Aqua each pass over<br />
the SGP CART site twice daily; radiosondes are launched three<br />
times each day; and observations of tot<strong>al</strong> column moisture are<br />
made by the microwave radiom<strong>et</strong>er (MWR) every 40–60 s. Addition<strong>al</strong><br />
comparisons are possible with the GOES-8 sounder<br />
[18], [19] that r<strong>et</strong>rieves TPW hourly. Comparison for 17 months<br />
of Terra MODIS infrared TPW for 80 clear-sky cases from April<br />
1 to September 1, 2002 with TPW from GOES-8 sounder, radiosondes,<br />
and MWR are presented in Fig. 5. These cases were<br />
chosen by manu<strong>al</strong> inspection to exclude any scenes with cloud<br />
contamination and with MODIS sensor zenith angle at<br />
the CART site. MODIS shows gener<strong>al</strong> agreement with <strong>al</strong>l three<br />
systems, the RMS difference b<strong>et</strong>ween MODIS and MWR TPW<br />
is 4.7 mm (compared with 1.4 mm and 1.3 mm for GOES-8<br />
and radiosondes, respectively). For dry atmospheres, MODIS<br />
overestimates the tot<strong>al</strong> column moisture; the average TPW bias<br />
(MODIS minus MWR) is approximately 3 mm for the 36 dry<br />
cases with TPW 17 mm. On average for the 44 w<strong>et</strong> cases<br />
(TPW 17 mm), the MODIS regression-based TPW r<strong>et</strong>riev<strong>al</strong>s<br />
are drier than the MWR by 5.7 mm. Thus MODIS will reduce<br />
the magnitude of a TPW gradient; non<strong>et</strong>heless, MODIS will still
KING <strong>et</strong> <strong>al</strong>.: CLOUD AND AEROSOL PROPERTIES, PRECIPITABLE WATER, AND PROFILES OF TEMPERATURE 447<br />
Fig. 4. Cross section of (a) temperature and (b) mixing ratio <strong>al</strong>ong a cross section in the southeastern United States [white line in panel (c)], which shows the<br />
therm<strong>al</strong> infrared-derived tot<strong>al</strong> precipitable water vapor for an Aqua-MODIS granule on September 4. 2002. (d) The associated GOES-8 Sounder depiction of the<br />
tot<strong>al</strong> precipitable water vapor. The white bars in (a) and (b) correspond to regions obscured by cloud.<br />
capture the sm<strong>al</strong>l-sc<strong>al</strong>e structure of spati<strong>al</strong> gradients across a<br />
front as well as the glob<strong>al</strong> changes from day to day.<br />
MODIS is producing glob<strong>al</strong> fields of temperature, moisture,<br />
and ozone. The primary v<strong>al</strong>ue of these fields lies in the<br />
depiction of fine sc<strong>al</strong>e horizont<strong>al</strong> gradients. When combined<br />
with the increased atmospheric profiling capability of high<br />
spectr<strong>al</strong> resolution infrared systems (such as the Atmospheric<br />
Infrared Sounder, AIRS), the MODIS offers improved sounding<br />
performance in cloudy conditions (by identifying sub AIRS<br />
field-of-view cloudiness) and delineates spati<strong>al</strong> gradients<br />
beyond the AIRS instrument resolution.<br />
V. AEROSOL PRODUCT<br />
The aerosol product (MOD04) is based on different <strong>al</strong>gorithms<br />
for the remote sensing of tropospheric aerosol over<br />
land [9] and ocean [25]. Both <strong>al</strong>gorithms try to match MODIS
448 IEEE TRANSACTIONS ON GEOSCIENCE AND REMOTE SENSING, VOL. 41, NO. 2, FEBRUARY 2003<br />
Fig. 5. Comparison of tot<strong>al</strong> precipitable water from MODIS therm<strong>al</strong>-infrared regression (solid circles), GOES-8 (open circles), and radiosonde (open diamonds)<br />
with the SGP ARM-CART microwave radiom<strong>et</strong>er (MWR) in millim<strong>et</strong>ers. 80 MODIS cases from April 1 to September 1, 2002 are shown in the comparison.<br />
observed reflectances to a lookup table of precomputed reflectances<br />
for a wide vari<strong>et</strong>y of commonly observed aerosol<br />
conditions, as summarized by <strong>King</strong> <strong>et</strong> <strong>al</strong>. [11]. Over land,<br />
the prime difficulty is separating the reflectance measured<br />
by the satellite into an atmospheric part and a land surface<br />
part. This difficulty is overcome by estimating the visible<br />
surface reflectance from the MODIS-measured reflectance in<br />
the shortwave infrared wavelength (2.13 m) for dark targ<strong>et</strong>s,<br />
as described by Kaufman <strong>et</strong> <strong>al</strong>. [9]. Removing the estimated<br />
surface reflectance from the tot<strong>al</strong> measured by the satellite, the<br />
atmospheric contribution is isolated by using lookup tables to<br />
d<strong>et</strong>ermine the aerosol characteristics and optic<strong>al</strong> thickness in<br />
the scene. Fin<strong>al</strong> land products include aerosol optic<strong>al</strong> thickness<br />
at 0.47, 0.56, and 0.65 m at a 10-km spati<strong>al</strong> resolution.<br />
The spectr<strong>al</strong> dependence of the reflectance across the visible<br />
wavelengths is then used to obtain a rough estimate of the<br />
fine mode (radius 0.6 m) fraction of the aerosol optic<strong>al</strong><br />
thickness at 0.56 m.<br />
The ocean <strong>al</strong>gorithm assumes that the surface reflectance<br />
contribution to the tot<strong>al</strong> reflectance is sm<strong>al</strong>l and can be c<strong>al</strong>culated<br />
from geom<strong>et</strong>ry and assumptions about the sea state<br />
[25]. The b<strong>et</strong>ter-characterized ocean surface permits the use of<br />
reflectances at six wavelengths (0.56–2.13 m) in the derivation.<br />
Again, the r<strong>et</strong>rieved aerosol products are represented<br />
by the best fits b<strong>et</strong>ween observed reflectance and the lookup<br />
table. Ocean products include aerosol optic<strong>al</strong> thickness at 0.47,<br />
0.56, 0.65, 0.86, 1.24, 1.64, and 2.13 m at a 10-km spati<strong>al</strong><br />
resolution. Using a wide spectr<strong>al</strong> range over ocean <strong>al</strong>lows the<br />
derivation of the effective radius of the particle population, and<br />
more accurate d<strong>et</strong>ermination of fine mode fraction than over<br />
land. The aerosol <strong>al</strong>gorithm is applied to cloud free conditions<br />
outside the sunglint region (glint angle 40 ) and for land<br />
surface reflectance at 2.13 m 0.25 at nadir and 0.4 at<br />
slant view directions. The comparison with the lookup table<br />
is performed for the average of the 25% to 75% pixels over<br />
the ocean and 20% to 50% over the land in order to avoid any<br />
und<strong>et</strong>ected nonaerosol contamination. A minimum of ten (12)<br />
pixels is required for the an<strong>al</strong>ysis in any 10-km region over<br />
ocean (land).<br />
Fig. 6 shows a multispectr<strong>al</strong> “true-color” composite image,<br />
associated r<strong>et</strong>rieved (0.56 m), fraction of fine mode aerosol<br />
to tot<strong>al</strong> optic<strong>al</strong> thickness at 0.56 m, and aerosol effective<br />
radius for one granule at 1535 UTC on May 4, 2001. This<br />
granule, located over the east coast of the United States, displays<br />
consistency b<strong>et</strong>ween the entirely independent land and ocean<br />
r<strong>et</strong>riev<strong>al</strong>s. Areas where the aerosol optic<strong>al</strong> thickness cannot be<br />
r<strong>et</strong>rieved due to the presence of clouds or sunglint are colored<br />
gray in Fig. 6(b). Aerosol effective radius, shown in Fig. 6(d),<br />
is only derived over oceans. The r<strong>et</strong>riev<strong>al</strong> in this granule shows<br />
the aerosol over land and near-shore coast<strong>al</strong> region to be dominated<br />
by fine mode aerosols with an effective radius 0.2 m,<br />
typic<strong>al</strong> of pollution episodes in this region [22]. Further from<br />
land the pollution gradu<strong>al</strong>ly gives way to larger aerosol, possibly<br />
a mixture with sea s<strong>al</strong>t. The accuracy of satellite estimates<br />
of aerosol optic<strong>al</strong> thickness was first suggested based on theor<strong>et</strong>ic<strong>al</strong><br />
an<strong>al</strong>yses [9], [25], and consisted of a bias of 0.05 over<br />
land and 0.03 over ocean due to uncertainty in the estimate of<br />
surface reflectance, and 0.20 over land and 0.05 over<br />
ocean due to uncertainty in the aerosol absorption and scattering<br />
phase function. The apparently low uncertainty over ocean results<br />
from the use of the wide spectr<strong>al</strong> range of MODIS to derive<br />
the aerosol size distribution.
KING <strong>et</strong> <strong>al</strong>.: CLOUD AND AEROSOL PROPERTIES, PRECIPITABLE WATER, AND PROFILES OF TEMPERATURE 449<br />
Fig. 6. Aerosol optic<strong>al</strong> properties over the Eastern United States on May 4, 2001. Panel (a) is a true color composite of one MODIS granule, showing cloud<br />
cover over northern New York, centr<strong>al</strong> Florida, and the nearby Atlantic Ocean. Panels (b) and (d) show the aerosol optic<strong>al</strong> thickness at 0.56 "m and the effective<br />
radius derived for this scene, showing pollution <strong>al</strong>ong the Ohio V<strong>al</strong>ley and transport to the north Atlantic. Panel (c) shows the ratio of fine to tot<strong>al</strong> aerosol optic<strong>al</strong><br />
thickness. Gray areas denote areas where no r<strong>et</strong>riev<strong>al</strong> is possible due to sunglint, bright land, and clouds.<br />
A number of papers describe the v<strong>al</strong>idation of MODIS aerosol<br />
products, primarily using the operation<strong>al</strong> Aerosol Robotic N<strong>et</strong>work<br />
(AERONET) sunphotom<strong>et</strong>ers [6]. Over land, Chu <strong>et</strong> <strong>al</strong>.<br />
[3] confirm the visible accuracy of<br />
and a reasonable spectr<strong>al</strong> correlation. Over ocean in nondusty<br />
regimes, Remer <strong>et</strong> <strong>al</strong>. [23] confirm that MODIS r<strong>et</strong>rieves<br />
with an accuracy , and particle effective<br />
radius within an accuracy of 0.10 m. In an oceanic dusty<br />
regime, Levy <strong>et</strong> <strong>al</strong>. [12] show similar errors in the mid-visible<br />
wavelengths, but less accuracy in d<strong>et</strong>ermining particle ra-<br />
dius, presumably due to nonsphericity effects that are not y<strong>et</strong><br />
accounted for in the lookup tables.<br />
For Aqua-MODIS, the operation<strong>al</strong> <strong>al</strong>gorithm is the same as<br />
it is for Terra-MODIS. For both Terra and Aqua, improvements<br />
have been introduced for addressing a few key issues. Over land,<br />
the reliance on dark targ<strong>et</strong>s has been relaxed so that aerosol r<strong>et</strong>riev<strong>al</strong>s<br />
will be possible over a larger land surface area having<br />
a reflectance at 2.13 m up to 0.4, as described earlier. This<br />
became possible due to an<strong>al</strong>ysis of aircraft data on the spectr<strong>al</strong><br />
properties of land surfaces from desert and nondesert re-
450 IEEE TRANSACTIONS ON GEOSCIENCE AND REMOTE SENSING, VOL. 41, NO. 2, FEBRUARY 2003<br />
Fig. 7. Water vapor over the eastern United States on June 24, 2002. Panel (a) is a f<strong>al</strong>se color composite of one Terra-MODIS granule using bands at 0.645, 0.858,<br />
and 0.469 "m, showing cloud cover over the upper Midwest and Mid-Atlantic regions of the United States. Panel (b) is tot<strong>al</strong> precipitable water derived from the<br />
cloud-free pixels over land using the near-infrared <strong>al</strong>gorithm. Panel (c) is the tot<strong>al</strong> precipitable water derived from the therm<strong>al</strong> infrared <strong>al</strong>gorithm.<br />
gions [7] and successful application to MODIS data [26]. Over<br />
ocean, an improved cirrus d<strong>et</strong>ection technique [5] has been implemented,<br />
which combines cold cloud masking, spati<strong>al</strong> coherence<br />
tests [17], and a new high cloud mask test based on the<br />
1.38- m band.<br />
VI. TOTAL PRECIPITABLE WATER PRODUCT<br />
MODIS has five near-infrared bands located within and<br />
around the 0.94- m water vapor band for remote sensing of<br />
column water vapor amounts over clear land areas and over<br />
oceanic areas with sunglint. The r<strong>et</strong>riev<strong>al</strong> <strong>al</strong>gorithm [8], [10]<br />
relies on observations of water vapor absorption of near-infrared<br />
solar radiation reflected by the bottom surface. The<br />
<strong>al</strong>gorithm uses ratios of water vapor absorbing bands (within<br />
the 0.94- m water vapor band) with atmospheric window<br />
bands at 0.86 and 1.24 m. The ratios largely remove the<br />
effects of variation of surface reflectance with wavelength for<br />
most land surfaces and result in the atmospheric water vapor<br />
transmittances. The column water vapor amount is derived from<br />
the transmittance using a table lookup procedure and applied<br />
to every 1-km pixel. The lookup tables were prec<strong>al</strong>culated<br />
using a line-by-line atmospheric transmittance code and the<br />
HITRAN2000 spectroscopic database [24]. Water vapor v<strong>al</strong>ues<br />
using the near-infrared <strong>al</strong>gorithm can be d<strong>et</strong>ermined with errors<br />
of about 7% based on comparisons with water vapor measurements<br />
using ground-based microwave radiom<strong>et</strong>ers. Systematic<br />
errors in the derived water vapor v<strong>al</strong>ues can be further reduced<br />
if the water vapor line param<strong>et</strong>ers are improved in the future.<br />
Fig. 7 shows a multispectr<strong>al</strong> image of one Terra-MODIS<br />
granule acquired over the Eastern United States at 1705 UTC<br />
on June 24, 2002. Panel (a) shows a f<strong>al</strong>se color composite constructed<br />
from bands at 0.645, 0.0.858, and 0.469 m. On this day,<br />
there was a strong gradient b<strong>et</strong>ween moist air in the southeastern
KING <strong>et</strong> <strong>al</strong>.: CLOUD AND AEROSOL PROPERTIES, PRECIPITABLE WATER, AND PROFILES OF TEMPERATURE 451<br />
United States and a band of dry air extending from centr<strong>al</strong><br />
Texas through eastern Nebraska and into southern Wisconsin.<br />
An upper-level low centered over Louisiana is associated with<br />
the moist air throughout the southeastern United States at this<br />
time. The sharp boundary b<strong>et</strong>ween this warm, moist air and the<br />
narrow streak of dry air coincides with a strong j<strong>et</strong> at 850 hPa that<br />
is transporting dry continent<strong>al</strong> air northward. High-resolution<br />
tot<strong>al</strong> precipitable water r<strong>et</strong>riev<strong>al</strong>s from MODIS can be useful<br />
in anticipating the distribution of precipitation patterns. At<br />
0000 UTC on June 25, 2002, seven hours after the MODIS<br />
overpass, rain was reported on either side of the dry line. Some<br />
precipitation was f<strong>al</strong>ling throughout the southeastern United<br />
States, including thunderstorms in Illinois and Arkansas; heavy<br />
rain was f<strong>al</strong>ling in northwestern Wisconsin and Minnesota. A<br />
distinct region without precipitation existed <strong>al</strong>ong the axis of the<br />
band of low TPW observed by MODIS.<br />
The near-infrared TPW [Fig. 7(b)] and the therm<strong>al</strong> infrared<br />
TPW [Fig. 7(c)] both depict the strong moisture gradient very<br />
well. The 5-km IR TPW tends to smooth the moisture gradient<br />
and is not generating r<strong>et</strong>riev<strong>al</strong>s in the thin and broken clouds.<br />
From the green color of the f<strong>al</strong>se color image, it is readily apparent<br />
that the surface reflectance is evident throughout the thin<br />
and broken cloud regions of the Gulf States, enabling selected<br />
clear-sky r<strong>et</strong>riev<strong>al</strong>s to be obtained with this technique using the<br />
1-km near-infrared bands. The near-infrared and therm<strong>al</strong> infrared<br />
TPW r<strong>et</strong>riev<strong>al</strong>s tend to corroborate each other; each provides<br />
unique coverage with the near-infrared 1-km product providing<br />
TPW d<strong>et</strong>ails over land and sunglint regions of the ocean<br />
during the day and the therm<strong>al</strong> infrared 5-km product providing<br />
TPW over land and ocean during both day and night under<br />
clear skies. The near-infrared TPW includes a qu<strong>al</strong>ity assurance<br />
param<strong>et</strong>er that indicates wh<strong>et</strong>her the pixel is clear or cloudy,<br />
and this cloud mask is somewhat different than the cloud mask<br />
used to filter the clear-sky in the therm<strong>al</strong> infrared <strong>al</strong>gorithm.<br />
This accounts for some of the differences in coverage of the<br />
near-infrared and therm<strong>al</strong> infrared precipitable water param<strong>et</strong>ers<br />
in Fig. 7.<br />
VII. CLOUD PRODUCT<br />
The cloud product (MOD06) <strong>al</strong>gorithm combines infrared<br />
and visible techniques to d<strong>et</strong>ermine the physic<strong>al</strong>, radiative, and<br />
microphysic<strong>al</strong> properties of clouds [21]. Cloud optic<strong>al</strong> thickness<br />
and effective radius are derived glob<strong>al</strong>ly using six visible and<br />
near-infrared bands at 1-km spati<strong>al</strong> resolution. Cloud-top properties,<br />
including cloud-top temperature, cloud-top pressure, and<br />
effective emissivity, are derived using the infrared split window<br />
and longwave CO absorption bands (both day and night) at<br />
5-km spati<strong>al</strong> resolution. Cloud thermodynamic phase is computed<br />
at 5-km resolution using a two-band <strong>al</strong>gorithm that includes<br />
an addition<strong>al</strong> therm<strong>al</strong> band at 8.55 m, and <strong>al</strong>so at 1-km<br />
resolution using a different technique based on results from the<br />
cloud mask tests followed by a bispectr<strong>al</strong> threshold test, shortwave<br />
infrared tests, and fin<strong>al</strong>ly cloud-top temperature [21]. Fin<strong>al</strong>ly,<br />
the cloud product contains a cirrus reflectance product at<br />
a visible wavelength for use in removing cirrus scattering effects<br />
from the land surface, and it utilizes an addition<strong>al</strong> band<br />
at 1.38 m. Hence, the cloud product contains many different<br />
cloud properties derived from 14 bands in tot<strong>al</strong>, and the file size<br />
is different during the night (only cloud-top properties and thermodynamic<br />
phase at 5-km resolution) than during the day (when<br />
addition<strong>al</strong> 1-km resolution products are included), as outlined in<br />
Table I.<br />
Fig. 8 shows an example of the cloud optic<strong>al</strong> thickness,<br />
cloud-top pressure, and effective radius for a daytime granule<br />
of Terra-MODIS data over the Western Pacific Ocean near the<br />
Kamchatka Peninsula on August 10, 2001 at 0025 UTC. The<br />
true color image in Fig. 8(a) shows extensive cloud cover over<br />
the Sea of Okhotsk, including mid-level and upper-level ice<br />
clouds, whereas the Bering Sea to the east of the Peninsula<br />
contains extensive marine stratocumulus clouds with numerous<br />
ship tracks in the southeastern portion of the image. Fig. 8(b)<br />
shows cloud optic<strong>al</strong> thickness; Fig. 8(c) shows cloud-top pressure;<br />
and Fig. 8(c) shows cloud effective radius, where we have<br />
used a different color sc<strong>al</strong>e for water and ice clouds in Fig. 8(b)<br />
and (d). The optic<strong>al</strong>ly thick marine stratocumulus to the east<br />
of the Peninsula are identified as water clouds with optic<strong>al</strong><br />
thicknesses (0.65 m) up to 25. The optic<strong>al</strong>ly thick ice<br />
clouds over the Sea of Okhotsk and around the southern portion<br />
of the Kamchatka Peninsula have cloud optic<strong>al</strong> thicknesses<br />
approaching 40. The ship tracks are not easily identified in the<br />
cloud optic<strong>al</strong> thickness image shown here, but they result in<br />
reduced effective radii in the microphysic<strong>al</strong> r<strong>et</strong>riev<strong>al</strong>s shown<br />
in (d). For this scene, the therm<strong>al</strong> infrared and decision tree<br />
<strong>al</strong>gorithms for deriving cloud thermodynamic phase, discussed<br />
by Platnick <strong>et</strong> <strong>al</strong>. [21], are in quite good agreement. Fin<strong>al</strong>ly,<br />
the cloud-top pressure for the cloud-filled pixels, shown in (c),<br />
clearly show that the water clouds lie predominantly b<strong>et</strong>ween<br />
700 and 850 hPa, whereas the optic<strong>al</strong>ly thick ice clouds over<br />
the Sea of Okhotsk lie at <strong>al</strong>titudes above the 500-hPa level.<br />
VIII. LEVEL-3 ATMOSPHERE PRODUCTS<br />
There are three Level-3 atmosphere products (MOD08),<br />
each covering a different time interv<strong>al</strong> (daily, eight-day,<br />
and monthly), that contain statistics derived from four<br />
Level-2 atmosphere products: aerosol (MOD04), precipitable<br />
water (MOD05), cloud (MOD06), and atmospheric profiles<br />
(MOD07). Statistics are sorted into 1 1 cells on an<br />
equ<strong>al</strong>-angle glob<strong>al</strong> grid (180 360 cells).<br />
The daily product contains roughly 600 statistic<strong>al</strong> datas<strong>et</strong>s<br />
that are derived from approximately 80 scientific param<strong>et</strong>ers<br />
from the four Level-2 products noted earlier. The eight-day and<br />
monthly products, identic<strong>al</strong> in format, are somewhat larger in<br />
size than the daily product, comprising roughly 800 statistic<strong>al</strong><br />
datas<strong>et</strong>s.<br />
For the daily product, any Level-2 granule that overlaps any<br />
part of the data day (0000 to 2400 UTC) is included in the computation<br />
of the statistics. Therefore, a particular Level-2 granule<br />
may be included in two consecutive MOD08 daily products.<br />
The eight-day product is computed by manipulating and summarizing<br />
the daily product over eight consecutive days (h<strong>al</strong>f<br />
the 16-day repeat time of the Terra and Aqua orbits). The running<br />
eight-day interv<strong>al</strong>s are res<strong>et</strong> at the beginning of each year<br />
(January 1), in concert with comparable Level-3 products produced<br />
by the oceans and land discipline groups of MODIS. The
452 IEEE TRANSACTIONS ON GEOSCIENCE AND REMOTE SENSING, VOL. 41, NO. 2, FEBRUARY 2003<br />
Fig. 8. Cloud properties over the western Pacific Ocean off the Kamchatka Peninsula on August 10, 2001. Panel (a) is a true color composite of one MODIS<br />
granule, showing marine stratocumulus clouds with ship tracks as well as upper level ice clouds. Panels (b) and (d) show the cloud optic<strong>al</strong> thickness and effective<br />
radius derived from <strong>al</strong>l cloudy pixels, where we have used a separate color bar to denote clouds processed as ice and water clouds. Panel (c) shows the cloud-top<br />
pressure for <strong>al</strong>l clouds in this scene.<br />
monthly product is computed by manipulating and summarizing<br />
the daily product over a c<strong>al</strong>endar month.<br />
There is no separation of MODIS science param<strong>et</strong>ers by orbit<br />
(ascending/descending) node; however there is a day/night<br />
separation and/or process/no process decision for a number<br />
of param<strong>et</strong>ers at both Level-2 and Level-3. All of the aerosol<br />
(MOD04) and near-infrared water vapor (MOD05) param<strong>et</strong>ers,<br />
as well as the cirrus d<strong>et</strong>ection and cloud optic<strong>al</strong> param<strong>et</strong>ers<br />
(both a subs<strong>et</strong> of MOD06) are only processed for daytime<br />
(sunlit) granules. Cloud-top properties (a subs<strong>et</strong> of MOD06) are<br />
processed for both day and night; and are separated in Level-3<br />
by daytime only, nighttime only, or combined day and night.<br />
Atmosphere profiles (MOD07) are <strong>al</strong>so processed for both day<br />
and night; but are not separated in the Level-3 product.<br />
The s<strong>et</strong> of statistic<strong>al</strong> summaries computed for each param<strong>et</strong>er<br />
depends on the param<strong>et</strong>er being considered and might include:<br />
i) simple statistics (mean, minimum, maximum, standard deviation);<br />
ii) param<strong>et</strong>ers of norm<strong>al</strong> and log-norm<strong>al</strong> distributions;<br />
iii) fraction of pixels that satisfy some condition (e.g., cloudy or<br />
clear); iv) histograms of the distribution within each grid box; v)<br />
histograms of the confidence placed in each measurement; and<br />
vi) histograms and/or regressions derived from comparing one<br />
science param<strong>et</strong>er to another. Level-3 statistics may be computed<br />
for a subs<strong>et</strong> of Level-2 pixels that satisfy some condition (e.g.,<br />
water clouds or ice clouds). Fin<strong>al</strong>ly, Level-3 statistics are computed<br />
by subsampling the Level-2 data at the resolution of the<br />
intern<strong>al</strong> Level-2 (input file) geolocation. For example, since the<br />
geolocation intern<strong>al</strong> to the MOD06 cloud product is 5 km, every<br />
MOD08 statistic derived from MOD06 (including the Qu<strong>al</strong>ity<br />
Assurance param<strong>et</strong>ers) is computed from a s<strong>et</strong> of Level-2 pixels<br />
subsampled at that resolution (about 480 pixels instead of the<br />
12 000 1-km pixels that actu<strong>al</strong>ly f<strong>al</strong>l within the 1 1 cell).
KING <strong>et</strong> <strong>al</strong>.: CLOUD AND AEROSOL PROPERTIES, PRECIPITABLE WATER, AND PROFILES OF TEMPERATURE 453<br />
In addition, histograms, joint histograms, and/or regressions<br />
derived from comparing one science param<strong>et</strong>er to another,<br />
are often computed for a subs<strong>et</strong> of observations that satisfy<br />
some condition (e.g., liquid water clouds only, ice clouds<br />
only, <strong>et</strong>c.). The 13 joint histograms defined in the Level-3<br />
atmosphere product (MOD08) are summarized in Table II. All<br />
joint histograms are derived from the cloud product (MOD06),<br />
ten of which are aggregated (separated) by cloud phase (liquid<br />
water or ice). This group of joint histograms is computed from<br />
the following param<strong>et</strong>ers:<br />
TABLE II<br />
MODIS CLOUD PARAMETERS THAT APPEAR IN JOINT HISTOGRAMS<br />
1) cloud optic<strong>al</strong> thickness;<br />
2) cloud effective particle radius;<br />
3) cloud-top temperature;<br />
4) cloud effective emissivity.<br />
In MOD08, there are five joint histograms produced for liquid<br />
water clouds and five for ice clouds, <strong>al</strong>l during the daytime.<br />
The numeric<strong>al</strong> boundaries used to bin the data vary by cloud<br />
r<strong>et</strong>riev<strong>al</strong> phase, as summarized in Table II. The remaining three<br />
joint histograms are aggregated (separated) by day/night mode<br />
(daytime, nighttime, and combined day and night), and are com-
454 IEEE TRANSACTIONS ON GEOSCIENCE AND REMOTE SENSING, VOL. 41, NO. 2, FEBRUARY 2003<br />
Fig. 9. Level-3 monthly averages of (top) cloud optic<strong>al</strong> thickness, (middle) aerosol optic<strong>al</strong> thickness, and (bottom) near-infrared precipitable water for August<br />
2001. These monthly products are produced at a 1 2 1 latitude–longitude grid worldwide.<br />
puted from the param<strong>et</strong>ers<br />
5) cloud-top pressure;<br />
6) cloud effective emissivity (cf. Table II).<br />
Although for a few param<strong>et</strong>ers the s<strong>et</strong> of pred<strong>et</strong>ermined<br />
statistics changed once (or perhaps twice) during the first<br />
2-1/2 years of MODIS data collection [Collection 001 (b<strong>et</strong>a)<br />
and Collection 003 (provision<strong>al</strong>)], the intent was to create<br />
an unbroken record of fixed (unchanging) Level-3 statistic<strong>al</strong><br />
summaries, unique to each science param<strong>et</strong>er. For Collection<br />
004, the first compl<strong>et</strong>ely v<strong>al</strong>idated s<strong>et</strong> of MODIS science<br />
data, the s<strong>et</strong> of statistic<strong>al</strong> summaries created for each science<br />
param<strong>et</strong>er will be fixed and unchanging. MODIS Collection<br />
004 processing began on November 4, 2002, where both a<br />
forward stream, as well as a reprocessing stream going back<br />
to year 2000, are being produced. This will eventu<strong>al</strong>ly create a<br />
multiyear v<strong>al</strong>idated s<strong>et</strong> of MODIS science data and a fixed s<strong>et</strong><br />
of glob<strong>al</strong> statistics.<br />
Fig. 9 (top) shows monthly mean v<strong>al</strong>ues of cloud optic<strong>al</strong><br />
thickness, (middle) aerosol optic<strong>al</strong> thickness, and (bottom)<br />
precipitable water derived from the near-infrared <strong>al</strong>gorithm<br />
over land and sunglint, for August 2001. The cloud optic<strong>al</strong><br />
thickness image is a combination of liquid water and ice cloud<br />
r<strong>et</strong>riev<strong>al</strong>s, and clearly shows greater optic<strong>al</strong> thickness <strong>al</strong>ong
KING <strong>et</strong> <strong>al</strong>.: CLOUD AND AEROSOL PROPERTIES, PRECIPITABLE WATER, AND PROFILES OF TEMPERATURE 455<br />
Fig. 10. Histogram of the joint probability of cloud optic<strong>al</strong> thickness and effective radius derived from the Level-3 joint atmosphere product for August 2001 for<br />
a region off the coast of Peru and Chile bounded by 12 –24 S and 68 –80 W. All liquid water cloud r<strong>et</strong>riev<strong>al</strong>s over ocean in this latitude–longitude box have<br />
been aggregated. The grid pattern reflects the bin boundaries in this Level-3 data product.<br />
the intertropic<strong>al</strong> convergence zone as well as at high latitudes<br />
in the northern and southern hemispheres. Fig. 9 (middle)<br />
shows the monthly mean aerosol optic<strong>al</strong> thickness over both<br />
land and ocean, except for locations where the surface is too<br />
bright to be able to r<strong>et</strong>rieve the aerosol loading (e.g., Sahara,<br />
Saudi Arabian, and K<strong>al</strong>ahari deserts, Tib<strong>et</strong>an plateau). During<br />
August the biomass burning in Angola, Zambia, and the Congo<br />
are quite striking, as are industri<strong>al</strong> emissions off China and<br />
the Indian subcontinent. In 2001 the burning season in South<br />
America was late in starting, so August is not as distinctive as<br />
later in September when the biomass burning season was in full<br />
swing. The precipitable water r<strong>et</strong>riev<strong>al</strong>s in Fig. 9 (bottom) are<br />
derived over land and sunglint regions of the cloud-free ocean<br />
during the daytime using the near-infrared <strong>al</strong>gorithm. During<br />
August there was no sunglint over the oceans for the Terra<br />
orbit at latitudes south of 23 S, hence no water vapor r<strong>et</strong>riev<strong>al</strong>s<br />
over the southern ocean. The large water vapor concentration<br />
in the tropics and humid sections of the southeastern United<br />
States and the Indian subcontinent are readily apparent. This<br />
figure compares favorably with the therm<strong>al</strong> infrared-derived<br />
precipitable water (not shown) that is derived over <strong>al</strong>l cloud-free<br />
pixels during both day and night.<br />
These displays are the equ<strong>al</strong>-area (Hammer–Aitoff) projection,<br />
which are available for viewing on the MODIS atmosphere<br />
web site (modis-atmos. gsfc.nasa.gov) <strong>al</strong>ong with other time periods,<br />
param<strong>et</strong>ers, and statistics of interest. It should be noted<br />
that the web site contains Level-3 images on both the native<br />
equ<strong>al</strong>-angle grid as well as an equ<strong>al</strong>-area grid, even though the<br />
Level-3 product contains glob<strong>al</strong> statistic<strong>al</strong> summaries on only<br />
the equ<strong>al</strong>-angle grid.<br />
In addition to mean v<strong>al</strong>ues of various param<strong>et</strong>ers, the Level-3<br />
product contains addition<strong>al</strong> statistic<strong>al</strong> properties including joint<br />
histograms of selected variables, as discussed earlier. Fig. 10<br />
shows a joint histogram of cloud optic<strong>al</strong> thickness and effective<br />
radius for liquid water clouds over ocean for a region off<br />
the Chile and Peru coast bounded by 12 –24 S and 68 –80 W<br />
for the month of August 2001. Histograms such as this are contained<br />
within the Level-3 file for <strong>al</strong>l 1 1 cells glob<strong>al</strong>ly, and<br />
are aggregated for water clouds and ice clouds separately. Note<br />
the dominance of effective radii in the range of 9–14 m, which<br />
are reasonable v<strong>al</strong>ues for the boundary layer marine stratocumulus<br />
clouds prev<strong>al</strong>ent in this region. The bin boundaries of the<br />
aggregated histogram are <strong>al</strong>so shown in this figure.<br />
IX. SUMMARY AND CONCLUSION<br />
In this paper, we have described each of the MODIS atmosphere<br />
data products, including the frequency and size of each<br />
file, and have given examples of each of these data products<br />
based on observations from the Terra and, in some cases, Aqua<br />
spacecraft. Aqua carries a similar MODIS instrument to Terra’s,<br />
but in a 1:30 P.M. ascending sun-synchronous polar orbit, rather<br />
than the 10:30 A.M. descending orbit of Terra. The same data<br />
products are produced from Aqua as from Terra, thus enabling<br />
studies of diurn<strong>al</strong> variability of cloud, aerosol, and water vapor<br />
properties. Due to differences in the performance of individu<strong>al</strong><br />
d<strong>et</strong>ectors, cross t<strong>al</strong>k, and gain s<strong>et</strong>tings, there are some subtle<br />
and not so subtle differences in sever<strong>al</strong> of the data products. Of<br />
particular significance is the known failure of many of the individu<strong>al</strong><br />
d<strong>et</strong>ectors in the 1.64- m spectr<strong>al</strong> band that makes it impossible<br />
to r<strong>et</strong>rieve cloud effective radius using this band. Otherwise,<br />
preliminary examination of the Aqua products shows a<br />
similar accuracy to the Terra data products. Therefore, the experience<br />
in the precise characterization of the MODIS spectr<strong>al</strong><br />
bands on Terra that was achieved after the first year of operation<br />
yielded similar precision on the Aqua spacecraft after only<br />
three months in orbit. The location of sunglint is considerably<br />
different in the afternoon orbit, so the areas of the ocean that<br />
are impossible to r<strong>et</strong>rieve water vapor concentration from using<br />
the near-infrared bands (like the southern oceans during August
456 IEEE TRANSACTIONS ON GEOSCIENCE AND REMOTE SENSING, VOL. 41, NO. 2, FEBRUARY 2003<br />
2001, as shown in the bottom image of Fig. 9) will now move<br />
to the Northern Hemisphere. Hence, b<strong>et</strong>ween Terra and Aqua it<br />
should be possible to obtain high spati<strong>al</strong> resolution precipitable<br />
water vapor concentrations glob<strong>al</strong>ly.<br />
All data produced by the <strong>al</strong>gorithms described in this paper<br />
are available from the Goddard Distributed Active Archive<br />
Center, and may be ordered via the EOSDIS Data Gateway 2<br />
or Terra WHOM. 3 Quicklook images of <strong>al</strong>l Level-1B true<br />
color and Level-3 data products are available from the MODIS<br />
atmosphere Web site. 4 In addition, this site contains software<br />
tools for locating granules, doing spati<strong>al</strong> subs<strong>et</strong>ting, and<br />
visu<strong>al</strong>izing various scientific datas<strong>et</strong>s; extensive references and<br />
descriptions of the <strong>al</strong>gorithms used to process the data; and<br />
c<strong>al</strong>endars of data availability.<br />
ACKNOWLEDGMENT<br />
The authors are grateful to E. G. Moody, M. A. Gray, R. A.<br />
Frey, L. E. Gumley, S. Matoo, R. R. Li, X. Liang, B. A. Baum,<br />
J. C. Riédi, S. W. Seemann, J. Li, and R. Hucek for software<br />
engineering, design, visu<strong>al</strong>ization, testing, and implementation<br />
of the MODIS atmosphere <strong>al</strong>gorithms described in this paper.<br />
REFERENCES<br />
[1] S. A. Ackerman, K. I. Strab<strong>al</strong>a, W. P. Menzel, R. A. Frey, C. C. Moeller,<br />
and L. E. Gumley, “Discriminating clear sky from clouds with MODIS,”<br />
J. Geophys. Res., vol. 103, pp. 32 141–32 157, 1998.<br />
[2] W. L. Barnes, T. S. Pagano, and V. V. S<strong>al</strong>omonson, “Prelaunch<br />
characteristics of the Moderate Resolution Imaging Spectroradiom<strong>et</strong>er<br />
(MODIS) on EOS-AM1,” IEEE Trans. Geosci. Remote Sensing, vol.<br />
36, pp. 1088–1100, July 1998.<br />
[3] D. A. Chu, Y. J. Kaufman, C. Ichoku, L. A. Remer, D. Tanré, and B.<br />
N. Holben, “V<strong>al</strong>idation of MODIS aerosol optic<strong>al</strong> depth r<strong>et</strong>riev<strong>al</strong> over<br />
land,” Geophys. Res. L<strong>et</strong>t., vol. 29, no. 12, 2002.<br />
[4] S. Hannon, L. L. Strow, and W. W. McMillan, “Atmospheric infrared<br />
fast transmittance models: A comparison of two approaches,” in Proc.<br />
SPIE Conf. 2830, Optic<strong>al</strong> Spectrosc. Techniques and Instrumentation for<br />
Atmos. and Space Res. II, 1996.<br />
[5] B.-C. Gao, Y. J. Kaufman, D. Tanré, and R.-R. Li, “Distinguishing tropospheric<br />
aerosols from thin cirrus clouds for improved aerosol r<strong>et</strong>riev<strong>al</strong>s<br />
using the ratio of 1.38-"m and 1.24 "m channels,” Geophys. Res. L<strong>et</strong>t.,<br />
vol. 29, no. 12, 2002.<br />
[6] B. N. Holben, T. F. Eck, I. Slutsker, D. Tanré, J. P. Buis, A. S<strong>et</strong>zer,<br />
E. Vermote, J. A. Reagan, Y. J. Kaufman, T. Nakajima, F. Lavenu, I.<br />
Jankowiak, and A. Smirnov, “AERONET—A federated instrument n<strong>et</strong>work<br />
and data archive for aerosol characterization,” Remote Sens. Environ.,<br />
vol. 66, pp. 1–16, 1998.<br />
[7] A. Karnieli, Y. J. Kaufman, L. Remer, and A. W<strong>al</strong>d, “AFRI—Aerosol<br />
free veg<strong>et</strong>ation index,” Remote Sens. Environ., vol. 77, pp. 10–21, 2001.<br />
[8] Y. J. Kaufman and B. C. Gao, “Remote sensing of water vapor in the<br />
near IR from EOS/MODIS,” IEEE Trans. Geosci. Remote Sensing, vol.<br />
30, pp. 871–884, Sept. 1992.<br />
[9] Y. J. Kaufman, D. Tanré, L. A. Remer, E. F. Vermote, A. Chu, and B. N.<br />
Holben, “Operation<strong>al</strong> remote sensing of tropospheric aerosol over land<br />
from EOS moderate resolution imaging spectroradiom<strong>et</strong>er,” J. Geophys.<br />
Res., vol. 102, pp. 17051–17 067, 1997.<br />
[10] M. D. <strong>King</strong>, Y. J. Kaufman, W. P. Menzel, and D. Tanré, “Remote<br />
sensing of cloud, aerosol, and water vapor properties from the Moderate<br />
Resolution Imaging Spectrom<strong>et</strong>er (MODIS),” IEEE Trans. Geosci.<br />
Remote Sensing, vol. 30, pp. 2–27, Jan. 1992.<br />
[11] M. D. <strong>King</strong>, Y. J. Kaufman, D. Tanré, and T. Nakajima, “Remote sensing<br />
of tropospheric aerosols from space: Past, present, and future,” Bull.<br />
Amer. M<strong>et</strong>eorol. Soc., vol. 80, pp. 2229–2259, 1999.<br />
2 redhook.gsfc.nasa.gov/~imswww/pub/imswelcome<br />
3 daac.gsfc.nasa.gov/data<br />
4 modis-atmos.gsfc.nasa.gov<br />
[12] R. C. Levy, L. A. Remer, D. Tanré, Y. J. Kaufman, C. Ichoku, B. N.<br />
Holben, J. M. Livingston, P. B. Russell, and H. Maring, “Ev<strong>al</strong>uation of<br />
the MODIS r<strong>et</strong>riev<strong>al</strong>s of dust aerosol over the ocean during PRIDE,” J.<br />
Geophys. Res., 2003, to be published.<br />
[13] J. Li and H. L. Huang, “R<strong>et</strong>riev<strong>al</strong> of atmospheric profiles from satellite<br />
sounder measurements by use of the discrepancy principle,” Appl. Opt.,<br />
vol. 38, pp. 916–923, 1999.<br />
[14] J. Li, C. C. Schmidt, J. P. Nelson, T. J. Schmit, and W. P. Menzel,<br />
“Estimation of tot<strong>al</strong> atmospheric ozone from GOES sounder radiances<br />
with high tempor<strong>al</strong> resolution,” J. Atmos. Oceanic Technol., vol. 2, pp.<br />
157–168, 2001.<br />
[15] J. Li, W. W. Wolf, W. P. Menzel, W. J. Zhang, H. L. Huang, and T. H.<br />
Achtor, “Glob<strong>al</strong> soundings of the atmosphere from ATOVS measurements:<br />
The <strong>al</strong>gorithm and v<strong>al</strong>idation,” J. Appl. M<strong>et</strong>eorol., vol. 39, pp.<br />
1248–1268, 2000.<br />
[16] X. L. Ma, T. J. Schmit, and W. L. Smith, “A nonlinear physic<strong>al</strong> r<strong>et</strong>riev<strong>al</strong><br />
<strong>al</strong>gorithm—Its application to the GOES-8/9 sounder,” J. Appl. M<strong>et</strong>eorol.,<br />
vol. 38, pp. 501–513, 1999.<br />
[17] J. V. Martins, D. Tanré, L. A. Remer, Y. J. Kaufman, S. Mattoo, and<br />
R. Levy, “MODIS cloud screening for remote sensing of aerosol over<br />
oceans using spati<strong>al</strong> variability,” Geophys. Res. L<strong>et</strong>t., vol. 29, no. 12,<br />
2002.<br />
[18] W. P. Menzel and J. F. W. Purdom, “Introducing GOES-I: The 1st of a<br />
new-generation of geostationary operation<strong>al</strong> environment<strong>al</strong> satellites,”<br />
Bull. Amer. M<strong>et</strong>eorol. Soc., vol. 75, pp. 757–781, 1994.<br />
[19] W. P. Menzel, F. C. Holt, T. J. Schmit, R. M. Aune, A. J. Schreiner, G.<br />
S. Wade, and D. G. Gray, “Application of the GOES-8/9 soundings to<br />
weather forecasting and nowcasting,” Bull. Amer. M<strong>et</strong>eorol. Soc., vol.<br />
79, pp. 2059–2077, 1998.<br />
[20] C. L. Parkinson and R. Greenstone. (2000) EOS Data Products Handbook.<br />
NASA Goddard Space Flight Center, Greenbelt, MD. [Online]<br />
eospso.gsfc.nasa.gov. NP-2000-5-055-GSFC.<br />
[21] S. Platnick, M. D. <strong>King</strong>, S. A. Ackerman, W. P. Menzel, B. A. Baum, J.<br />
C. Riédi, and R. A. Frey, “The MODIS cloud products: Algorithms and<br />
examples from Terra,” IEEE Trans. Geosci. Remote Sensing, vol. 41, pp.<br />
459–473, Feb. 2003.<br />
[22] L. A. Remer, Y. J. Kaufman, and B. N. Holben, “Interannu<strong>al</strong> variation of<br />
ambient aerosol characteristics on the east coast of the United States,”<br />
J. Geophys. Res., vol. 104, pp. 2223–2232, 1999.<br />
[23] L. A. Remer, D. Tanré, Y. J. Kaufman, C. Ichoku, S. Mattoo, R. Levy,<br />
D. A. Chu, B. N. Holben, O. Dubovik, A. Smirnov, J. V. Martins, R. R.<br />
Li, and Z. Ahmad, “V<strong>al</strong>idation of MODIS aerosol r<strong>et</strong>riev<strong>al</strong> over ocean,”<br />
Geophys. Res. L<strong>et</strong>t., vol. 29, no. 12, 2002.<br />
[24] L. S. Rothman, C. P. Rinsland, A. Goldman, S. T. Messie, D. P.<br />
Edwards, J. M. Flaud, A. Perri, C. Camy-Peyr<strong>et</strong>, V. Dana, J. Y. Mandin,<br />
J. Schroeder, A. McCann, R. R. Gamach, R. B. Wattson, K. Yoshino, K.<br />
V. Chance, K. W. Jucks, L. R. Brown, V. Nemtchinov, and P. Varanasi,<br />
“The HITRAN molecular spectroscopic database and HAWKS (HI-<br />
TRAN Atmospheric Workstation): 1996 edition,” J. Quant. Spectrosc.<br />
Radiat. Transfer, vol. 60, pp. 665–710, 1998.<br />
[25] D. Tanré, Y. J. Kaufman, M. Herman, and S. Mattoo, “Remote sensing<br />
of aerosol properties over oceans using the MODIS/EOS spectr<strong>al</strong> radiances,”<br />
J. Geophys. Res., vol. 102, pp. 16 971–16988, 1997.<br />
[26] E. F. Vermote, N. Z. El S<strong>al</strong>eous, and C. O. Justice, “Atmospheric correction<br />
of MODIS data in the visible to middle infrared: First results,”<br />
Remote Sens. Environ., vol. 83, pp. 97–111, 2002.<br />
Michael D. <strong>King</strong> (M’01) received the B.A. degree in<br />
physics from Colorado College, Colorado Springs, in<br />
1971, and the M.S. and Ph.D. degrees in atmospheric<br />
sciences from the University of Arizona, Tucson, in<br />
1973 and 1977, respectively.<br />
In January 1978, he joined NASA Goddard Space<br />
Flight Center and is currently Senior Project Scientist<br />
of NASA’s Earth Observing System (EOS), a position<br />
he has held since 1992. He is a member of the<br />
MODIS Science Team where he has primary responsibility<br />
for developing the cloud optic<strong>al</strong> and microphysic<strong>al</strong><br />
property and Level-3 <strong>al</strong>gorithms. His research experience includes conceiving,<br />
developing, and operating multispectr<strong>al</strong> scanning radiom<strong>et</strong>ers from a<br />
number of aircraft platforms in field experiments ranging from arctic stratus<br />
clouds to smoke from the Kuwait oil fires in the Persian Gulf and biomass<br />
burning in Brazil and southern Africa.<br />
Dr. <strong>King</strong> is a member of the U.S. Nation<strong>al</strong> Academy of Engineering.
KING <strong>et</strong> <strong>al</strong>.: CLOUD AND AEROSOL PROPERTIES, PRECIPITABLE WATER, AND PROFILES OF TEMPERATURE 457<br />
W. Paul Menzel received the B.S. degree in physics<br />
from the University of Maryland, College Park, in<br />
1967, and the M.S. and Ph.D. degrees in theor<strong>et</strong>ic<strong>al</strong><br />
solid-state physics from the University of Wisconsin,<br />
Madison, in 1968 and 1974, respectively.<br />
In 1975, he joined the Space Science and Engineering<br />
Center, University of Wisconsin, where he<br />
was among the first to explore the possibilities for<br />
remote sensing of earth’s atmosphere from a geosynchronous<br />
satellite. In 1983, he joined the Nation<strong>al</strong><br />
Oceanic and Atmospheric Administration Nation<strong>al</strong><br />
Environment<strong>al</strong> Satellite, Data, and Information Service (NOAA/NESDIS)<br />
to head the Advanced Satellite Products Project, where he was responsible<br />
for the development, testing, and ev<strong>al</strong>uation of procedures for deriving new<br />
atmospheric products from spaceborne observations, and <strong>al</strong>ong with their<br />
transfer from the research laboratory to the operation<strong>al</strong> weather forecaster. He<br />
is currently the Chief Scientist of the Office of Research and Applications of<br />
NOAA/NESDIS. He is <strong>al</strong>so a member of the MODIS Science Team, where<br />
he has primary responsibility for <strong>al</strong>gorithms to derive cloud-top properties,<br />
atmospheric profiles, and column water vapor using infrared bands on MODIS.<br />
Yoram J. Kaufman received the B.S. and M.S. degrees<br />
in physics from the Technion—Israel Institute<br />
of Technology, Haifa, Israel, in 1972 and 1974, respectively,<br />
and the Ph.D. degree from Tel-Aviv University,<br />
Tel-Aviv, Israel, in 1979.<br />
He came to NASA Goddard Space Flight Center,<br />
Greenbelt, MD, in 1979 as an NRC Resident<br />
Research Associate. He is currently an Atmospheric<br />
Scientist in the Laboratory for Atmospheres, NASA<br />
Goddard Space Flight Center. His present research<br />
includes theor<strong>et</strong>ic<strong>al</strong> and experiment<strong>al</strong> investigations<br />
in atmospheric science, radiative transfer, and remote sensing. His research<br />
experience includes remote sensing of aerosols and clouds, atmospheric correction<br />
of satellite imagery of the earth’s surface, interaction of aerosols with<br />
clouds and their subsequent impact on climate, remote sensing of emissions<br />
from biomass burning in the topics, and c<strong>al</strong>ibration of satellite sensors. He is a<br />
member of the MODIS Science Team, where he has primary responsibility for<br />
the remote sensing of tropospheric aerosol properties over land surfaces and<br />
served as Project Scientist of Terra from 1996 to 2000.<br />
Didier Tanré received the M.S. degree in physics in<br />
1975 and the “Thèse de 3ème Cycle” and “Doctorat<br />
d’Etat” in atmospheric physics in 1977 and 1982,<br />
respectively, <strong>al</strong>l from the Université des Sciences <strong>et</strong><br />
Technologies de Lille, Villeneuve d’Ascq, France<br />
He is an atmospheric scientist in the Centre<br />
Nation<strong>al</strong> de la Recherche Scientifique (CNRS),<br />
collocated with the Laboratoire d’Optique Atmosphérique,<br />
Université des Sciences <strong>et</strong> Technologies<br />
de Lille, Villeneuve d’Ascq, France, where he<br />
has been a Research Scientist since 1982. He is a<br />
member of the MODIS Science Team, where he has primary responsibility<br />
for remote sensing of tropospheric aerosol over the ocean. He is currently the<br />
Director of the Laboratoire d’Optique Atmosphérique, Université des Sciences<br />
<strong>et</strong> Technologies de Lille.<br />
Bo-Cai Gao received the B.S. degree in physics<br />
from Nankai University, Tianjin, China, in 1982,<br />
and the M.S. and Ph.D. degrees in physics from The<br />
Ohio State University, Columbus, in 1984 and 1988,<br />
respectively.<br />
He is currently with the Remote Sensing Division,<br />
Nav<strong>al</strong> Research Laboratory, Washington, DC. He has<br />
been a member of the MODIS Science Team since<br />
1996, where his focus is on the remote sensing of<br />
cirrus clouds, atmospheric water vapor, and coast<strong>al</strong><br />
water.<br />
Dr. Gao received a Prize Paper Award from the IEEE Geoscience and Remote<br />
Sensing Soci<strong>et</strong>y (IGARSS) in 1991 for his development of an operation<strong>al</strong><br />
atmospheric radiative transfer code to r<strong>et</strong>rieve surface reflectance spectra from<br />
hyperspectr<strong>al</strong> imaging data measured with the NASA/JPL Airborne Visible/Infrared<br />
Imaging Spectrom<strong>et</strong>er (AVIRIS).<br />
Steven Platnick received the B.S. degree in electric<strong>al</strong><br />
engineering from Duke University, Durham, NC, in<br />
1979, the M.S. degree in electric<strong>al</strong> engineering from<br />
the University of C<strong>al</strong>ifornia, Berkeley, in 1980, and<br />
the Ph.D. degree in atmospheric sciences from the<br />
University of Arizona, Tucson, in 1991.<br />
He has worked in collaboration with NASA<br />
Goddard Space Flight Center, Greenbelt, MD, since<br />
1993, most recently as a member of the Laboratory<br />
for Atmospheres and prior to that as a Research<br />
Associate Professor with the Joint Center for Earth<br />
Systems Technology, University of Maryland—B<strong>al</strong>timore County, B<strong>al</strong>timore,<br />
from 1996-2002. He was a Nation<strong>al</strong> Research Council Resident Research<br />
Associate at NASA Ames Research Center, Moff<strong>et</strong>t Field, CA from 1991 to<br />
1993 and held engineering positions at Hewl<strong>et</strong>t-Packard Co., Santa Rosa, CA<br />
from 1981-1987. His research experience includes theor<strong>et</strong>ic<strong>al</strong> and experiment<strong>al</strong><br />
studies of satellite, aircraft, and ground-based cloud remote sensing, including<br />
applications to MODIS. He is an Associate Member of the MODIS Science<br />
Team.<br />
Steven A. Ackerman received the Ph.D. degree in atmospheric<br />
sciences from Colorado State University,<br />
Fort Collins, in 1987.<br />
He joined the faculty of the Department of<br />
Atmospheric and Oceanic Sciences, University<br />
of Wisconsin, Madison, in 1992, where he is<br />
currently a Professor. He is <strong>al</strong>so the Director of the<br />
Cooperative Institute for M<strong>et</strong>eorologic<strong>al</strong> Satellite<br />
Studies, Madison, WI, a position he has held since<br />
1999. He is an Associate Member of the MODIS<br />
Science Team where he has primary responsibility<br />
for the MODIS cloud mask <strong>al</strong>gorithm. His research experience includes remote<br />
sensing, radiative transfer, earth radiation budg<strong>et</strong>s, cloud radiative param<strong>et</strong>erizations,<br />
climate change, and aerosol studies. In addition to his participation in<br />
the MODIS Science Team, he is responsible for the cloud mask <strong>al</strong>gorithm on<br />
the Glob<strong>al</strong> Imager (GLI), a sensor on Japan’s ADEOS II spacecraft.
458 IEEE TRANSACTIONS ON GEOSCIENCE AND REMOTE SENSING, VOL. 41, NO. 2, FEBRUARY 2003<br />
Lorraine A. Remer received the B.S. degree in atmospheric<br />
science from the University of C<strong>al</strong>ifornia,<br />
Davis, in 1980, the M.S. degree in oceanography<br />
from the Scripps Institution of Oceanography,<br />
University of C<strong>al</strong>ifornia, San Diego, in 1983, and<br />
the Ph.D. degree, <strong>al</strong>so in atmospheric science from<br />
the University of C<strong>al</strong>ifornia, Davis, in 1991.<br />
She became involved with the MODIS r<strong>et</strong>riev<strong>al</strong>s of<br />
atmospheric aerosols in 1991, first as a Research Scientist<br />
with Science Systems and Applications, Inc.,<br />
and subsequently with the Nation<strong>al</strong> Aeronautics and<br />
Space Administration, which she joined in 1998. She is an Associate Member<br />
of the MODIS Science Team and a Member of the Glob<strong>al</strong> Aerosol Climatology<br />
Project Science Team. Her current research interests are the climatic effects and<br />
remote sensing of atmospheric aerosol. She has been involved in sever<strong>al</strong> field<br />
campaigns including the Smoke/Sulfate, Clouds, and Radiation (SCAR) experiments,<br />
the Tropospheric Aerosol Radiative Forcing Observation<strong>al</strong> Experiment<br />
(TARFOX), the Israeli Desert Transition Zone Experiment, and the Puerto Rico<br />
Dust Experiment (PRiDE).<br />
Robert Pincus received the Ph.D. degree in atmospheric<br />
sciences from the University of Washington,<br />
Seattle, in 1994.<br />
He came to NASA Goddard Space Flight Center,<br />
Greenbelt, MD, in 1994 as an NRC Resident<br />
Research Associate, where he worked until joining<br />
the University of Wisconsin, Madison, as a Visiting<br />
Professor in 1998. He is currently a Research<br />
Scientist with the Climate Diagnostics Center,<br />
Nation<strong>al</strong> Oceanic and Atmospheric Administration,<br />
Cooperative Institute for Research in Environment<strong>al</strong><br />
Studies, Boulder, CO. His research experience includes clouds as they relate<br />
to earth’s radiation budg<strong>et</strong> and climate, including descriptions and simple<br />
models of horizont<strong>al</strong> and vertic<strong>al</strong> structure, m<strong>et</strong>hods of remote sensing, and<br />
the representation of clouds in climate models. He designed the fundament<strong>al</strong><br />
architecture behind the MODIS Level-3 joint atmosphere tile and daily<br />
products.<br />
Paul A. Hubanks received the B.S. degree in<br />
mathematics from the University of Georgia,<br />
Athens, in 1979, and compl<strong>et</strong>ed two years in the<br />
M.S. m<strong>et</strong>eorology program at Pennsylvania State<br />
University, University Park, from 1979 to 1981.<br />
He has more than 20 years’ experience in<br />
satellite and aircraft data an<strong>al</strong>ysis and ev<strong>al</strong>uation,<br />
solar and terrestri<strong>al</strong> research, scientific <strong>al</strong>gorithm<br />
development and verification, software design–development–maintenance,<br />
data visu<strong>al</strong>ization, data<br />
an<strong>al</strong>ysis, and data management. In addition, he is<br />
an expert in designing and engineering state-of-the-art World Wide Web sites<br />
and optimizing graphics and image data for the Web, including the MODIS<br />
Atmosphere Web site.