ERAD 2002
ERAD 2002
ERAD 2002

Create successful ePaper yourself
Turn your PDF publications into a flip-book with our unique Google optimized e-Paper software.
Proceedings of <strong>ERAD</strong> (<strong>2002</strong>): 206–211 c○ Copernicus GmbH <strong>2002</strong><br />
<strong>ERAD</strong> <strong>2002</strong><br />
Determination of quality–controlled three–dimensional wind–vector<br />
fields using a bistatic Doppler radar<br />
K. Friedrich and M. Hagen<br />
Institut für Physik der Atmosphäre, DLR Oberpfaffenhofen, 82230 Wessling, Germany<br />
Abstract. Horizontal wind–vector fields can be measured<br />
in real–time by a bistatic Doppler radar network and can be<br />
applied directly for hazard warnings and weather surveillance.<br />
But most applications especially for meteorological<br />
research and operational meteorology require quality–<br />
controlled wind–fields. Therefore, a quality–control scheme<br />
is developed which includes algorithms to determine the data<br />
quality by measured or fixed parameters. The algorithms are<br />
applied in the fuzzy logic sense weighting the quality of wind<br />
measurement with values ranging from one to zero. The results<br />
of each weighting algorithm are merged to an average<br />
quality–index field which represents the confidence of each<br />
horizontal wind measurement. This averaged field is available<br />
together with the measured horizontal wind–vector field<br />
for further applications. An overview about the determination<br />
and the quality control of three–dimensional wind–fields<br />
is presented for two frontal passages with stratiform precipitation<br />
and a convective situation.<br />
1 Motivation<br />
The bistatic Doppler radar system is an instrument capable of<br />
measuring simultaneously several components of the wind–<br />
vector which can be combined to a horizontal wind–vector<br />
field in real–time (Wurman et al., 1993). Several receivers<br />
separated spatially from the transmitter are implemented<br />
around the monostatic Doppler radar. Temporally and spatially<br />
high–resolution horizontal wind–vector fields are superior<br />
to one–dimensional radial Doppler velocity fields especially<br />
for detection of wind signatures for hazard warnings<br />
at airports, around populated areas, and for regional weather<br />
surveillance. Horizontal wind–vector fields are better and<br />
faster to interpret by everybody than one–dimensional radial<br />
Doppler velocity fields. But horizontal wind–fields can<br />
also be used for diagnostic research studies, now–casting of<br />
regional weather phenomena, and assimilation into numeri-<br />
Correspondence to: K. Friedrich (Katja.Friedrich@dlr.de)<br />
cal weather prediction models. For those application especially<br />
for operational usage, the confidence of the horizontal<br />
wind field estimation has to be analyzed by an automatically–<br />
working quality–control scheme. In this paper elements of<br />
the quality–control scheme are introduced which considers<br />
the signal quality, the influence of fixed parameters, the probability<br />
of contamination induced by the weather situation,<br />
and the data consistency in time and space.<br />
2 The bistatic Doppler radar network<br />
The bistatic Doppler radar network in Oberpfaffenhofen<br />
(OP) consists of the monostatic polarimetric Doppler radar<br />
system, POLDIRAD (Schroth et al., 1988), and three bistatic<br />
receivers at remote sites each containing both at least one antenna<br />
and a signal processor. In Fig. 1, the location of the<br />
three bistatic receivers and the respective look angles of the<br />
bistatic antennas are illustrated. The investigation area, indicated<br />
schematically, is restricted by the received power pattern<br />
of the bistatic antenna, which has a horizontal angular<br />
aperture covering about −30 ◦ to 30 ◦ . The horizontal antenna<br />
aperture together with range arcs are exhibited in Fig. 1 for<br />
each bistatic antenna.<br />
Both receiver systems at Lagerlechfeld and Lichtenau are<br />
equipped with two antennas each, which have a vertical angular<br />
aperture covering 1 ◦ to 9 ◦ for measurements within the<br />
boundary layer and 1 ◦ to 23 ◦ for measuring thunderstorms,<br />
respectively. At Ried, one antenna having a vertical aperture<br />
of 8 ◦ has been installed. At the moment, the bistatic<br />
radar network at OP covers an area of about 50 km × 50 km.<br />
Within this area, horizontal wind–fields are determined exactly<br />
in the dual–Doppler area (in Fig. 1 hatched) and overdetermined<br />
in triple–/quadruple–Doppler areas (in Fig. 1 cross–<br />
hatched).<br />
Due to a limited vertical antenna aperture of 8 ◦ oriented<br />
close to the ground, the measured wind components are<br />
dominated by the horizontal components u, v. As a result,<br />
these measurements are used only to determine the horizon-
K. Friedrich and M. Hagen: Vector fields using a bistatic Doppler radar 207<br />
= C A H A ? D B A @<br />
4 E A @<br />
E ? D J A = K<br />
<br />
+ 0 - <br />
> A H F B = B B A D B A <br />
<br />
! <br />
, K = , F F A H<br />
6 H E F A , F F A H<br />
" , F F A H<br />
Fig. 1. Map of the bistatic multiple-Doppler radar network at the<br />
DLR in OP consisting of POLDIRAD and three bistatic receivers<br />
located at Lichtenau, Lagerlechfeld, and Ried. The investigation<br />
area is restricted by the horizontal antenna aperture of the bistatic<br />
antennas. The equation system to calculated the horizontal wind–<br />
field is exactly determined in the dual-Doppler areas (hatched) and<br />
overdetermined in the triple- or quadruple–Doppler areas (crosshatched).<br />
More explanations in the text.<br />
tal wind–vector field directly. The vertical component, w, is<br />
retrieved by means of a variational analysis method (Protat<br />
and Zawadzki, 1999).<br />
3 The quality–control scheme<br />
" <br />
# <br />
3.1 The decision criterion based on the signal quality<br />
At the remote receiver the velocity–power spectrum is obtained.<br />
The power, Doppler velocity, and normalized coherent<br />
power 1 (NCP) are transfered to the central hub computer<br />
located at OP, where the data of all receivers is collected, the<br />
horizontal wind–field is determined and quality–controlled.<br />
At the central bistatic hub computer, first data with large<br />
velocity dispersion and low reflectivity factors are rejected<br />
using an empirically chosen threshold of NCP ≤ 0.3.<br />
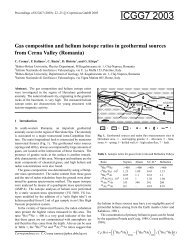
As an example of applying the NCP criterion on measured<br />
data, Fig. 2 presents a horizontal cross–section at 1.6 km<br />
above MSL of the horizontal wind–vector field superimposed<br />
on the bistatic reflectivity factor, Zb, measured by the bistatic<br />
receiver Lagerlechfeld. In Figure 2a the NCP criterion is not<br />
applied, while in Fig. 2b noisy data is removed using the NCP<br />
criterion.<br />
3.2 The quality–index fields<br />
The following algorithms are applied in the fuzzy logic sense<br />
weighting the quality with values ranging from zero to one.<br />
The results of each weighting algorithm can be merged to<br />
1 Index related inversely to the spectral width ranging from zero<br />
to one (for more details see (Friedrich, <strong>2002</strong>)).<br />
Zb[dBZ] (a) Zb[dBZ] (b)<br />
Fig. 2. Horizontal cross–section at 1.6 km above MSL of the horizontal<br />
wind in m s −1 (arrows) underlaid by the bistatic reflectivity<br />
factor field, Zb, in dBZ measured by the receiver Lagerlechfeld on<br />
2 February 2000 at 17:08 UTC (a) without applying the NCP criterion<br />
and (b) with applying the NCP criterion on the measured data.<br />
The horizontal wind–vector is determined by using the Doppler velocity<br />
sampled by receivers Lagerlechfeld and OP.<br />
achieve an average quality–control field which reflects the<br />
confidence of each horizontal wind measurement. All thresholds<br />
are set empirically.<br />
In the following sections, three quality–index fields are defined<br />
according to: (1) the accuracy of the horizontal wind–<br />
field depending on the location of transmitter, target, and<br />
); (2) the probability of side-<br />
receiver, denoted as F (σ ′ |Vh|<br />
lobe contamination, denoted as F (∇Z); and (3) the fractional<br />
uncertainty of the wind–field measurement, denoted<br />
as F (σ ′ |Vh| /|Vh|). Note that the standard deviation of the<br />
horizontal wind–field, induced by the position of transmitter,<br />
target, and receivers, is fixed for a chosen experimental<br />
setup.<br />
The influence of each quality–index field on the average<br />
quality–index field can be chosen according to<br />
the application of those quality–controlled wind–vectors<br />
and the weather situation with the respective weights<br />
W F (σ ′<br />
|V h | ), W F (∇Z), and W F (σ ′<br />
|V h | /|Vh|). W F (vr/vt). The<br />
quality fields can then be averaged to a single quality field<br />
using<br />
¯F = 1<br />
<br />
C<br />
where<br />
W F (σ ′ |Vh |)F (σ ′ |Vh|) + W F (∇Z)F (∇Z) +<br />
W F (σ ′<br />
|V h | /|Vh|)F (σ ′ |Vh| /|Vh|)<br />
C = W F (σ ′ |Vh |) + W F (∇Z) + W F (σ ′<br />
|V h | /|Vh|)<br />
<br />
, (1)<br />
Each quality–index field and the average index field range<br />
between zero and one.<br />
3.2.1 Utilizing geometrical accuracy<br />
The horizontal wind–field is determined by the velocity components<br />
measured by the monostatic and bistatic receiver.<br />
.
208 K. Friedrich and M. Hagen: Vector fields using a bistatic Doppler radar<br />
Fig. 3. Horizontal cross–section at ground level of the quality–index<br />
field F (σ ′ |V h|) for the bistatic dual–Doppler radar system consisting<br />
of OP and Lagerlechfeld.<br />
The standard deviation of the horizontal wind–field depends<br />
on the intersection angle between the two velocity components.<br />
The highest accuracy is achieved at an intersection<br />
angle of about 50 ◦ . Horizontal wind–fields can not be determined<br />
at intersection angles of 0 ◦ and 90 ◦ , respectively<br />
(Friedrich, <strong>2002</strong>). The standard deviation of the horizontal<br />
wind–field can be expressed by the quality–index field<br />
F (σ ′ |Vh|). Only the geometrical location of transmitter, receiver,<br />
and target is considered.<br />
For a dual–Doppler radar system, the highest accuracy<br />
in the horizontal wind–field determination is expressed by<br />
F (σ ′ |Vh|) = 1 at min(σ ′ |Vh|) and lowest accuracy by<br />
F (σ ′ |Vh|) = 0. Due to the infinity of σ ′ |Vh| close to the baseline,<br />
the upper limit of σ ′ |Vh| (max(σ ′ |Vh|) has to be chosen<br />
empirically. For a bistatic dual–Doppler radar system, the<br />
standard deviation reaches its minimum at a intersection angle<br />
of about 50 ◦ with min(σ ′ |Vh|) = 2.42, and max(σ ′ |Vh| )<br />
set empirically to 5.0 (the values are normalized by the standard<br />
deviation of Doppler velocity measurement achieved by<br />
a monostatic radar which is assumed to be 1 m s −1 ). The<br />
definition of F (σ ′ |Vh|) is given by<br />
F (σ ′ |Vh|) =<br />
max(σ′ |Vh|) − σ ′ |Vh|<br />
max(σ ′ |Vh|) − min(σ ′ . (2)<br />
|Vh|)<br />
A horizontal cross–section of the distribution of the<br />
quality–index field F (σ ′ |Vh|) for the bistatic dual–Doppler<br />
radar system (POLDIRAD + Lagerlechfeld) is shown in<br />
Fig. 3.<br />
3.2.2 Utilizing signal quality based on the reflectivity gradient<br />
In this section, the probability of contamination caused by<br />
the weather situation on the measurements is investigated.<br />
Data measured by a bistatic receiver is more likely to be con-<br />
taminated by sidelobes of the transmitted radar due to the<br />
wide–beam receiving antennas (more details by de Elia and<br />
Zawadzki (1999); Friedrich (<strong>2002</strong>)). For narrow–beam antennas,<br />
sidelobe contamination can be ignored, because the<br />
signal transmitted through the weak sidelobe is also received<br />
by the weak sidelobe. Therefore, the reflectivity factor measured<br />
by the monostatic radar can be used as a reference to<br />
give information about the probability of sidelobe contamination.<br />
The probability that data measured by the bistatic receiver<br />
is contaminated by sidelobes of the transmitted antenna pattern<br />
can be expressed by the gradient of the reflectivity factor,<br />
∇Z = ( ∂Z ∂Z ∂Z<br />
∂x , ∂y , ∂z ). The absolute value of the reflectivity<br />
factor gradient can be expressed by the quality–field F (∇Z)<br />
with<br />
<br />
F (∇Z) =<br />
30dBZ/km −<br />
<br />
2 2 <br />
2<br />
∆Z ∆Z ∆Z<br />
+ + / 30dBZ/km . (3)<br />
2∆x 2∆y 2∆z<br />
The upper–limit value of 30 dBZ/km is derived from the<br />
beam pattern of the transmitting antenna at POLDIRAD<br />
(Fig. 2.11 in Friedrich, <strong>2002</strong>). Here, the first sidelobe of the<br />
transmitted beam pattern occurs at about 1.7 ◦ away from the<br />
main beam, with a reduction of about 32 dB when compared<br />
to the mainlobe. Thus, assuming a uniform receiving beam<br />
pattern of the bistatic antenna, the gradient of the reflectivity<br />
factor has to be about 30 dBZ per 1.7 ◦ in order to measure<br />
the same signal intensity from the sidelobe as that obtained<br />
from the mainlobe by the bistatic receiver.<br />
At F (∇Z) = 0, the probability of sidelobe contamination<br />
is very high, while at F (∇Z) = 1, sidelobe contamination<br />
hardly occurs. As an example, the horizontal distribution of<br />
F (∇Z) is analyzed in Fig. 4 for the reflectivity factor field<br />
of a convective cell. The impact of F (∇Z) on the averaged<br />
quality–index field is set by the weighting factor W F (∇Z).<br />
3.2.3 Utilizing signal quality based on fractional uncertainty<br />
The fractional uncertainty field, σ ′ |Vh|/|Vh|, is used to<br />
give information about the percentage accuracy of the horizontal<br />
wind–field measurement. The quality–index field<br />
F (σ ′ |Vh|/|Vh|), related to the wind–field variability, is derived<br />
linearly from σ ′ |Vh|/|Vh| using<br />
F (σ ′ |Vh|/|Vh|) =<br />
<br />
1 − σ′ |V h |<br />
|Vh|<br />
for σ ′ |Vh| < |Vh|<br />
0 for σ ′ |Vh| ≥ |Vh|<br />
. (4)<br />
For σ ′ |Vh| ≪ |Vh|, F (σ ′ |Vh|/|Vh|) approaches the<br />
value of one. Figure 5 shows the horizontal distribution of<br />
F (σ ′ |Vh|/|Vh|) for the simulated convective cell. The horizontal<br />
wind–field of the simulated supercell storm (Fig. 5a)<br />
is used to calculate F (σ ′ |Vh|/|Vh|) for the dual–Doppler<br />
configuration consisting of POLDIRAD and receiver Lagerlechfeld.<br />
Because the wind–velocity measurement is an
K. Friedrich and M. Hagen: Vector fields using a bistatic Doppler radar 209<br />
Fig. 4. Horizontal cross–section of F (∇Z) (color–coded) calculated<br />
for a convective cell. The isolines indicating the gradient of<br />
reflectivity factor are plotted every 5 dBZ starting at the outside of<br />
the cell with the 5 dBZ–isoline.<br />
absolute measurement, low wind–speeds create low values<br />
of F (σ ′ |Vh|/|Vh|). In addition, high standard deviations,<br />
e.g. close to the baseline or in the quasi–monostatic area,<br />
cause low values of F (σ ′ |Vh|/|Vh|). The influence of<br />
F (σ ′ |Vh|/|Vh|) on the average quality–control field is controlled<br />
by the weight of W F (σ ′ |Vh |/|Vh|).<br />
The weight of this quality–index field on the average<br />
quality–index field should be set low within those<br />
weather conditions having high wind–shear. For example,<br />
as illustrated in Fig. 5b at an azimuth angle of<br />
200 ◦ ≤ φt ≤ 225 ◦ and at a range of r ′ t = 20 km – 25 km, the<br />
wind–speed is very weak and causes F (σ ′ |Vh|/|Vh|) to be<br />
close to zero, even though σ ′ |Vh| is low and the wind represents<br />
realistic conditions within this area. To avoid a wrong<br />
interpretation of F (σ ′ |Vh|/|Vh|), W F (σ ′ |Vh |/|Vh|) should be<br />
set high during stratiform precipitation with wind–speed values<br />
larger than 5 m s −1 and low during situations with high<br />
wind–shear, e.g. convective situations.<br />
The fractional uncertainty can also be applied to the direction<br />
of the horizontal wind.<br />
3.2.4 Utilizing data consistency based on a persistence<br />
check<br />
The persistence check algorithm should help in identifying<br />
regions where wind–shear is higher than the mean flow. The<br />
regions identified are then tracked in space by means of<br />
wind–fields at different elevations and at different time steps<br />
(e.g. successive volume–scans). When high wind–shear is<br />
identified at different levels and/or in the successive volume–<br />
scans, the wind–shear can be related to atmospherical processes.<br />
Otherwise, the perturbation is removed.<br />
The persistence check is carried out as follows. The standard<br />
deviation in the horizontal wind–velocity, σ |Vh|, and<br />
(a) (b)<br />
Fig. 5. Horizontal cross–section of (a) the horizontal wind–vector<br />
of the simulated convective cell and (b) the respective quality–index<br />
field F (σ ′ |V h|/|Vh|). The 5 dBZ–isoline indicating the shape of<br />
the supercell storm is marked.<br />
Fig. 6. Horizontal cross–section of the horizontal wind–vector in<br />
m s −1 a convective storm. The area with wind–shear (direction<br />
and absolute value) higher than mean flow is marked. The 5 dBZ–<br />
isoline indicating the shape of the storm is marked.<br />
direction are calculated. The area is marked, when the difference<br />
between the mean value, Vh, minus the i ′ th measured<br />
horizontal wind–vector, Vi is larger than the vector<br />
standard deviation, σVh . For the horizontal wind–velocity<br />
this is given as<br />
σ |Vh| − |Vh − V i | ≤ 0 . (5)<br />
Figure 6 shows an example of how this algorithm is applied<br />
using the horizontal wind–field of a convective storm.<br />
The shape of the supercell storm is indicated by the 5 dBZ–<br />
isoline. The wind–shear within the storm is much higher than<br />
the surrounding air flow. Therefore, the area having high<br />
wind–shear is marked. Note that if the area marked gray is<br />
present in the successive volume scans as well as at neighboring<br />
levels, the marked area can then be identified as a signal<br />
which is related to meteorological processes. Otherwise,<br />
wind–vectors within this area will be removed.
210 K. Friedrich and M. Hagen: Vector fields using a bistatic Doppler radar<br />
w[m s −1 ] (a) (b)<br />
Fig. 7. Horizontal cross–section at a height of 1.6 km above MSL<br />
of the (a) retrieved horizontal wind–vector underlaid by vertical velocity<br />
in m s −1 and (b) the respective quality–index field of the horizontal<br />
wind on 2 February 2000 at 17:08 UTC. Updraft motions<br />
are indicated by positive values, and downdraft by negative values.<br />
For clarity of display, only every third wind vector is plotted.<br />
4 Stratiform precipitation in a frontal system<br />
Two cold frontal systems with stratiform precipitation passed<br />
over southern Germany from the northwest on 2 February<br />
2000 and 10 April 2001, respectively. On both days the<br />
pre–frontal wind was mainly from southwesterly and westerly<br />
directions, ranging from between 10 m s −1 – 15 m s −1<br />
and increasing and veering more to a westerly flow as the<br />
cold front approached. On 2 February 2000 data was measured<br />
by POLDIRAD and the receiver Lagerlechfeld . On<br />
10 April 2001 the bistatic Doppler radar network consisted<br />
of POLDIRAD, receiver Lagerlechfeld, and receiver Lichtenau.<br />
Both data sets were interpolated onto a Cartesian grid<br />
with a horizontal resolution of 500 m and a vertical resolution<br />
of 250 m, starting at 600 m above MSL, i.e. at the height<br />
of POLDIRAD, up to a height of 2.85 km above MSL. The<br />
measured velocities, vt and ve, were used as input data for<br />
the constraining model (Protat and Zawadzki, 1999) in order<br />
to retrieve the three components, u, v, w of the wind–vector.<br />
Figure 7a shows the horizontal wind–vector underlaid by<br />
the vertical velocity during the frontal passage on 2 February<br />
2000 at 17:08 UTC. The frontal system was located SW<br />
of OP (between 220 ◦ ≤ φt ≤ 230 ◦ ), heading southeast.<br />
In Fig. 7a, a perturbation can be detected SW of OP with a<br />
slight change in wind direction (from SW to W), with pre–<br />
frontal ascending and post–frontal descending air. The averaged<br />
quality–index field of the horizontal wind–vector at<br />
17:08 UTC is exhibited in Fig. 7b. In this case, which shows<br />
a weather situation with a relatively homogeneous flow, the<br />
quality–index field is dominated by the accuracy of the horizontal<br />
wind–field determination (cp. Fig. 5). Only wind–<br />
vector and values of reflectivity factor where the average<br />
quality–index field exceeded a value of 0.6 (empirically chosen)<br />
were plotted. Within this area, the confidence in the<br />
Doppler velocity measurements was high, and a large number<br />
of data points was available.<br />
Figure 8 illustrates the vertical wind–field superimposed<br />
w[m s −1 ] (a) (b)<br />
Fig. 8. As Fig. 7, for 10 April 2001 at 13:27 UTC. Data were sampled<br />
by the receivers Oberpfaffenhofen, Lichtenau, and Lagerlechfeld.<br />
on the horizontal wind–vector field, and the corresponding<br />
average quality–index field of the horizontal wind on 10<br />
April 2001 at 13:27 UTC, respectively. The influence of<br />
an overdetermined equation system for the horizontal wind–<br />
field calculation on the averaged quality index field can be<br />
seen clearly when comparing Fig. 7b and Fig. 8b. According<br />
to the quality–index field (Fig. 8b), the confidence in the horizontal<br />
wind–field is high within the whole observation area<br />
with values ranging between 0.7 and 0.8. The retrieved vertical<br />
velocity was characterized by relatively small up– and<br />
downward motions due to the low values of horizontal convergence.<br />
5 Convective weather situation<br />
On the afternoon of the 3 May 2000, a convective systems<br />
developed southwest of OP around 14:00 UTC and stayed<br />
within the observation area for one hour.<br />
The most active part of the system located southwest of<br />
Oberpfaffenhofen (i.e. maximum reflectivity factor) consisted<br />
of a stationary cell located between 225 ◦ ≤ φt ≤<br />
280 ◦ at a range of 15 km ≤ r ′ t ≤ 30 km. Volume scans<br />
were performed by POLDIRAD and receiver Lagerlechfeld.<br />
Owing to the high variability in wind direction and speed,<br />
the weights for the quality index related to F (σ ′ |Vh|/|Vh|)<br />
were set to zero. Furthermore, F (∇Z) showed a probability<br />
of sidelobe contamination because of the high gradient<br />
in the reflectivity factor. Sidelobe contamination was investigated<br />
separately. The results showed no contamination of<br />
data measured by the bistatic receiver during this convective<br />
situation (Friedrich, <strong>2002</strong>). The confidence in the horizontal<br />
wind–field ranged between 0.5 and 0.8.<br />
The wind–field retrieval was performed in a 40 km ×<br />
40 km × 10 km domain and interpolated onto a Cartesian<br />
grid with a horizontal and a vertical resolution of 500 m. The<br />
retrieval domain consisted of 20 height levels, beginning at<br />
600 m and reaching up to a height of 10.6 km above MSL.<br />
Figure 9 shows the retrieved horizontal wind–vector underlaid<br />
by the vertical velocity at 14:55 UTC at a height
K. Friedrich and M. Hagen: Vector fields using a bistatic Doppler radar 211<br />
(a) (b)<br />
Fig. 9. Horizontal cross–section of the horizontal wind–vector in<br />
m s −1 at a height of (a) 1.35 km and (b) 5.35 km above MSL underlaid<br />
by the vertical velocity in m s −1 for 3 May 2000, at 14:55 UTC.<br />
The horizontal wind was determined by the Doppler measurements<br />
of receivers OP and Lagerlechfeld. Upwinds are indicated by positive<br />
values, while negative values are downwinds. For clarity of<br />
display, only every third wind–vector is plotted.<br />
of 1.35 km and 5.35 km above MSL. The horizontal wind–<br />
vector at the lower troposphere showed strong divergences<br />
and convergences in speed and direction with an easterly<br />
and westerly flow at 1.35 km above MSL (Fig. 9a). Aloft,<br />
northwesterly to westerly winds dominated (Fig. 9b), with<br />
a noticeable confluence of the outflow on the southern part<br />
of the most active part of the system. The vertical velocity<br />
fields were characterized by a well–defined updraft located<br />
at 230 ◦ ≤ φt ≤ 270 ◦ at a range of 15 km ≤ rt ≤ 25 km and<br />
a downdraft area south of it. The magnitude of the up– and<br />
downdraft was continuously increasing from ground level up<br />
to the top. Maximum values of 6 m s −1 at a height of 5.35 km<br />
above MSL were reached in the updraft region and values of<br />
-5 m s −1 at 5.35 km above MSL in the southern downdraft<br />
region (Fig. 9b). Both positive and negative divergences of<br />
the horizontal wind–field were observed in the main updraft<br />
area.<br />
6 Conclusion<br />
Signatures of the horizontal wind–field (e.g. divergences, rotations,<br />
wind–shear) can be detected easily with a bistatic<br />
Doppler radar as presented here for two stratiform and one<br />
convective precipitation event. While the horizontal wind<br />
is measured in real–time, the quality–control and the vertical<br />
wind retrieval are applied afterwards. The three components<br />
of the wind–vector u, v, and w together with a confidence<br />
level for each horizontal wind–field is a great benefit<br />
for operational meteorology, e.g. weather surveillance, hazard<br />
warnings, and nowcasting of weather phenomena.<br />
The comprehensiveness and the emphasis to the quality–<br />
control scheme varied according to the weather situations.<br />
During the stratiform precipitation event, for instance, the<br />
quality of horizontal wind is dominated by F (σ ′ |Vh|) which<br />
is fixed for an experimental setup. Low impact is observed<br />
by F (∇Z) and F (σ ′ |Vh|/|Vh|). The emphasis on the quality<br />
control was set differently by the convective case. For<br />
instance, F (σ ′ |Vh|/|Vh|) could not be applied owing to the<br />
high wind–shear. On the other hand, the control for data<br />
consistency, such as the persistence check in time and space<br />
and investigation on sidelobe contamination, was more important.<br />
The cases discussed here show clearly that quality–<br />
control algorithms must be flexibly and independently applicable.<br />
The quality–control algorithm can also be applied to<br />
other horizontal wind–field measurements, e.g. monostatic<br />
dual–Doppler winds.<br />
References<br />
de Elia, R. and Zawadzki, I., Sidelobe contamination in bistatic<br />
radars, in Proc.29th Radar Meteorology Conf., Montreal, pp.<br />
218–220, Amer. Meteor. Soc., 1999.<br />
Friedrich, K., Determination of three–dimensional wind–vector<br />
fields using a bistatic Doppler radar network, Ph.D. thesis, Fakultaet<br />
fuer Physik, Ludwig–Maximilians–Universitaet Muenchen,<br />
http://www.op.dlr.de/ pa4k/, <strong>2002</strong>.<br />
Protat, A. and Zawadzki, I., A variational method for real–time retrieval<br />
of three–dimensional wind field from multiple–Doppler<br />
bistatic radar network data, J. Atmos. Oceanic Technol., 16, 432–<br />
449, 1999.<br />
Schroth, A. C., Chandra, M. S., and Meischner, P., A C–band coherent<br />
polarimetric radar for precipitation and cloud physics research,<br />
J. Atmos. Oceanic Technol., 5, 803–822, 1988.<br />
Wurman, J., Heckman, S., and Boccippio, D., A bistatic multiple–<br />
Doppler radar network, J. Appl. Meteor., 32, 1802–1814, 1993.