

Magnetic field-induced cluster formation and variation of magneto ...
Magnetic field-induced cluster formation and variation of magneto ...
Magnetic field-induced cluster formation and variation of magneto ...

You also want an ePaper? Increase the reach of your titles
YUMPU automatically turns print PDFs into web optimized ePapers that Google loves.
stages <strong>of</strong> milling in ferr<strong>of</strong>luid preparation as it controls<br />
many <strong>of</strong> the peculiar properties exhibited by these fluids<br />
<strong>and</strong> it has been shown that particles below a critical size <strong>of</strong><br />
100 A ˚ will display single domain characteristics <strong>and</strong> super<br />
paramagnetism.<br />
The magnetization <strong>of</strong> all the synthesized fine ferrite<br />
powder samples have been measured by VSM <strong>and</strong> the<br />
values fits well with the Neel’s two sublattice model with an<br />
error percentage less than 2.5%. This small discrepancy<br />
may arise from the ultrafine characteristics <strong>of</strong> these ferrites.<br />
The samples have vanishing hysteresis with very low<br />
remanance which is a necessary criterion for a single<br />
domain/superparamagnetic particle. Neglecting interaction<br />
effects, the magnetization <strong>of</strong> these fine particles solely<br />
determine the magnetization <strong>of</strong> ferr<strong>of</strong>luids synthesized<br />
employing the same precursors <strong>and</strong> thus by knowing<br />
volume fraction <strong>of</strong> ferrites inside the ferr<strong>of</strong>luids, their<br />
magnetization can be calculated. Magnetization decreases<br />
as ‘x’ value increases in the series ZnxFe1 xFe2O4 as<br />
predicted by the Neel’s two sublattice theory. The<br />
magnetization curve for all the powder samples are shown<br />
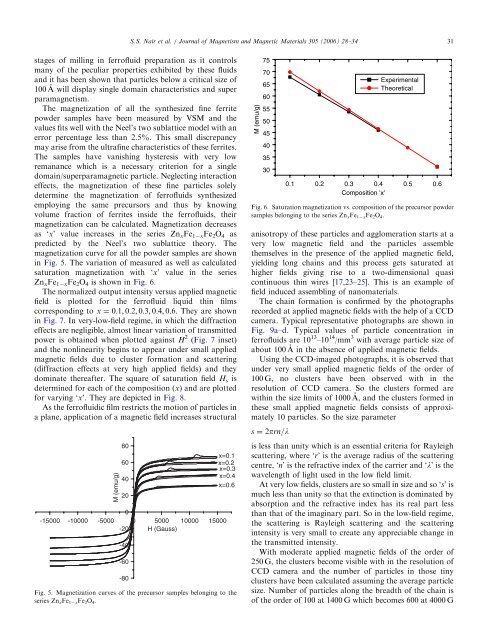
in Fig. 5. The <strong>variation</strong> <strong>of</strong> measured as well as calculated<br />
saturation magnetization with ‘x’ value in the series<br />
ZnxFe1 xFe2O4 is shown in Fig. 6.<br />
The normalized output intensity versus applied magnetic<br />
<strong>field</strong> is plotted for the ferr<strong>of</strong>luid liquid thin films<br />
corresponding to x ¼ 0:1; 0:2; 0:3; 0:4; 0:6. They are shown<br />
in Fig. 7. In very-low-<strong>field</strong> regime, in which the diffraction<br />
effects are negligible, almost linear <strong>variation</strong> <strong>of</strong> transmitted<br />
power is obtained when plotted against H 2 (Fig. 7 inset)<br />
<strong>and</strong> the nonlinearity begins to appear under small applied<br />
magnetic <strong>field</strong>s due to <strong>cluster</strong> <strong>formation</strong> <strong>and</strong> scattering<br />
(diffraction effects at very high applied <strong>field</strong>s) <strong>and</strong> they<br />
dominate thereafter. The square <strong>of</strong> saturation <strong>field</strong> Hs is<br />
determined for each <strong>of</strong> the composition (x) <strong>and</strong> are plotted<br />
for varying ‘x’. They are depicted in Fig. 8.<br />
As the ferr<strong>of</strong>luidic film restricts the motion <strong>of</strong> particles in<br />
a plane, application <strong>of</strong> a magnetic <strong>field</strong> increases structural<br />
M (emu/g)<br />
80<br />
60<br />
40<br />
20<br />
0<br />
-15000 -10000 -5000 0 5000 10000 15000<br />
-20 H (Gauss)<br />
-40<br />
-60<br />
-80<br />
ARTICLE IN PRESS<br />
S.S. Nair et al. / Journal <strong>of</strong> Magnetism <strong>and</strong> <strong>Magnetic</strong> Materials 305 (2006) 28–34 31<br />
x=0.1<br />
x=0.2<br />
x=0.3<br />
x=0.4<br />
x=0.6<br />
Fig. 5. Magnetization curves <strong>of</strong> the precursor samples belonging to the<br />
series ZnxFe1 xFe2O4.<br />
M (emu/g)<br />
75<br />
70<br />
65<br />
60<br />
55<br />
50<br />
45<br />
40<br />
35<br />
30<br />
Experimental<br />
Theoretical<br />
0.1 0.2 0.3 0.4 0.5 0.6<br />
Composition 'x'<br />
Fig. 6. Saturation magnetization vs. composition <strong>of</strong> the precursor powder<br />
samples belonging to the series ZnxFe1 xFe2O4.<br />
anisotropy <strong>of</strong> these particles <strong>and</strong> agglomeration starts at a<br />
very low magnetic <strong>field</strong> <strong>and</strong> the particles assemble<br />
themselves in the presence <strong>of</strong> the applied magnetic <strong>field</strong>,<br />
yielding long chains <strong>and</strong> this process gets saturated at<br />
higher <strong>field</strong>s giving rise to a two-dimensional quasi<br />
continuous thin wires [17,23–25]. This is an example <strong>of</strong><br />
<strong>field</strong> <strong>induced</strong> assembling <strong>of</strong> nanomaterials.<br />
The chain <strong>formation</strong> is confirmed by the photographs<br />
recorded at applied magnetic <strong>field</strong>s with the help <strong>of</strong> a CCD<br />
camera. Typical representative photographs are shown in<br />
Fig. 9a–d. Typical values <strong>of</strong> particle concentration in<br />
ferr<strong>of</strong>luids are 10 13 –10 14 /mm 3 with average particle size <strong>of</strong><br />
about 100 A˚ in the absence <strong>of</strong> applied magnetic <strong>field</strong>s.<br />
Using the CCD-imaged photographs, it is observed that<br />
under very small applied magnetic <strong>field</strong>s <strong>of</strong> the order <strong>of</strong><br />
100 G, no <strong>cluster</strong>s have been observed with in the<br />
resolution <strong>of</strong> CCD camera. So the <strong>cluster</strong>s formed are<br />
within the size limits <strong>of</strong> 1000 A˚ , <strong>and</strong> the <strong>cluster</strong>s formed in<br />
these small applied magnetic <strong>field</strong>s consists <strong>of</strong> approximately<br />
10 particles. So the size parameter<br />
s ¼ 2prn=l<br />
is less than unity which is an essential criteria for Rayleigh<br />
scattering, where ‘r’ is the average radius <strong>of</strong> the scattering<br />
centre, ‘n’ is the refractive index <strong>of</strong> the carrier <strong>and</strong> ‘l’ is the<br />
wavelength <strong>of</strong> light used in the low <strong>field</strong> limit.<br />
At very low <strong>field</strong>s, <strong>cluster</strong>s are so small in size <strong>and</strong> so ‘s’is<br />
much less than unity so that the extinction is dominated by<br />
absorption <strong>and</strong> the refractive index has its real part less<br />
than that <strong>of</strong> the imaginary part. So in the low-<strong>field</strong> regime,<br />
the scattering is Rayleigh scattering <strong>and</strong> the scattering<br />
intensity is very small to create any appreciable change in<br />
the transmitted intensity.<br />
With moderate applied magnetic <strong>field</strong>s <strong>of</strong> the order <strong>of</strong><br />
250 G, the <strong>cluster</strong>s become visible with in the resolution <strong>of</strong><br />
CCD camera <strong>and</strong> the number <strong>of</strong> particles in those tiny<br />
<strong>cluster</strong>s have been calculated assuming the average particle<br />
size. Number <strong>of</strong> particles along the breadth <strong>of</strong> the chain is<br />
<strong>of</strong> the order <strong>of</strong> 100 at 1400 G which becomes 600 at 4000 G


