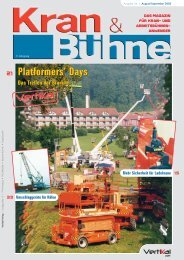
2010 rental rate survey c&a - Vertikal.net
2010 rental rate survey c&a - Vertikal.net
2010 rental rate survey c&a - Vertikal.net

You also want an ePaper? Increase the reach of your titles
YUMPU automatically turns print PDFs into web optimized ePapers that Google loves.
ental <strong>rate</strong> guide<br />
The first half of <strong>2010</strong> saw another bloodbath in<br />
terms of <strong>rental</strong> <strong>rate</strong>s, both for cranes and<br />
powered access, while telehandlers were<br />
already on the bottom. The second half has seen<br />
a definite but fragile improvement with some<br />
access companies reporting a 10 percent<br />
improvement by the start of the fourth quarter.<br />
Cranes do not seem to have seen<br />
quite the same improvement<br />
although utilisation has picked up<br />
substantially. Unlike most access<br />
equipment, the majority of crane<br />
<strong>rental</strong> pricing is far more complex<br />
being a day to day business. Daily<br />
minimums and extras play<br />
a significant role, so while the<br />
headline hourly <strong>rate</strong> might not<br />
improve, better companies<br />
quickly tighten up on such items,<br />
which can translate to a better<br />
yield depending on the duration<br />
of the job. Book two or three jobs<br />
for a crane in a day while holding<br />
a respectable daily minimum and<br />
the <strong>rental</strong> <strong>rate</strong>s are transformed<br />
without changing the hourly <strong>rate</strong>.<br />
And then there is contract lifting.<br />
Seen by some as an opportunity to<br />
make decent money, in reality it<br />
can be a double edged sword.<br />
Those companies who take their<br />
job seriously will quote a realistic<br />
fee for a contract lift, knowing that<br />
there is strong chance that it will<br />
drive some customers into the<br />
hands of a less scrupulous operator<br />
who will either do the job as a<br />
regular crane hire or will undercut<br />
the price for a contract lift on the<br />
basis that he has no intention of<br />
doing it as it should be done.<br />
The big unknown of course is what<br />
the New Year will bring. Will the<br />
current upturn fizzle out as<br />
government austerity cuts begin to<br />
bite? Or will it be maintained with<br />
a steady improvement through the<br />
year as the economy continues to<br />
recover? When considering this it<br />
should be noted that the UK/Ireland<br />
crane and platform fleet has been<br />
substantially reduced as a surprising<br />
number of machines have been sold<br />
overseas thanks to the weak pound<br />
while some older equipment has<br />
been retired.<br />
One positive thing to note from the<br />
current situation is how quickly<br />
<strong>rental</strong> companies have moved to<br />
firm up prices as utilisation began to<br />
climb. Hopefully this is sign that the<br />
industry might be beginning to show<br />
some signs of maturity? Or maybe<br />
that’s wishful thinking?<br />
We would like to thank everyone<br />
who participated in this <strong>survey</strong> for<br />
taking the time to provide their<br />
input. Thank You.<br />
c&a<br />
<strong>2010</strong> <strong>rental</strong> <strong>rate</strong> <strong>survey</strong><br />
Crane <strong>rate</strong>s<br />
Crane hire <strong>rate</strong> trends all crane types<br />
Crane hire <strong>rate</strong>s<br />
over the past 12 months<br />
44%<br />
(97%)<br />
0% increase<br />
(0%)<br />
56%<br />
(3%)<br />
(numbers in brackets<br />
= 2009 results)<br />
Crane hire <strong>rate</strong>s<br />
during the next 12 months<br />
Given what happened in the first half of the year this result is surprising,<br />
possibly due to the more positive fourth quarter? What is interesting is<br />
the projections for 2011 which are a great deal more positive than this<br />
time last year.<br />
Crane fleet size<br />
Crane fleet size<br />
over the past 12 months<br />
12%<br />
(12%)<br />
25%<br />
(42%)<br />
63%<br />
(46%)<br />
(numbers in brackets<br />
= 2009 results)<br />
25%<br />
(0%)<br />
38%<br />
(51%)<br />
37%<br />
(49%)<br />
Crane fleet size<br />
over the next 12 months<br />
12%<br />
(28%) 13%<br />
(3%)<br />
75%<br />
(69%)<br />
It is clear that in terms of fleet size far more companies cut back their<br />
fleets than had intended to. This year companies are clearly more ‘realistic’<br />
in that the vast majority now believe that they have their fleets at the right<br />
size for 2011.<br />
Decreased<br />
Stayed the same<br />
Increased<br />
December/January 2011 cranes & access 31
<strong>2010</strong> <strong>rental</strong> <strong>rate</strong> <strong>survey</strong> c&a<br />
Utilisation and return<br />
100<br />
90<br />
80<br />
70<br />
60<br />
50<br />
40<br />
30<br />
20<br />
10<br />
0<br />
100<br />
90<br />
80<br />
70<br />
60<br />
50<br />
40<br />
30<br />
20<br />
10<br />
0<br />
4%<br />
under 30<br />
tonnes<br />
6%<br />
under 30<br />
tonnes<br />
Cranes giving the best physical utilisation<br />
0%<br />
30 - 45<br />
tonnes<br />
2%<br />
50 - 65<br />
tonnes<br />
2%<br />
70 - 85<br />
tonnes<br />
80%<br />
95 - 125<br />
tonnes<br />
6% 4%<br />
135 - 200<br />
tonnes<br />
32 cranes & access December/January 2011<br />
210 - 350<br />
tonnes<br />
Cranes giving best return on investment<br />
2%<br />
Over 350<br />
tonnes<br />
m o b i l e c r a n e s<br />
0%<br />
30 - 45<br />
tonnes<br />
0%<br />
50 - 65<br />
tonnes<br />
2%<br />
70 - 85<br />
tonnes<br />
88%<br />
95 - 125<br />
tonnes<br />
2% 2%<br />
135 - 200<br />
tonnes<br />
210 - 350<br />
tonnes<br />
0%<br />
Over 350<br />
tonnes<br />
m o b i l e c r a n e s<br />
This is one area we will need to reconsider for next year. Some results<br />
were so contrary we wondered if the rating system had been<br />
misunderstood. In spite of this one thing did come through loud and clear<br />
- the 95 to 125 tonne sector remains the strongest and in fact increases<br />
its dominance over the other crane sizes.<br />
Daily <strong>rate</strong>s for mobile cranes<br />
Lowest Highest Average<br />
Under 30 tonnes £280 £340 £308<br />
30 to 45 tonnes £350 £425 £393<br />
50 to 65 tonnes £450 £545 £509<br />
70 to 85 tonnes £650 £780 £713<br />
95 to 125 tonnes £850 £1100 £941<br />
135 to 200 tonnes £1,550 £1,650 £1,570<br />
210 to 350 tonnes £2,800 £2,950 £2,820<br />
Over 350 tonnes No input<br />
City Cranes<br />
£395 £470 £428<br />
Weekly <strong>rate</strong>s for crawler cranes<br />
Lowest Highest Average<br />
Up to 50 tonnes £1,120 1,450 £1,285<br />
50 to 100 tonnes £1,950 £2,300 £2,100<br />
100 to 249 tonnes £2,100 £3,900 £2,760<br />
250 to 500 tonnes No input<br />
Weekly <strong>rate</strong>s for tower cranes<br />
Lowest Highest Average<br />
Luffers £795 £850 £815<br />
Flat Top £500 £610 £570<br />
Saddle Jib £550 £575 £558<br />
Self erectors £450 £600 £548<br />
Weekly <strong>rate</strong>s for other cranes<br />
Lowest Highest Average<br />
Pick & Carry £230 £300 £267<br />
Spider cranes £525 £950 £758<br />
Rates quoted do not seem to reflect the extreme pessimism of the comments<br />
we received, possibly because respondents were conservative in the data<br />
they sent in? A number of respondents declined to complete this section.<br />
Do you employ<br />
any female<br />
crane operators?<br />
6%<br />
(11%)<br />
94%<br />
(89%)<br />
Yes<br />
No<br />
(numbers in<br />
brackets =<br />
2009 results)<br />
While the small numbers mean that<br />
the percentages have little meaning,<br />
our responses suggest a decline.
What percentage of your<br />
jobs are contract lifts?<br />
Type of company Crane Hire Contract Lift<br />
Mobile crane hirers 69% (76%) 31% (24%)<br />
All crane hirers 80.5% (86%) 19.5% (14%)<br />
This seems to indicate that recent efforts by<br />
the CPA and HSE is having an effect moving<br />
more lifts towards contract lift – or it may<br />
reflect a fall in major contractor market?<br />
Would you recommend the crane hire<br />
industry to your children?<br />
<strong>2010</strong> (2009)<br />
Yes 62% 52%<br />
No 38% 46%<br />
Don't know 0% 2%<br />
Who does your<br />
Thorough<br />
Examinations<br />
inspections?<br />
In House 12%<br />
Third Party 82%<br />
A surprising result - we failed<br />
to ask what type of third<br />
party, but it is encouraging.<br />
This is surprising given how<br />
tough the year was, and is<br />
the first time in several<br />
years that we have not had<br />
any ‘don’t knows’<br />
It is encouraging.<br />
Respondent’s Comments<br />
“Still shocking” Crawler crane hirer<br />
“There was a lot of pressure on<br />
<strong>rate</strong>s this year, with the triple<br />
whammy of lower demand,<br />
companies despe<strong>rate</strong> for cash flow<br />
and clients going to Dutch auctions.<br />
All these were factors in the returns<br />
measured against capital<br />
expenditure.” Mobile crane hirer<br />
“2009 was still showing some<br />
firmness (although my experience<br />
here it was limited!) <strong>2010</strong> has<br />
become increasingly cutthroat<br />
predominantly by the larger and<br />
smaller companies rather than<br />
those in the mid-range.”<br />
Mobile crane hirer<br />
“Self erecting tower crane hire<br />
<strong>rate</strong>s have held up relatively<br />
well due to the relatively low<br />
numbers of machines in the<br />
market, with a drop of around<br />
10 percent. Our City Crane<br />
(top-slewing) <strong>rate</strong>s have come<br />
down a bit but they were<br />
already low and so did not<br />
have far to fall.”<br />
Tower crane hirer<br />
“The <strong>rate</strong>s for 2009 were not good enough. I am afraid we did like everyone<br />
else, we bought more and more cranes to suit the demand instead of<br />
increasing the <strong>rate</strong>s.” Mobile crane hirer<br />
“We have only reduced our <strong>rate</strong>s<br />
based on usage to existing<br />
regular customers and long term<br />
projects. When some companies<br />
are charging out cranes at what<br />
can only be a loss, it kills the<br />
industry for everyone.”<br />
Mobile crane hirer<br />
c&a<br />
Powered<br />
Access<br />
<strong>rate</strong>s<br />
Rate trends<br />
Access <strong>rate</strong>s over<br />
the past 12 months<br />
Fleet trends<br />
Fleet size over the<br />
past 12 months<br />
<strong>2010</strong> <strong>rental</strong> <strong>rate</strong> <strong>survey</strong><br />
(numbers in brackets<br />
= 2009 results)<br />
(numbers in brackets<br />
= 2009 results)<br />
Access <strong>rate</strong>s over<br />
the next 12 months<br />
21%<br />
(2%)<br />
When it came to the <strong>survey</strong> on how <strong>rate</strong>s performed this year, the results<br />
were all over the place with clear differences between location and<br />
company size. We also wonder if some respondents reflected on the<br />
improvements in the second half and ignored the poor start to the year?<br />
One thing is very clear and consistent - the mood is much more optimistic<br />
when it comes to looking forward to this year. While not as positive as the<br />
2008 <strong>survey</strong> it is substantially more buoyant than this time last year.<br />
23%<br />
(30%)<br />
11%<br />
(2%)<br />
32%<br />
(10%) 57%<br />
(88%)<br />
10%<br />
(12%)<br />
67%<br />
(58%)<br />
Fleet size over the<br />
next 12 months<br />
When it comes to fleet sizes the results of our <strong>survey</strong> are similar to last<br />
year, which is no great surprise. Companies are more positive for sure,<br />
but not yet confident enough to start thinking about expansion. Most<br />
respondents plan to maintain current fleet sizes although that was the<br />
case last year and in the end most companies reduced their fleets. The<br />
number of companies planning to expand is up, while those looking for<br />
further reductions are fewer.<br />
Decreased Stayed the same Increased<br />
17%<br />
(7%)<br />
61%<br />
(71%)<br />
9%<br />
(15%)<br />
74%<br />
(78%)<br />
18%<br />
(27%)<br />
December/January 2011 cranes & access 33
<strong>2010</strong> <strong>rental</strong> <strong>rate</strong> <strong>survey</strong> c&a<br />
Weekly <strong>rental</strong> <strong>rate</strong>s by general category<br />
Platform Height Lowest Highest Average<br />
Electric scissors<br />
5 metres and under 50 90 78<br />
6 metres (19/20ft) 70 120 91<br />
8 metres (26ft) 75 135 119<br />
10 metres compact (32ft narrow) 100 165 124<br />
10 - 20 metres compact 105 181 174<br />
20 metres plus 380 870 797<br />
Diesel/Bi Energy<br />
8 to 10 metres 26/33ft) 100 180 132<br />
10 to 14 metres 120 200 153<br />
over 14 metres 155 300 179<br />
34 cranes & access December/January 2011<br />
Platform Height Lowest Highest Average<br />
Electric Booms<br />
under 11 metres industrial 170 220 181<br />
10 to 12.5 m (32-40ft) Nifty/AB38 175 220 190<br />
14 metres (45ft plus) 190 230 203<br />
Mast booms<br />
6 metres 70 230 181<br />
8 metres 95 255 191<br />
RT articulating booms<br />
15 to 16 metres (45/51ft) 140 220 178<br />
20 to 23 metres (60/70ft) 195 310 277<br />
24 to 26 metres (80/85fts) 410 550 473<br />
over 26 metres 695 1,133 806<br />
Straight Booms<br />
Under 17 metres (40ft/46ft) 165 210 181<br />
20 to 23 metres (60/70ft) 250 320 269<br />
24 to 26 metres (80/86ft) 405 550 474<br />
0ver 27 metres 525 1,015 873
Platform Height Lowest Highest Average<br />
Trailer lifts<br />
12/13 metres (30/38ft) 180 270 197<br />
17 metres (50ft) 195 395 224<br />
over 20 metres 760 900 845<br />
Spiders<br />
Up to 15 metres 300 550 428<br />
16 to 20 metres 395 650 542<br />
20 to 30 metres 880 1,200 971<br />
Over 30 metres No Data<br />
Van mounts<br />
All sizes 330 460 359<br />
Truck mounted daily <strong>rate</strong>s<br />
Platform Height Lowest Highest Average<br />
Truck mounts<br />
Under 27 m (3.5 tonne chassis) 110 350 203<br />
20 to 35m (7.5 tonne) 460 650 507<br />
36 to 45 metres 483 800 620<br />
46 to 70 metres 888 1,300 922<br />
Over 70 metres 1,243 2,000 1,622<br />
*With operators<br />
The <strong>rate</strong> charts this year do in fact largely bear out the improvement in <strong>rate</strong>s<br />
that has been reported in our <strong>survey</strong> although it is not totally consistent.<br />
Rates given do tend to be those obtained at the time of completing the<br />
forms, so we are comparing the end of bad quarter last year with the end of<br />
a good quarter this year and so tends to show the current improving trend.<br />
c&a<br />
<strong>2010</strong> <strong>rental</strong> <strong>rate</strong> <strong>survey</strong><br />
Utilisation and Return<br />
1 = best<br />
10 = worst<br />
Type Best Physical Best Financial<br />
Utilisation Return<br />
Scissors<br />
Small Electric Scissors 1 1<br />
Electric Scissors 10 to 20 metres 3 3<br />
Big electric scissors 20 metres+ 2 2<br />
Compact diesel Scissors 6 5<br />
Diesel scissors 12 to 20 metres 5 6<br />
Big diesel scissors 20 metres+ 4 3<br />
Booms<br />
Small Electric booms (Nifty HR12/AB38) 2 1<br />
Industrial booms (Genie Z30/34NE-JLG HA30N) 3 4<br />
Articulated booms 4 3<br />
Big articulated booms 17 metres+ 1 2<br />
Straight telescopics 5 5<br />
Spider lifts<br />
Spider lifts up to 18 metres 2 2<br />
Spider lifts over 18 to 30 metres 1 1<br />
Spider lifts 31 metres and over 3 3<br />
Truck mounted lifts<br />
Truck mounts (3.5 tonne) 1 1<br />
Truck mounts (7.5 tonne) to 20m to 35 metres 3 5<br />
Truck mounts 36 to 45 metres 4 3<br />
Truck mounts 46 to 70 metres 2 2<br />
Truck mounts over 71 metres 5 4<br />
Others<br />
Trailer lifts 3 2<br />
Mast booms 2 3<br />
Push around lifts 1 1<br />
This year’s input was very confused and clearly due to our poor format, we<br />
have therefore had no option but to follow the majority of the inputs and<br />
<strong>rate</strong> the utilisation and returns by category. There are no great surprises<br />
here apart, perhaps, from the relatively high rating that the mega scissors<br />
received, both in terms of utilisation and return and the rating for big<br />
articulated booms. This is an area we will be looking to re-design and<br />
clarify before next year.<br />
December/January 2011 cranes & access 35
<strong>2010</strong> <strong>rental</strong> <strong>rate</strong> <strong>survey</strong> c&a<br />
Would you recommend the access <strong>rental</strong><br />
business to your children?<br />
Slightly less positive than last year<br />
which is yet another surprise, given<br />
that the <strong>survey</strong> was generally<br />
quite positive this year, reflecting<br />
improving trends.<br />
Yes No<br />
32%<br />
(27%)<br />
68%<br />
(73%)<br />
(numbers in brackets = 2009 results)<br />
Respondent’s Comments<br />
“With the new entrants in the truck mounted market, the Telecom sector<br />
has gone the way of window cleaning. Hard work for little money and<br />
best avoided if you can.”<br />
“We are working hard to improve pricing as demand returns, although<br />
ready to defend our position if attacked (no longer wishing to be seen as<br />
the "Market share mine" when things get tough)! More st<strong>rate</strong>gically it<br />
is critical that businesses charge enough to be able to afford a<br />
comprehensive equipment maintenance programme and, if they wish to<br />
reinvest in fleet refreshment and gene<strong>rate</strong> a sufficient return on capital<br />
to make that logical. That would probably mean generating a minimum<br />
pre-interest and tax operating margin of around 15 percent to get<br />
banks/funders happy. I wonder how many businesses are within<br />
touching distance of that hurdle at current pricing levels?”<br />
"Irrespective of the world<br />
economic conditions, as an<br />
industry we really do behave like<br />
Neanderthals. This is not an<br />
industry I would like my children<br />
to grow up in. In fact, it is an<br />
industry I will leave at the first<br />
commercially viable opportunity.<br />
The ‘access world’ has lost its<br />
shiny veneer."<br />
It seems pointless to keep on<br />
raising the same issue when<br />
no-one in the business seems to<br />
take notice. We sell safety and<br />
there can be no compromise with<br />
that, but if we don’t make a<br />
decent return we will eventually<br />
jeopardise that.”<br />
“Rates have definitely been<br />
improving and the silliness or<br />
should I say craziness of 2009 does<br />
appear to have abated – thankfully<br />
before we were all bankrupt. The<br />
situation is still edgy though and I<br />
reckon if we see a slow week or<br />
two it will all break out again?<br />
Does a leopard change its spots?”<br />
36 cranes & access December/January 2011<br />
Telehandler Rates<br />
Rate trends<br />
Telehandler <strong>rate</strong>s over<br />
the past 12 months<br />
Fleet size<br />
Fleet size over the past<br />
12 months<br />
Reduced Stayed the same Increased<br />
3% (96%) Reduced 0%<br />
(9%)<br />
15%<br />
28%<br />
(4%)<br />
47%<br />
(numbers in brackets<br />
= 2009 results)<br />
Reduced 0%<br />
(8%)<br />
(numbers in brackets<br />
= 2009 results)<br />
Telehandler <strong>rate</strong>s over<br />
the next 12 months<br />
What a change from this time last year? While the market is still in the<br />
doldrums, it is clearly improving and much healthier than in 2009. Hardly<br />
anyone expected <strong>rate</strong>s to improve in <strong>2010</strong> yet the vast majority report<br />
that they did – and in some categories (17 metre fixed frame) by quite<br />
a margin - although most are still a long way short of 2008 levels.<br />
Over the coming 12 months, no one expects <strong>rate</strong>s to fall with the<br />
majority forecasting holding onto the gains of last year.<br />
22%<br />
(44%)<br />
42%<br />
(52%)<br />
69%<br />
(0%)<br />
36%<br />
(4%)<br />
68%<br />
(87%)<br />
32%<br />
(4%)<br />
Fleet size over the next<br />
12 months<br />
22%<br />
(44%)<br />
38%<br />
(8%)<br />
No great surprise here, while <strong>rate</strong>s have improved and utilisation is higher<br />
for most companies, most say their fleets are now the right size for current<br />
market conditions and unwilling to risk investment. 2009/<strong>2010</strong> saw many<br />
fleets reduce in size with a lot of equipment sold overseas which has<br />
resulted in a surprising lack of machines in certain categories such as<br />
17 metre fixed frame. With good demand and <strong>rate</strong>s being achieved in the<br />
sub 10 metre, 17 metre and larger 360 degree machines, these are the<br />
most likely areas for fleet expansion
<strong>2010</strong> <strong>rental</strong> <strong>rate</strong> <strong>survey</strong> c&a<br />
Utilisation and Return<br />
Best Physical Best Return<br />
Fixed frame Return on Investment<br />
Under 10 metres 1 (3) 1 (3)<br />
10 to 12.5 metres 3 (1) 4 (4)<br />
13 to 15.5 metres 4 (4) 2 (2)<br />
16 to 20 metres 2 (2) 3 (1)<br />
360 degree<br />
Under 20 metres 3 (4) 4 (5)<br />
Over 20 metres 1 (1) 1 (1)<br />
(2009 results in brackets)<br />
38 cranes & access December/January 2011<br />
1 = best<br />
6 = worst<br />
Percentage of units going out with work<br />
platform attachments<br />
Type Lowest Highest Average<br />
Fixed frame 0% (10%) (0%) 15% 33% (30%) 8% 18% (15%) (17%)<br />
360 degree 0% 25% (20%) 19% 48% (55%) (30%) 34% 10% (31%) (28%)<br />
(2009 results in brackets)<br />
Weekly <strong>rate</strong>s for telehandlers<br />
Capacity Lowest Highest Average<br />
Fixed frame<br />
Under 10 metres 148 350 275<br />
10 to 12.5 metres 250 370 300<br />
13 to 15.5 metres 275 450 330<br />
16 to 20 metres 380 475 400<br />
360 degree<br />
Up to 20 metres 500 700 650<br />
21 metres 900 1000 950<br />
25 metres 1000 1500 1150<br />
Over 26 metres 1700 2200 1900<br />
Who does your<br />
Loler Thorough<br />
Examinations?<br />
In House 65%<br />
Third Party 35%<br />
Respondent’s Comments<br />
“Telehandler <strong>rate</strong>s have increased significantly (30-40%) over the past<br />
year but there are still some machine sizes that are still 20% shy of<br />
getting back to where they should be.”<br />
“The market is as good now as it has been in the last four years.”<br />
“So many fleets have been downsized that I had difficulty locating a<br />
17 metre machine.”<br />
“Utilisation at 80 percent is very good but if the <strong>rate</strong>s could go up<br />
another 10 percent that would be great.”<br />
“This is a very uncertain time – we could have a reasonably rosy year<br />
or it could turn around and bite back!”<br />
“Although the 360 degree telehandler has been around since the early<br />
90’s, it has suddenly been discovered and is eating into the smaller<br />
capacity mobile crane market.”<br />
“I would like to see the Thorough Examinations of telehandlers done<br />
properly – some companies are cutting corners and older machines are<br />
not up to the current safety standards.”