

Journal of Colloid and Interface Science Luminescence tuning and ...
Journal of Colloid and Interface Science Luminescence tuning and ...
Journal of Colloid and Interface Science Luminescence tuning and ...

You also want an ePaper? Increase the reach of your titles
YUMPU automatically turns print PDFs into web optimized ePapers that Google loves.
102 L. Irimpan et al. / <strong>Journal</strong> <strong>of</strong> <strong>Colloid</strong> <strong>and</strong> <strong>Interface</strong> <strong>Science</strong> 324 (2008) 99–104<br />
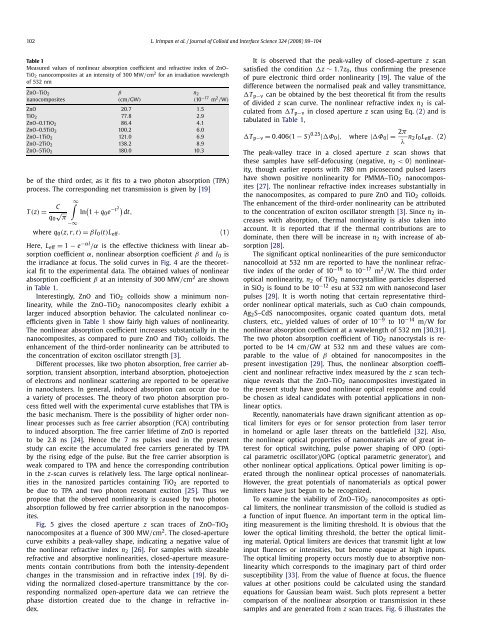
Table 1<br />
Measured values <strong>of</strong> nonlinear absorption coefficient <strong>and</strong> refractive index <strong>of</strong> ZnO–<br />
TiO2 nanocomposites at an intensity <strong>of</strong> 300 MW/cm 2 for an irradiation wavelength<br />
<strong>of</strong> 532 nm<br />
ZnO–TiO2<br />
nanocomposites<br />
β<br />
(cm/GW)<br />
ZnO 20.7 1.5<br />
TiO2 77.8 2.9<br />
ZnO–0.1TiO2 86.4 4.1<br />
ZnO–0.5TiO2 100.2 6.0<br />
ZnO–1TiO2 121.0 6.9<br />
ZnO–2TiO2 138.2 8.9<br />
ZnO–5TiO2 180.0 10.3<br />
n2<br />
(10 −17 m 2 /W)<br />
be <strong>of</strong> the third order, as it fits to a two photon absorption (TPA)<br />
process. The corresponding net transmission is given by [19]<br />
T (z) = C<br />
∞<br />
√ ln<br />
q0 π<br />
−∞<br />
1 + q0e −t2 dt,<br />
where q0(z, r, t) = β I0(t)L eff. (1)<br />
Here, L eff = 1 − e −αl /α is the effective thickness with linear absorption<br />
coefficient α, nonlinear absorption coefficient β <strong>and</strong> I0 is<br />
the irradiance at focus. The solid curves in Fig. 4 are the theoretical<br />
fit to the experimental data. The obtained values <strong>of</strong> nonlinear<br />
absorption coefficient β at an intensity <strong>of</strong> 300 MW/cm 2 are shown<br />
in Table 1.<br />
Interestingly, ZnO <strong>and</strong> TiO2 colloids show a minimum nonlinearity,<br />
while the ZnO–TiO2 nanocomposites clearly exhibit a<br />
larger induced absorption behavior. The calculated nonlinear coefficients<br />
given in Table 1 show fairly high values <strong>of</strong> nonlinearity.<br />
The nonlinear absorption coefficient increases substantially in the<br />
nanocomposites, as compared to pure ZnO <strong>and</strong> TiO2 colloids. The<br />
enhancement <strong>of</strong> the third-order nonlinearity can be attributed to<br />
the concentration <strong>of</strong> exciton oscillator strength [3].<br />
Different processes, like two photon absorption, free carrier absorption,<br />
transient absorption, interb<strong>and</strong> absorption, photoejection<br />
<strong>of</strong> electrons <strong>and</strong> nonlinear scattering are reported to be operative<br />
in nanoclusters. In general, induced absorption can occur due to<br />
a variety <strong>of</strong> processes. The theory <strong>of</strong> two photon absorption process<br />
fitted well with the experimental curve establishes that TPA is<br />
the basic mechanism. There is the possibility <strong>of</strong> higher order nonlinear<br />
processes such as free carrier absorption (FCA) contributing<br />
to induced absorption. The free carrier lifetime <strong>of</strong> ZnO is reported<br />
to be 2.8 ns [24]. Hence the 7 ns pulses used in the present<br />
study can excite the accumulated free carriers generated by TPA<br />
by the rising edge <strong>of</strong> the pulse. But the free carrier absorption is<br />
weak compared to TPA <strong>and</strong> hence the corresponding contribution<br />
in the z-scan curves is relatively less. The large optical nonlinearities<br />
in the nanosized particles containing TiO2 are reported to<br />
be due to TPA <strong>and</strong> two photon resonant exciton [25]. Thus we<br />
propose that the observed nonlinearity is caused by two photon<br />
absorption followed by free carrier absorption in the nanocomposites.<br />
Fig. 5 gives the closed aperture z scan traces <strong>of</strong> ZnO–TiO2<br />
nanocomposites at a fluence <strong>of</strong> 300 MW/cm 2 . The closed-aperture<br />
curve exhibits a peak-valley shape, indicating a negative value <strong>of</strong><br />
the nonlinear refractive index n2 [26]. For samples with sizeable<br />
refractive <strong>and</strong> absorptive nonlinearities, closed-aperture measurements<br />
contain contributions from both the intensity-dependent<br />
changes in the transmission <strong>and</strong> in refractive index [19]. By dividing<br />
the normalized closed-aperture transmittance by the corresponding<br />
normalized open-aperture data we can retrieve the<br />
phase distortion created due to the change in refractive index.<br />
It is observed that the peak-valley <strong>of</strong> closed-aperture z scan<br />
satisfied the condition z ∼ 1.7z0, thus confirming the presence<br />
<strong>of</strong> pure electronic third order nonlinearity [19]. The value <strong>of</strong> the<br />
difference between the normalised peak <strong>and</strong> valley transmittance,<br />
Tp−v can be obtained by the best theoretical fit from the results<br />
<strong>of</strong> divided z scan curve. The nonlinear refractive index n2 is calculated<br />
from Tp−v in closed aperture z scan using Eq. (2) <strong>and</strong> is<br />
tabulated in Table 1,<br />
Tp−v = 0.406(1 − S) 0.25 |Φ0|, where |Φ0|= 2π<br />
λ n2 I0L eff. (2)<br />
The peak-valley trace in a closed aperture z scan shows that<br />
these samples have self-defocusing (negative, n2 < 0) nonlinearity,<br />
though earlier reports with 780 nm picosecond pulsed lasers<br />
have shown positive nonlinearity for PMMA–TiO2 nanocomposites<br />
[27]. The nonlinear refractive index increases substantially in<br />
the nanocomposites, as compared to pure ZnO <strong>and</strong> TiO2 colloids.<br />
The enhancement <strong>of</strong> the third-order nonlinearity can be attributed<br />
to the concentration <strong>of</strong> exciton oscillator strength [3]. Sincen2in creases with absorption, thermal nonlinearity is also taken into<br />
account. It is reported that if the thermal contributions are to<br />
dominate, then there will be increase in n2 with increase <strong>of</strong> absorption<br />
[28].<br />
The significant optical nonlinearities <strong>of</strong> the pure semiconductor<br />
nanocolloid at 532 nm are reported to have the nonlinear refractive<br />
index <strong>of</strong> the order <strong>of</strong> 10 −16 to 10 −17 m 2 /W. The third order<br />
optical nonlinearity, n2 <strong>of</strong> TiO2 nanocrystalline particles dispersed<br />
in SiO2 is found to be 10 −12 esu at 532 nm with nanosecond laser<br />
pulses [29]. It is worth noting that certain representative thirdorder<br />
nonlinear optical materials, such as CuO chain compounds,<br />
Ag2S–CdS nanocomposites, organic coated quantum dots, metal<br />
clusters, etc., yielded values <strong>of</strong> order <strong>of</strong> 10 −9 to 10 −14 m/W for<br />
nonlinear absorption coefficient at a wavelength <strong>of</strong> 532 nm [30,31].<br />
The two photon absorption coefficient <strong>of</strong> TiO2 nanocrystals is reported<br />
to be 14 cm/GW at 532 nm <strong>and</strong> these values are comparable<br />
to the value <strong>of</strong> β obtained for nanocomposites in the<br />
present investigation [29]. Thus, the nonlinear absorption coefficient<br />
<strong>and</strong> nonlinear refractive index measured by the z scan technique<br />
reveals that the ZnO–TiO2 nanocomposites investigated in<br />
the present study have good nonlinear optical response <strong>and</strong> could<br />
be chosen as ideal c<strong>and</strong>idates with potential applications in nonlinear<br />
optics.<br />
Recently, nanomaterials have drawn significant attention as optical<br />
limiters for eyes or for sensor protection from laser terror<br />
in homel<strong>and</strong> or agile laser threats on the battlefield [32]. Also,<br />
the nonlinear optical properties <strong>of</strong> nanomaterials are <strong>of</strong> great interest<br />
for optical switching, pulse power shaping <strong>of</strong> OPO (optical<br />
parametric oscillator)/OPG (optical parametric generator), <strong>and</strong><br />
other nonlinear optical applications. Optical power limiting is operated<br />
through the nonlinear optical processes <strong>of</strong> nanomaterials.<br />
However, the great potentials <strong>of</strong> nanomaterials as optical power<br />
limiters have just begun to be recognized.<br />
To examine the viability <strong>of</strong> ZnO–TiO2 nanocomposites as optical<br />
limiters, the nonlinear transmission <strong>of</strong> the colloid is studied as<br />
a function <strong>of</strong> input fluence. An important term in the optical limiting<br />
measurement is the limiting threshold. It is obvious that the<br />
lower the optical limiting threshold, the better the optical limiting<br />
material. Optical limiters are devices that transmit light at low<br />
input fluences or intensities, but become opaque at high inputs.<br />
The optical limiting property occurs mostly due to absorptive nonlinearity<br />
which corresponds to the imaginary part <strong>of</strong> third order<br />
susceptibility [33]. Fromthevalue<strong>of</strong>fluenceatfocus,thefluence<br />
values at other positions could be calculated using the st<strong>and</strong>ard<br />
equations for Gaussian beam waist. Such plots represent a better<br />
comparison <strong>of</strong> the nonlinear absorption or transmission in these<br />
samples <strong>and</strong> are generated from z scan traces. Fig. 6 illustrates the


