QMM - DDCE, Utkal University, Bhubaneswar
QMM - DDCE, Utkal University, Bhubaneswar
QMM - DDCE, Utkal University, Bhubaneswar
You also want an ePaper? Increase the reach of your titles
YUMPU automatically turns print PDFs into web optimized ePapers that Google loves.
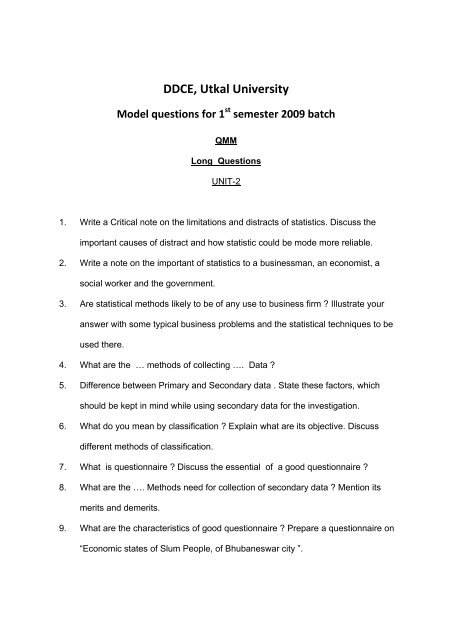
<strong>DDCE</strong>, <strong>Utkal</strong> <strong>University</strong><br />
Model questions for 1 st semester 2009 batch<br />
<strong>QMM</strong><br />
Long Questions<br />
UNIT-2<br />
1. Write a Critical note on the limitations and distracts of statistics. Discuss the<br />
important causes of distract and how statistic could be mode more reliable.<br />
2. Write a note on the important of statistics to a businessman, an economist, a<br />
social worker and the government.<br />
3. Are statistical methods likely to be of any use to business firm ? Illustrate your<br />
answer with some typical business problems and the statistical techniques to be<br />
used there.<br />
4. What are the … methods of collecting …. Data ?<br />
5. Difference between Primary and Secondary data . State these factors, which<br />
should be kept in mind while using secondary data for the investigation.<br />
6. What do you mean by classification ? Explain what are its objective. Discuss<br />
different methods of classification.<br />
7. What is questionnaire ? Discuss the essential of a good questionnaire ?<br />
8. What are the …. Methods need for collection of secondary data ? Mention its<br />
merits and demerits.<br />
9. What are the characteristics of good questionnaire ? Prepare a questionnaire on<br />
“Economic states of Slum People, of <strong>Bhubaneswar</strong> city ”.
10. What do you mean by classification ? Mention its objectives and requirements.<br />
11. What are different methods of classification ? What is its importance ?.<br />
12. Explain tabulation of statistical data. Describe the rules that serve as a guide in<br />
tabulating the statistical data.<br />
13. What do you mean by tabulation? What are the essentials of good tabulation ?<br />
Also mention its limitation.<br />
14. What is mean by measures of central tendency ? What are the functions of an<br />
average.<br />
15. Find mean , median and node of the following :<br />
X 0-10 10-20 20-30 30-40 40-50 50-60<br />
Y 4 7 12 8 6 2<br />
UNIT-III<br />
1. Define probability. Discuss its importance in business managements.<br />
2. What is the importance of the Bays rate in decision making …..<br />
3. State the Addition and multiplication theory of probability wigh giving switable<br />
examples.<br />
4. Define correlation and explain what are the different methods of finding<br />
correlation.<br />
5. What are the special prop ……...<br />
6. Explain the concept of regression and points out its usefulness in dealing with<br />
business problems.
7. Distinguish between correlation and Re….. analysis and points out their role in<br />
business and economics.<br />
8. Explain what are different pro ……. ?<br />
9. From the following distribution find the … between age and playing habits of<br />
students and regular players.<br />
Age : 15-16 16-17 17-18 18-19 19-20 20-21<br />
No. of students : 200 270 340 360 400 300<br />
R… Players : 150 162 170 180 180 90<br />
10. Calculate corre …. …. Between death and birth rate for the following date<br />
Birth rate : 24 26 32 33 35 30<br />
Death rate : 15 20 22 24 27 24<br />
11. Compute Rank correlation firm the following data.<br />
X : 415 434 420 430 424 428<br />
Y : 330 332 328 331 327 325<br />
12. Ten competitor in a beauty contest are ranked by three judges A, B, C in the<br />
following order.<br />
Judge – A : 1 6 5 10 3 2 49 78<br />
Judge – B : 3 5 8 4 7 10 21 69<br />
Judge – C : 6 4 9 8 1 23 10 57<br />
Use the rank correlation co-coeff…to determine which pair of judges has the<br />
nearest approach to common tastes in beauty :<br />
13. Eight students have obtained the following marks in Accountancy and Economics<br />
calculate fee Rank correction coeffi…
Accountancy X : 25 30 38 22 50 70 30 90<br />
Economics Y : 50 40 60 40 30 20 40 70<br />
14. A computer while calculating the correlation co…. between the variable Z and Y<br />
obtained the following values<br />
N =30, Ex = 120 Ex 2 = 600 Ey =90 Ey 2 =250 EZy =356<br />
It was however later on discovered at the time of checking it had copied down<br />
two pairs of observations as (6,8), (10,5) while actual values (6,10), (8,6)<br />
obtained the current value of correlation coefficient between X and Y.<br />
15. The coefficient of rank correlation of the marks obtained by 10 students in<br />
managerial Economics and <strong>QMM</strong> was found to be 0.5. It was later discovered …<br />
the difference in ranks in two subjects obtained by one of the student was<br />
wrongly taken as 3 instead of it find the current coefficient of rank correlation.<br />
UNIT-IV<br />
1. What is a time series ? What are its main components ? Give illustration for each<br />
of them<br />
2. How a time series can be analysed ?<br />
How time series techniques can be used in forecasting ?<br />
3. Explain the concept of moving average .How do they help measure secular trend<br />
in time series.<br />
4. What are the various methods to compute …. Variation ?
5. Explain meaning of time series analysis. Mention the important components into<br />
which a time series may be analysed. Discus the importance of such analsis in<br />
business.<br />
6. Fit a lineer trend to the following date using least square method. Estimat the<br />
production for the year 2008.<br />
Year : 2003 2004 2005 2006 2007<br />
Production : 18 21 23 27 16<br />
(000 units)<br />
7. Below are given the figures of production (in thared tons) of a sugar factory.<br />
Year : 2001 2002 2003 2004 2005 2006 2007<br />
Production : 72 88 94 85 91 98 90<br />
(i) Fit a straight line tread … least square method.<br />
(ii) What is the monthly increase in production ?<br />
8. Calculate the … trend values by the method of least square for the following …..<br />
data for the last 5 years given below :<br />
Year I quarter II quarter III quarter IV quarter<br />
2003 60 80 72 68<br />
2004 68 104 100 88<br />
2005 80 116 108 96<br />
2006 108 152 136 124<br />
2007 160 184 172 164<br />
9. Fit an equation of the form Y = a+bx + cx 2 to the data given below.<br />
X : 1 2 3 4 5<br />
Y : 25 28 33 39 46<br />
Also estimate X = 6.
10. Discuss briefly the importance of time series analysis in business and<br />
economics. What are the component of time series ? Give an example of each<br />
component.<br />
11. The following are the annual profit in thousands of rupees in an industrial area.<br />
Year : 2000 2001 2002 2003 2004 2005 2006<br />
Profit (000Rs.): 65 77 80 70 89 95 102<br />
Use method of least …. to estimate in profit in 2007 and 2008.<br />
12. Calculate (i) three yearly (ii) five yearly morning average for the following data<br />
and comment on the result.<br />
Year : 1999 2000 2001 2002 2003 2004 2005 2006 2007<br />
Y : 242 250 252 249 253 255 251 257 265<br />
13. Compute seasonal Index for the following data assuming that there is no need to<br />
be adjust the data for the trend :<br />
Quarter 2002 2003 2004 2005 2006 2007<br />
1 3.5 3.5 3.5 4.0 4.1 4.2<br />
2 3.9 4.1 3.9 4.6 4.4 4.6<br />
3 3.4 3.7 3.7 3.8 4.2 4.3<br />
4 3.6 4.8 4.0 4.5 4.5 4.7<br />
14. Using Ratio to trend method determine the quarterly seasonal Indices for the<br />
following data :<br />
Production of Coal (in tons)<br />
Year 1 st Q 2 nd Q 3 rd Q 4 th Q<br />
1 68 60 61 63<br />
2 70 58 56 60<br />
3 68 63 68 67<br />
4 65 56 56 62<br />
5 60 55 55 58
15. Calculate seasonal Indices by the “ratio to moving average” from the following<br />
data.<br />
Year 1 st Q 2 nd Q 3 rd Q 4 th Q<br />
2005 68 62 61 63<br />
2006 65 58 66 61<br />
2007 68 63 63 67<br />
Short Question (5 marks)<br />
UNIT-II<br />
1. What is the importance of statistics to businessman ?<br />
2. Distinguish between Primary and Secondary data.<br />
3. What are the merits and demerits of Secondary Data.<br />
4. What is Direct Personal Investigation ? When is it used ?<br />
5. What do you mean by Indirect Personal Investigation ? When is it used ?<br />
6. Distinguish between questionnaire and Schedule.<br />
7. Write are Points to be kept in mind while drafting a questionnaire ?<br />
8. What are the main ports of a table ?<br />
9. What are the basic objectives of classification ?<br />
10. What are the chief function of tabulation ?<br />
11. Distinguish between classification and tabulation.<br />
12. The mean and 5.s f 100 observation 50 and 10 respectively. Later on it was<br />
bound that one item 50 who misread as 15. Find corrected mean and 5.D.
13. Locate the missing frequency.<br />
Given X = 33<br />
X : 5 15 25 35 45 55<br />
Y : 5 10 25 30 - 10<br />
14. The number 3.2, 5.8, 7.9 and 4.5 have<br />
Frequencies x, (x+2), (x-3) and (x+6)<br />
Respectively If mean is 4.867<br />
Find the value of x.<br />
15. The mean salary of employees of a company was Rs.20,000.The mean yearly<br />
salary of male and female employees were Rs.20,800 and Rs.160,800<br />
respectively. Find out the percentages of males and females employed by the<br />
company.<br />
UNIT-III<br />
1. A shooter is known to hit the target in 4 out of 5 shots, where as another shooter<br />
is known to hit the target in 3 out of 4 shots. Find the probably lf the target being<br />
hit all when both of them try.<br />
2. A bag contains 25 balls numbered 1 to 25. One ball is drawn at random. What is<br />
the probability that the number of the drawn ball will be multiple of 3 or 5.<br />
3. Probability that a man will alive 25 years hence is 0.3 and the probability that his<br />
wife will be alive 25 years hence 0.4. Find the prob. That 25 years hence.<br />
(i) Both will be alive<br />
(ii) Only the man will be alive<br />
(iii) None will be alive<br />
(iv) Only the women will be alive<br />
4. The Probability that a contractor will get a …… is 2/3 and the probability that he<br />
will not get an electric contract is 5/9.If the probability getting at least one<br />
contract is 4/5.What is the Prob. that he will get both the contract.
5. Define the concept of conditional probability and independe… event.<br />
6. The following table gives the details of the consumer …… for new product to be<br />
introduced in the market .<br />
No. of consumers<br />
Like Dislike Neural<br />
Male : 500 250 125<br />
Female: 200 350 75<br />
What is the probability that consumer selected at random from the group will be<br />
(a) A male who dislike the product.<br />
(b) One who like the product, given that the person is a fe…..<br />
7. A bag contains four balls. Two balls are drawn at random and are found to be<br />
white. What is the Prob. That all the balls are white.<br />
8. Given the following inter…… xy=0.8, Σxy = 60, 6y=2.5<br />
Σx2=90, where x and y are deviations from the respective means. Find the<br />
number of items(n).<br />
9. What are the assumptions o correlation Coeth….<br />
10. What do you mean by probable error? What are the uses of Probable Error ?<br />
11. Explain the difference between Korl Peasons Correlation and rank correlation.<br />
12. What are advantages of speerma…. Yank correlation and Karl Pressurs condit…<br />
Coeffre….<br />
13. Explain rank correlation ? When is it preferred to Korl’s Pearson coetticients of<br />
correlations.<br />
14. The coeth…. Of rank correlation between two variables is 7/11. The sum of<br />
sqares of difference in rank is 60. Find out what is the number of Variables.<br />
15. Explain the concept of regression to analysis. What are its utility in Business
Short Questions<br />
UNIT – IV<br />
1. What are the objectives of Time Series analysis ?<br />
2. What are the uses of secular trend ?<br />
3. What are the uses of seasonal vari…… ?<br />
4. What are the uses of Cyclical vaiati…….<br />
5. Distinguish between cyclical and seasonal variation.<br />
6. Discuss the relative merits and demerits of tree hand curve method for studing<br />
trend.<br />
7. Explain the principles of doest square. How is it used in trend fitting . What are<br />
the merits and demerits ?<br />
8. What are the advantages and disadvantages of moving average method of trend<br />
fitting ?<br />
9. Why are moving average calculated in analyzing a time series.<br />
10. What do you mean seasonal Indices ? What methods are used to determine<br />
them ?<br />
11. The quarterly seasonal Indices of freight movements on a railway line are given<br />
below.<br />
Quarter : I II III IV<br />
IS : 70 110 100 120<br />
If the total frught for the first … of 2008 is 4,50,000 toaaes. Calenlat.. the trattic<br />
to be expected in remaining …. (assure that there is no tred).
12. ……nalise the following data with the help of the seasonal data given below :<br />
Month : 1 st 2 nd 3 rd 4 th 5 th 6 th<br />
Cash below : 360 400 550 360 350 550<br />
(000 Rs.)<br />
S.I. : 120 80 110 90 70 100<br />
13. The seasonal Indices of the sale of germents of a particular type in a certain<br />
shop are given below :<br />
Quarter : I II III IV<br />
S.I. : 97 85 83 135<br />
It the total sales in the 1 st Quarter of a year be worth Rs.15,000 and sales are<br />
expected to rise by 4% in each quarter, determine how much worth of germents<br />
of this type be kept in stock by the slop owner to meet the …. For each of three<br />
quarters of the year.<br />
14. The sale of a company rose from Rs.60,000 in the month of August to Rs.69,000<br />
in month of September. The seasonal Indices for these two months are 105 and<br />
140 respectively. The owner of the company was not at all satisfied with the rise<br />
of sales in the north of September by Rs.9,000. He expected much more<br />
because of the seasonal Indices for that month . What was his estimate of sales<br />
for the month of the September.<br />
15. On the basis of quarterly sales( In Rs.Lakh) of a certain commodity for year 2003<br />
-2008 the following calculations were mode :<br />
Y = 25 +0.6 t, with the origin at 1 st Quarter of 2003.<br />
Quarter : 1 st 2 nd 3 rd 4 th<br />
S I : 90 95 110 105<br />
Estimate the quarterly sales for the year 2005.<br />
16. What do you mean by Delphi technique ? What are its advantages and<br />
disadvantages ?<br />
17. What do you mean by jury of opinion techniques ? What are its merits and<br />
demerits ?<br />
18. What do you understand by “Depersonalization data” ? Explain by means of<br />
example.
19. Explain exponential smoothing technique. How to find out forest errors … giving<br />
suitable examples ?<br />
20. Find NAD, MSE (L=0.6) from the following data<br />
L=0.5<br />
Year : 1 2 3 4 5 6 7 8 9<br />
Sales : 25 22 23 19 27 27 29 30 35<br />
(000)<br />
Choose which smoothing constant is best and why.<br />
************************


