EROSION OF A COAST NEARBY THE RIVER MOUTH
EROSION OF A COAST NEARBY THE RIVER MOUTH
EROSION OF A COAST NEARBY THE RIVER MOUTH

You also want an ePaper? Increase the reach of your titles
YUMPU automatically turns print PDFs into web optimized ePapers that Google loves.
Vietnam -Japan Estuary Workshop 2006<br />
August 22 nd -24 th , Hanoi, Vietnam<br />
Abstract<br />
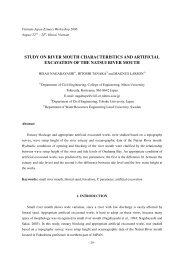
<strong>EROSION</strong> <strong>OF</strong> A <strong>COAST</strong> <strong>NEARBY</strong> <strong>THE</strong> <strong>RIVER</strong> <strong>MOUTH</strong><br />
TAKAO SASAKI 1,*) , TOSHIMITSU TAKAGI 2) , TAKAHIRO HORIGUCHI 3) ,<br />
and KHANH TOAN DAM 4)<br />
1, 2, 3, 4) Department of Coastal Engineering, INA Corporation<br />
1-44-10 Sekiguchi, Bunkyo-ku, Tokyo 112-8668, Japan<br />
*) E-mail: ta-sasak@ina-eng.co.jp<br />
Recently, severe erosion has occurred in the Yokosuka coast (Miyagi Pref., Japan). The aerial<br />
photos shown the landward invasion progress of the shoreline is correspondingly to the reduction of<br />
sandbars in the surf zone (these sandbars are formed by the sediment from Kitakami River). In order to<br />
examine the mechanisms of sediment transport at the Yokosuka coast, a tracer investigation method is<br />
carried out. It has been confirmed that existence of estuary-bound sand drift from the area between<br />
surf zone and shoreline of the estuary.<br />
Keywords: Beach erosion, Estuary sandspits, Sediment transportation, Tracer investigation<br />
1. INTRODUCTION<br />
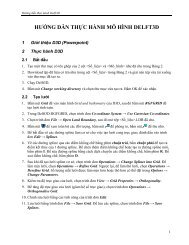
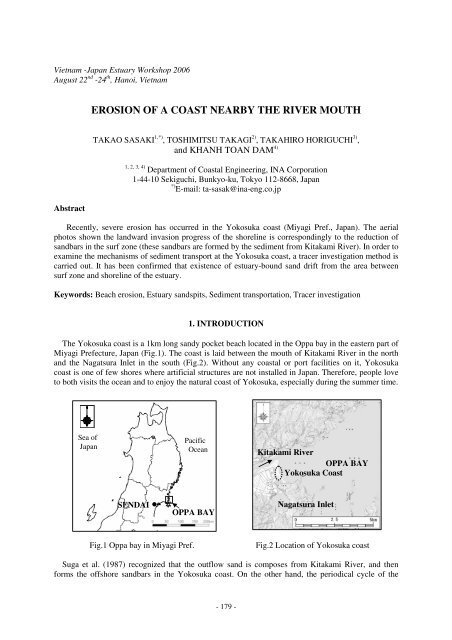
The Yokosuka coast is a 1km long sandy pocket beach located in the Oppa bay in the eastern part of<br />
Miyagi Prefecture, Japan (Fig.1). The coast is laid between the mouth of Kitakami River in the north<br />
and the Nagatsura Inlet in the south (Fig.2). Without any coastal or port facilities on it, Yokosuka<br />
coast is one of few shores where artificial structures are not installed in Japan. Therefore, people love<br />
to both visits the ocean and to enjoy the natural coast of Yokosuka, especially during the summer time.<br />
Sea of<br />
Japan<br />
SENDAI<br />
Pacific<br />
Ocean<br />
OPPA BAY<br />
Fig.1 Oppa bay in Miyagi Pref. Fig.2 Location of Yokosuka coast<br />
Suga et al. (1987) recognized that the outflow sand is composes from Kitakami River, and then<br />
forms the offshore sandbars in the Yokosuka coast. On the other hand, the periodical cycle of the<br />
- 179 -<br />
Kitakami River<br />
OPPA BAY<br />
Yokosuka Coast<br />
Nagatsura Inlet
shoreline changes is a conventional process in this coast. The erosion period stretches from winter to<br />
early spring due to the high wave’s attack to the coast, and then the coast will be regained during the<br />
summer (accretion period). However, after a severely invaded (as much as 100m into the land) during<br />
the winter of 2002 the shoreline does not recover in summer as usual. Hence, a series of investigations<br />
have been conducted recently to examine the mechanism of sediment movement, predict the erosion<br />
tendency, and then seeking for the appropriate solution.<br />
At a beginning stage, the works at Yokosuka coast is mainly focus on data collection and analysis of<br />
existing data, such as aerial photographs, bathymetry, wave and current data, and gain/loss sediment<br />
quantity. To determine the net patterns of sediment movement and their dynamic behavior, a part of<br />
“Sediment Trend Analysis” process named as tracer investigation also have been carried out.<br />
2. CHANGE TENDENCY <strong>OF</strong> SHORELINE<br />
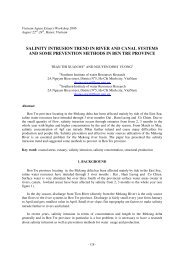
Fig. 3 illustrates the shoreline evolution of Yokosuka coast from 1963 to present, with the reference<br />
shoreline as of the year of 1963 (the oldest available aerial photo of this coast). It is can be seen from<br />
the figure that the shoreline is progressed from 1963 until 1975, since then the erosion became its<br />
steady trend.<br />
CHANGE <strong>OF</strong> SHORELINE(m)<br />
No.1 3<br />
5 7 9<br />
BASED ON May.1963<br />
1975.Nov<br />
2001.Aug<br />
2002.Jul<br />
2004.Oct<br />
2006.Jun<br />
:SHORELINE(1963)<br />
ACCRETION<br />
<strong>EROSION</strong><br />
1963.May.12<br />
1975.Nov.25<br />
2001.Aug.3<br />
2002.Jul.12<br />
2004.Oct.7<br />
2006.Jun.29<br />
100 200 -100 基準時期:1963年 5月 水深: 0m 0<br />
Fig.4 Cross section of depth changes<br />
-200 -300 -400<br />
DISTANCE <strong>OF</strong> ALONGSHORE(m)<br />
Fig.3 Shoreline evolution of Yokosuka coast Fig.5 Sand volume changes<br />
(Based on May 1963) (Based on March 2005)<br />
-80 -40 40 080 160 2005.Mar~2005.Nov<br />
-80 -40 40 80<br />
-160 -80 080 160 VOLUME(10 3m 3)2005.Mar~2006.May<br />
1 3 5 7 9 LINE(No.) TOTAL TOTAL VOLUME(10 3m 3) :NET<br />
-<br />
) 2000 1500 1000 500 0<br />
180 -<br />
DISTANCE(m)<br />
ELEVATION(T.P.m)<br />
+4.0<br />
+2.0<br />
+0<br />
+4.0<br />
+2.0<br />
0<br />
-2.0<br />
-4.0<br />
-6.0<br />
-8.0<br />
ACCRETION<br />
No.1<br />
<strong>EROSION</strong><br />
No.7<br />
2005.Mar<br />
-2005.Nov<br />
2005.Mar<br />
-2006.May<br />
0 500 0 500<br />
<strong>OF</strong>F SHORE DISTANCE (m)<br />
:T.P.-4m≦h :T.P.-9m≦h
In July 2002, an extremely large volume of discharge from the Kitakami River flushed off the sandspits<br />
of the estuary; as a result, the shoreline eroded dramatically. Although the estuary sandspits<br />
began to form again after the flush, the shoreline eroded 140m as of June of 2006 (the average erosion<br />
amount is 72m from 1963 to 2006).<br />
It was recognized from survey results (conducted at three different times) that a massive sandbars<br />
had been developed from March to November of 2005, at 500m offshore area. However, the sandbars<br />
reduced rapidly and moved toward the estuary (Fig.4). Volume changes calculation results shown that<br />
an amount of 120,000m3 of sediment volume is lost during a period of 8 months (from March to<br />
November 2005). In the next 6 months (from November 2005 to May 2006), 60,000m3 of sediment<br />
was recovered. (Fig.5)<br />
3. ANALYSIS <strong>OF</strong> <strong>EROSION</strong> FACTORS<br />
Fig. 6 illustrates the observation location of river flow<br />
discharge (at Tome) and the wave data station (at Enoshima<br />
Island). Exerting forces that influences topographic changes of<br />
Yokosuka Coast are summarized in Fig.7<br />
According to the figure, the erosion accelerated in June 2002<br />
coincides with large discharge from Kitakami River. On the<br />
other hand, high significant wave height (which exceeds 4m) is<br />
frequently occurs at the same time. It convinced that the severe<br />
erosion, which began in 2002 is caused by either unusually<br />
large volume of discharge from the Kitakami River or/and high<br />
waves, because there is almost no sand dredging had been done.<br />
KITAKAMI<br />
<strong>RIVER</strong><br />
Fig.6 Observation location<br />
20 40 60 80 100WAVE(ENOSHIMA,H1/3≧4m)<br />
TOTAL TIME(HOUR) 0<br />
100 200SAND VOLUME(<strong>RIVER</strong><strong>MOUTH</strong>,1996 ~) :-0.8~-0.6km,:-0.6~-0.4km,:-0.4~-0.2km 0 20 40 60 80 100 120 140FLOWING DISCHARGE(TOME,Q≧2000m3/s) :8m
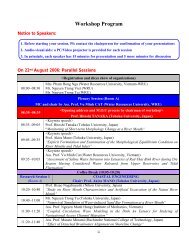
4. TRACER INVESTIGATION<br />
A tracer investigation method was conducted in order to examine the net patterns of sand movement<br />
at the shoreline of Yokosuka coast. 1m3 of color sand with D50=0.55mm is used (Fig.8). The sample<br />
color sands are dumped at the “injection point” at the shoreline on March 22, 2006. Sampling sands<br />
were collected at 31 points in a range of 2,000m along the shoreline in every two weeks. Fig.9 shows<br />
the wave condition during the investigation (at Enoshima Island), and the timeline of sampling pickup.<br />
Color sand was found at the north side of the dumping point at the first and the second samplings<br />
(Fig.10). Since there was no color sand found from the areas of south side of the dumping point, it was<br />
assumed that the littoral drift is moving toward the North.<br />
WAVE HEIGHT(m)<br />
Fig.8 Sampling color sand (D50=0.55mm) 1 2cm 0<br />
Injection 1 st time 2 nd time 3 rd time<br />
Fig .9 Wave condition<br />
:H1/3 :T1/3<br />
during<br />
WAVE(ENOSHIMA)<br />
investigation 1 20 301 10 20 1 10 20 30 30 10 012345<br />
16<br />
2006.Mar Apl May 3104812<br />
10FIRST(2006.Apr.5 INJECTION 5 ) ) POINT(2006.Mar.22) 10SECOND(2006.Apr.20 :COLOR SAND<br />
1200 05 10THIRD(2006.May.13 ) NUMBER <strong>OF</strong> PARTICLE :PICK UP POINT<br />
05<br />
FROM INJECTION POINT (m) NOT DETECTED 800 400 0 -400 -800 DISTANCE<br />
- 182 -<br />
INJECTION POINT<br />
Fig.10 Layout and results of tracer investigation<br />
WAVE PERIOD(s)
5. CONCLUSIONS<br />
From the above-mentioned investigations, the mechanism of erosion of Yokosuka coast after the<br />
year 2002 can be summarized as follows:<br />
• Flood of June 2002 flushed sandspits and adjacent sediment from the estuary.<br />
• By high waves, this occurred frequently after the year 2002, sediment was flown out to the<br />
offshore area and formed submerged sandbars. The high waves also smoothed the crest of<br />
sandspits at the estuary, and moved the sandspits into the estuary.<br />
• Reformed estuary’s sandspits was consisted of extracted sand from the adjacent area of<br />
Yokosuka coast, and it accelerated the erosion of the shoreline.<br />
6. ACKNOWLEGEMENTS<br />
This work is a part of a contract project titled “Countermeasure of Erosion in Yokosuka Coast”,<br />
managed by Ishinomaki Office, Miyagi Prefecture. The authors would like to express their<br />
appreciation to Professor Tanaka Hitoshi for his advices and guidance.<br />
7. REFERENCES<br />
Suga K., Ishikawa T., Nadaoka K., and Tanaka H.(1987). Formation of sand terrace in front of a<br />
river mouth and its decline. Journal of the Japan Society of Civil Engineering (JSCE), No.381/II-7,<br />
227-230.<br />
- 183 -