
You also want an ePaper? Increase the reach of your titles
YUMPU automatically turns print PDFs into web optimized ePapers that Google loves.
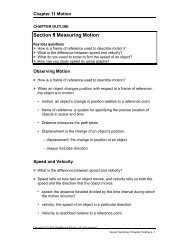
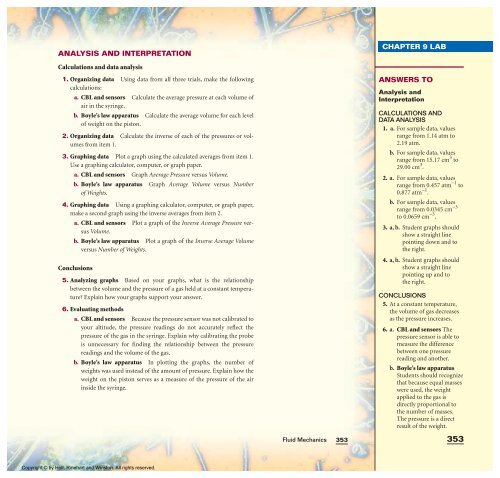
ANALYSIS AND INTERPRETATION<br />
Calculations and data analysis<br />
1. Organizing data Using data from all three trials, make the following<br />
calculations:<br />
a. CBL and sensors Calculate the average pressure at each volume of<br />
air in the syringe.<br />
b. Boyle’s law apparatus Calculate the average volume for each level<br />
of weight on the piston.<br />
2. Organizing data Calculate the inverse of each of the pressures or volumes<br />
from item 1.<br />
3. Graphing data Plot a graph using the calculated averages from item 1.<br />
Use a graphing calculator, computer, or graph paper.<br />
a. CBL and sensors Graph Average Pressure versus Volume.<br />
b. Boyle’s law apparatus Graph Average Volume versus Number<br />
of Weights.<br />
4. Graphing data Using a graphing calculator, computer, or graph paper,<br />
make a second graph using the inverse averages from item 2.<br />
a. CBL and sensors Plot a graph of the Inverse Average Pressure versus<br />
Volume.<br />
b. Boyle’s law apparatus Plot a graph of the Inverse Average Volume<br />
versus Number of Weights.<br />
Conclusions<br />
5. Analyzing graphs Based on your graphs, what is the relationship<br />
between the volume and the pressure of a gas held at a constant temperature?<br />
Explain how your graphs support your answer.<br />
6. Evaluating methods<br />
a. CBL and sensors Because the pressure sensor was not calibrated to<br />
your altitude, the pressure readings do not accurately reflect the<br />
pressure of the gas in the syringe. Explain why calibrating the probe<br />
is unnecessary for finding the relationship between the pressure<br />
readings and the volume of the gas.<br />
b. Boyle’s law apparatus In plotting the graphs, the number of<br />
weights was used instead of the amount of pressure. Explain how the<br />
weight on the piston serves as a measure of the pressure of the air<br />
inside the syringe.<br />
Copyright © by Holt, Rinehart and Winston. All rights reserved.<br />
<strong>Fluid</strong> <strong>Mechanics</strong><br />
353<br />
CHAPTER XX 9 LAB LAB<br />
ANSWERS TO<br />
Analysis and<br />
Interpretation<br />
CALCULATIONS AND<br />
DATA ANALYSIS<br />
1. a. For sample data, values<br />
range from 1.14 atm to<br />
2.19 atm.<br />
b. For sample data, values<br />
range from 15.17 cm 3 to<br />
29.00 cm 3 .<br />
2. a. For sample data, values<br />
range from 0.457 atm −1 to<br />
0.877 atm −1 .<br />
b. For sample data, values<br />
range from 0.0345 cm −3<br />
to 0.0659 cm −3 .<br />
3. a, b. Student graphs should<br />
show a straight line<br />
pointing down and to<br />
the right.<br />
4. a, b. Student graphs should<br />
show a straight line<br />
pointing up and to<br />
the right.<br />
CONCLUSIONS<br />
5. At a constant temperature,<br />
the volume of gas decreases<br />
as the pressure increases.<br />
6. a. CBL and sensors The<br />
pressure sensor is able to<br />
measure the difference<br />
between one pressure<br />
reading and another.<br />
b. Boyle’s law apparatus<br />
Students should recognize<br />
that because equal masses<br />
were used, the weight<br />
applied to the gas is<br />
directly proportional to<br />
the number of masses.<br />
The pressure is a direct<br />
result of the weight.<br />
353