North American Oil Sands: History of ... - The Air University
North American Oil Sands: History of ... - The Air University
North American Oil Sands: History of ... - The Air University

Create successful ePaper yourself
Turn your PDF publications into a flip-book with our unique Google optimized e-Paper software.
CRS-20<br />
nonconventional oil from Canada because <strong>of</strong> its refinery capabilities. Several U.S.based<br />
refinery expansions have been announced that would come online between<br />
2007-2015. If Canada were to reach its optimistic forecasted oil sands output level<br />
<strong>of</strong> 5 mbd in 2030, and maintained its export level to the United States at around 90%,<br />
it would be exporting about 4.5 mbd to the United States. This would mean that<br />
imports from Canada would reach nearly 30% <strong>of</strong> all U.S. crude oil imports. U.S.<br />
refinery capacity is forecast to increase from 16.9 mbd in 2004 to nearly 19.3 mbd<br />
in 2030, 61 a 2.4 mbd increase — significant but perhaps not enough to accommodate<br />
larger volumes <strong>of</strong> oil from Canada, even if refinery expansions would have the<br />
technology to process heavier oil blends. Canada is pursuing additional refinery<br />
capacity for its heavier oil.<br />
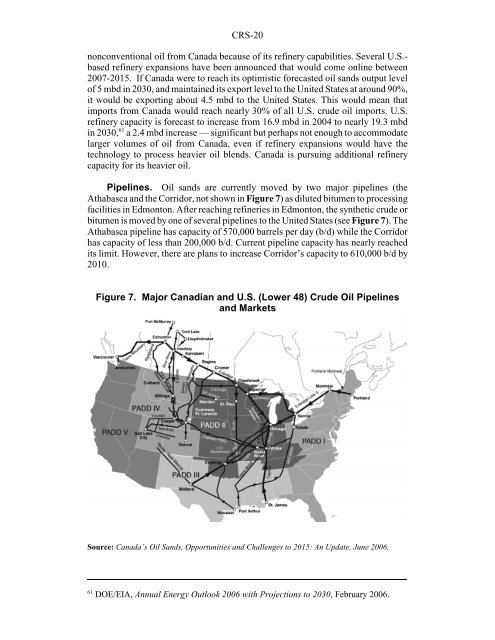
Pipelines. <strong>Oil</strong> sands are currently moved by two major pipelines (the<br />
Athabasca and the Corridor, not shown in Figure 7) as diluted bitumen to processing<br />
facilities in Edmonton. After reaching refineries in Edmonton, the synthetic crude or<br />
bitumen is moved by one <strong>of</strong> several pipelines to the United States (see Figure 7). <strong>The</strong><br />
Athabasca pipeline has capacity <strong>of</strong> 570,000 barrels per day (b/d) while the Corridor<br />
has capacity <strong>of</strong> less than 200,000 b/d. Current pipeline capacity has nearly reached<br />
its limit. However, there are plans to increase Corridor’s capacity to 610,000 b/d by<br />
2010.<br />
Figure 7. Major Canadian and U.S. (Lower 48) Crude <strong>Oil</strong> Pipelines<br />
and Markets<br />
Source: Canada’s <strong>Oil</strong> <strong>Sands</strong>, Opportunities and Challenges to 2015: An Update, June 2006.<br />
61 DOE/EIA, Annual Energy Outlook 2006 with Projections to 2030, February 2006.