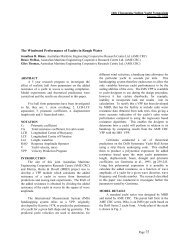
Analysisof flow around an RS:X racing 66 windsurfing fin - Centre for ...
Analysisof flow around an RS:X racing 66 windsurfing fin - Centre for ...
Analysisof flow around an RS:X racing 66 windsurfing fin - Centre for ...

Create successful ePaper yourself
Turn your PDF publications into a flip-book with our unique Google optimized e-Paper software.
Analysis of <strong>flow</strong> <strong>around</strong> <strong>an</strong> <strong>RS</strong>: X Racing <strong>66</strong><br />
<strong>windsur<strong>fin</strong>g</strong> <strong>fin</strong>.<br />
Report <strong>for</strong> staff in the Department of Applied Physics,<br />
Curtin University of Technology<br />
Written by:<br />
Ketesse H<strong>an</strong>sen<br />
(Student identification: 13937832)<br />
Supervisors:<br />
Dr Tim Gourlay<br />
Dr Andrew King<br />
Submitted 17 th October, 2011<br />
Curtin University of Technology<br />
Perth, Western Australia
Abstract<br />
The behaviour of fluid <strong>flow</strong>ing past a <strong>RS</strong>:X Racing <strong>66</strong> <strong>windsur<strong>fin</strong>g</strong> <strong>fin</strong> at different<br />
<strong>an</strong>gles of attack was studied both computationally <strong>an</strong>d experimentally.<br />
This was achieved by creating a three dimensional computational model of the <strong>fin</strong>,<br />
which was both used to produce a physical model <strong>for</strong> experimental testing, <strong>an</strong>d as<br />
the basis <strong>for</strong> <strong>an</strong>alysis using the fluid <strong>an</strong>alysis program, OpenFOAM.<br />
The experimental <strong>an</strong>alysis of the <strong>flow</strong> was per<strong>for</strong>med in the Curtin wind tunnel, <strong>an</strong>d<br />
the results from these experiments were then compared against the results of the<br />
computational fluid <strong>an</strong>alysis.<br />
The effects compared were <strong>flow</strong> separation, cross <strong>flow</strong> <strong>an</strong>d tip vortices.<br />
2
Contents<br />
Abstract ......................................................................................................................... 2<br />
Contents ........................................................................................................................ 3<br />
List of Figures................................................................................................................. 5<br />
List of Tables ................................................................................................................ 10<br />
1. Introduction......................................................................................................... 11<br />
2. Background .......................................................................................................... 12<br />
2.1. Foils ............................................................................................................. 12<br />
2.2.1. NACA foils ............................................................................................ 12<br />
2.2.2. NACA 6 series ...................................................................................... 13<br />
2.2.3. <strong>RS</strong>: X Racing <strong>66</strong> Sailboard Fin .............................................................. 16<br />
2.2.4 Consequences of similarity to NACA 65-009 ...................................... 18<br />
2.3 Computational Fluid Dynamics (CFD)...................................................... 18<br />
3. Computer generated model ................................................................................ 19<br />
3.1. Measuring the Fin ....................................................................................... 19<br />
3.1.1. Coordinate System .............................................................................. 24<br />
3.2. Comparison to NACA foil sections .............................................................. 25<br />
3.3. Leading Edge Radius .................................................................................... 28<br />
3.4. Trailing Edge ................................................................................................ 34<br />
3.5. AutoCAD ...................................................................................................... 35<br />
3.6. STL Files ....................................................................................................... 38<br />
4. Experimental Analysis ......................................................................................... 39<br />
4.1. Wind Tunnel ................................................................................................ 40<br />
4.1.1 Dynamic Similarity ...................................................................................... 40<br />
4.1.2 Required test speed r<strong>an</strong>ge ......................................................................... 41<br />
4.1.3 Boundary layer thickness: wind tunnel <strong>flow</strong> .............................................. 42<br />
4.1.4 Boundary layer thickness ........................................................................... 43<br />
4.1.5 The expected lift <strong>for</strong>ce acting on model inside the wind tunnel ............... 44<br />
4.2. Rapid Prototyper ......................................................................................... 50<br />
4.3. Tell Tales ...................................................................................................... 51<br />
4.4. Experimental procedure.............................................................................. 52<br />
4.4.1 Experimental set up ................................................................................... 52<br />
4.4.2 Experimental results................................................................................... 57<br />
4.4.3 Application of experimental results to full-scale model ............................ 65<br />
5. Computational Analysis ....................................................................................... <strong>66</strong><br />
5.1. XFOIL ............................................................................................................ <strong>66</strong><br />
5.1.1 Boundary layer <strong>an</strong>alysis using XFOIL .......................................................... <strong>66</strong><br />
5.1.2 Reynolds <strong>an</strong>d Mach numbers of the wind tunnel <strong>flow</strong> .............................. 67<br />
5.1.3 Boundary layer <strong>an</strong>d pressure distribution ................................................. 68<br />
5.2. OpenFOAM .................................................................................................. 72<br />
5.3. Computational procedure ........................................................................... 73<br />
5.2.1 Pre-processing ............................................................................................ 73<br />
5.2.2 Processing ................................................................................................... 73<br />
5.2.3 Post-processing .......................................................................................... 74<br />
5.4. Computational results ................................................................................. 74<br />
5.3.1 Comparison to experimental results .......................................................... 74<br />
5.3.2 Computational results <strong>for</strong> <strong>racing</strong> speed applications ................................ 80<br />
3
5.3.3 Conclusions based on computational results ............................................ 88<br />
6. Comparison of results to results expected <strong>for</strong> a NACA 65-009 .......................... 88<br />
7. Conclusion ........................................................................................................... 89<br />
8. Future Work ........................................................................................................ 90<br />
9. Acknowledgements ............................................................................................. 90<br />
10. Nomenclature.................................................................................................. 90<br />
11. References ....................................................................................................... 91<br />
12. Bibliography .................................................................................................... 94<br />
13. Appendix ......................................................................................................... 95<br />
13.1. Matlab Code ............................................................................................ 95<br />
13.1.1 mysolvemissing.m .................................................................................... 95<br />
13.1.2 interpPoints.m .......................................................................................... 95<br />
4
List of Figures<br />
Figure 1: Cambered foil…………………………………………………………………………………………..12<br />
Figure 2: Typical method of writing NACA 6-series foil……………………………………………13<br />
Figure 3: NACA 6-series designation <strong>for</strong> foils with thickness/chord ratios of less th<strong>an</strong><br />
12%, <strong>an</strong>d the low-drag r<strong>an</strong>ge omitted…………………………………………………………………….15<br />
Figure 4: <strong>RS</strong>: X Men’s Sailboard……………………………………………………………………………….16<br />
Figure 5: Men’s <strong>RS</strong>: X Racing <strong>66</strong> <strong>fin</strong> (side A)…………………………………………………………….17<br />
Figure 6: The wind acting on the sail causes the board to move at <strong>an</strong> <strong>an</strong>gle to the<br />
heading, <strong>an</strong>d this is the <strong>an</strong>gle of attack of the <strong>flow</strong> with respect to the <strong>fin</strong>. (Not to<br />
scale)………………………………………………………………………………………………………………………17<br />
Figure 7: 5mm intervals along y-displacements alpha, bravo <strong>an</strong>d charlie, <strong>fin</strong> side<br />
A…………………………………………………………………………………………………………………….……….20<br />
Figure 8: XZ cross section (y-displacement alpha), shown here on axes of unequal<br />
scale………………………………………………………………………………………………………………………..21<br />
Figure 9: XZ cross sections of y-displacements alpha <strong>an</strong>d bravo………………………………22<br />
Figure 10: Leading edge of the <strong>fin</strong> shown using the excel model of the <strong>fin</strong> viewed in<br />
the XY pl<strong>an</strong>e, shown here on axes of unequal scale…………………….………………………….24<br />
Figure 11: Profile of the <strong>fin</strong> <strong>for</strong> each cross section in terms of the percentage of total<br />
chord length, shown here on axes of unequal scale………………………………………………..26<br />
Figure 12: Profile of the <strong>RS</strong>: X Racing <strong>66</strong> <strong>windsur<strong>fin</strong>g</strong> <strong>fin</strong> compared against several<br />
NACA sections…………………………………………………………………………………………………………27<br />
Figure 13: NACA 65-009 foil section profile compared with the profile of the <strong>RS</strong>: X <strong>66</strong><br />
<strong>windsur<strong>fin</strong>g</strong> <strong>fin</strong> (y-displacement: charlie)………………………………………..………………………28<br />
Figure 14: Leading edge showing measured points a, b <strong>an</strong>d c, which were used to<br />
determine the leading edge radius. Also shown are the associated (calculated)<br />
points describing the surface of the leading edge radius. The above diagram was<br />
produced from the data measured <strong>for</strong> y-displacement delta………………………………….29<br />
Figure 15: Calculation of the leading edge radius……………………………………………………30<br />
Figure 16: Trigonometry used to describe the leading edge radius…………………………30<br />
Figure 17: The adapted <strong>an</strong>d calculated radii <strong>an</strong>d leading edges shown with measured<br />
points a, b <strong>an</strong>d c, <strong>for</strong> cross section foxtrot………………………………………………………………33<br />
5
Figure 18: Trailing edge of the <strong>fin</strong>……………………………………………………………………………35<br />
Figure 19: Top view of the half teardrop produced from the data points of ydisplacement<br />
delta modelled in AutoCAD……………………………………………………………….36<br />
Figure 20: Y-displacements alpha to golf interpolated to have the same number of<br />
data points……………………………………………………………………………………………………………..36<br />
Figure 21: Top view of y-displacement delta modelled in AutoCAD…………………………37<br />
Figure 22: All cross sections shown in the XY pl<strong>an</strong>e, as modelled in AutoCAD………...37<br />
Figure 23: Finished three-dimensional model of the <strong>RS</strong>: X Racing <strong>66</strong> <strong>windsur<strong>fin</strong>g</strong> <strong>fin</strong>,<br />
as modelled in AutoCAD, with data points showing………………………………………………..38<br />
Figure 24: Attached tell tale behaviour. (Cropped from photo #8361)…………………….39<br />
Figure 25: Separated tell tale behaviour. (Cropped from photo #8369)………………..…39<br />
Figure 26: Leading edge of the <strong>fin</strong> with trapezoid using y-displacements bravo <strong>an</strong>d<br />
charlie, <strong>an</strong>d shown here using the excel model of the <strong>fin</strong> viewed in the XY pl<strong>an</strong>e,<br />
shown here on axes of unequal scale………………………………………………………………………46<br />
Figure 27: Lift coefficient <strong>for</strong> the <strong>fin</strong>, due to the <strong>fin</strong>ite sp<strong>an</strong>, shown <strong>for</strong> <strong>an</strong>gles from 0-<br />
20 o . It should be noted that the values <strong>for</strong> the lift coefficient shown above assume<br />
the <strong>flow</strong> has not yet separated……………………………………………………………………………….46<br />
Figure 28: 3D printer: ZPrinter 450…………………………………………………………………………50<br />
Figure 29: Proposed tuft attachment locations as a percentage of the total chord <strong>for</strong><br />
each cross section…………………………………………………………………………………………………..51<br />
Figure 30: Model <strong>fin</strong> with tell tales attached at 10%, 50%, <strong>an</strong>d 90% of the chord of<br />
model y-displacements bravo, charlie, echo <strong>an</strong>d golf. (IMAG0146)…………………………52<br />
Figure 31: Model mounted between two blocks. (Photo #0083)…………………………….53<br />
Figure 32: Model mounted with steel plate to prevent recirculation. (Photo<br />
#8378)…………………………………………………………………………………………………………………….54<br />
Figure 33: Diagram of a Pitot tube…………………………………………………………………………..54<br />
Figure 34: M<strong>an</strong>ometer used to show the pressure difference measured by the Pitot<br />
tube……………………………………………………………………………………………………………………..…55<br />
6
Figure 35: Fin model oriented at 10 o to the <strong>flow</strong>, with wind speed of 14.6 ms -1 .<br />
(Photo #8313)………………………………………………………………………………………………………..58<br />
Figure 36: Fin model oriented at 12 o to the <strong>flow</strong>, with wind speed of 14.6 ms -1 .<br />
(Photo #8318)………………………………………………………………………………………………………..58<br />
Figure 37: Fin model oriented at 14 o to the <strong>flow</strong>, with wind speed of 14.6 ms -1 .<br />
(Photo #8321)………………………………………………………………………………………………………..59<br />
Figure 38: Fin model oriented at 16 o to the <strong>flow</strong>, with wind speed of 14.6 ms -1 .<br />
(Photo #8338)………………………………………………………………………………………………………..60<br />
Figure 39: Fin model oriented at 8 o to the <strong>flow</strong>, with wind speed of 20.9 ms -1 . (Photo<br />
#8361)…………………………………………………………………………………………………………………..61<br />
Figure 40: Fin model oriented at 10 o to the <strong>flow</strong>, with wind speed of 20.9 ms -1 .<br />
(Photo #8352)………………………………………………………………………………………………………..61<br />
Figure 41: Fin model oriented at 12 o to the <strong>flow</strong>, with wind speed of 20.9 ms -1 .<br />
(Photo #8369)………………………………………………………………………………………………………..62<br />
Figure 42: Fin model oriented at 14 o to the <strong>flow</strong>, with wind speed of 20.9 ms -1 .<br />
(Photo #8378)………………………………………………………………………………………………………..63<br />
Figure 43: Fin model oriented at 16 o to the <strong>flow</strong>, with wind speed of 20.9 ms -1 .<br />
(Photo #8387)………………………………………………………………………………………………………..63<br />
Figure 44 : The boundary layer <strong>an</strong>d distribution of pressure <strong>for</strong> foil cross-section<br />
charlie, determined from a Reynolds number of 1.5x10 6 <strong>an</strong>d a Mach number of 0.076,<br />
when the foil is oriented parallel to the <strong>flow</strong>…………………………………………………………..69<br />
Figure 45: The location of boundary layer tr<strong>an</strong>sition (side 1) <strong>for</strong> the <strong>RS</strong>X <strong>an</strong>d NACA<br />
65-009 foils……………………………………………………………………………………………………………..71<br />
Figure 46: The location of boundary layer tr<strong>an</strong>sition (side 2) <strong>for</strong> the <strong>RS</strong>X <strong>an</strong>d NACA<br />
65-009 foils…………………………………………………………………………………………………………….71<br />
Figure 47: Streamlines showing attached <strong>flow</strong> about cross section charlie <strong>for</strong> a <strong>fin</strong><br />
modelled at 8 o in water <strong>flow</strong>ing at 1.42 ms -1 ……………………………………………..……………75<br />
Figure 48: Streamlines showing leading edge separation at cross section hotel <strong>for</strong> a<br />
<strong>fin</strong> modelled at 8 o in water <strong>flow</strong>ing at 1.42 ms -1 ……………………………………………..………75<br />
Figure 49: Streamlines showing attached <strong>flow</strong> <strong>around</strong> cross section echo, with slight<br />
separation towards the trailing edge <strong>for</strong> at 10 o in water <strong>flow</strong>ing at 1.42 ms -1 …..…….76<br />
7
Figure 50: Streamlines showing leading edge separation at cross section hotel <strong>for</strong> a<br />
<strong>fin</strong> modelled at 10 o in water <strong>flow</strong>ing at 1.42 ms -1 ……………………………………………………76<br />
Figure 51: Streamlines showing attached <strong>flow</strong> <strong>around</strong> cross section bravo, at a 12 o<br />
<strong>an</strong>gle of attack in water <strong>flow</strong>ing at 1.42 ms -1 …………………………………………………………..77<br />
Figure 52: Streamlines showing attached <strong>flow</strong> <strong>around</strong> cross section charlie, at a 12 o<br />
<strong>an</strong>gle of attack in water <strong>flow</strong>ing at 1.42 ms -1 …………………………………………………………..77<br />
Figure 53: Streamlines showing attached <strong>flow</strong> <strong>around</strong> cross section echo, with slight<br />
separation towards the trailing edge at 12 o in water <strong>flow</strong>ing at 1.42 ms -1 ……………….77<br />
Figure 54: Streamlines showing <strong>flow</strong> <strong>around</strong> cross section bravo, at a 14 o <strong>an</strong>gle of<br />
attack in water <strong>flow</strong>ing at 1.42 ms -1 ………………………………………………………………………..78<br />
Figure 55: Streamlines showing <strong>flow</strong> <strong>around</strong> cross section charlie, at a 14 o <strong>an</strong>gle of<br />
attack in water <strong>flow</strong>ing at 1.42 ms -1 ………………………………………………………………………..78<br />
Figure 56: Streamlines showing <strong>flow</strong> <strong>around</strong> cross section echo, with slight<br />
separation towards the trailing edge at 14 o in water <strong>flow</strong>ing at 1.42 ms -1 ………………78<br />
Figure 57: Streamlines showing separated <strong>flow</strong> <strong>around</strong> cross section hotel, at 14 o in<br />
water <strong>flow</strong>ing at 1.42ms -1 ……………………………………………………………………………………….79<br />
Figure 58: Streamlines showing the behaviour of the incoming <strong>flow</strong> at 5ms -1 <strong>an</strong>d 10 o<br />
to the <strong>fin</strong>, across cross-section bravo………………………………………………………………………80<br />
Figure 59: Streamlines showing the behaviour of the incoming <strong>flow</strong> at 5ms -1 <strong>an</strong>d 10 o<br />
to the <strong>fin</strong>, across cross-section charlie…………………………………………………………………….80<br />
Figure 60: Streamlines showing the behaviour of the incoming <strong>flow</strong> at 5ms -1 <strong>an</strong>d 10 o<br />
to the <strong>fin</strong>, across cross-section echo……………………………………………….………………………81<br />
Figure 61: Streamlines showing the behaviour of the incoming <strong>flow</strong> at 5ms -1 <strong>an</strong>d 10 o<br />
to the <strong>fin</strong>, across cross-section hotel……………………………………………………………………….81<br />
Figure 62: Streamlines showing the behaviour of the incoming <strong>flow</strong> at 5ms -1 <strong>an</strong>d 5 o<br />
to the <strong>fin</strong>, across cross-section hotel……………………………………………………………………….81<br />
Figure 63: Streamlines showing the behaviour of the incoming <strong>flow</strong> at 5ms -1 <strong>an</strong>d 16 o<br />
to the <strong>fin</strong>, across cross-section echo, with glyphs (arrows) showing pressure…………82<br />
Figure 64: Streamlines showing the behaviour of the incoming <strong>flow</strong> at 5ms -1 <strong>an</strong>d 20 o<br />
to the <strong>fin</strong>, across cross-section bravo………………………………………………………………………82<br />
Figure 65: Streamlines showing the behaviour of the incoming <strong>flow</strong> at 10ms -1 <strong>an</strong>d<br />
10 o to the <strong>fin</strong>, across cross-section bravo………………………………………………………………..83<br />
8
Figure <strong>66</strong>: Streamlines showing the behaviour of the incoming <strong>flow</strong> at 10ms -1 <strong>an</strong>d<br />
10 o to the <strong>fin</strong>, across cross-section charlie………………………………………………………………83<br />
Figure 67: Streamlines showing the behaviour of the incoming <strong>flow</strong> at 10ms -1 <strong>an</strong>d<br />
10 o to the <strong>fin</strong>, across cross-section echo…………………………………………………………………83<br />
Figure 68: Streamlines showing the behaviour of the incoming <strong>flow</strong> at 10ms -1 <strong>an</strong>d<br />
10 o to the <strong>fin</strong>, across cross-section hotel…………………………………………………………………84<br />
Figure 69: Streamlines showing a region of separation at the leading edge of cross<br />
section bravo <strong>for</strong> the incoming <strong>flow</strong> at 10ms -1 <strong>an</strong>d 20 o with respect to the <strong>fin</strong>……….84<br />
Figure 70: Streamlines showing the behaviour of the incoming <strong>flow</strong> at 15ms -1 <strong>an</strong>d<br />
10 o to the <strong>fin</strong>, across cross-section bravo……………………………………………………………….84<br />
Figure 71: Streamlines showing the behaviour of the incoming <strong>flow</strong> at 15ms -1 <strong>an</strong>d<br />
10 o to the <strong>fin</strong>, across cross-section charlie………………………………………………………………85<br />
Figure 72: Streamlines showing the behaviour of the incoming <strong>flow</strong> at 15ms -1 <strong>an</strong>d<br />
10 o to the <strong>fin</strong>, across cross-section echo…………………………………………………………………85<br />
Figure 73: Streamlines showing the behaviour of the incoming <strong>flow</strong> at 15ms -1 <strong>an</strong>d<br />
10 o to the <strong>fin</strong>, across cross-section hotel…………………………………………………………………85<br />
Figure 74: The <strong>flow</strong> streamlines are affected by the <strong>fin</strong>ite length of foil, causing cross<br />
<strong>flow</strong>…………………………………………………………………………………………………………………………87<br />
Figure 75: Tip vortices <strong>for</strong>ming off of the tip of the <strong>fin</strong>, shown <strong>for</strong> <strong>flow</strong> at 10ms -1 <strong>an</strong>d<br />
20 o ………………………………………………………………………………………………………………………….87<br />
9
List of Tables<br />
Table 1: Displacement (in the y-direction) of each cross section from the top of the<br />
<strong>fin</strong>……………………………………………………………………………………………………………………………25<br />
Table 2: Maximum thickness as a percentage of the chord length of <strong>RS</strong>: X Racing <strong>66</strong><br />
sailboard <strong>fin</strong>…………………………………………………………………………………………………………….25<br />
Table 3: Dist<strong>an</strong>ce of points a, b <strong>an</strong>d c from the leading edge…………………………………..29<br />
Table 4: Points at <strong>an</strong>d near the leading edge, used to determine the radius <strong>for</strong> each<br />
cross section……………………………………………………………………………………………………………32<br />
Table 5: Calculation of the leading edge radius <strong>for</strong> each cross section…………………….33<br />
Table 6: Measurement of trailing edge thickness……………………………………………………34<br />
Table 7: Fluid properties <strong>for</strong> air <strong>an</strong>d water………………………………………………………………41<br />
Table 8: Type of <strong>flow</strong> <strong>for</strong> various Reynolds numbers……………………………………………….42<br />
Table 9: Boundary layer thickness <strong>for</strong> turbulent <strong>flow</strong>……………………………………………..43<br />
Table 10: Lift coefficient <strong>for</strong> each <strong>an</strong>gle of attack……………………………………………………45<br />
Table 11: Lift coefficient <strong>for</strong> in<strong>fin</strong>ite <strong>an</strong>d <strong>fin</strong>ite foil sp<strong>an</strong>s…………………………………………48<br />
Table 12: M<strong>an</strong>ometer readings wind tunnel experiment 1……………………………………..57<br />
Table 13: M<strong>an</strong>ometer readings wind tunnel experiment 2……………………………………..57<br />
Table 14: Equivalent speeds to air speeds tested…………………………………………………….65<br />
Table 15: Location of boundary layer tr<strong>an</strong>sition on the <strong>RS</strong>X characteristic crosssection<br />
as calculated by XFOIL <strong>for</strong> various <strong>an</strong>gles of attack……………………………………..70<br />
Table 16: Location of boundary layer tr<strong>an</strong>sition on the NACA 65-009 as calculated by<br />
XFOIL <strong>for</strong> various <strong>an</strong>gles of attack……………………………………………………………………………70<br />
Table 17: Equivalent velocities <strong>for</strong> computational, experimental <strong>an</strong>d physical<br />
<strong>flow</strong>s……………………………………………………………………………………………………………………….74<br />
10
1. Introduction<br />
The purpose of this report is to examine <strong>an</strong>d discuss the <strong>flow</strong> of water <strong>around</strong> the <strong>RS</strong>:<br />
X Racing <strong>66</strong> sailboard <strong>fin</strong> (similar in <strong>for</strong>m to a NACA 65-009 foil) at different <strong>an</strong>gles of<br />
attack <strong>an</strong>d <strong>for</strong> differing fluid velocities <strong>an</strong>d pressures, as well as <strong>for</strong> both laminar <strong>an</strong>d<br />
turbulent <strong>flow</strong>.<br />
These conditions shall be compared <strong>for</strong> both a computational <strong>an</strong>alysis of the <strong>flow</strong>,<br />
<strong>an</strong>d <strong>an</strong> experimental <strong>an</strong>alysis. The computational <strong>an</strong>alysis will be conducted using<br />
OpenFOAM, <strong>an</strong>d the experiment shall be per<strong>for</strong>med using a wind tunnel.<br />
The dimensions of the <strong>fin</strong> were used to create a model of the <strong>fin</strong> in the CAD<br />
(computer aided design) program ‘AutoCAD’ (see chapter 7.5), <strong>an</strong>d this model of the<br />
<strong>fin</strong> surface was output as <strong>an</strong> STL file. This file will be used to produce both a scale<br />
model of the <strong>fin</strong> <strong>for</strong> experimental (wind tunnel testing), <strong>an</strong>d to describe the <strong>fin</strong><br />
surface conditions <strong>for</strong> the computational <strong>an</strong>alysis.<br />
The wind tunnel test will be conducted using ‘tell-tales’ attached to the <strong>fin</strong> to<br />
visualise the fluid behaviour. The results of the wind tunnel experiment will<br />
compared with the results of the computational <strong>an</strong>alysis, which will be conducted<br />
using OpenFOAM.<br />
11
2. Background<br />
2.1. Foils<br />
The purpose of this report is to examine the behaviour of the fluids about a sailboard<br />
<strong>fin</strong>, a type of foil. To do so we must first examine the usual method of discussing <strong>an</strong>d<br />
describing foils.<br />
2.2.1. NACA foils<br />
The National Advisory Committee <strong>for</strong> Aeronautics conducted research into the<br />
behaviour <strong>an</strong>d aerodynamic characteristics of foils in the first half of the 20 th Century<br />
(Abbott <strong>an</strong>d von Doenhoff 1959). They developed a method to characterise the<br />
physical shape of the foils based on only a few parameters, namely:<br />
- maximum thickness<br />
- maximum camber<br />
- position of the maximum camber relative to the chord length<br />
- nose radius<br />
(Kroo 2007; Abbott <strong>an</strong>d von Doenhoff 1959; White 2011)<br />
These parameters are shown in the diagram included below:<br />
Leading edge<br />
Figure 1: Cambered foil<br />
Expl<strong>an</strong>ation of terms:<br />
Camber<br />
Me<strong>an</strong> line, half way between the upper <strong>an</strong>d lower surfaces of the foil<br />
Chord Length<br />
Length of foil from the leading to trailing edge<br />
Leading edge<br />
Nose Radius<br />
α <strong>an</strong>gle of foil to <strong>flow</strong><br />
Camber Line<br />
Thickness Trailing edge<br />
Chord length<br />
Upper<br />
Surface<br />
Lower Surface<br />
12
Front or nose of the foil<br />
Thickness<br />
Width of the foil at <strong>an</strong>y given point<br />
Trailing edge<br />
Back edge (tail) of the foil<br />
In addition to implementing a new method of describing foil shape, the properties of<br />
the NACA airfoils, including lift, drag <strong>an</strong>d moment were all examined, both<br />
theoretically <strong>an</strong>d experimentally. (Kroo 2007; White 2011; Abbott <strong>an</strong>d von Doenhoff<br />
1959)<br />
The three dimensional experimental data was obtained from tests carried out in a<br />
pressure tunnel. A two dimensional low turbulence pressure tunnel was used <strong>for</strong><br />
predictions. (Abbott <strong>an</strong>d von Doenhoff 1959)<br />
2.2.2. NACA 6 series<br />
There are multiple NACA series, all of which c<strong>an</strong> be used to describe a foil in terms of<br />
its geometry <strong>an</strong>d theoretical aerodynamic characteristics. For example, the NACA 5digit<br />
series has a camber-line with more curvature towards the nose of the foil th<strong>an</strong><br />
the NACA 4-digit series (Kroo 2007). The series of interest to this report is the NACA<br />
6 series, <strong>for</strong> reasons which shall be discussed in chapter 3.2.<br />
The NACA 6-series has a greater accuracy th<strong>an</strong> the previous series with respect to<br />
the leading edge of the foil profiles. Foils belonging to the NACA 6-series have been<br />
deliberately shaped to ensure favourable pressure gradients over signific<strong>an</strong>t portions<br />
of the upper surface (Abbott <strong>an</strong>d von Doenhoff 1959; White 2011).<br />
The NACA 6-series is typically denoted by the following <strong>for</strong>mat, where the #’s refer<br />
to a numerical component.<br />
13
Denotes the series<br />
Maximum lift coefficient in 10 ths<br />
<strong>for</strong> a favourable pressure<br />
gradient on both surfaces- the<br />
‘low drag bucket’<br />
Position of minimum<br />
pressure as 1/10 th of<br />
the chord<br />
Figure 2: Typical method of writing NACA 6-series foil<br />
Maximum thickness<br />
as a percentage of<br />
the chord length<br />
Design (ideal) lift<br />
coefficient as 1/10 th<br />
of the chord<br />
The first digit signifies that the foil belongs to the NACA 6-series. The second digit<br />
represents the position of minimum pressure as 1/10 th of the chord. The third digit<br />
represents the size of the ‘low-drag bucket’; the r<strong>an</strong>ge of lift coefficient in 10 ths<br />
above <strong>an</strong>d below the design lift coefficient in which favourable pressure gradients<br />
exist on both surfaces. The fourth digit supplies the ideal or designed lift coefficient<br />
as 1/10 th of the cord, <strong>an</strong>d the fourth <strong>an</strong>d fifth digits represent the maximum<br />
thickness as a percentage of the chord length (Kroo 2007; Abbott <strong>an</strong>d von Doenhoff<br />
1959; Fox, McDonald, <strong>an</strong>d Pritchard 2004a).<br />
Where a 6-series foil or wing section has a thickness-to-chord ratio of less th<strong>an</strong> 0.12,<br />
the result<strong>an</strong>t low drag r<strong>an</strong>ge on the foil is less th<strong>an</strong> 0.1, <strong>an</strong>d c<strong>an</strong> there<strong>for</strong>e be omitted<br />
from the designation, as shown below. (Abbott <strong>an</strong>d von Doenhoff 1959)<br />
14
Denotes the series<br />
Position of minimum<br />
pressure as 1/10 th of<br />
the chord<br />
Maximum thickness as a<br />
percentage of the chord<br />
length (12% or less)<br />
Design (ideal) lift<br />
coefficient as 1/10 th of<br />
the chord<br />
Figure 3: NACA 6-series designation <strong>for</strong> foils with thickness/chord ratios of less th<strong>an</strong><br />
12%, <strong>an</strong>d the low-drag r<strong>an</strong>ge omitted.<br />
It is determined in chapter 3.2 that the <strong>RS</strong>: X Racing <strong>66</strong> sailboard <strong>fin</strong> is very similar in<br />
shape to a NACA 65-009 foil.<br />
15
2.2.3. <strong>RS</strong>: X Racing <strong>66</strong> Sailboard Fin<br />
The <strong>RS</strong>: X is a one design sailboard class which has been in production since 2005,<br />
<strong>an</strong>d is suitable <strong>for</strong> <strong>racing</strong> in wind speeds varying from 3 to 30 knots. The board itself<br />
is capable of 11-14knots upwind, with the centreboard retracted, <strong>an</strong>d is likewise<br />
capable of up to 24knots, downwind. (Gourlay <strong>an</strong>d Martellotta 2011) The board<br />
comes in two sail sizes: the men’s 9.5m 2 sail <strong>an</strong>d the women’s <strong>an</strong>d youth’s 8.5m 2 sail.<br />
The sail board has both a retractable centreboard <strong>an</strong>d a fixed <strong>fin</strong>. It is the fixed <strong>fin</strong><br />
which is the focus of this report. (Gourlay <strong>an</strong>d Martellotta 2011; Ramsden 2009;<br />
NeilPryde Racing 2011b)<br />
Figure 4: <strong>RS</strong>: X Men’s Sailboard.<br />
The centreboard is typically retracted <strong>for</strong> upwind pl<strong>an</strong>ing in winds greater th<strong>an</strong> 10<br />
knots, <strong>an</strong>d all downwind conditions. This me<strong>an</strong>s that the <strong>flow</strong> is moving solely<br />
<strong>around</strong> the <strong>fin</strong> in these conditions, which are those to be <strong>an</strong>alysed (with particular<br />
interest to the upwind conditions) in this report.<br />
The <strong>fin</strong> itself, like the sail, comes in two sizes: the men’s board has a <strong>66</strong>cm <strong>fin</strong> (<strong>RS</strong>: X<br />
Racing <strong>66</strong>), <strong>an</strong>d the women’s (<strong>an</strong>d youth’s) board has a 60cm <strong>fin</strong> (<strong>RS</strong>: X Racing 60).<br />
(NeilPryde Racing 2011a)<br />
16
Figure 5: Men’s <strong>RS</strong>: X Racing <strong>66</strong> <strong>fin</strong> (side A)<br />
The <strong>for</strong>ce provided by the wind acting on the sail produces a <strong>for</strong>ce acting<br />
perpendicular to the sail.<br />
The purpose of the <strong>fin</strong> is to constrain the motion of the board so that the sailboard<br />
c<strong>an</strong> only move <strong>for</strong>wards (or backwards) with respect to the <strong>fin</strong>. (Hewitt 1998;<br />
Burgess 1974) Where the <strong>for</strong>ce of the wind acting on the sail is aligned with the <strong>fin</strong>,<br />
this is true. However, where the <strong>for</strong>ce of the wind is not parallel to the <strong>fin</strong>, the <strong>fin</strong> is<br />
able to constrain most of this <strong>for</strong>ce into a <strong>for</strong>wards motion of the board, but the<br />
board itself will experience a small component of velocity sideways. (Li 2008; Creagh-<br />
Osborne <strong>an</strong>d Milne 1973; Garrett 1987)<br />
Since board is being blown slightly sideways, in addition to sailing <strong>for</strong>wards, the<br />
direction of motion of the board is not the same as the heading (the direction in<br />
which the board is pointed). (Garrett 1987) The <strong>an</strong>gle between the direction of<br />
motion <strong>an</strong>d the heading is known as the leeway <strong>an</strong>gle. This me<strong>an</strong>s that the leeward<br />
side of the board is the upstream side of the <strong>fin</strong>. (Li 2008; Burgess 1974; Garrett 1987)<br />
Thus the motion of the sailboard has a directional component which causes the<br />
water to <strong>flow</strong> at a slight <strong>an</strong>gle to the <strong>fin</strong>. This <strong>an</strong>gle is referred to as the leeway <strong>an</strong>gle.<br />
Direction of motion<br />
θ<br />
Heading<br />
(Upstream)<br />
Incoming <strong>flow</strong><br />
(Upwind)<br />
Wind<br />
direction<br />
Force acting on sails<br />
Figure 6: The wind acting on the sail causes the board to move at <strong>an</strong> <strong>an</strong>gle to the<br />
heading, <strong>an</strong>d this is the <strong>an</strong>gle of attack of the <strong>flow</strong> with respect to the <strong>fin</strong>. (Not to<br />
scale).<br />
Fin<br />
17
2.2.4 Consequences of similarity to NACA 65-009<br />
If the closest NACA cross section to the <strong>RS</strong>X <strong>fin</strong> is a 65-009, then the <strong>RS</strong>X <strong>66</strong>cm<br />
<strong>windsur<strong>fin</strong>g</strong> <strong>fin</strong> c<strong>an</strong> be expected to mimic some of the properties characterising the<br />
NACA 6 series class.<br />
The adv<strong>an</strong>tages of the NACA 6-series include:<br />
-high maximum lift coefficient<br />
-attached <strong>flow</strong> <strong>an</strong>d low drag over a small r<strong>an</strong>ge of operating conditions<br />
-optimised <strong>for</strong> high speed use<br />
-fairly consistent pressure distribution across the <strong>fin</strong> surface<br />
(Marzocca 2004; Abbott <strong>an</strong>d von Doenhoff 1959)<br />
The disadv<strong>an</strong>tages include:<br />
-limited r<strong>an</strong>ge of operating conditions<br />
(Marzocca 2004; Abbott <strong>an</strong>d von Doenhoff 1959)<br />
Thus, it c<strong>an</strong> be expected that the <strong>flow</strong> will be primarily attached across the foil’s<br />
surface <strong>for</strong> a limited r<strong>an</strong>ge of <strong>an</strong>gles of attack with respect to the <strong>flow</strong>. (Marzocca<br />
2004; Abbott <strong>an</strong>d von Doenhoff 1959; Public Domain Aeronautical Software 2010)<br />
2.3 Computational Fluid Dynamics (CFD)<br />
The behaviour of fluid c<strong>an</strong> be described by the basic conservation laws of energy,<br />
mass, <strong>an</strong>d momentum, in three dimensions <strong>an</strong>d with respect to time. These<br />
equations are called the Navier-Stokes equations, <strong>an</strong>d c<strong>an</strong> be used to describe the<br />
<strong>flow</strong> of incompressible fluids. (White 1999; Glenn Research <strong>Centre</strong> 2008)<br />
Put simply, computational fluid dynamics (CFD) is “the process of modelling fluid<br />
<strong>flow</strong>s by the numerical solution of the governing partial differential equations or<br />
other mathematical equations of motion.” (CSIRO 2009)<br />
Fluid behaviour c<strong>an</strong> be modelled computationally to determine solutions to<br />
problems which would otherwise be too complex to solve <strong>an</strong>alytically, including<br />
turbulent or separated <strong>flow</strong>s. (White 1999)<br />
18
3. Computer generated model<br />
The <strong>RS</strong>:X <strong>windsur<strong>fin</strong>g</strong> <strong>fin</strong> was measured <strong>an</strong>d modelled using AutoCAD, to create <strong>an</strong><br />
accurate three-dimensional model of the surface so that the fluid behaviour c<strong>an</strong> be<br />
suitably <strong>an</strong>alysed in both OpenFOAM <strong>an</strong>d the wind tunnel.<br />
The leading edge radius which is too small to be accurately measured by h<strong>an</strong>d was<br />
calculated using Microsoft Excel, <strong>an</strong>d data points along the surface generated to fill<br />
the leading edge of each of the y-displacements measured.<br />
The data points collected were then entered into AutoCAD, <strong>an</strong>d used to <strong>for</strong>m cross<br />
sections of the <strong>fin</strong> at each y-displacement. Using the ‘loft’ comm<strong>an</strong>d, the three<br />
dimensional <strong>fin</strong> was <strong>for</strong>med by extruding across these cross sections, <strong>an</strong>d the surface<br />
was then saved <strong>an</strong>d exported as <strong>an</strong> STL file. This file <strong>for</strong>mat enabled the data to be<br />
used by both OpenFOAM to produce a computational model of the <strong>fin</strong>, <strong>an</strong>d by the<br />
rapid prototyper to produce physical model of the <strong>fin</strong>. This, in turn, allowed fluid<br />
behaviour <strong>around</strong> the <strong>fin</strong> to be <strong>an</strong>alysed at different <strong>an</strong>gles of attack, <strong>an</strong>d a<br />
comparison between the expected (computational) behaviour <strong>an</strong>d the actual (wind<br />
tunnel) behaviour to be made.<br />
3.1. Measuring the Fin<br />
Since m<strong>an</strong>ufacturers often prefer not to release specifications <strong>for</strong> their foils, the<br />
actual dimensions of the <strong>RS</strong>: X Racing <strong>66</strong> sailboard <strong>fin</strong> needed to be measured. This<br />
task was undertaken by using a set-square <strong>an</strong>d a metal ruler accurate to 1 mm<br />
(uncertainty of ± 0.5 mm). With these, both sides of the <strong>fin</strong> were divided into 6<br />
equal sections, each 110mm high. Due to the curvature of the <strong>fin</strong> base, the bottom<br />
y-displacement used was 5mm above the bottom of the <strong>fin</strong>, <strong>an</strong>d <strong>an</strong>other set of<br />
points were measured half way between the bottom of the <strong>fin</strong> <strong>an</strong>d the set above it.<br />
The curvature of the <strong>fin</strong> surface causes <strong>an</strong> additional uncertainty in the tr<strong>an</strong>sverse (x)<br />
<strong>an</strong>d longitudinal (y) measurements across the <strong>fin</strong> surface.<br />
Ruler uncertainty 0.5mm<br />
Surface curvature + 0.5mm__<br />
Total uncertainty in x <strong>an</strong>d y ± 1.0 mm<br />
From this, after checking that both sides matched, each y-displacement line was<br />
divided into 5 mm intervals, measured back from the leading edge.<br />
19
Alpha<br />
Bravo<br />
Leading edge<br />
Charlie<br />
Figure 7: 5mm intervals along y-displacements alpha, bravo <strong>an</strong>d charlie, <strong>fin</strong> side A.<br />
The <strong>fin</strong> was then clamped, <strong>an</strong>d the thickness measured using a vernier (uncertainty<br />
of ±0.005mm), with each side of the jaw aligned on both sides of the <strong>fin</strong> <strong>for</strong> each<br />
interval.<br />
The uncertainty in the foil thickness was determined by considering the effect of the<br />
longitudinal <strong>an</strong>d tr<strong>an</strong>sverse uncertainties, in addition to the uncertainty in the<br />
verniers. The effect of the measurement of the surface position was achieved by<br />
estimating the maximum slope of the <strong>fin</strong> in both the XZ <strong>an</strong>d YZ pl<strong>an</strong>es.<br />
In the XZ pl<strong>an</strong>e, it was assumed the maximum slope would occur on the thickest<br />
cross-section: y-displacement alpha, shown below.<br />
20
Z axis (thickness, mm)<br />
8<br />
6<br />
4<br />
2<br />
0<br />
0 20 40 60 80 100 120 140<br />
-2<br />
-4<br />
-6<br />
-8<br />
Figure 8: XZ cross section (y-displacement alpha), shown here on axes of unequal<br />
scale.<br />
Visually, it c<strong>an</strong> be determined that the position of the maximum gradient (not<br />
including the leading edge radius, not shown) occurs between point’s b <strong>an</strong>d c.<br />
The gradient between point’s b <strong>an</strong>d c was determined as follows:<br />
rise<br />
gradient =<br />
run<br />
∆z<br />
c<br />
xz _ gradient = =<br />
∆x<br />
c<br />
z<br />
x<br />
− b<br />
− b<br />
z<br />
x<br />
X axis (mm)<br />
c b<br />
2.<br />
335 −1.<br />
755<br />
xz _ gradient =<br />
= 0.<br />
232<br />
(3 signific<strong>an</strong>t figures)<br />
123 −125.<br />
5<br />
The maximum gradient in the YZ pl<strong>an</strong>e was determined using the slope between<br />
alpha <strong>an</strong>d the leading edge of bravo. (See figure below).<br />
21
Z axis (mm)<br />
8<br />
6<br />
4<br />
2<br />
0<br />
-20 0 20 40 60 80 100 120 140<br />
Alpha<br />
Bravo<br />
-2<br />
-4<br />
-6<br />
-8<br />
X axis (mm)<br />
Figure 9: XZ cross sections of y-displacements alpha <strong>an</strong>d bravo.<br />
The gradient between y-displacements alpha <strong>an</strong>d bravo was determined as follows:<br />
rise<br />
gradient =<br />
run<br />
∆y<br />
c<br />
yz _ gradient = =<br />
∆x<br />
c<br />
y<br />
x<br />
− b<br />
− b<br />
y<br />
x<br />
4.<br />
335 − 0<br />
yz _ gradient = = 0.<br />
039<br />
(3 signific<strong>an</strong>t figures)<br />
0 − −110<br />
The total uncertainty in the foil thickness was there<strong>for</strong>e determined by taking the<br />
RMS (root me<strong>an</strong> square) of the uncertainties acting in each of the three different<br />
directions.<br />
uncert =<br />
( ∆XZ)<br />
2<br />
+ ( ∆YZ)<br />
3<br />
2<br />
+ Z<br />
2<br />
2<br />
2<br />
2<br />
( 0.<br />
232)<br />
+ ( 0.<br />
039)<br />
+ 0.<br />
005<br />
uncert =<br />
= 0.<br />
136 (3 signific<strong>an</strong>t figures)<br />
3<br />
The total uncertainty in the total thickness at <strong>an</strong>y point is there<strong>for</strong>e ±0.1mm.<br />
22
The verniers were unable to measure the central points on the longer ydisplacements<br />
of alpha <strong>an</strong>d bravo. The data points at these values were calculated<br />
by interpolating using MatLab, with a program written <strong>for</strong> the purpose called<br />
mysolvemissing.m. The code has been attached in appendix 13.1.1.<br />
The foil thickness was interpolated <strong>for</strong> the following position vectors on the <strong>fin</strong><br />
surface, where the position vectors have been included in the <strong>for</strong>m (x, y):<br />
- (68, 0)<br />
- (63, 0)<br />
- (54, -110)<br />
23
3.1.1. Coordinate System<br />
The coordinate system used to describe the position on the surface of the <strong>fin</strong> at <strong>an</strong>y<br />
given point was de<strong>fin</strong>ed as shown in the figure below:<br />
Y (mm)<br />
0<br />
-50 0 50 100 150<br />
-100<br />
-200<br />
-300<br />
-400<br />
-500<br />
-600<br />
-700<br />
X (mm)<br />
Leading edge<br />
Figure 10: Leading edge of the <strong>fin</strong> shown using the excel model of the <strong>fin</strong> viewed in<br />
the XY pl<strong>an</strong>e, shown here on axes of unequal scale.<br />
24
As shown in the above diagram:<br />
• The x coordinate refers to the dist<strong>an</strong>ce parallel to the top of the <strong>fin</strong>/fluid<br />
surface <strong>for</strong>ward from the surface trailing edge.<br />
• The y coordinate refers to dist<strong>an</strong>ce perpendicularly above or below the top of<br />
the <strong>fin</strong>/fluid surface, with height above as the positive direction.<br />
• The z coordinate refers to the thickness from the centre of the <strong>fin</strong>.<br />
The <strong>fin</strong> was measured at the following positions along the y axis:<br />
Table 1: Displacement (in the y-direction) of each cross section from the top of the<br />
<strong>fin</strong>.<br />
Y-displacements Dist<strong>an</strong>ce from y axis (mm)<br />
Alpha 0<br />
Bravo -110<br />
Charlie -220<br />
Delta -330<br />
Echo -440<br />
Foxtrot -550<br />
Golf -605<br />
Hotel -<strong>66</strong>0<br />
The thickness of the <strong>fin</strong> (double the z-value) was measured every 5mm along the x<br />
axis from the leading edge to the trailing edge at each of these y-displacements.<br />
3.2. Comparison to NACA foil sections<br />
The <strong>RS</strong>: X Racing <strong>66</strong> has, as was discussed in chapter 2.2.3, 0 camber as the foil is<br />
symmetric, <strong>an</strong>d hence has a 0 lift coefficient. The maximum thickness is 8.8% (9%) of<br />
the chord length, as calculated as shown in the table below.<br />
Table 2: Maximum thickness as a percentage of the chord length of <strong>RS</strong>: X Racing <strong>66</strong><br />
sailboard <strong>fin</strong>.<br />
Y-displacement Chord<br />
Maximum thickness<br />
(mm) (mm)<br />
alpha 129 11.00 8.53<br />
bravo 120 10.28 8.57<br />
charlie 110 9.51 8.65<br />
delta 98 8.53 8.70<br />
echo 84 7.38 8.79<br />
foxtrot 69 6.06 8.78<br />
golf 60 5.22 8.70<br />
hotel 37 3.62 9.78<br />
Average: 8.81 %<br />
Maximum thickness as a<br />
percentage of the chord length<br />
25
The point of minimum pressure was located using boundary layer <strong>an</strong>alysis in XFOIL.<br />
(See section 5.1). However, from the in<strong>for</strong>mation discussed thus far, it c<strong>an</strong> be<br />
concluded that the <strong>fin</strong> has the <strong>for</strong>m of a NACA 6#009 foil. To determine which<br />
particular NACA section the <strong>fin</strong> most closely resembles, the x-z coordinates of each<br />
cross section were compared to coordinates <strong>for</strong> sections obtained from Public<br />
Domain Aeronautical Software (PDAS) (2010).<br />
It was first determined that all of the cross sections (excepting hotel) follow the<br />
same relationship with regard to foil thickness as a percentage of the chord length.<br />
It is thought that hotel does not follow this pattern since it was measured at the very<br />
tip of the foil.<br />
Half-thickness (% chord)<br />
5.00<br />
4.50<br />
4.00<br />
3.50<br />
3.00<br />
2.50<br />
2.00<br />
1.50<br />
1.00<br />
0.50<br />
0.00<br />
0 10 20 30 40 50 60 70 80 90 100<br />
Dist<strong>an</strong>ce along the chord (%)<br />
Figure 11: Profile of the <strong>fin</strong> <strong>for</strong> each cross section in terms of the percentage of total<br />
chord length, shown here on axes of unequal scale.<br />
The profile measured across y-displacement charlie was used as the representative<br />
displacement <strong>for</strong> each of the following graphs.<br />
The foil thickness as a function of chord length was compared against the profiles of<br />
several NACA sections, including the 65-008, 65-009, 65-010 <strong>an</strong>d <strong>66</strong>-009, as shown<br />
below.<br />
alpha<br />
bravo<br />
charlie<br />
delta<br />
echo<br />
foxtrot<br />
golf<br />
hotel<br />
26
Half-thickness (% chord)<br />
6<br />
5<br />
4<br />
3<br />
2<br />
1<br />
0<br />
0 10 20 30 40 50 60 70 80 90 100<br />
% of total chord<br />
65009<br />
charlie<br />
65008<br />
65010<br />
<strong>66</strong>009<br />
Figure 12: Profile of the <strong>RS</strong>: X Racing <strong>66</strong> <strong>windsur<strong>fin</strong>g</strong> <strong>fin</strong> compared against several<br />
NACA sections.<br />
Of these, the 65-009 (dark blue) appears to bear the closest resembl<strong>an</strong>ce to the<br />
profile of the <strong>RS</strong>: X Racing <strong>66</strong> <strong>windsur<strong>fin</strong>g</strong> <strong>fin</strong> (shown here in light blue). The <strong>RS</strong>: X<br />
<strong>an</strong>d NACA 65-009 have been shown separately in the following graph.<br />
27
Half-thickness (% chord)<br />
5<br />
4.5<br />
4<br />
3.5<br />
3<br />
2.5<br />
2<br />
1.5<br />
1<br />
0.5<br />
0<br />
0 10 20 30 40 50 60 70 80 90 100<br />
% of total chord<br />
Figure 13: NACA 65-009 foil section profile compared with the profile of the <strong>RS</strong>: X <strong>66</strong><br />
<strong>windsur<strong>fin</strong>g</strong> <strong>fin</strong> (y-displacement: charlie).<br />
From the above figures, it was concluded that the <strong>RS</strong>: X Racing <strong>66</strong> sailboard <strong>fin</strong> has a<br />
similar profile to a NACA 65-009 foil.<br />
3.3. Leading Edge Radius<br />
The shape of the leading edge impacts the drag <strong>an</strong>d the likelihood of separation or<br />
stall occurring at the leading edge. (Martellotta 2010.)<br />
Reducing the leading edge radius (sharpening the nose) will reduce the drag, but will<br />
increase the <strong>flow</strong> velocity about the leading edge, increasing the likelihood of the<br />
<strong>flow</strong> separating (or stalling) from the foil surface (Marchaj 1979). In addition to this,<br />
reducing the leading edge radius c<strong>an</strong> reduce the overall maximum lift coefficient<br />
(Marchaj 1979).<br />
The relative smoothness or sharpness of the curve of the leading edge ch<strong>an</strong>ges the<br />
interaction of the fluid with the surface of the foil. Where the surface of the leading<br />
edge is smoothly curved, the <strong>flow</strong> will stick, rather th<strong>an</strong> inst<strong>an</strong>tly separate from the<br />
foil. It is there<strong>for</strong>e crucial to the success of both the physical (wind tunnel)<br />
experiment, <strong>an</strong>d the computational (OpenFOAM) exercise that the shape of the foil<br />
at the leading edge be modelled correctly.<br />
As the radius of the <strong>fin</strong>’s leading edge is too small to be accurately <strong>an</strong>d precisely<br />
measured by h<strong>an</strong>d, the leading edge radius was calculated using the first three<br />
points measured with respect to the leading edge: a, b, <strong>an</strong>d c, see figure 23, below.<br />
65009<br />
charlie<br />
28
z<br />
3.000<br />
2.000<br />
1.000<br />
0.000<br />
65 <strong>66</strong> 67 68 69 70 71 72<br />
-1.000<br />
-2.000<br />
-3.000<br />
Point c<br />
Point b<br />
Figure 14: Leading edge showing measured points a, b <strong>an</strong>d c, which were used to<br />
determine the leading edge radius. Also shown are the associated (calculated)<br />
points describing the surface of the leading edge radius. The above diagram was<br />
produced from the data measured <strong>for</strong> y-displacement delta.<br />
Table 3: Dist<strong>an</strong>ce of points a, b <strong>an</strong>d c from the leading edge.<br />
Point X-dist<strong>an</strong>ce from the leading edge (mm)<br />
A 0<br />
B 2.5<br />
C 5<br />
x<br />
calculated<br />
measured<br />
Point a<br />
As shown in the figure below, the direct dist<strong>an</strong>ce, f, between point a (the tip of the<br />
<strong>fin</strong> at the leading edge) <strong>an</strong>d point b c<strong>an</strong> be easily determined. The assumption is<br />
made that point b is located along the leading edge. There<strong>for</strong>e a radius is required<br />
such that points a <strong>an</strong>d b are equidist<strong>an</strong>t from the ‘centre’, <strong>an</strong>d such that the slope at<br />
b is increasing towards point c.<br />
The slope at point b is determined by considering it to be equal to the slope of the<br />
<strong>fin</strong> between point’s b <strong>an</strong>d c. This allows <strong>for</strong> a smooth tr<strong>an</strong>sition between the leading<br />
edge radius <strong>an</strong>d the remainder of the <strong>fin</strong>, as shown in the figure below.<br />
29
z<br />
x<br />
<strong>RS</strong>: X Racing <strong>66</strong><br />
Sailboard Fin<br />
Figure 15: Calculation of the leading edge radius.<br />
Taking the slope at point b into account will enable the value of the radius, r, <strong>an</strong>d<br />
central <strong>an</strong>gle, θ, to be calculated <strong>for</strong> each set of y-displacements. The trigonometry<br />
is shown in the figure below.<br />
Figure 16: Trigonometry used to describe the leading edge radius.<br />
c<br />
r<br />
θ<br />
r<br />
b<br />
f<br />
a<br />
30
The direct dist<strong>an</strong>ce between points a <strong>an</strong>d b, here called f, c<strong>an</strong> be calculated from the<br />
x <strong>an</strong>d z coordinates of points a <strong>an</strong>d b:<br />
f =<br />
−<br />
2<br />
( xb<br />
− xa<br />
) + ( zb<br />
za<br />
)<br />
2<br />
Since the radius ray from the centre to point b is perpendicular to the slope at point<br />
b, <strong>an</strong>gles σ, θ <strong>an</strong>d χ c<strong>an</strong> be calculated:<br />
σ = t<strong>an</strong><br />
σ = t<strong>an</strong><br />
−1<br />
−1<br />
( m)<br />
∆z<br />
( )<br />
∆x<br />
From this, <strong>an</strong>gle θ c<strong>an</strong> be calculated:<br />
θ = π −σ<br />
Setting χ such that:<br />
π −θ<br />
χ =<br />
2<br />
As all <strong>an</strong>gles of interest are now known, the sine rule c<strong>an</strong> be applied to determine<br />
the radius, r:<br />
r f * sin χ<br />
=<br />
π ) sinθ<br />
sin( 2<br />
π<br />
Since sin( ) = 1,<br />
this becomes:<br />
2<br />
f * sin( χ)<br />
r =<br />
sin( θ )<br />
π −θ<br />
f * sin( )<br />
r = 2<br />
sin( θ )<br />
Using the coordinates measured <strong>for</strong> points a <strong>an</strong>d b, the leading edge radius <strong>an</strong>d<br />
maximum <strong>an</strong>gle, θ, was determined <strong>for</strong> each set of y-displacements.<br />
These were used to generate a series of position points to describe the surface<br />
between points a <strong>an</strong>d b, both above <strong>an</strong>d below the x axis (in the z pl<strong>an</strong>e). The<br />
number of points generated is dependent on the ch<strong>an</strong>ge in <strong>an</strong>gle θ from 0 to θmax.<br />
−<br />
θ ≤ θ ≤ θ<br />
max<br />
max<br />
31
The relative ch<strong>an</strong>ge in <strong>an</strong>gle θ used was:<br />
Δθ = 0.2 radi<strong>an</strong>s.<br />
This ch<strong>an</strong>ge in <strong>an</strong>gle was chosen because it produced enough data points to give a<br />
smooth leading edge, without being unnecessarily precise, since the z uncertainty is<br />
0.07mm, where z is half the thickness at <strong>an</strong>y given point. There<strong>for</strong>e, the <strong>an</strong>gle used<br />
was sufficient <strong>for</strong> the purposes of OpenFOAM <strong>an</strong>d the wind tunnel testing.<br />
This produced 8 points each above <strong>an</strong>d below the x axis, in addition to point a, <strong>an</strong>d<br />
the points at ± b.<br />
The radius <strong>for</strong> displacements alpha: golf were determined using the following<br />
measured points at the leading edge.<br />
Table 4: Points at <strong>an</strong>d near the leading edge, used to determine the radius <strong>for</strong> each<br />
cross section<br />
a b c<br />
Y-level y x z x z X Z<br />
Alpha 0 128 0 125.5 1.755 123 2.335<br />
Bravo -110 109 0 106.5 1.800 104 2.580<br />
Charlie -220 90 0 87.5 1.910 85 2.400<br />
Delta -330 71 0 68.5 1.810 <strong>66</strong> 2.450<br />
Echo -440 54 0 51.5 1.785 49 2.220<br />
Foxtrot -550 35 0 32.5 1.560 30 2.065<br />
Golf -605 25 0 22.5 1.320 20 1.720<br />
The radii were determined as discussed above, <strong>an</strong>d where the calculated radii<br />
appeared too large <strong>for</strong> the data points, they were adjusted as required to fit with the<br />
measured data points, as shown below.<br />
32
z<br />
2.500<br />
2.000<br />
1.500<br />
1.000<br />
0.500<br />
0.000<br />
29 30 31 32 33 34 35 36<br />
-0.500<br />
-1.000<br />
-1.500<br />
-2.000<br />
-2.500<br />
x<br />
adapted<br />
measured<br />
calculated<br />
Figure 17: The adapted <strong>an</strong>d calculated radii <strong>an</strong>d leading edges shown with measured<br />
points a, b <strong>an</strong>d c, <strong>for</strong> cross section foxtrot.<br />
As shown by the above figure, not all of the calculated radii fit correctly with the<br />
measured data points. In these cases (foxtrot <strong>an</strong>d golf), the radii was adapted to fit<br />
such that the slope connecting the leading edge points to the measured data points<br />
appeared smooth, to prevent a sharp join which would increase the likelihood of<br />
<strong>flow</strong> separation.<br />
Table 5: Calculation of the leading edge radius <strong>for</strong> each cross section<br />
Calculated<br />
radius<br />
(mm)<br />
Adapted<br />
radius<br />
(mm)<br />
Used<br />
radius<br />
(mm)<br />
Alpha 1.54 1.54 126.5<br />
Bravo 1.56 1.56 107.4<br />
Charlie 1.58 1.58 88.4<br />
Delta 1.56 1.56 69.4<br />
Echo 1.54 1.54 52.5<br />
Foxtrot 1.48 1.3 1.30 33.7<br />
Golf 1.42 1.1 1.10 23.9<br />
Hotel 2.15 1.57 1.57 2.4<br />
<strong>Centre</strong> position relative to 0<br />
in the x-axis<br />
(mm)<br />
The radius used <strong>for</strong> hotel was determined by averaging the calculated radii of the<br />
other y-displacement data sets.<br />
The radii used are very similar, especially given the uncertainty in the z direction is<br />
±0.07mm. The radii determined <strong>for</strong> cross sections alpha-echo <strong>an</strong>d hotel all fall<br />
within uncertainties of each other. The radii determined <strong>for</strong> cross sections foxtrot<br />
<strong>an</strong>d golf do not. Since the aim of this report is to <strong>an</strong>alyse the behaviour about the<br />
33
<strong>RS</strong>:X Racing <strong>66</strong> <strong>windsur<strong>fin</strong>g</strong> <strong>fin</strong>, the adapted radii were used <strong>for</strong> these cross sections<br />
as they were adapted to fit smoothly with the measured data points.<br />
3.4. Trailing Edge<br />
The trailing edge of the <strong>RS</strong>: X sailboard <strong>fin</strong> has a <strong>fin</strong>ite thickness along the edge. This<br />
prevents the molecules comprising the boundary layer from accumulating at the<br />
trailing edge, by causing them to be sucked into the <strong>fin</strong>’s wake. (Marchaj 1979) Since<br />
we are attempting to model a real <strong>fin</strong>, it is not unreasonable <strong>for</strong> the thickness to vary<br />
along this edge. The thickness was measured at the trailing edge <strong>for</strong> each crosssection,<br />
<strong>an</strong>d was used as the thickness of the trailing edge in the modelled <strong>fin</strong>.<br />
Table 6: Measurement of trailing edge thickness<br />
Thickness Half-thickness<br />
(mm ± 0.1mm) (mm ± 0.07mm)<br />
Alpha 1.72 0.86<br />
Bravo 0.84 0.42<br />
Charlie 1.72 0.86<br />
Delta 1.28 0.64<br />
Echo 1.52 0.76<br />
Foxtrot 1.32 0.<strong>66</strong><br />
Golf 0.70 0.35<br />
Hotel 0.72 0.36<br />
The uncertainty in the measurement of the thickness at the trailing edge is fairly<br />
signific<strong>an</strong>t, r<strong>an</strong>ging from 5.8% - 14.3% of the total thickness. Despite this, there is<br />
still a considerable variation in the width of the trailing edge of the <strong>fin</strong>, as shown<br />
below.<br />
34
Y<br />
0<br />
-0.6 -0.4 -0.2 0 0.2 0.4 0.6<br />
-100<br />
-200<br />
-300<br />
-400<br />
-500<br />
-600<br />
-700<br />
Figure 18: Trailing edge of the <strong>fin</strong>.<br />
Z<br />
3.5. AutoCAD<br />
AutoCAD is a type of computer aided design software, capable of both twodimensional<br />
<strong>an</strong>d three-dimensional modelling. It has workspaces which c<strong>an</strong> be used<br />
to separate different levels of data, <strong>an</strong>d is capable of outputting surfaces as STL files,<br />
which were all requirements of the computer modelling software used to model the<br />
<strong>fin</strong>. (Whitton 2011; Engineers Edge 2011; AutoCAD 2009)<br />
The AutoCAD software was used to create a three-dimensional model of the <strong>RS</strong>X<br />
sailboard <strong>fin</strong>, based on the measurements of thickness as were measured based on<br />
the coordinate system described above.<br />
The calculated leading edge radius values were added to the measured values across<br />
the <strong>fin</strong> surface. These were then entered into the AutoCAD software, such that each<br />
set of y values (alpha, bravo, charlie etc.) <strong>for</strong>med a half of a two dimensional<br />
‘teardrop’, as shown below.<br />
35
Figure 19: Top view of the half teardrop produced from the data points of ydisplacement<br />
delta modelled in AutoCAD.<br />
Each y-displacement was composed of a different number of data points, as a<br />
consequence of taking measurements every 5mm. To ensure that the three<br />
dimensional extrusion behaved appropriately <strong>around</strong> the leading <strong>an</strong>d trailing edges,<br />
each cross section was interpolated using MATLAB so that each level had the same<br />
number of data points (35, the number originally measured <strong>for</strong> cross-section alpha).<br />
This then allows the loft function to extrapolate between the points evenly, rather<br />
th<strong>an</strong> ‘wrapping’ the function about the corners.<br />
The coordinates in each half teardrop were interpolated so that each cross section<br />
would be produced from the same number of data points. The program used <strong>for</strong> this<br />
purpose, interpPoints.m has been included as appendix 13.1.2.<br />
6<br />
5<br />
4<br />
3<br />
2<br />
1<br />
0<br />
-60 -40 -20 0 20 40 60 80 100 120 140<br />
Figure 20: Y-displacements alpha to golf interpolated to have the same number of<br />
data points.<br />
alpha<br />
bravo<br />
charlie<br />
delta<br />
echo<br />
foxtrot<br />
golf<br />
hotel<br />
36
Each data point was entered in terms of its three dimensional coordinates, so that<br />
the data points modelled the <strong>fin</strong> correctly in terms of three dimensional space.<br />
Figure 21: Top view of y-displacement delta modelled in AutoCAD.<br />
Figure 22: All cross sections shown in the XY pl<strong>an</strong>e, as modelled in AutoCAD.<br />
The three dimensional <strong>fin</strong> shape was created by ‘lofting’ (extruding) across these two<br />
dimensional representations of the foil. The end result has been included below.<br />
The <strong>fin</strong>ished surface was output as a STL file <strong>for</strong> use in the OpenFOAM <strong>an</strong>d by the<br />
Rapid Prototyper.<br />
37
Figure 23: Finished three-dimensional model of the <strong>RS</strong>: X Racing <strong>66</strong> <strong>windsur<strong>fin</strong>g</strong> <strong>fin</strong>,<br />
as modelled in AutoCAD, with data points showing.<br />
3.6. STL Files<br />
After producing the three dimensional <strong>fin</strong> surface, the data points were saved as <strong>an</strong><br />
STL file, the st<strong>an</strong>dard file <strong>for</strong>mat used by Rapid Prototypers, which approximates a<br />
surface as a series of tri<strong>an</strong>gles. (Engineers Edge 2011; Fox, McDonald, <strong>an</strong>d Pritchard<br />
2004a).<br />
The STL file was then sent to the 3D Printer (Rapid Prototyper) to produce a scale<br />
model of the <strong>RS</strong>: X sail board <strong>fin</strong> to be used in the wind tunnel tests.<br />
As the STL file <strong>for</strong>mat is also used by OpenFOAM, the output STL file was used to<br />
create the surface, using the snappy hex mesh function.<br />
38
4. Experimental Analysis<br />
A simple method of mapping stall is to attach pieces of string (referred to as tell-tales)<br />
to the <strong>fin</strong> to give a visual guide to the air <strong>flow</strong> <strong>around</strong> the <strong>fin</strong>. The air <strong>flow</strong> c<strong>an</strong> be<br />
mapped depending on the behaviour of the tell-tales. Smooth (attached) air <strong>flow</strong><br />
c<strong>an</strong> be shown by string that moves with the fluid, i.e. is parallel to the direction of<br />
<strong>flow</strong>, whilst regions of stall, such as a leading edge separation bubble or full stall are<br />
shown by chaotic string behaviour that does not mimic fluid propagation. Full stall<br />
c<strong>an</strong> be identified where all strings after <strong>an</strong> initial chaotically behaved string also<br />
display r<strong>an</strong>dom, chaotic motion. Me<strong>an</strong>while, leading edge separation bubbles c<strong>an</strong><br />
be identified by a region of chaotically behaved strings followed by a region of well<br />
behaved, <strong>flow</strong> con<strong>for</strong>ming strings.<br />
Figure 24: Attached tell tale behaviour. (Cropped from photo #8361)<br />
Figure 25: Separated tell tale behaviour. (Cropped from photo #8369)<br />
The <strong>flow</strong> was <strong>an</strong>alysed by using the rapid prototyper to produce a scale model of the<br />
<strong>fin</strong>, to which tell-tales were then attached. The <strong>fin</strong> was then placed into a wind<br />
tunnel at various <strong>an</strong>gles to the <strong>flow</strong>, <strong>an</strong>d the behaviour of the tell-tales recorded.<br />
39
4.1. Wind Tunnel<br />
To make it possible to test the behaviour of fluid about the <strong>RS</strong>: X sailboard <strong>fin</strong> when<br />
is inclined at various <strong>an</strong>gles to the <strong>flow</strong>, a wind tunnel was used. The experiments<br />
were conducted in the Curtin University wind tunnel.<br />
The wind tunnel c<strong>an</strong> be used to conduct these tests provided the model is<br />
“geometrically similar” to the <strong>fin</strong> <strong>an</strong>d the Reynolds number is maintained between<br />
the ‘scale model’ fluid (air) <strong>an</strong>d the ‘full scale’ fluid (water). (Abbott <strong>an</strong>d von<br />
Doenhoff 1959, 81)<br />
Due to the dimensions of the wind tunnel, a scale model of the <strong>fin</strong> was required.<br />
This was produced using AutoCAD, as mentioned in chapter 3.5, in conjunction with<br />
Curtin University’s rapid prototyper, as mentioned below.<br />
The <strong>flow</strong> <strong>around</strong> the foil c<strong>an</strong> be examined by observing <strong>an</strong>d recording the behaviour<br />
of tell-tales (tufts) attached across the surface of the foil. (Marchaj 1979)<br />
4.1.1 Dynamic Similarity<br />
Similarity is required when producing a model of a system. Maintaining similarity<br />
ensures that the model system has equivalent <strong>flow</strong> conditions to the full scale<br />
system. This is achieved by ensuring that the dimensionless parameters hold the<br />
same values <strong>for</strong> both the model <strong>an</strong>d prototype. (White 1999)<br />
Reynolds number is a dimensionless parameter relev<strong>an</strong>t to almost all fluid mech<strong>an</strong>ics<br />
problems. The Reynolds number is only relev<strong>an</strong>t <strong>for</strong> viscous <strong>flow</strong>s. Thus, the<br />
Reynolds number must be maintained <strong>for</strong> the <strong>flow</strong> across a model <strong>an</strong>d prototype of<br />
<strong>an</strong> object to be considered comparable. (White 2008; Munson, Young, <strong>an</strong>d Okiiski<br />
2006)<br />
The Reynolds number is dependent on the density ρ, viscosity μ, relative scale of the<br />
dimensions of the immersed model <strong>an</strong>d full-size object, D, <strong>an</strong>d the fluid velocity, V,<br />
as shown below.<br />
ρVD<br />
Re =<br />
µ<br />
(White 2008, 27)<br />
The coefficient, D, refers to the characteristic length of the import<strong>an</strong>t linear<br />
dimension. It c<strong>an</strong> refer to the length of a pipe, the diameter of a duct, the diameter<br />
of a cylinder, or the ratio of object dimensions, depending on the <strong>flow</strong> situation.<br />
(Munson, Young, <strong>an</strong>d Okiiski 2006; White 2008)<br />
There<strong>for</strong>e, in order to ensure dynamic similarity between the model <strong>an</strong>d the full-size<br />
prototype, the Reynolds number needs to be maintained across both. This me<strong>an</strong>s<br />
the relative size of the model (compared to the prototype) will dictate the required<br />
test velocities of the air <strong>flow</strong> in the wind tunnel.<br />
40
The wind tunnel is 3m long, with cross section that 0.457m x 0.457m. Since the full<br />
size <strong>RS</strong>X <strong>fin</strong> is 0.<strong>66</strong>0m long, a half scale model will both be numerically simple, <strong>an</strong>d fit<br />
inside the tunnel. In this case, ‘fitting’ includes space <strong>for</strong> the <strong>fin</strong> to be mounted <strong>an</strong>d<br />
0.1m of free space, to allow <strong>for</strong> the boundary layers surrounding the <strong>fin</strong> <strong>an</strong>d the<br />
against the wind tunnel wall, the thicknesses of which will be calculated in sections<br />
4.1.3 <strong>an</strong>d 4.1.4. Dynamic similarity me<strong>an</strong>s that the boundary layers will be the same<br />
size relative to the model <strong>an</strong>d <strong>fin</strong>.<br />
4.1.2 Required test speed r<strong>an</strong>ge<br />
The r<strong>an</strong>ge of airspeeds required to maintain the dynamic similarity <strong>for</strong> the half scale<br />
model <strong>an</strong>d the full scale <strong>RS</strong>X <strong>fin</strong> in <strong>an</strong> aquatic environment c<strong>an</strong> be determined. As<br />
previously discussed in chapter 4.1.1, this c<strong>an</strong> be done by maintaining the<br />
dimensionless parameter, the Reynolds number.<br />
The values <strong>for</strong> the fluid properties were sourced from White (2008, 26), <strong>an</strong>d have<br />
been included in the table below.<br />
Table 7: Fluid properties <strong>for</strong> air <strong>an</strong>d water<br />
Μ Ρ<br />
Air 1.8 x 10 -5 kgm -1 s -1 1.20 kgm -3<br />
Water 1.0 x 10 -6 kgm -1 s -1 998 kgm -3<br />
Re = Re<br />
air<br />
ρ airVair<br />
D<br />
µ<br />
air<br />
water<br />
mod el<br />
ρ<br />
=<br />
water<br />
V<br />
water<br />
µ<br />
D<br />
water<br />
prototype<br />
−3<br />
⎛ 1 ⎞<br />
( 1.<br />
20kgm<br />
) ⎜ D prototype ⎟<br />
−3<br />
⎝ 2 ⎠ ( 998kgm<br />
)( D prototype )<br />
Vair<br />
=<br />
Vwater<br />
air<br />
1.<br />
8x10<br />
−5<br />
V = 14.<br />
85V<br />
kgm<br />
water<br />
−1<br />
s<br />
−1<br />
1.<br />
0x10<br />
Since the <strong>RS</strong>:X is suitable <strong>for</strong> conditions r<strong>an</strong>ging from 8 to 24 knots (4.12 to 12.3ms -1 ),<br />
equivalent to 61.2 to 183 ms -1 <strong>for</strong> the model. (Gourlay <strong>an</strong>d Martellotta 2011) An<br />
example calculation <strong>for</strong> the minimum value has been included below.<br />
Vmin_ air = 14.<br />
85Vmin_<br />
water<br />
Vmin_ air<br />
= 14.<br />
85*<br />
( 4.<br />
12ms<br />
−1<br />
)<br />
−3<br />
kgm<br />
−1<br />
s<br />
−1<br />
41
−1<br />
Vmin_ air = 61.<br />
2ms<br />
(3 signific<strong>an</strong>t figures)<br />
From the r<strong>an</strong>ge of speeds suitable <strong>for</strong> testing, the lower limit is con<strong>fin</strong>ed by the<br />
lowest realistic (equivalent) operating speed <strong>for</strong> the model, 61ms -1 , <strong>an</strong>d the upper<br />
limit by the maximum speed possible in the wind tunnel, 30ms -1 . Since the minimum<br />
equivalent speed is greater th<strong>an</strong> the wind tunnel maximum speed, the r<strong>an</strong>ge of<br />
velocities over which the model was tested experimentally was from 22 to 30 ms -1 .<br />
4.1.3 Boundary layer thickness: wind tunnel <strong>flow</strong><br />
The thickness of the boundary layer across the <strong>fin</strong> <strong>an</strong>d wall surfaces c<strong>an</strong> be<br />
estimated based on whether the <strong>flow</strong> is attached or turbulent.<br />
The Reynolds number c<strong>an</strong> provide <strong>an</strong> estimate of the <strong>flow</strong> behaviour. A table of<br />
typical <strong>flow</strong> behaviour <strong>for</strong> various Reynolds numbers has been included below. The<br />
values in this table were sourced from White (2008).<br />
Table 8: Type of <strong>flow</strong> <strong>for</strong> various Reynolds numbers<br />
R<strong>an</strong>ge of Reynolds numbers Type of <strong>flow</strong><br />
0 < Re < 1 highly viscous, attached <strong>flow</strong><br />
1 < Re < 100 attached, strong Reynolds number dependence<br />
100 < Re < 10 3 attached, boundary layer effect becomes signific<strong>an</strong>t<br />
10 3 < Re < 10 4 tr<strong>an</strong>sition to turbulence<br />
10 4 < Re < 10 6 turbulent <strong>flow</strong>, with a moderate Reynolds number<br />
dependence<br />
10 6 < Re turbulent <strong>flow</strong>, with a slight Reynolds number<br />
dependence<br />
The <strong>flow</strong> in the wind tunnel c<strong>an</strong> be classed as either attached of turbulent by<br />
examining the Reynolds number of the <strong>flow</strong> within the tunnel.<br />
ρVD<br />
Re =<br />
µ<br />
(White 2008)<br />
Where V is the velocity of the wind tunnel <strong>flow</strong>, D is the length of the tunnel to the<br />
cross-section of interest, the dynamic viscosity, μ, <strong>an</strong>d the density, ρ, of the fluid.<br />
The model will be fixed into position <strong>an</strong>d tested 1m from the ‘honeycomb’ inside of<br />
the wind tunnel.<br />
There<strong>for</strong>e, the maximum <strong>an</strong>d minimum Reynolds numbers of the wind tunnel at this<br />
location c<strong>an</strong> be calculated as follows:<br />
22 * 1<br />
Re min = = 1.<br />
5x10<br />
−<br />
5<br />
1.<br />
51*<br />
10<br />
6<br />
42
30*<br />
1<br />
Re max = = 2.<br />
0x10<br />
− 5<br />
1.<br />
51*<br />
10<br />
6<br />
As shown in table 8, <strong>an</strong>y <strong>flow</strong> with a Reynolds number of the order of 10 6 c<strong>an</strong> be<br />
considered turbulent. The boundary layer on the wall surface c<strong>an</strong> be compared to<br />
the boundary layer on a flat plate.<br />
Since the <strong>flow</strong> inside the wind tunnel is known to be turbulent, the boundary layer<br />
thickness c<strong>an</strong> be calculated.<br />
4.1.4 Boundary layer thickness<br />
There are multiple equations which exist to determine the width of a boundary layer,<br />
<strong>for</strong> both turbulent <strong>an</strong>d attached <strong>flow</strong>s.<br />
Since it is known that the air <strong>flow</strong>ing inside the wind tunnel is turbulent at the time it<br />
interacts with the model, the following equation, sourced from White (1999) was<br />
used.<br />
turb = δ<br />
0. 16x<br />
1/<br />
7<br />
Re<br />
Solving this gives:<br />
δ<br />
δ<br />
δ<br />
W _ turb _ max<br />
W _ turb _ max<br />
W _ turb _ max<br />
0.<br />
16<br />
=<br />
Re<br />
=<br />
min<br />
x<br />
1/<br />
7<br />
0.<br />
16 * 1<br />
( 1.<br />
5 * 10<br />
6<br />
= 0.<br />
0210m<br />
)<br />
1/<br />
7<br />
(White 1999, 428)<br />
Alternate calculations of the boundary layer thickness <strong>for</strong> turbulent <strong>flow</strong> give similar<br />
results.<br />
Table 9: Boundary layer thickness <strong>for</strong> turbulent <strong>flow</strong><br />
Boundary Layer Thickness (m, 3sf)<br />
Turbulent Flow<br />
Min Re Max Re<br />
J<strong>an</strong>na 0.0215 0.0203<br />
White 0.0210 0.0201<br />
Average 0.0213 0.0202<br />
43
Hence, the maximum expected boundary layer thickness is 0.02m.<br />
The suitability of a half scale model c<strong>an</strong> now be confirmed. As the wind tunnel has a<br />
cross-section that 0.457m x 0.457m. The <strong>fin</strong> will be mounted horizontally inside the<br />
tunnel, there<strong>for</strong>e the maximum size the model c<strong>an</strong> be is:<br />
0.457m – 2(0.021m) = 0.415m<br />
Since this is larger th<strong>an</strong> the proposed model length of 0.330m, this size is suitable <strong>for</strong><br />
the experiment.<br />
4.1.5 The expected lift <strong>for</strong>ce acting on model inside the wind tunnel<br />
The lift coefficient, CL, is the dimensionless parameter relating the lift <strong>an</strong>d dynamic<br />
<strong>for</strong>ces as shown:<br />
C L<br />
lift _ <strong>for</strong>ce<br />
=<br />
dynamic _ <strong>for</strong>ce<br />
L<br />
U<br />
CL =<br />
1 2<br />
2 ρ<br />
A<br />
(White 2008, 493)<br />
In the above equation, the lift <strong>for</strong>ce is denoted L, ρ represents the density of the fluid<br />
surrounding the foil, U represents the velocity of the fluid <strong>flow</strong>ing across the surface<br />
of the foil, <strong>an</strong>d A denotes the pl<strong>an</strong><strong>for</strong>m area of the <strong>fin</strong>. (Glenn Research <strong>Centre</strong> 2010c;<br />
White 2008)<br />
For non-cambered foils, the lift coefficient has <strong>an</strong> approximate relation with the<br />
<strong>an</strong>gle of attack, α, as shown below:<br />
C L<br />
= 2π<br />
* sinα<br />
(White 2008, 557)<br />
The above equation has been derived using the Kutta-Joukowski theorem, which<br />
relates the lift <strong>an</strong>d circulation on a body. (Peter n.d.; White 2008) This implies that,<br />
where lift exists, the <strong>flow</strong> has a negative circulation. (Peter n.d.)<br />
Thus, the lift coefficient c<strong>an</strong> calculated <strong>for</strong> each <strong>an</strong>gle of attack to be trialled.<br />
44
Table 10: Lift coefficient <strong>for</strong> each <strong>an</strong>gle of attack<br />
Angle<br />
(degrees)<br />
Angle<br />
(radi<strong>an</strong>s)<br />
lift coefficient<br />
(-)<br />
0 0 0<br />
5 0.0872<strong>66</strong> 0.547616<br />
10 0.174533 1.091064<br />
15 0.261799 1.626208<br />
20 0.3490<strong>66</strong> 2.148976<br />
30 0.523599 3.141593<br />
However, the overall lift coefficient is affected by the <strong>fin</strong>’s <strong>fin</strong>ite sp<strong>an</strong>. This c<strong>an</strong> be<br />
measured by using the ratio of the sp<strong>an</strong> of the <strong>fin</strong> to the average chord length,<br />
referred to as the dimensionless value known as the aspect ratio, AR. This is shown<br />
below:<br />
sp<strong>an</strong><br />
AR =<br />
average _ chord<br />
(White 2008, 496)<br />
However, since the sp<strong>an</strong> is assumed to be wing sp<strong>an</strong> (of a pl<strong>an</strong>e), then the aspect<br />
ratio <strong>for</strong> the sp<strong>an</strong> of the <strong>fin</strong> becomes:<br />
2 * sp<strong>an</strong><br />
AR =<br />
average _ chord<br />
(Glenn Research <strong>Centre</strong> 2010d)<br />
The pl<strong>an</strong><strong>for</strong>m area (area of a single side) of the <strong>fin</strong> model needs to be determined<br />
be<strong>for</strong>e either the aspect ratio or the maximum lift <strong>for</strong>ce on the <strong>fin</strong> model c<strong>an</strong> be<br />
calculated.<br />
The pl<strong>an</strong><strong>for</strong>m area was calculated by dividing the surface into a series of trapezoids<br />
using the coordinates of the extreme edges in the XY pl<strong>an</strong>e, as shown in the figure<br />
below.<br />
45
Figure 26: Leading edge of the <strong>fin</strong> with trapezoid using y-displacements bravo <strong>an</strong>d<br />
charlie, <strong>an</strong>d shown here using the excel model of the <strong>fin</strong> viewed in the XY pl<strong>an</strong>e,<br />
shown here on axes of unequal scale.<br />
46
A trapezoid<br />
=<br />
1<br />
2<br />
( b b ) * h<br />
1 +<br />
2<br />
Summing the trapezoid made by each pair of y-displacements gives the pl<strong>an</strong><strong>for</strong>m<br />
area of the <strong>fin</strong>.<br />
A<br />
∑<br />
total = Atrapezoid<br />
A total =<br />
0. 0622m<br />
2<br />
(3 signific<strong>an</strong>t figures)<br />
Since the model is half the size of the prototype, the total area of the model is:<br />
A<br />
mod el =<br />
A el =<br />
mod<br />
A el =<br />
mod<br />
1<br />
4<br />
A<br />
prototype<br />
1<br />
* 0.<br />
0622m<br />
4<br />
0. 0155m<br />
2<br />
2<br />
(3 signific<strong>an</strong>t figures)<br />
The trapezoidal method <strong>for</strong> determining the area of the <strong>fin</strong> c<strong>an</strong> be considered equal<br />
to the average chord length multiplied by the sp<strong>an</strong> of the <strong>fin</strong>. Thus, dividing the total<br />
area of the model by the sp<strong>an</strong> of the <strong>fin</strong> gives the average chord of the <strong>fin</strong>, as shown<br />
below:<br />
area<br />
AV _ chord mod el =<br />
sp<strong>an</strong><br />
2<br />
0.<br />
0155m<br />
AV _ chord =<br />
0.<br />
3275m<br />
AV _ chord = 0.<br />
0268m<br />
model<br />
model<br />
(3 signific<strong>an</strong>t figures)<br />
Thus, the aspect ratio c<strong>an</strong> be determined, as the sp<strong>an</strong> of the <strong>fin</strong> model is known to<br />
be 327.5mm. As this value is dimensionless, it should be const<strong>an</strong>t <strong>for</strong> both the full<br />
sized <strong>fin</strong>, <strong>an</strong>d the model.<br />
2 * 0.<br />
3275m<br />
AR =<br />
0.<br />
0268m<br />
AR<br />
= 13.<br />
8<br />
47
(3 signific<strong>an</strong>t figures)<br />
This variable c<strong>an</strong> then be used to determine the influence of the foil sp<strong>an</strong> on the<br />
overall lift coefficient, CL, as shown below:<br />
C L<br />
⎛ 2h<br />
⎞<br />
2π<br />
* sin⎜α<br />
+ ⎟<br />
⎝ c ⎠<br />
=<br />
2<br />
1 +<br />
AR<br />
Where α is the <strong>an</strong>gle of attack, h is the maximum camber <strong>an</strong>d c is the chord length.<br />
Since the foil is symmetric, <strong>an</strong>d there<strong>for</strong>e non-cambered, this becomes:<br />
C L<br />
2π<br />
* sin<br />
=<br />
2<br />
1 +<br />
AR<br />
( α )<br />
Thus, the lift coefficient c<strong>an</strong> be determined <strong>for</strong> each <strong>an</strong>gle of attack.<br />
Table 11: Lift coefficient <strong>for</strong> in<strong>fin</strong>ite <strong>an</strong>d <strong>fin</strong>ite foil sp<strong>an</strong>s<br />
Angle<br />
(degrees)<br />
Angle<br />
(radi<strong>an</strong>s)<br />
lift coefficient<br />
(-)<br />
0 0 0 0<br />
5 0.09 0.548 0.478<br />
10 0.17 1.091 0.953<br />
15 0.26 1.626 1.420<br />
20 0.35 2.149 1.877<br />
30 0.52 3.142 2.744<br />
(White 2008, 497)<br />
lift coefficient- <strong>fin</strong>ite sp<strong>an</strong><br />
(-)<br />
48
Figure 27: Lift coefficient <strong>for</strong> the <strong>fin</strong>, due to the <strong>fin</strong>ite sp<strong>an</strong>, shown <strong>for</strong> <strong>an</strong>gles from 0-<br />
20 o . It should be noted that the values <strong>for</strong> the lift coefficient shown above assume<br />
the <strong>flow</strong> has not yet separated.<br />
Using the total pl<strong>an</strong><strong>for</strong>m area of the <strong>fin</strong> model, a maximum coefficient of lift <strong>for</strong> 20 o ,<br />
<strong>an</strong>d assuming the maximum <strong>flow</strong> velocity encountered by the model is 30ms -1 , the<br />
maximum lift <strong>for</strong>ce on the model c<strong>an</strong> be determined.<br />
L<br />
C L =<br />
1 2<br />
ρU<br />
2<br />
L = C L<br />
L =<br />
1<br />
2 ρ<br />
U<br />
A<br />
2<br />
A<br />
1 −3<br />
−1<br />
2<br />
2<br />
2 ( 1.<br />
88)(<br />
1.<br />
20kgm<br />
)( 30ms<br />
) ( 0.<br />
0155m<br />
L = 15.<br />
8N<br />
)<br />
(White 2008, 493)<br />
(3 signific<strong>an</strong>t figures)<br />
Hence, the maximum lift <strong>for</strong>ce on the <strong>fin</strong> will be 15.8N. However, this value neglects<br />
gravitational <strong>an</strong>d drag <strong>for</strong>ces.<br />
It c<strong>an</strong> be expected that this could cause the model to bend upwards from the root.<br />
49
4.2. Rapid Prototyper<br />
The rapid prototyper enables complex three dimensional models to be printed with<br />
great accuracy. The printer converts <strong>an</strong> AutoCAD STL file (other accepted <strong>for</strong>mats<br />
include ZRML, PLY, 3DS <strong>an</strong>d ZPR) into a physical model suitable <strong>for</strong> experimental<br />
validation <strong>an</strong>d testing. There are several methods which c<strong>an</strong> be used to produce the<br />
models, including:<br />
- 3D Zcorp printing<br />
- Polyjet printing<br />
- Fused deposition modelling<br />
- Stereolithography<br />
- Selective laser sintering<br />
- Computer numerical control<br />
(Formero 2010; Rapid Pro 2011b; Z Corporation 2010)<br />
The 3D Zcorp printing was the method chosen to produce the <strong>fin</strong> model <strong>for</strong> use in<br />
the wind tunnel (due to printer availability <strong>an</strong>d intended purpose). Using this<br />
method, the three dimensional model was produced by ‘printing’ alternating thin<br />
layers (0.09-0.1mm) of plaster <strong>an</strong>d a bonding agent. The <strong>fin</strong>ished model was then<br />
cle<strong>an</strong>ed <strong>an</strong>d impregnated with resin <strong>for</strong> strength. (Formero 2010; Rapid Pro 2011a; Z<br />
Corporation 2011)<br />
Figure 28: 3D printer: ZPrinter 450.<br />
50
4.3. Tell Tales<br />
Tell tales are used to determine both the location <strong>an</strong>d characteristics of <strong>an</strong>y<br />
separation across the <strong>fin</strong> surface. They show whether the <strong>flow</strong> is attached (<strong>an</strong>d<br />
attached) or separated, <strong>an</strong>d the location of <strong>an</strong>y reattachment.<br />
As succinctly stated by Marchaj (1979), “The optimum position of the tell tales in<br />
relation to the leading edge should be such that they are capable of detecting<br />
reattachment somewhere between 5-15% of the sail chord.”<br />
In light of this, tell tales were attached to the <strong>fin</strong> prior to per<strong>for</strong>ming the wind tunnel<br />
experiments. They were attached using sticky tape, to reduce the impact on the<br />
<strong>flow</strong> as much as possible.<br />
The tell tales were attached along each y-displacement on the upstream side. The<br />
tell-tales only needed to be attached to one side of the foil, since it is non-cambered,<br />
<strong>an</strong>d there<strong>for</strong>e lift is only produced when the foil is <strong>an</strong>gled with respect to the <strong>flow</strong>.<br />
Along each XZ cross section, tuft was attached at 10%, 50% <strong>an</strong>d 90% of the chord<br />
length.<br />
thickness (% chord)<br />
5.00<br />
4.50<br />
4.00<br />
3.50<br />
3.00<br />
2.50<br />
2.00<br />
1.50<br />
1.00<br />
0.50<br />
0.00<br />
0.00 10.00 20.00 30.00 40.00 50.00 60.00 70.00 80.00 90.00 100.00<br />
% of total chord<br />
Figure 29: Proposed tuft attachment locations as a percentage of the total chord <strong>for</strong><br />
each cross section.<br />
51
4.4. Experimental procedure<br />
4.4.1 Experimental set up<br />
The <strong>fin</strong> with attached tell-tales was mounted horizontally into the wind tunnel, with<br />
<strong>an</strong> <strong>an</strong>gle of 0 o towards the <strong>flow</strong>. The <strong>flow</strong> was allowed to develop, <strong>an</strong>d the tell tale<br />
behaviour recorded. This will be repeated from 8 o to 16 o , increasing by 2 o each time.<br />
The tell tales were attached at model y-displacements bravo, charlie, echo, <strong>an</strong>d golf,<br />
at approximately 10%, 50% <strong>an</strong>d 90% of the local chord. The tell tales were attached<br />
on one side of the <strong>fin</strong> only.<br />
Figure 30: Model <strong>fin</strong> with tell tales attached at 10%, 50%, <strong>an</strong>d 90% of the chord of<br />
model y-displacements bravo, charlie, echo <strong>an</strong>d golf. (IMAG0146)<br />
The wind tunnel was used on two separate occasions to record experimental data.<br />
The first occasion had the <strong>fin</strong> mounted using only a pair of metal blocks, as shown<br />
below:<br />
52
Figure 31: Model mounted between two blocks. (Photo #0083)<br />
The second occasion had a steel plate, approximately 200mm x 200mm square, with<br />
a thickness of 1mm, to prevent <strong>flow</strong> recirculation behind the blocks from impacting<br />
on the <strong>flow</strong> at y-displacement alpha, as was noted during the first set of experiments.<br />
For this reason the report will have a focus on the results recorded from the second<br />
set of experiments.<br />
Figure 32: Model mounted with steel plate to prevent recirculation. (Photo #8378)<br />
53
The <strong>fin</strong> was mounted into the wind tunnel with <strong>an</strong> initial <strong>an</strong>gle of attack of 0 o to the<br />
<strong>flow</strong>. The Pitot tube ahead of the model was attached to a m<strong>an</strong>ometer to determine<br />
the air speed inside the wind tunnel.<br />
The Pitot tube measures the air pressure of the free <strong>flow</strong> upstream of the <strong>fin</strong> model<br />
(the static pressure), <strong>an</strong>d compares it to the stagnation pressure, the pressure of the<br />
fluid after it has been slowed to zero velocity.<br />
The Pitot tube, as shown in the diagram below, is created from a pair of concentric<br />
tubes, one inside the other.<br />
Free stream pressure<br />
Small holes<br />
Figure 33: Diagram of a Pitot tube.<br />
The hole in the front of the central tube- aligned such that it is facing into the <strong>flow</strong>,<br />
measures the stagnation pressure of the <strong>flow</strong>, p0, as it is <strong>for</strong>ced to zero velocity. The<br />
small holes in the sides of the outer tube allow measurement of the static pressure,<br />
ps, the pressure of the moving <strong>flow</strong> relative to itself. This pressure difference is<br />
measured by a device known as a m<strong>an</strong>ometer. (Munson, Young, <strong>an</strong>d Okiiski 2006;<br />
White 2008)<br />
An initial m<strong>an</strong>ometer reading was recorded, prior to turning on the wind tunnel, as a<br />
measurement of 0 velocity.<br />
The wind tunnel was then turned on <strong>an</strong>d the intake opened until approximately half<br />
open.<br />
The pressure difference in the tunnel was recorded using the m<strong>an</strong>ometer. For this<br />
single pressure difference, <strong>an</strong>d hence a consistent air speed, the model was turned<br />
54
through a r<strong>an</strong>ge of <strong>an</strong>gles with respect to the <strong>flow</strong>. For each <strong>an</strong>gle, several<br />
photographs were taken of the tell tale behaviour, from various <strong>an</strong>gles through the<br />
wind tunnel Perspex windows.<br />
The original wind tunnel trials recorded the <strong>flow</strong> behaviour <strong>for</strong> the following <strong>an</strong>gles<br />
of attack: 0 o , 5 o , 10 o , 12 o , 14 o , 16 o , 18 o , 20 o . These <strong>an</strong>gles were chosen since a<br />
narrow r<strong>an</strong>ge of <strong>an</strong>gles was expected, based on NACA 6-series behaviour.<br />
Preliminary tests confirmed this, <strong>an</strong>d suggested that the <strong>flow</strong> was likely to stall at<br />
approximately 10 o .<br />
It was originally pl<strong>an</strong>ned that the <strong>flow</strong> about the <strong>fin</strong> model would be tested <strong>for</strong> the<br />
speeds r<strong>an</strong>ging from 22ms -1 - 30ms -1 , <strong>an</strong>d increasing by 2ms -1 , but since <strong>an</strong> <strong>an</strong>alogue<br />
m<strong>an</strong>ometer was used, as shown below, approximate velocities were used.<br />
Figure 34: M<strong>an</strong>ometer used to show the pressure difference measured by the Pitot<br />
tube.<br />
Since the m<strong>an</strong>ometer readings were variable, the measurements were based on the<br />
average reading, <strong>an</strong>d the uncertainty on the st<strong>an</strong>dard deviation.<br />
z<br />
z =<br />
max<br />
− z<br />
2<br />
min<br />
After the experiment was per<strong>for</strong>med, the height shown by the m<strong>an</strong>ometer was<br />
converted to a measurement of velocity using Bernoulli’s equation, as shown below:<br />
1<br />
1 2<br />
+<br />
ρ + γ = + ρ v0<br />
+ γh<br />
2<br />
2<br />
2<br />
Pf airv<br />
f h f P0<br />
air<br />
0<br />
55
(Munson, Young, <strong>an</strong>d Okiiski 2006; White 2008; Bernoulli's Equation 1997;<br />
Engineering ToolBox 2011)<br />
Where the left h<strong>an</strong>d side refers to the free <strong>flow</strong> upstream of the <strong>fin</strong>, <strong>an</strong>d the right<br />
h<strong>an</strong>d side refers to the stagnation point of the <strong>flow</strong>. Since the hf is equal to h0, <strong>an</strong>d<br />
the stagnation point has a velocity of 0ms -1 this simplifies to:<br />
1<br />
+ ρ<br />
2<br />
2<br />
Pf airv<br />
f<br />
= P<br />
0<br />
Rearr<strong>an</strong>ging this equation allows the velocity of the free stream, vf, to be determined:<br />
v<br />
f<br />
=<br />
P<br />
2( f − 0<br />
ρ<br />
air<br />
P )<br />
Since the pressure was measured as the ch<strong>an</strong>ge in height of water inside the<br />
m<strong>an</strong>ometer, the hydrostatic <strong>for</strong>mula c<strong>an</strong> be substituted <strong>for</strong> the pressure difference.<br />
Thus,<br />
P − P = −ρ<br />
water g z − z<br />
v<br />
2<br />
f<br />
=<br />
Rearr<strong>an</strong>ging gives:<br />
v<br />
f<br />
=<br />
1<br />
water<br />
air<br />
( 2 1<br />
2ρ g(<br />
z0<br />
z ) −<br />
−<br />
ρ<br />
ρ g z z )<br />
2 water ( f − 0<br />
ρ<br />
air<br />
f<br />
)<br />
(White 2008)<br />
The pressure difference measured by the Pitot tube is measured as the ch<strong>an</strong>ge in<br />
height between the <strong>flow</strong> speed, zf, <strong>an</strong>d the height at atmospheric pressure, z0.<br />
z z f − = ∆<br />
z0<br />
This height difference must be then converted such that it is measured in metres.<br />
Following this, the height difference c<strong>an</strong> be substituted into the equation <strong>for</strong> the free<br />
stream velocity:<br />
v<br />
f<br />
=<br />
2ρ<br />
g * ∆z<br />
water<br />
ρ<br />
air<br />
56
The uncertainty of the free stream velocity was calculated as follows:<br />
z _ uncertai.<br />
nty<br />
v f _ uncertain.<br />
ty = v f *<br />
∆z<br />
Table 12: M<strong>an</strong>ometer readings wind tunnel experiment 1<br />
Set No M<strong>an</strong>ometer Reading Ch<strong>an</strong>ge in elevation, Δz Air speed<br />
(mm)<br />
(m)<br />
(ms -1 )<br />
0ms -1 2.5 ± 0.5 - -<br />
Set 1 17 ± 1 0.015 ± 0.001 15.4 ± 1.06<br />
Set 2 30 ± 1.4 0.028 ± 0.001 21.2 ± 1.09<br />
Set 3 48 ± 1.4 0.046 ± 0.001 27.3 ± 0.84<br />
Table 13: M<strong>an</strong>ometer readings wind tunnel experiment 2<br />
Set No M<strong>an</strong>ometer Reading Ch<strong>an</strong>ge in elevation, Δz Air speed<br />
(mm)<br />
(m)<br />
(ms -1 )<br />
0ms -1 5.5 ± 0.5 - -<br />
Set 1 18.5 ± 1 0.013 ± 0.001 14.6 ± 1.12<br />
Set 2 32.25 ± 3 0.027 ± 0.003 20.9 ± 2.49<br />
For each pressure reading made in the first set of wind tunnel experiments, the<br />
following <strong>an</strong>gles of attack were tested: 0 o , 5 o , 10 o , 12 o , 14 o , 16 o , 18 o <strong>an</strong>d 20 o . For<br />
each pressure reading made in the second set of wind tunnel experiments, the<br />
following <strong>an</strong>gles of attack were tested: 0 o , 8 o , 10 o , 12 o , 14 o , <strong>an</strong>d 16 o .<br />
4.4.2 Experimental results<br />
The behaviour of the tell tales will be discussed in terms of the y-displacement<br />
(bravo, charlie, echo <strong>an</strong>d golf) <strong>an</strong>d then the position relative to the leading edge of<br />
the <strong>fin</strong> model (1, 2 <strong>an</strong>d 3 as 10%, 50% <strong>an</strong>d 90% respectively).<br />
The second set of wind tunnel experiments using the steel plate have been included<br />
below.<br />
The first velocity tested with the steel plate was 14.6 ms -1 .<br />
57
Figure 35: Fin model oriented at 10 o to the <strong>flow</strong>, with wind speed of 14.6 ms -1 .<br />
(Photo #8313)<br />
When the model had <strong>an</strong> <strong>an</strong>gle of attack of 10 o to the air <strong>flow</strong>ing at 14.6 ms -1 , the tell<br />
tales showed mostly attached <strong>flow</strong> over the <strong>fin</strong>, with separation beginning to occur<br />
at towards the trailing edge, at tell tales b2, b3, c2, c3 <strong>an</strong>d e3. This suggests that the<br />
region of separation moves down along the <strong>fin</strong> from the ‘root’, towards the free tip.<br />
Figure 36: Fin model oriented at 12 o to the <strong>flow</strong>, with wind speed of 14.6 ms -1 .<br />
(Photo #8318)<br />
58
When the model had <strong>an</strong> <strong>an</strong>gle of attack of 12 o to the incoming air stream of 14.6<br />
ms -1 , the tell tales showed separation towards the rear of the model, at tell-tales<br />
b3,c3, e3 <strong>an</strong>d g3, as shown in the above figure.<br />
Figure 37: Fin model oriented at 14 o to the <strong>flow</strong>, with wind speed of 14.6 ms -1 .<br />
(Photo #8321)<br />
When the <strong>an</strong>gle of attack is increased to 14 o , the <strong>flow</strong> separation occurs at/just after<br />
the leading edge of the <strong>fin</strong> <strong>for</strong> cross-sections bravo, charlie <strong>an</strong>d golf. Cross section<br />
echo is only showing separation at the trailing edge.<br />
59
Figure 38: Fin model oriented at 16 o to the <strong>flow</strong>, with wind speed of 14.6 ms -1 .<br />
(Photo #8338)<br />
When the <strong>an</strong>gle of attack is increased again, the <strong>flow</strong> is fully separated.<br />
The <strong>fin</strong> model was then ‘reset’ to a 0 o <strong>an</strong>gle of attack, <strong>an</strong>d the air speed inside the<br />
tunnel increased to 20.9 ms -1 .<br />
60
Figure 39: Fin model oriented at 8 o to the <strong>flow</strong>, with wind speed of 20.9 ms -1 . (Photo<br />
#8361)<br />
When the model of the <strong>RS</strong>X <strong>fin</strong> is at <strong>an</strong> <strong>an</strong>gle of attack of 8 o to 20.9 ms -1 wind, the<br />
<strong>flow</strong> across the foil surface is completely attached, as shown by the above figure.<br />
Figure 40: Fin model oriented at 10 o to the <strong>flow</strong>, with wind speed of 20.9 ms -1 .<br />
(Photo #8352)<br />
61
For the <strong>fin</strong> oriented at 10 o , then the <strong>flow</strong> separation occurs somewhere between 10-<br />
50% of the chord length, <strong>for</strong> cross sections bravo <strong>an</strong>d charlie, <strong>an</strong>d towards the<br />
trailing edge of cross section echo.<br />
Figure 41: Fin model oriented at 12 o to the <strong>flow</strong>, with wind speed of 20.9 ms -1 .<br />
(Photo #8369)<br />
When the foil model is oriented at 12 o towards the incoming 20.9 ms -1 fluid,<br />
separation occurs at the leading edge of cross sections bravo <strong>an</strong>d charlie, <strong>an</strong>d<br />
towards the trailing edges of echo <strong>an</strong>d golf.<br />
62
Figure 42: Fin model oriented at 14 o to the <strong>flow</strong>, with wind speed of 20.9 ms -1 .<br />
(Photo #8378)<br />
At <strong>an</strong> <strong>an</strong>gle of attack of 14 o , the <strong>flow</strong> is separating at the leading edge of cross<br />
sections bravo <strong>an</strong>d charlie, <strong>an</strong>d at 10-50% of chord of cross sections golf <strong>an</strong>d echo.<br />
Figure 43: Fin model oriented at 16 o to the <strong>flow</strong>, with wind speed of 20.9 ms -1 .<br />
(Photo #8387)<br />
63
At 16 o , the <strong>flow</strong> separates at the leading edge of all cross sections, <strong>an</strong>d is hence fully<br />
stalled.<br />
It should be noted that a cross <strong>flow</strong> is clearly present <strong>flow</strong>ing across the upper<br />
surface of the <strong>fin</strong> directed away from the tip. It c<strong>an</strong> be seen in the consistent <strong>an</strong>gling<br />
of the tell tales away from the <strong>fin</strong> tip. It is strongest at the tip, as the tell tales along<br />
cross section golf are consistently directed towards the root of the <strong>fin</strong>.<br />
This makes sense from a theoretical perspective, since the upper edge of the <strong>fin</strong>, also<br />
referred to as the root, is ‘closed’ to circular <strong>flow</strong> <strong>around</strong> the edge of the <strong>fin</strong>, due to<br />
the steel plate, the <strong>flow</strong> is swept up only about the tip of the <strong>fin</strong>. This me<strong>an</strong>s that<br />
trailing edge vortices are only produced from the tip of the <strong>fin</strong>, <strong>an</strong>d there exists a<br />
pl<strong>an</strong>ar component to the motion of the fluid across the upper <strong>an</strong>d lower surfaces of<br />
the <strong>fin</strong>. The upper surface of the <strong>fin</strong> will experience a cross-<strong>flow</strong> in the direction<br />
from the tip towards the root, <strong>an</strong>d the lower surface will experience a cross <strong>flow</strong> in<br />
the opposite direction, towards the tip.<br />
The key conclusions to be drawn from the experimental data are as follows:<br />
• Flow separation starts at the ‘root’ of the foil, <strong>an</strong>d progresses along the<br />
length of the <strong>fin</strong> as the <strong>an</strong>gle of attack is increased.<br />
• Alternatively, <strong>flow</strong> separation c<strong>an</strong> occur at the root <strong>an</strong>d tip of the foil, <strong>an</strong>d<br />
then progress towards the centre of the <strong>fin</strong>.<br />
• Moves <strong>for</strong>ward from the trailing edge towards the leading edge.<br />
• Separation along the foil initiates at approximately 10 o , <strong>an</strong>d is the foil is fully<br />
stalled by 16 o .<br />
• Close to the model tip, there is a signific<strong>an</strong>t level of cross <strong>flow</strong> on the upper<br />
surface directed towards the root.<br />
It should be noted that, due to practical considerations, the pressure <strong>an</strong>d lift on the<br />
surface of the model was unable to be measured, <strong>an</strong>d there<strong>for</strong>e were unable to be<br />
compared with the computational <strong>an</strong>alysis.<br />
64
4.4.3 Application of experimental results to full-scale model<br />
The air speeds interacting with the model inside the wind tunnel c<strong>an</strong> be compared to<br />
speed of water <strong>flow</strong>ing past the full sized <strong>fin</strong> using the Reynolds number relationship,<br />
as discussed in section 4.1.1.<br />
Thus, the air speeds tested are dynamically similar to the following water speeds<br />
with respect to the <strong>fin</strong>. They c<strong>an</strong> be related using the following equation, as<br />
determined in chapter 4.1.2.<br />
Thus,<br />
V = 14.<br />
64V<br />
air<br />
water<br />
water<br />
V = 0.<br />
0683V<br />
air<br />
From this, the air speeds tested in the wind tunnel c<strong>an</strong> be compared to the water<br />
speeds likely to be encountered by a full size <strong>fin</strong>, as shown in the table below.<br />
Table 14: Equivalent speeds to air speeds tested<br />
Experiment Set No Air speed, model<br />
(ms -1 )<br />
Water speed, <strong>fin</strong><br />
(ms -1 )<br />
1 Set 1 15.4 ± 1.06 1.05 ± 0.07<br />
1 Set 2 21.2 ± 1.09 1.45 ± 0.07<br />
1 Set 3 27.3 ± 0.84 1.86 ± 0.06<br />
2 Set 1 14.6 ± 1.12 0.99 ± 0.08<br />
2 Set 2 20.9 ± 2.49 1.43 ± 0.17<br />
Since the operating speeds <strong>for</strong> the <strong>fin</strong> r<strong>an</strong>ge from 61.2 ms -1 to 183 ms -1 , as discussed<br />
in section 4.1.2, the wind speeds tested <strong>for</strong> all experiments excepting Experiment 1,<br />
Set 3, are actually outside (below) this r<strong>an</strong>ge. Despite this, the Reynolds numbers of<br />
the wind tunnel <strong>flow</strong> have the same order of magnitude as the practical situation,<br />
<strong>an</strong>d c<strong>an</strong> there<strong>for</strong>e be considered equivalent.<br />
This me<strong>an</strong>s that the model <strong>an</strong>d full sized <strong>fin</strong> are dynamically similar, as the Reynolds<br />
numbers of the <strong>flow</strong> situations tested are equivalent to the minimum Reynolds<br />
number of the <strong>flow</strong> situations in which <strong>an</strong> <strong>RS</strong>X foil is typically used.<br />
Despite this, the maximum <strong>flow</strong> speed which the wind tunnel is capable of is still<br />
only in the lower use r<strong>an</strong>ge of the <strong>RS</strong>X <strong>fin</strong>. Where the board is pl<strong>an</strong>ing upwind at less<br />
th<strong>an</strong> 8 knots (4.12ms 1 ), the <strong>fin</strong> is used in conjunction with the centreboard, <strong>an</strong>d thus<br />
neither the computational nor the experimental <strong>an</strong>alysis is suitable <strong>for</strong> this situation.<br />
Additionally, since this report is focussed on the <strong>flow</strong> about the <strong>fin</strong> in <strong>racing</strong><br />
conditions, it should be noted that the wind tunnel was not capable of the extremely<br />
high speeds required to simulate <strong>racing</strong> speeds. Despite this, the Reynolds numbers<br />
65
of the <strong>flow</strong>s tested experimentally are still of the same order of magnitude as a <strong>flow</strong><br />
likely to be encountered at <strong>racing</strong> speeds. Thus, these experiments have provided<br />
clear insight into the way in which the fluid moves <strong>around</strong> the foil, <strong>an</strong>d this c<strong>an</strong> be<br />
applied to both low <strong>an</strong>d high speed usage of the <strong>RS</strong>:X board.<br />
5. Computational Analysis<br />
The computational <strong>an</strong>alysis of the <strong>flow</strong> <strong>around</strong> the <strong>RS</strong>: X Racing <strong>66</strong> <strong>windsur<strong>fin</strong>g</strong> <strong>fin</strong><br />
was conducted using OpenFOAM, <strong>an</strong> open source (<strong>an</strong>d there<strong>for</strong>e readily attainable)<br />
fluid dynamics software. The purpose of the computational <strong>an</strong>alysis was to examine<br />
the expected <strong>flow</strong> <strong>around</strong> the <strong>fin</strong> at various <strong>an</strong>gles of attack, <strong>an</strong>d <strong>for</strong> comparison<br />
with the experimental results from the wind tunnel, <strong>an</strong>d the expected results <strong>for</strong> a<br />
NACA 65-009 section. The ch<strong>an</strong>ge in <strong>flow</strong> with time c<strong>an</strong> also be <strong>an</strong>alysed (i.e. start<br />
up, <strong>an</strong>d separation), as c<strong>an</strong> three dimensional effects such as tip vortices.<br />
5.1. XFOIL<br />
XFOIL is a program created by Drela <strong>an</strong>d Youngren with the intent of assisting a user<br />
with the design <strong>an</strong>d <strong>an</strong>alysis of subsonic aerofoils <strong>for</strong> different types of <strong>flow</strong>s <strong>an</strong>d<br />
different <strong>an</strong>gles of attack. (Drela <strong>an</strong>d Youngren 2001a, 2001b; Matyushev 2009)<br />
The program was written in Fortr<strong>an</strong>, <strong>an</strong>d is available in 32-bit versions only <strong>for</strong><br />
Windows, Mac <strong>an</strong>d Linux operating systems. (Matyushev 2009)<br />
The software is capable of <strong>flow</strong> <strong>an</strong>alysis <strong>for</strong> both viscous <strong>an</strong>d inviscid <strong>flow</strong>, <strong>an</strong>d in the<br />
case of the <strong>for</strong>mer, is capable of not only identifying the existence of a boundary<br />
layer, but also the location of laminar-turbulent tr<strong>an</strong>sition. (Drela <strong>an</strong>d Youngren<br />
2001b)<br />
XFOIL was used to determine the location of the boundary layer tr<strong>an</strong>sition from<br />
laminar to turbulent boundary layer <strong>flow</strong>, with respect to the chord length. If the<br />
boundary layer is primarily laminar, the computational <strong>an</strong>alysis should be conducted<br />
using laminar <strong>flow</strong>, <strong>an</strong>d if it is turbulent, it should be conducted with a suitable<br />
turbulence model.<br />
5.1.1 Boundary layer <strong>an</strong>alysis using XFOIL<br />
As in section 3.1.1, the profile measured across y-displacement charlie was used as<br />
the ‘characteristic’ profile <strong>for</strong> the <strong>RS</strong>: X <strong>66</strong>cm <strong>windsur<strong>fin</strong>g</strong> <strong>fin</strong>.<br />
As noted by Martellotta (2010), <strong>an</strong>d mentioned in chapter 3.3, the accuracy <strong>an</strong>d<br />
precision with which a leading edge radius of a foil is specified is crucial <strong>for</strong> the<br />
program to be able to model the fluid <strong>flow</strong> appropriately, without the program<br />
modelling <strong>an</strong> unrealistic leading edge separation. Thus, to this end, the profile<br />
loaded into XFOIL had the leading edge specified every 0.1 radi<strong>an</strong>s (≈5 o ).<br />
<strong>66</strong>
XFOIL determines the pressure distribution <strong>an</strong>d boundary layer about a foil based on<br />
the foil profile, the <strong>an</strong>gle of attack, <strong>an</strong>d the dimensionless <strong>flow</strong> characteristics of the<br />
Reynolds number <strong>an</strong>d the Mach number.<br />
5.1.2 Reynolds <strong>an</strong>d Mach numbers of the wind tunnel <strong>flow</strong><br />
The Reynolds number used the <strong>an</strong>alysis in XFOIL was the minimum calculated<br />
Reynolds number at the foil position, 1.5 x 10 6 , <strong>for</strong> the minimum <strong>flow</strong> speed of 22ms -<br />
1 , as calculated in chapter 4.1.2.<br />
The Reynolds number is without doubt the most well-known dimensionless<br />
parameter in fluid mech<strong>an</strong>ics, due to its relev<strong>an</strong>ce to almost all fluid dynamics<br />
problems. (Munson, Young, <strong>an</strong>d Okiiski 2006; White 2008)<br />
Several other dimensionless parameters also exist, with each characterising the<br />
relationship between a different pair of <strong>for</strong>ces, <strong>an</strong>d hence have uses in varying<br />
applications of fluid mech<strong>an</strong>ics. The Mach number, Ma, is <strong>an</strong>other dimensionless<br />
variable used to describe <strong>flow</strong> behaviour. It is used when characterising <strong>flow</strong>s “in<br />
which the compressibility of the fluid is import<strong>an</strong>t.” (Munson, Young, <strong>an</strong>d Okiiski<br />
2006, 362)<br />
The Mach number is the ratio of the inertia <strong>for</strong>ce to the compressibility <strong>for</strong>ce, <strong>an</strong>d is<br />
thus dependent on the velocity of the fluid, V, relative to the speed of the sound<br />
within the medium, c, as shown below.<br />
inertia _ <strong>for</strong>ce<br />
Ma =<br />
compressibility<br />
_ <strong>for</strong>ce<br />
V<br />
Ma =<br />
c<br />
(Munson, Young, <strong>an</strong>d Okiiski 2006)<br />
Since the model will be tested inside the Curtin wind tunnel, the Mach number <strong>for</strong><br />
<strong>flow</strong> inside the wind tunnel is required to accurately simulate this <strong>flow</strong> using XFOIL.<br />
The speed of sound in air (at 20 o C <strong>an</strong>d st<strong>an</strong>dard atmospheric pressure) is 343ms -1 ,<br />
according to Serway <strong>an</strong>d Jewett (2004, 514). This value was used to determine the<br />
Mach number <strong>for</strong> the maximum <strong>an</strong>d minimum wind tunnel test speeds. The model<br />
was tested under speeds r<strong>an</strong>ging from 22-30ms -1 .<br />
Thus, the maximum Mach number was calculated as follows:<br />
M<br />
air _ min =<br />
V<br />
air _ min<br />
c<br />
air<br />
67
M air _ min<br />
M air _ min<br />
22ms<br />
=<br />
343ms<br />
=<br />
0.<br />
0641<br />
−1<br />
−1<br />
Likewise, the maximum Mach number was calculated as follows:<br />
M<br />
air _ max =<br />
M air _ max<br />
M air _ max<br />
V<br />
air _ max<br />
c<br />
air<br />
30ms<br />
=<br />
343ms<br />
=<br />
0.<br />
0875<br />
−1<br />
−1<br />
Thus, the average Mach number is:<br />
M airav<br />
M air _ max<br />
=<br />
+ M air _ min<br />
2<br />
M airav<br />
M airav<br />
0 . 0875 + 0.<br />
0641<br />
=<br />
2<br />
= 0.<br />
0758<br />
This value was used <strong>for</strong> the <strong>an</strong>alysis of the boundary layer in XFOIL.<br />
(3 signific<strong>an</strong>t figures)<br />
(3 signific<strong>an</strong>t figures)<br />
(3 signific<strong>an</strong>t figures)<br />
5.1.3 Boundary layer <strong>an</strong>d pressure distribution<br />
The <strong>flow</strong> <strong>around</strong> the cross-section denoted ‘charlie’ was <strong>an</strong>alysed <strong>for</strong> various <strong>an</strong>gles,<br />
<strong>for</strong> the following values of the Reynolds <strong>an</strong>d Mach numbers, as determined in the<br />
previous section:<br />
Reynolds number = 1.5e6<br />
Mach number = 0.076<br />
In addition to this, 100 iterations were used per set of the boundary layer <strong>an</strong>alysis.<br />
The pressure distribution about the foil when it is oriented parallel to the <strong>flow</strong> is<br />
quite flat, excepting a peak just past the leading edge, which is similar to the<br />
pressure distribution expected <strong>for</strong> a NACA 65-009, as discussed in section 2.2.4.<br />
68
Figure 44: The boundary layer <strong>an</strong>d distribution of pressure <strong>for</strong> foil cross-section<br />
charlie, determined from a Reynolds number of 1.5x10 6 <strong>an</strong>d a Mach number of 0.076,<br />
when the foil is oriented parallel to the <strong>flow</strong>.<br />
As discussed in section 2.1.1, the boundary layer tr<strong>an</strong>sition c<strong>an</strong> be seen to have<br />
occurred where the boundary layer becomes thicker. XFOIL determines the location<br />
of tr<strong>an</strong>sition in the boundary layer with each calculation of the pressure coefficient,<br />
Cp.<br />
The table below includes the location of boundary layer tr<strong>an</strong>sition on each side of<br />
the foil <strong>for</strong> each <strong>an</strong>gle of attack tested.<br />
69
Table 15: Location of boundary layer tr<strong>an</strong>sition on the <strong>RS</strong>X characteristic crosssection<br />
as calculated by XFOIL <strong>for</strong> various <strong>an</strong>gles of attack<br />
Angle Number of Number of Convergence<br />
Tr<strong>an</strong>sition<br />
iterations/set sets reached<br />
(% chord)<br />
(degrees) (y/n) side 1 side 2<br />
0 100 1 y 1.29 1.29<br />
5 100 2 y 0.99 23.44<br />
10 100 3 y 0.78 55.53<br />
12 100 1 y 0.73 57.71<br />
14 100 2 y 0.72 58.59<br />
16 100 1 y 0.72 58.84<br />
18 100 1 y 0.72 59.13<br />
20 100 1 y 0.71 60.42<br />
The boundary layer tr<strong>an</strong>sition occurred earlier on the <strong>fin</strong> surface th<strong>an</strong> expected <strong>for</strong><br />
all <strong>an</strong>gles of attack tested.<br />
The locations of boundary layer tr<strong>an</strong>sition <strong>for</strong> the <strong>RS</strong>X c<strong>an</strong> be compared to the<br />
locations of boundary layer tr<strong>an</strong>sition <strong>for</strong> the NACA 65-009. The values <strong>an</strong>d<br />
corresponding graph have been included below.<br />
Table 16: Location of boundary layer tr<strong>an</strong>sition on the NACA 65-009 as calculated by<br />
XFOIL <strong>for</strong> various <strong>an</strong>gles of attack<br />
Angle Number of Number of Convergence<br />
Tr<strong>an</strong>sition<br />
iterations/set sets reached<br />
(% chord)<br />
(degrees) (y/n) side 1 side 2<br />
0 100 1 y 4.28 4.31<br />
5 100 2 y 0.65 33.23<br />
10 100 2 y 0.06 56.<strong>66</strong><br />
12 100 1 y 0.06 63.48<br />
14 100 1 y 0.06 68.45<br />
16 100 1 y 0.06 71.82<br />
18 100 1 y 0.06 76.55<br />
20 100 3 n - -<br />
70
Figure 45: The location of boundary layer tr<strong>an</strong>sition (side 1) <strong>for</strong> the <strong>RS</strong>X <strong>an</strong>d NACA<br />
65-009 foils.<br />
Figure 46: The location of boundary layer tr<strong>an</strong>sition (side 2) <strong>for</strong> the <strong>RS</strong>X <strong>an</strong>d NACA<br />
65-009 foils.<br />
71
The location of boundary layer tr<strong>an</strong>sition is consistently earlier <strong>for</strong> the leeward side,<br />
side 2, on the <strong>RS</strong>X th<strong>an</strong> on the 65-009 foil, but consistently later on the windward<br />
side, side 1. Despite this, the boundary layer tr<strong>an</strong>sition plots are relatively similar in<br />
shape, which was expected due to the similarity of the <strong>RS</strong>X <strong>an</strong>d NACA 65-009 foils.<br />
For low <strong>an</strong>gles of attack, the <strong>RS</strong>X shows <strong>an</strong> early tr<strong>an</strong>sition to turbulent boundary<br />
layer <strong>flow</strong>, although this decreases as the <strong>an</strong>gle of attack increases. For <strong>an</strong>gles<br />
between 10 o <strong>an</strong>d 20 o , the tr<strong>an</strong>sition point on the leeward side shifts back to 50-60%,<br />
<strong>an</strong>d c<strong>an</strong> there<strong>for</strong>e be considered approximately equally dominated by laminar <strong>an</strong>d<br />
turbulent <strong>flow</strong>. However, the experimental testing in discussed chapter 4 suggests<br />
that the <strong>RS</strong>X <strong>fin</strong> will be stalled by approximately 14 o , suggesting that <strong>for</strong> this r<strong>an</strong>ge of<br />
<strong>an</strong>gles, the <strong>flow</strong> is dominated by turbulence.<br />
Thus, the boundary layer of the <strong>RS</strong>X <strong>fin</strong> typically has a <strong>an</strong> early tr<strong>an</strong>sition to turbulent<br />
<strong>flow</strong>, suggesting that the computational <strong>an</strong>alysis will be more realistic if conducted<br />
using a turbulent <strong>flow</strong> model.<br />
5.2. OpenFOAM<br />
The name OpenFOAM st<strong>an</strong>ds <strong>for</strong> ‘Open Field Operation And M<strong>an</strong>ipulation’ <strong>an</strong>d the<br />
program is a free, open source computational fluid dynamics software, suitable <strong>for</strong><br />
solving problems in fluid dynamics involving turbulence, heat tr<strong>an</strong>sfer or chemical<br />
reactions, solid dynamics <strong>an</strong>d electrodynamics.<br />
As stated by the OpenFOAM website, “OpenFOAM uses <strong>fin</strong>ite volume numerics to<br />
solve systems of partial differential equations ascribed on <strong>an</strong>y 3D unstructured mesh<br />
of polyhedral cells. The fluid <strong>flow</strong> solvers are developed within a robust, implicit,<br />
pressure-velocity, iterative solution framework, although alternative techniques are<br />
applied to other continuum mech<strong>an</strong>ics solvers.” (OpenFOAM 2011a)<br />
The use of OpenFOAM c<strong>an</strong> be characterised into three distinct components:<br />
-pre-processing<br />
-processing<br />
-post-processing (OpenFOAM 2011a)<br />
Pre-processing involves setting up the system to be modelled, which in this case<br />
refers to creating the mesh representing the <strong>fin</strong>, <strong>an</strong>d mesh of the fluid surrounding it,<br />
<strong>an</strong>d setting up the initial constraints on the system. These initial constraints refer to<br />
the fluid pressure, velocity, <strong>an</strong>gle of attack etc. (OpenFOAM 2011a, 2011c)<br />
ParaView is the associated software <strong>for</strong> viewing the fluid <strong>flow</strong> problems (postprocessing).<br />
It includes a graphic user interface which allows <strong>for</strong> interactive<br />
m<strong>an</strong>ipulation of the fluid. It enables the effect of time on a problem to be examined.<br />
(OpenFOAM 2011a, 2011b)<br />
In the context of this report, post-processing involves examining the streamlines<br />
showing the pressure <strong>an</strong>d velocity distribution of the fluid as it <strong>flow</strong>s past the foil.<br />
72
5.3. Computational procedure<br />
5.2.1 Pre-processing<br />
The <strong>fin</strong> was modelled using the snappy hex mesh function, using the surface STL file<br />
generated from AutoCAD. The fluid surrounding the <strong>fin</strong> was modelled using the<br />
block mesh function, dividing the region surrounding the foil into several areas to<br />
ensure the behaviour towards the leading edge was correctly, <strong>an</strong>d clearly, modelled.<br />
The block mesh of the fluid surrounding the foil was then graded such that it will be<br />
<strong>fin</strong>er in the region near the foil, <strong>an</strong>d less <strong>fin</strong>e towards the mesh boundaries. This<br />
improves the computational efficiency. Grading the mesh also ensures that the fluid<br />
behaviour is modelled clearly in the region of interest: close to the <strong>fin</strong>, but at the<br />
expense of being less accurate towards the outer limits of the modelled area.<br />
The mesh was produced such that it would be the same size (relative to the <strong>fin</strong>) as<br />
the wind tunnel is to the model. That is, double the dimensions of the actual tunnel,<br />
<strong>an</strong>d the full size <strong>fin</strong> is twice the size of the model. Thus the dimensions used <strong>for</strong> the<br />
computational tunnel were 3m x 0.914m x 0.914m.<br />
The <strong>flow</strong> conditions had to be specified including the fluid pressure, velocity, <strong>an</strong>d<br />
whether the fluid is attached or turbulent, etc.<br />
The fluid was assumed to be water, allowing the velocities tested to be directly<br />
equivalent to the velocities encountered by the full scale model.<br />
The no slip condition was conserved at the foil surface, thus invoking the boundary<br />
layer requirement. Since the foil boundary layer, <strong>an</strong>d hence the <strong>flow</strong> across the foil<br />
surface is primarily turbulent (see chapter 5.1.3), the <strong>flow</strong> was modelled as turbulent.<br />
To this end, the <strong>flow</strong> was modelled using the SpalartAllmaras turbulence model.<br />
Spalart Allmaras is a classical turbulence model. It is a time averaged Reynolds<br />
Averaged Navier Stokes (RANS) single equation model. Turbulence models allow the<br />
calculation of me<strong>an</strong> <strong>flow</strong>, without first needing the complete time dependent <strong>flow</strong><br />
field. The Spalart Allmaras model is primarily used <strong>for</strong> aerodynamics problems, given<br />
that is reasonably efficient <strong>an</strong>d accurate <strong>for</strong> <strong>flow</strong>s with mild separation. (Bakker 2005;<br />
Javaherchi 2010)<br />
5.2.2 Processing<br />
After <strong>flow</strong> conditions were specified, the program was run by first de<strong>fin</strong>ing the<br />
meshes, then using the ‘preparation’ turbulence model: potentialFoam, followed by<br />
the turbulent model: simpleFoam. (OpenFOAMWiki 2009)<br />
The models were run <strong>for</strong> 500 seconds, after which time it was expected that the <strong>flow</strong><br />
was likely to have converged.<br />
73
5.2.3 Post-processing<br />
After the <strong>flow</strong> models have been processed, the model c<strong>an</strong> be opened using the<br />
visualisation software, ParaView, as mentioned above.<br />
Running the models with time shows that they typically converged at 3seconds,<br />
me<strong>an</strong>ing that results produced at time 500 should be steady-state.<br />
For each of these models, streamlines were produced that <strong>flow</strong>ed past various ydisplacements<br />
along the foils corresponding with the measured cross-sections. This<br />
will be discussed in the following section.<br />
5.4. Computational results<br />
Velocity <strong>an</strong>d pressure streamlines were produced about cross sections charlie, echo<br />
<strong>an</strong>d hotel <strong>for</strong> each velocity tested, at 10 o , 12 o <strong>an</strong>d 14 o with respect to the <strong>flow</strong>.<br />
5.3.1 Comparison to experimental results<br />
The behaviour of the <strong>flow</strong> about the <strong>RS</strong>X has been modelled computationally using<br />
the AutoCAD file produced to print the three dimensional model <strong>for</strong> the<br />
experimental <strong>an</strong>alysis. Thus, it c<strong>an</strong> be assumed that the physical <strong>an</strong>d computational<br />
models are identical, barring <strong>an</strong>y discrep<strong>an</strong>cies in the resin coating of the physical<br />
model.<br />
As previously mentioned, the pressure <strong>an</strong>d lift were unable to be determined<br />
experimentally, <strong>an</strong>d there<strong>for</strong>e were unable to be compared with values determined<br />
computationally.<br />
The first speed tested was selected to be equivalent to the experimental <strong>flow</strong> speed<br />
tested of 20.9 ms -1 . The equivalent speed in OpenFOAM was calculated so as to be<br />
dynamically similar to the experimental <strong>flow</strong> speed. From chapter 4.1.2, it is known<br />
that:<br />
V = 14.<br />
85V<br />
air<br />
water<br />
Table 17: Equivalent velocities <strong>for</strong> computational, experimental <strong>an</strong>d physical <strong>flow</strong>s.<br />
OpenFOAM- computational<br />
speed (ms -1 <strong>RS</strong>X- equivalent speed<br />
)<br />
(ms -1 Experimental <strong>flow</strong> speed<br />
)<br />
(ms -1 )<br />
1.43 1.43 20.9<br />
Thus, the results determined in the wind tunnel at 20.9 ms -1 must be equivalent to a<br />
computational <strong>an</strong>alysis conducted at 1.43 ms -1 . These results have been included<br />
below.<br />
The <strong>an</strong>gles of attack which were <strong>an</strong>alysed computationally mimicked those tested<br />
experimentally. It should be noted that, <strong>for</strong> the sake of efficiency, the <strong>an</strong>gle of<br />
74
attack was ch<strong>an</strong>ged by ch<strong>an</strong>ging the direction of the incoming fluid, rather th<strong>an</strong> the<br />
<strong>an</strong>gle of the foil itself. An effect of this is that the water appears to travel through<br />
the tunnel walls, although there is no other impact on <strong>flow</strong> behaviour.<br />
The earliest <strong>an</strong>gle tested computationally was 8 o , <strong>an</strong>d <strong>for</strong> this <strong>an</strong>gle of attack, the<br />
<strong>flow</strong> was not attached across the entirety of the <strong>fin</strong> surface. It was attached across<br />
y-displacements bravo, charlie <strong>an</strong>d echo, but not hotel. This early separation at<br />
cross section hotel suggests a fault in the leading edge radius used to model this<br />
cross section, in accord<strong>an</strong>ce with the results from Martellotta (2010). An example of<br />
the attached <strong>flow</strong> has been included below, <strong>for</strong> cross section charlie.<br />
Figure 47: Streamlines showing attached <strong>flow</strong> about cross section charlie <strong>for</strong> a <strong>fin</strong><br />
modelled at 8 o in water <strong>flow</strong>ing at 1.42 ms -1 .<br />
Figure 48: Streamlines showing leading edge separation at cross section hotel <strong>for</strong> a<br />
<strong>fin</strong> modelled at 8 o in water <strong>flow</strong>ing at 1.42 ms -1 .<br />
From the experimental <strong>an</strong>alysis, the <strong>flow</strong> was completely attached at 8 o , which<br />
rein<strong>for</strong>ces the idea that there might be <strong>an</strong> error in the leading edge of hotel in the<br />
computational model. Excepting y-displacement hotel, the experimental <strong>an</strong>d<br />
computational results are in agreement <strong>for</strong> the <strong>an</strong>gle of attack of 8 o .<br />
When the <strong>an</strong>gle of attack is increased to 10 o , separation just prior to the trailing<br />
edge is visible on cross section echo.<br />
75
Figure 49: Streamlines showing attached <strong>flow</strong> <strong>around</strong> cross section echo, with slight<br />
separation towards the trailing edge <strong>for</strong> at 10 o in water <strong>flow</strong>ing at 1.42 ms -1 .<br />
The <strong>flow</strong> across cross sections bravo, charlie <strong>an</strong>d echo remains attached, but the<br />
amount of leading edge separation at y-displacement hotel has increased, as shown<br />
in the figure below.<br />
Figure 50: Streamlines showing leading edge separation at cross section hotel <strong>for</strong> a<br />
<strong>fin</strong> modelled at 10 o in water <strong>flow</strong>ing at 1.42 ms -1 .<br />
This does not agree with the experimental results, which show separation at 10-50%<br />
of the chord length <strong>for</strong> cross sections bravo <strong>an</strong>d charlie, in addition to the trailing<br />
edge of cross section echo, which is shown.<br />
As with the <strong>flow</strong> at 10 o with respect to the foil, the <strong>flow</strong> at a 12 o <strong>an</strong>gle of attack, is<br />
attached across y-displacements bravo <strong>an</strong>d charlie, <strong>an</strong>d attached across most of ydisplacement<br />
echo, with only slight separation occurring near the trailing edge.<br />
76
Figure 51: Streamlines showing attached <strong>flow</strong> <strong>around</strong> cross section bravo, at a 12 o<br />
<strong>an</strong>gle of attack in water <strong>flow</strong>ing at 1.42 ms -1 .<br />
Figure 52: Streamlines showing attached <strong>flow</strong> <strong>around</strong> cross section charlie, at a 12 o<br />
<strong>an</strong>gle of attack in water <strong>flow</strong>ing at 1.42 ms -1 .<br />
Figure 53: Streamlines showing attached <strong>flow</strong> <strong>around</strong> cross section echo, with slight<br />
separation towards the trailing edge at 12 o in water <strong>flow</strong>ing at 1.42 ms -1 .<br />
As with the 10 o <strong>an</strong>gle of attack, the experimentally observed separation at the<br />
leading edge of cross sections bravo <strong>an</strong>d charlie is not present in the computational<br />
<strong>an</strong>alysis of 12 o . The separation observed towards the trailing edge of echo concurs<br />
with the experimental results, <strong>an</strong>d the separation at hotel is more signific<strong>an</strong>t th<strong>an</strong><br />
the separation at the trailing edge of y-displacement golf.<br />
77
When the <strong>an</strong>gle of attack of the <strong>flow</strong> relative to the <strong>fin</strong> is increased to 14 o , the <strong>flow</strong><br />
remains attached <strong>around</strong> cross sections bravo, <strong>an</strong>d charlie, only shows slight<br />
separation from the just prior to the trailing edge of echo, <strong>an</strong>d remains fully<br />
separated from the leading edge of cross section hotel.<br />
Figure 54: Streamlines showing <strong>flow</strong> <strong>around</strong> cross section bravo, at a 14 o <strong>an</strong>gle of<br />
attack in water <strong>flow</strong>ing at 1.42 ms -1 .<br />
Figure 55: Streamlines showing <strong>flow</strong> <strong>around</strong> cross section charlie, at a 14 o <strong>an</strong>gle of<br />
attack in water <strong>flow</strong>ing at 1.42 ms -1 .<br />
Figure 56: Streamlines showing <strong>flow</strong> <strong>around</strong> cross section echo, with slight<br />
separation towards the trailing edge at 14 o in water <strong>flow</strong>ing at 1.42 ms -1 .<br />
78
Figure 57: Streamlines showing separated <strong>flow</strong> <strong>around</strong> cross section hotel, at 14 o in<br />
water <strong>flow</strong>ing at 1.42ms -1 .<br />
The experimental <strong>an</strong>alysis suggests that the <strong>flow</strong> should be separating at the leading<br />
edges of cross sections bravo <strong>an</strong>d charlie, <strong>an</strong>d again at 10-50% of the chord length of<br />
cross sections golf <strong>an</strong>d echo.<br />
There are two main points of contention between the experimental <strong>an</strong>d<br />
computational <strong>an</strong>alysis:<br />
The first is the tendency of the <strong>flow</strong> to remain attached <strong>an</strong>d attached <strong>around</strong> the foil<br />
surface <strong>for</strong> several degrees after the experimental <strong>an</strong>alysis suggests the <strong>flow</strong> should<br />
have separated, in particular with respect to the leading edge separation noted<br />
experimentally at y-displacements bravo <strong>an</strong>d charlie. This suggests a disparity in the<br />
conditions set <strong>for</strong> the turbulence model used to model the <strong>flow</strong> behaviour, or with<br />
the choice of model itself. However, since the Spalart-Allmaras model is typically<br />
used with success <strong>for</strong> external <strong>flow</strong>s involving aerofoils, it is more likely that this<br />
error exists in the choice of conditions used to model the fluid turbulence.<br />
The second point of contention is the continual <strong>an</strong>d early leading edge separation at<br />
cross section hotel. This is likely caused a leading edge radius which results in a<br />
leading edge corner which is too sharp to be successfully navigated by the <strong>flow</strong>, even<br />
at low <strong>an</strong>gles of attack. This corner was likely ‘softened’ on the physical model by the<br />
application of resin, <strong>an</strong>d this has hence caused the disparity.<br />
79
5.3.2 Computational results <strong>for</strong> <strong>racing</strong> speed applications<br />
The behaviour of <strong>flow</strong> <strong>around</strong> the foil was <strong>an</strong>alysed used OpenFOAM at 5, 10 <strong>an</strong>d<br />
15ms -1 . For each <strong>flow</strong> speed tested, the <strong>an</strong>gle of attack of the foil relative to the fluid<br />
was increased from 10 o to 16 o , in increments of 2 o , <strong>an</strong>d then again to 20 o .<br />
For incoming <strong>flow</strong> at 5ms -1 <strong>an</strong>d 10 o , the fluid remains attached to the foil along the<br />
upper cross sections bravo <strong>an</strong>d charlie, but detaches at cross sections echo <strong>an</strong>d hotel.<br />
The <strong>flow</strong> about cross-section hotel shows separation from the leading edge, whilst<br />
the <strong>flow</strong> about cross-section echo is primarily attached to the foil, but separates<br />
towards the trailing edge.<br />
Figure 58: Streamlines showing the behaviour of the incoming <strong>flow</strong> at 5ms -1 <strong>an</strong>d 10 o<br />
to the <strong>fin</strong>, across cross-section bravo.<br />
Figure 59: Streamlines showing the behaviour of the incoming <strong>flow</strong> at 5ms -1 <strong>an</strong>d 10 o<br />
to the <strong>fin</strong>, across cross-section charlie.<br />
80
Figure 60: Streamlines showing the behaviour of the incoming <strong>flow</strong> at 5ms -1 <strong>an</strong>d 10 o<br />
to the <strong>fin</strong>, across cross-section echo.<br />
Figure 61: Streamlines showing the behaviour of the incoming <strong>flow</strong> at 5ms -1 <strong>an</strong>d 10 o<br />
to the <strong>fin</strong>, across cross-section hotel.<br />
The early leading edge separation at y-displacement hotel suggests that the leading<br />
edge is too sharp <strong>for</strong> the fluid to be able to successfully navigate the corner. This is<br />
confirmed by the presence of leading edge separation <strong>for</strong> <strong>flow</strong> at 5ms -1 <strong>an</strong>d 5 o ,<br />
shown below.<br />
Figure 62: Streamlines showing the behaviour of the incoming <strong>flow</strong> at 5ms -1 <strong>an</strong>d 5 o<br />
to the <strong>fin</strong>, across cross-section hotel.<br />
81
This suggests that the calculation of the leading edge radius <strong>for</strong> this cross-section is<br />
not as accurate as previously thought.<br />
This trailing edge separation along cross section echo becomes more de<strong>fin</strong>ed as the<br />
<strong>an</strong>gle of attack between the incoming fluid <strong>an</strong>d the <strong>fin</strong> is increased.<br />
Figure 63: Streamlines showing the behaviour of the incoming <strong>flow</strong> at 5ms -1 <strong>an</strong>d 16 o<br />
to the <strong>fin</strong>, across cross-section echo, with glyphs (arrows) showing pressure.<br />
At <strong>an</strong> <strong>an</strong>gle of attack of 20 o , the <strong>flow</strong> remains attached <strong>for</strong> the entirety of the <strong>fin</strong><br />
surface, but does not model correctly <strong>around</strong> the leading edge, as shown below.<br />
Figure 64: Streamlines showing the behaviour of the incoming <strong>flow</strong> at 5ms -1 <strong>an</strong>d 20 o<br />
to the <strong>fin</strong>, across cross-section bravo<br />
The <strong>an</strong>gle of attack was then reset to 10 o , <strong>an</strong>d the <strong>flow</strong> velocity increased to 10ms -1 .<br />
As with the incoming <strong>flow</strong> of 5ms -1 , the <strong>flow</strong> remains attached across ydisplacements<br />
bravo <strong>an</strong>d charlie, be<strong>for</strong>e then separating towards the trailing edge of<br />
echo, <strong>an</strong>d completely from the leading edge of hotel.<br />
82
Figure 65: Streamlines showing the behaviour of the incoming <strong>flow</strong> at 10ms -1 <strong>an</strong>d<br />
10 o to the <strong>fin</strong>, across cross-section bravo<br />
Figure <strong>66</strong>: Streamlines showing the behaviour of the incoming <strong>flow</strong> at 10ms -1 <strong>an</strong>d<br />
10 o to the <strong>fin</strong>, across cross-section charlie<br />
Figure 67: Streamlines showing the behaviour of the incoming <strong>flow</strong> at 10ms -1 <strong>an</strong>d<br />
10 o to the <strong>fin</strong>, across cross-section echo<br />
83
Figure 68: Streamlines showing the behaviour of the incoming <strong>flow</strong> at 10ms -1 <strong>an</strong>d<br />
10 o to the <strong>fin</strong>, across cross-section hotel<br />
The separation at cross-sections echo <strong>an</strong>d hotel becomes more signific<strong>an</strong>t as the<br />
<strong>an</strong>gle of attack increases. At 20 o , the fluid is again mis-modelled at the leading edge<br />
of the <strong>fin</strong>, although it reattaches just after.<br />
Figure 69: Streamlines showing a region of separation at the leading edge of cross<br />
section bravo <strong>for</strong> the incoming <strong>flow</strong> at 10ms -1 <strong>an</strong>d 20 o with respect to the <strong>fin</strong>.<br />
Increasing the fluid speed to 15ms -1 <strong>an</strong>d again resetting the <strong>an</strong>gle of attack to 10 o ,<br />
gives similar results. The <strong>flow</strong> is attached across y-displacements bravo <strong>an</strong>d charlie,<br />
<strong>an</strong>d separates from the leading edge at cross section hotel. The <strong>flow</strong> has not yet<br />
separated at y-displacement echo.<br />
84
Figure 70: Streamlines showing the behaviour of the incoming <strong>flow</strong> at 15ms -1 <strong>an</strong>d<br />
10 o to the <strong>fin</strong>, across cross-section bravo<br />
Figure 71: Streamlines showing the behaviour of the incoming <strong>flow</strong> at 15ms -1 <strong>an</strong>d<br />
10 o to the <strong>fin</strong>, across cross-section charlie<br />
Figure 72: Streamlines showing the behaviour of the incoming <strong>flow</strong> at 15ms -1 <strong>an</strong>d<br />
10 o to the <strong>fin</strong>, across cross-section echo<br />
85
Figure 73: Streamlines showing the behaviour of the incoming <strong>flow</strong> at 15ms -1 <strong>an</strong>d<br />
10 o to the <strong>fin</strong>, across cross-section hotel<br />
The <strong>flow</strong> separates from y-displacement echo at 20 o , but at this <strong>an</strong>gle, the <strong>flow</strong> has<br />
not yet separated from the leading edge of y-displacement echo.<br />
In all cases, it was expected that the <strong>flow</strong> would separate at <strong>an</strong> earlier <strong>an</strong>gle of attack,<br />
based on the experimental results. This suggests that the settings/variables used<br />
with the turbulence model do not approximate the real conditions as well as had<br />
been hoped.<br />
It was expected that the overall <strong>flow</strong> pattern would be influenced by the movement<br />
of fluid <strong>around</strong> the tips of the <strong>fin</strong>. Movement over the top of the <strong>fin</strong> (above the root)<br />
is prevented by the bottom of the <strong>RS</strong>:X <strong>windsur<strong>fin</strong>g</strong> board. Since the movement<br />
<strong>around</strong> the <strong>fin</strong> tip is unrestricted, a degree of circulation occurs in the direction of<br />
the sp<strong>an</strong> of the <strong>fin</strong>. This influences <strong>flow</strong> behaviour along the sp<strong>an</strong> of the <strong>fin</strong>. (White<br />
2008; Craig 2004; Craw<strong>for</strong>d 2009; PilotFriend 2010)<br />
This occurs since the pressure is higher on the upstream side of the <strong>fin</strong> th<strong>an</strong> on the<br />
downstream side of the <strong>fin</strong>, as is expected from <strong>flow</strong> theory. In a three dimensional<br />
situation, where the wing has a <strong>fin</strong>ite length, air <strong>flow</strong>s <strong>around</strong> the tip of the <strong>fin</strong> from<br />
the region of high pressure into the region of low pressure.<br />
This <strong>flow</strong> <strong>around</strong> the tip of the foil causes a circular motion which is then swept off<br />
the trailing edge of the <strong>fin</strong> <strong>an</strong>d continues to rotate, creating what are known as<br />
trailing edge or tip vortices. (White 2008; Craig 2004; Craw<strong>for</strong>d 2009; PilotFriend<br />
2010)<br />
The <strong>flow</strong> from high to low pressure is evidenced about the trailing edge of the foil, as,<br />
<strong>for</strong> a set of streamlines passing through a single cross section, the <strong>flow</strong> streamlines<br />
of the downstream side of the foil is drawn upwards towards the root, <strong>an</strong>d the<br />
streamlines on the upstream side.<br />
This is shown in the figure below, with the close side shown as the upstream side.<br />
86
Figure 74: The <strong>flow</strong> streamlines are affected by the <strong>fin</strong>ite length of foil, causing cross<br />
<strong>flow</strong>.<br />
Likewise, the vortices are only <strong>for</strong>med off the tip of the foil. The cross section shown<br />
is 5mm above the absolute tip of the <strong>fin</strong>, <strong>an</strong>d it c<strong>an</strong> be seen how the <strong>flow</strong> rotates<br />
underneath itself as it peels off of the trailing edge of the tip, causing a vortex to<br />
<strong>for</strong>m.<br />
Figure 75: Tip vortices <strong>for</strong>ming off of the tip of the <strong>fin</strong>, shown <strong>for</strong> <strong>flow</strong> at 10ms -1 <strong>an</strong>d<br />
20 o .<br />
87
5.3.3 Conclusions based on computational results<br />
OpenFOAM was used to determine the pressure <strong>an</strong>d velocity everywhere within the<br />
specified <strong>flow</strong> field, but it is known separation is difficult to model accurately, since<br />
so m<strong>an</strong>y factors are involved, <strong>an</strong>d the computationally modelled <strong>flow</strong> behaviour c<strong>an</strong><br />
be very sensitive to the choice of turbulence model. (Sodja 2007)<br />
Since the computational <strong>an</strong>d experimental results differ so greatly, it is likely that the<br />
process used to model the <strong>flow</strong> <strong>around</strong> the <strong>fin</strong> is flawed. Since the <strong>flow</strong> <strong>an</strong>gle <strong>an</strong>d<br />
direction are otherwise correct, <strong>an</strong>d that the main disparity occurs with the location<br />
<strong>an</strong>d <strong>an</strong>gle of attack at which stall occurs, it is likely that this error arises from a flaw<br />
in the modelling of the turbulence which exists inside the wind tunnel.<br />
The leading edge of the foil is not modelled with sufficient accuracy at cross section<br />
hotel to prevent persistent leading edge separation. This suggests that the accuracy<br />
with which the leading edge radius is modelled contributes greatly to the overall<br />
success of a computational <strong>an</strong>alysis of <strong>flow</strong> <strong>around</strong> a foil, in agreement with<br />
Martellotta (2010).<br />
6. Comparison of results to results expected <strong>for</strong> a<br />
NACA 65-009<br />
The experimental data <strong>for</strong> a NACA 65-009 was determined experimentally by Abbott<br />
<strong>an</strong>d Von Doenhoff (1959, 607). This shows that the lift coefficient is fairly consistent<br />
<strong>for</strong> <strong>an</strong> <strong>an</strong>gle of attack of 0-12 0 , be<strong>for</strong>e rapidly dropping by 14 o , <strong>for</strong> a foil of st<strong>an</strong>dard<br />
roughness.<br />
These wing section characteristics were determined using a two dimensional low<br />
turbulence tunnel, <strong>an</strong>d there<strong>for</strong>e the effects of <strong>fin</strong>ite length have not been taken<br />
into account. The tests were conducted at Reynolds numbers r<strong>an</strong>ging from 3 x10 6 to<br />
9x10 6 , <strong>an</strong>d <strong>for</strong> Mach numbers below 0.17. (Abbott <strong>an</strong>d von Doenhoff 1959) The<br />
parameters used <strong>for</strong> the testing of the <strong>RS</strong>:X men’s <strong>fin</strong> discussed in this report are<br />
suitable <strong>for</strong> comparison, as the Mach number tested is within this r<strong>an</strong>ge, <strong>an</strong>d the<br />
Reynolds numbers had the same order of magnitude, although they were just below<br />
the bottom limit <strong>for</strong> the Reynolds numbers tested.<br />
Experimentally, it was noted that separation, <strong>an</strong>d thus a loss of lift, occurred<br />
between 10 o <strong>an</strong>d 16 o . This wider r<strong>an</strong>ge of <strong>an</strong>gles over which separation occurs,<br />
prevent the onset of stall being almost immediate, as would occur <strong>for</strong> a 65-009. This<br />
would be a desirable trait <strong>for</strong> a <strong>windsur<strong>fin</strong>g</strong> <strong>fin</strong>, <strong>an</strong>d is thus a reasonable result.<br />
Computationally, the separation did not begin to occur until 20 o , which is<br />
subst<strong>an</strong>tially different to both the results determined experimentally, <strong>an</strong>d the known<br />
results <strong>for</strong> a NACA 65-009. This supports the theory that the parameters used <strong>for</strong><br />
the turbulence model are not suitable.<br />
88
7. Conclusion<br />
At the time of writing this report, the following conclusions c<strong>an</strong> be drawn:<br />
- The NACA section which the <strong>RS</strong>: X Racing <strong>66</strong> <strong>windsur<strong>fin</strong>g</strong> <strong>fin</strong> bears the closest<br />
resembl<strong>an</strong>ce to, is the NACA 65-009.<br />
- Flow separation starts at the ‘root’ of the foil, <strong>an</strong>d progresses along the<br />
length of the <strong>fin</strong> as the <strong>an</strong>gle of attack is increased, or alternatively, <strong>flow</strong><br />
separation c<strong>an</strong> occur the root <strong>an</strong>d tip of the foil, <strong>an</strong>d then progress inwards<br />
towards the centre of the <strong>fin</strong>. (Experimental conclusion)<br />
- The rounded leading edge radius of the <strong>fin</strong> causes <strong>flow</strong> separation to begin at<br />
the trailing edge <strong>an</strong>d then move <strong>for</strong>wards across the <strong>fin</strong> surface, towards the<br />
leading edge. (Experimental conclusion)<br />
- The <strong>fin</strong> begins to exhibit signs of separation at approximately 10 o , <strong>an</strong>d is fully<br />
stalled by 16 o . (Experimental conclusion)<br />
- A signific<strong>an</strong>t level of cross <strong>flow</strong> exists on the downstream surface, which is<br />
directed away from the tip, <strong>an</strong>d towards the root. (Computational conclusion)<br />
- The turbulence model has a signific<strong>an</strong>t impact on the ability of a<br />
computational <strong>an</strong>alysis to mimic the results of the experimental <strong>an</strong>alysis. It is<br />
likely that the turbulence conditions used are the cause of the disparity<br />
between the computational <strong>an</strong>d experimental results.<br />
- The accuracy with which the leading edge radius is modelled contributes<br />
greatly to the overall success of a computational <strong>an</strong>alysis of <strong>flow</strong> <strong>around</strong> a foil.<br />
This <strong>fin</strong>ding is in agreement with the postulate of Martellotta (2010).<br />
89
8. Future Work<br />
Future work to be completed on this project includes:<br />
- Cross-<strong>an</strong>alysing the results of the computational <strong>an</strong>d experimental models,<br />
<strong>an</strong>d comparing these results with those expected <strong>for</strong> a NACA 65-009 foil<br />
- Improve the turbulence model to increase the correlation between the<br />
experimental <strong>an</strong>d computational results<br />
- Per<strong>for</strong>m additional experimental testing with a wind tunnel capable of a<br />
greater r<strong>an</strong>ge of velocities<br />
- Per<strong>for</strong>m experimental testing in <strong>an</strong> aquatic environment, or in a wind tunnel<br />
with the addition of a smoke machine, to look <strong>for</strong> the presence <strong>an</strong>d<br />
<strong>for</strong>mation of tip vortices<br />
- Per<strong>for</strong>m experimental testing in <strong>an</strong> aquatic environment, <strong>an</strong>d examine the<br />
effects of ventilation of fluid behaviour<br />
9. Acknowledgements<br />
I would like to th<strong>an</strong>k the following people <strong>for</strong> their assist<strong>an</strong>ce with the programming<br />
<strong>an</strong>d <strong>an</strong>alysis associated with this report.<br />
- Dr Tim Gourlay (supervisor)<br />
- Dr Andrew King (supervisor)<br />
- Dr Kim Klaka<br />
- Dr D<strong>an</strong>iel Veen<br />
- Eamonn Colley<br />
10. Nomenclature<br />
Camber<br />
Half way between the upper <strong>an</strong>d lower surfaces of the foil<br />
Chord Length<br />
Length of foil from the leading to trailing edge<br />
Leading edge<br />
Front or nose of the foil<br />
Thickness<br />
Width of the foil at <strong>an</strong>y given point<br />
Trailing edge<br />
Back edge (tail) of the foil<br />
90
11. References<br />
Abbott, I. H., <strong>an</strong>d A. E. von Doenhoff. 1959. Theory of wing sections, including a<br />
summary of airfoil data. New York: Dover Publications. Original edition, 1949.<br />
AutoCAD. 2009. AutoCAD 2010 User Documentation.<br />
http://docs.autodesk.com/ACD/2010/ENU/AutoCAD (accessed April 4th).<br />
Bakker, A. 2005. Turbulence models. www.bakker.org/dartmouth06/engs150/10r<strong>an</strong>s.ppt<br />
(accessed October 7).<br />
Bernoulli's Equation. 1997.<br />
http://www.princeton.edu/~asmits/Bicycle_web/Bernoulli.html (accessed<br />
September 9).<br />
Burgess, F. H. 1974. A dictionary <strong>for</strong> yachtsmen. Newton Abbot, Engl<strong>an</strong>d: David &<br />
Charles.<br />
Craig, G. 2004. Circulation, lift <strong>an</strong>d drag. http://regenpress.com/circlatn.htm<br />
(accessed October 7).<br />
Craw<strong>for</strong>d, B. 2009. Three dimensional aerodynamics.<br />
http://www.flightlab.net/Flightlab.net/Download_Course_Notes_files/3_Three-<br />
DimensionalA%232BA154.pdf (accessed October 7).<br />
Creagh-Osborne, R., <strong>an</strong>d P. A. G. Milne. 1973. This is sailing : a complete course.<br />
[Lymington]: Nautical.<br />
CSIRO. 2009. Computational Modelling. http://www.cmis.csiro.au/cfd/ (accessed<br />
June 6th).<br />
Engineering ToolBox. 2011. Pitot tubes. http://www.engineeringtoolbox.com/pitottubes-d_612.html<br />
(accessed September 9).<br />
Engineers Edge. 2011. STL CAD files <strong>for</strong> Rapid Prototyping.<br />
http://engineersedge.com/stl_rapid_proto.htm (accessed April 19, 2011).<br />
Formero. 2010. Rapid prototyping.<br />
http://www.arrk.com.au/browse.asp?ContainerID=rapid_prototyping (accessed May<br />
16th).<br />
Fox, R., A. McDonald, <strong>an</strong>d P. Pritchard. 2004a. Introduction to fluid mech<strong>an</strong>ics. 6th<br />
ed: John Wiley & Sons, Inc.<br />
--------. 2004b. Introduction to fluid mech<strong>an</strong>ics. John Wiley & Sons, Inc. CD-ROM.<br />
Garrett, R. 1987. The symmetry of sailing : the physics of sailing <strong>for</strong> yachtsmen.<br />
London: Adlard Coles.<br />
91
Gentry, A. 1981. Proceedings of the Eleventh AIAA Symposium on the<br />
Aero/Hydronautics of Sailing, September 12, 1981: A Review of Modern Sail Theory.<br />
Seattle, Washington.<br />
http://www.arvelgentry.com/techs/A%20Review%20of%20Modern%20Sail%20Theo<br />
ry.pdf (accessed J<strong>an</strong>uary 24, 2011).<br />
--------. 2006. The origins of lift.<br />
http://www.arvelgentry.com/techs/origins_of_lift.pdf.<br />
Glenn Research <strong>Centre</strong>. 2008. Navier-Stokes Equations.<br />
http://www.grc.nasa.gov/WWW/k-12/airpl<strong>an</strong>e/nseqs.html (accessed June 6th).<br />
--------. 2010a. Lift from <strong>flow</strong> turning. http://www.grc.nasa.gov/WWW/K-<br />
12/airpl<strong>an</strong>e/right2.html (accessed J<strong>an</strong>uary 12).<br />
--------. 2010b. Lift of a rotating cylinder. http://www.grc.nasa.gov/WWW/K-<br />
12/airpl<strong>an</strong>e/cyl.html (accessed J<strong>an</strong>uary 12).<br />
--------. 2010c. Size effects on lift. http://www.grc.nasa.gov/WWW/k-<br />
12/airpl<strong>an</strong>e/size.html (accessed September 7).<br />
--------. 2010d. Wing geometry de<strong>fin</strong>itions. http://www.grc.nasa.gov/WWW/k-<br />
12/airpl<strong>an</strong>e/geom.html (accessed October 10).<br />
Gourlay, T. P., <strong>an</strong>d J. Martellotta. 2011. Aero-hydrodynamic <strong>an</strong>alysis of <strong>an</strong> <strong>RS</strong>:X<br />
Olympic <strong>racing</strong> sailboard. CMST report 2011-02.<br />
Hewitt, P. G. 1998. Conceptual physics. 8th ed. Reading, Mass.: Addison Wesley.<br />
Javaherchi, Y. 2010. Review of Spalart-Allmaras Turbulence Model <strong>an</strong>d its<br />
Modifications. Washington: University of Washington.<br />
http://courses.washington.edu/mengr543/reports/teymour-report.pdf (accessed<br />
October 7, 2011).<br />
Kroo, I. 2007. Applied Aerodynamics: A digital textbook. St<strong>an</strong><strong>for</strong>d: Desktop<br />
Aeronautics Inc. http://www.desktop.aero/appliedaero/preface/welcome.html<br />
(accessed March 21,2011).<br />
Li, X. 2008. Sail into the wind. http://www.thepingway.com/newsletter/sail-intothe-wind.htm<br />
(accessed October 16).<br />
Marchaj, C. 1979. Aero-hydrodynamics of sailing. New York: Dodd, Mead <strong>an</strong>d<br />
Comp<strong>an</strong>y.<br />
Martellotta, J. 2010. Per<strong>for</strong>m<strong>an</strong>ce <strong>an</strong>alysis of one design sailing dinghies through<br />
measurement of rig characteristics, Science <strong>an</strong>d Engineering, Curtin University, Perth<br />
Marzocca, P. 2004. The NACA airfoil series.<br />
http://people.clarkson.edu/~pmarzocc/AE429/The%20NACA%20airfoil%20series.pdf<br />
(accessed September 5).<br />
92
Munson, B., D. Young, <strong>an</strong>d T. Okiiski. 2006. Fundamentals of fluid mech<strong>an</strong>ics. 5th ed.<br />
Ames: John Wiley & Sons, Inc.<br />
NeilPryde Racing. 2011a. <strong>RS</strong>:X Board. http://<strong>racing</strong>.neilpryde.com/rs-x/board.html<br />
(accessed March 12th).<br />
--------. 2011b. <strong>RS</strong>:X Sail Overview. http://<strong>racing</strong>.neilpryde.com/rs-x/overview.html<br />
(accessed March 12th).<br />
OpenFOAM. 2011a. Features of OpenFOAM. http://www.openfoam.com/features/<br />
(accessed J<strong>an</strong>uary).<br />
--------. 2011b. ParaView.<br />
http://www.openfoam.com/features/paraview.php#paraview (accessed J<strong>an</strong>uary).<br />
--------. 2011c. Pre-processing Utilities.<br />
http://www.openfoam.com/features/preprocessing.php#preProcessingUtilities<br />
(accessed J<strong>an</strong>uary).<br />
OpenFOAMWiki. 2009. PotentialFoam.<br />
http://openfoamwiki.net/index.php/PotentialFoam (accessed October 8).<br />
Peter, H. n.d. Lift: Why c<strong>an</strong> airpl<strong>an</strong>es fly? http://www3.kis.unifreiburg.de/~peter/teach/hydro/hydro05.pdf<br />
(accessed October 16).<br />
PilotFriend. 2010. Wing vortices.<br />
http://www.pilotfriend.com/training/flight_training/aero/wng_vort.htm (accessed<br />
October 7).<br />
Public Domain Aeronautical Software. 2010. Tables of profiles.<br />
http://pdas.com/profiles.html (accessed May 17).<br />
Ramsden, R. 2009. What is the <strong>RS</strong>:X? http://www.rsxclass.com/home/about<br />
(accessed March 12th).<br />
Rapid Pro. 2011a. 3D Zcorp printing.<br />
http://rapidpro.com.au/index.php/prototyping/prototyping-processes/3d-zcorpprinting/<br />
(accessed May 16th).<br />
--------. 2011b. Rapid Pro. http://rapidpro.com.au/ (accessed May 16th).<br />
Serway, R. A., <strong>an</strong>d J. W. Jewett. 2004. Physics <strong>for</strong> scientists <strong>an</strong>d engineers, with<br />
modern physics. 6th ed. Belmont, CA: Thomson-Brooks/Cole.<br />
Sodja, J. 2007. Turbulence models in CFD, Department of Theoretical Physics,<br />
University of Ljublj<strong>an</strong>a, Ljublj<strong>an</strong>a. http://www-f1.ijs.si/~rudi/sola/Turbulencemodels-in-CFD.pdf<br />
(accessed October 16, 2011).<br />
White, F. M. 1999. Fluid Mech<strong>an</strong>ics. 4th ed. New York: McGraw-Hill.<br />
93
--------. 2008. Fluid Mech<strong>an</strong>ics. 6th ed. New York: McGraw-Hill.<br />
--------. 2011. Fluid Mech<strong>an</strong>ics. 8th ed. New York: McGraw-Hill.<br />
Whitton, A. 2011. Introduction to AutoCAD. http://www.we-rhere.com/cad/tutorials/level_1/1-1.htm<br />
(accessed May 11th).<br />
Z Corporation. 2010. ZPrinter Product Line.<br />
http://www.zcorp.com/documents/932_9062-ZPrinterSpecSheet.pdf (accessed May<br />
16th).<br />
--------. 2011. ZPrinter 450. http://www.zcorp.com/en/Products/3D-<br />
Printers/ZPrinter-450/spage.aspx (accessed May 16th).<br />
12. Bibliography<br />
(Sources read but not cited)<br />
Avila, M. 1992. Computational <strong>an</strong>d experimental investigation of the aerodynamic<br />
characteristics of a <strong>windsur<strong>fin</strong>g</strong> sail section, Department of Aeronautics <strong>an</strong>d<br />
Astronautics, Naval Postgraduate School, Monterey<br />
Brummer, M. 2010. A look at the <strong>fin</strong>n under the water.<br />
http://www.<strong>fin</strong>nclass.org/index.php?option=com_content&view=article&id=<br />
204%3Aa-look-at-the-<strong>fin</strong>n-under-thewater&Itemid=220&catid=30%3Afeatures<br />
(accessed 2011).<br />
Chiu, T. W., P. G. Kalaugher, <strong>an</strong>d C. A. M. Broers. 1995. The application of the<br />
photogrammetry in the study of the effects of sail board <strong>fin</strong> flexibility<br />
Proceedings of the institution of mech<strong>an</strong>ical engineers, part C, mech<strong>an</strong>ical<br />
engineering science. Mech<strong>an</strong>ical Engineering Publications 209 (C6): 373 - 381.<br />
Hewitt, P. G. 1998. Conceptual physics. 8th ed. Reading, Mass.: Addison Wesley.<br />
Liv<strong>an</strong>os, A. 2006. Computational fluid dynamics investigation of two surfboard <strong>fin</strong><br />
configurations, Faculty of Engineering, University of Western Australia, Perth.<br />
http://members.iinet.com.au/~liv<strong>an</strong>os/CFD_report/Report.doc (accessed<br />
2011, March 17th).<br />
Nitzberg, G. E., <strong>an</strong>d S. M. Cr<strong>an</strong>dall. 1952. A comparative examination of some<br />
measurements of airfoil section lift <strong>an</strong>d drag at supercritical speeds. Moffett<br />
Field: Ames Aeronautical Laboratory.2011, March 17th).<br />
94
Partilda, L. P. 1986. Comparative computational <strong>an</strong>alysis of airfoil sections <strong>for</strong> use on<br />
sailing craft. Masters diss., Department of Aeronautics <strong>an</strong>d Astronautics,<br />
Naval Postgraduate School, Monterey (accessed February 23rd, 2011).<br />
Swales, P. D., A. J. Wright, R. C. McGregor, <strong>an</strong>d R. S. Rothblum. 1974. The mech<strong>an</strong>ism<br />
of ventilation inception on surface piercing foils. Journal of Mech<strong>an</strong>ical<br />
Engineering Science 16 (1): 8.<br />
13. Appendix<br />
13.1. Matlab Code<br />
13.1.1 mysolvemissing.m<br />
clear<br />
close all<br />
%created 14/4/2011, K. H<strong>an</strong>sen, to interpolate missing data<br />
%read in excel data<br />
myFile='I:\Honours\hons matlab\AlphaBravoInterpolate.xls';<br />
data=xlsread([myFile]);<br />
%label columns<br />
alphaX=data(:,1);<br />
alphaY=data(:,2);<br />
alphaZ=data(:,3);<br />
bravoX=data(:,4);<br />
bravoY=data(:,5);<br />
bravoZ=data(:,6);<br />
%interpolate<br />
alpha63=interp1(alphaX,alphaZ,63);<br />
alpha68=interp1(alphaX,alphaZ,68);<br />
bravo54=interp1(bravoX,bravoZ,54);<br />
13.1.2 interpPoints.m<br />
clear<br />
close all<br />
%created 14/4/2011, K.H<strong>an</strong>sen, to interp missing data<br />
%% read in excel data<br />
%myFile='I:\Honours\hons matlab\interpolateall.xls';<br />
95
myFile='F:\Honours\hons matlab\interpolateall2.xls';<br />
data=xlsread([myFile]);<br />
%% label columns<br />
%a<br />
alphaX=data(:,1);<br />
alphaY=data(:,2);<br />
alphaZ=data(:,3);<br />
%b<br />
bravoX=data(1:33,4);<br />
bravoY=data(1:33,5);<br />
bravoZ=data(1:33,6);<br />
%c<br />
charlieX=data(1:30,7);<br />
charlieY=data(1:30,8);<br />
charlieZ=data(1:30,9);<br />
%d<br />
deltaX=data(1:28,10);<br />
deltaY=data(1:28,11);<br />
deltaZ=data(1:28,12);<br />
%e<br />
echoX=data(1:25,13);<br />
echoY=data(1:25,14);<br />
echoZ=data(1:25,15);<br />
%f<br />
foxtrotX=data(1:23,16);<br />
foxtrotY=data(1:23,17);<br />
foxtrotZ=data(1:23,18);<br />
%g<br />
golfX=data(1:22,19);<br />
golfY=data(1:22,20);<br />
golfZ=data(1:22,21);<br />
%h<br />
hotelX=data(1:9,22);<br />
hotelY=data(1:9,23);<br />
hotelZ=data(1:9,24);<br />
%% interpolate<br />
bravo107=interp1(bravoX,bravoZ,107);<br />
bravo102=interp1(bravoX,bravoZ,102);<br />
bmat=[107,bravo107;102,bravo102];<br />
charlie88=interp1(charlieX,charlieZ,88);<br />
charlie86=interp1(charlieX,charlieZ,86);<br />
charlie83=interp1(charlieX,charlieZ,83);<br />
charlie77=interp1(charlieX,charlieZ,77);<br />
charlie3=interp1(charlieX,charlieZ,3);<br />
96
cmat=[88,charlie88; 86,charlie86; 83,charlie83; 77,charlie77; 3,charlie3];<br />
delta68=interp1(deltaX,deltaZ,68);<br />
delta67=interp1(deltaX,deltaZ,67);<br />
delta63=interp1(deltaX,deltaZ,63);<br />
delta58=interp1(deltaX,deltaZ,58);<br />
delta54=interp1(deltaX,deltaZ,54);<br />
delta8=interp1(deltaX,deltaZ,8);<br />
delta3=interp1(deltaX,deltaZ,4);<br />
dmat=[68,delta68; 67, delta67; 63, delta63; 58, delta58; 54, delta54; 8, delta8;<br />
3,delta3];<br />
echo52=interp1(echoX,echoZ,52);<br />
echo50=interp1(echoX,echoZ,50);<br />
echo48=interp1(echoX,echoZ,48);<br />
echo46=interp1(echoX,echoZ,46);<br />
echo41=interp1(echoX,echoZ,41);<br />
echo36=interp1(echoX,echoZ,36);<br />
echo1=interp1(echoX,echoZ,1);<br />
echo_3=interp1(echoX,echoZ,-3);<br />
echo_9=interp1(echoX,echoZ,-9);<br />
echo_12=interp1(echoX,echoZ,-12);<br />
emat=[52, echo52; 50, echo50; 48, echo48; 46, echo46; 41, echo41; 36, echo36; 1,<br />
echo1; -3, echo_3; -9, echo_9; -12, echo_12];<br />
foxtrot33=interp1(foxtrotX,foxtrotZ,33);<br />
foxtrot31=interp1(foxtrotX,foxtrotZ,31);<br />
foxtrot28=interp1(foxtrotX,foxtrotZ,28);<br />
foxtrot26=interp1(foxtrotX,foxtrotZ,26);<br />
foxtrot23=interp1(foxtrotX,foxtrotZ,23);<br />
foxtrot3=interp1(foxtrotX,foxtrotZ,3);<br />
foxtrot_3=interp1(foxtrotX,foxtrotZ,-3);<br />
foxtrot_8=interp1(foxtrotX,foxtrotZ,-8);<br />
foxtrot_12=interp1(foxtrotX,foxtrotZ,-12);<br />
foxtrot_18=interp1(foxtrotX,foxtrotZ,-18);<br />
foxtrot_22=interp1(foxtrotX,foxtrotZ,-22);<br />
foxtrot_28=interp1(foxtrotX,foxtrotZ,-28);<br />
fmat=[33, foxtrot33; 31, foxtrot31; 28, foxtrot28; 26, foxtrot26; 23, foxtrot23; 3,<br />
foxtrot3; -3, foxtrot_3; -8, foxtrot_8; -12, foxtrot_12; -18, foxtrot_18; -22,<br />
foxtrot_22; -28, foxtrot_28];<br />
golf23=interp1(golfX,golfZ,23);<br />
golf21=interp1(golfX,golfZ,21);<br />
golf18=interp1(golfX,golfZ,18);<br />
golf16=interp1(golfX,golfZ,16);<br />
golf14=interp1(golfX,golfZ,14);<br />
golf12=interp1(golfX,golfZ,12);<br />
97
golf8=interp1(golfX,golfZ,8);<br />
golf6=interp1(golfX,golfZ,6);<br />
golf_7=interp1(golfX,golfZ,-7);<br />
golf_12=interp1(golfX,golfZ,-12);<br />
golf_17=interp1(golfX,golfZ,-17);<br />
golf_24=interp1(golfX,golfZ,-24);<br />
golf_27=interp1(golfX,golfZ,-27);<br />
gmat=[23, golf23; 21, golf21; 18,golf18; 16,golf16; 14,golf14; 12,golf12; 8,golf8;<br />
6,golf6; -7,golf_7; -12,golf_12; -17,golf_17; -24,golf_24; -27,golf_27];<br />
hotel3=interp1(hotelX,hotelZ,3);<br />
hotel2=interp1(hotelX,hotelZ,2);<br />
hotel1=interp1(hotelX,hotelZ,1);<br />
hotel_1=interp1(hotelX,hotelZ,-1);<br />
hotel_3=interp1(hotelX,hotelZ,-3);<br />
hotel_4=interp1(hotelX,hotelZ,-4);<br />
hotel_7=interp1(hotelX,hotelZ,-7);<br />
hotel_9=interp1(hotelX,hotelZ,-9);<br />
hotel_11=interp1(hotelX,hotelZ,-11);<br />
hotel_13=interp1(hotelX,hotelZ,-13);<br />
hotel_17=interp1(hotelX,hotelZ,-17);<br />
hotel_19=interp1(hotelX,hotelZ,-19);<br />
hotel_22=interp1(hotelX,hotelZ,-22);<br />
hotel_24=interp1(hotelX,hotelZ,-24);<br />
hotel_27=interp1(hotelX,hotelZ,-27);<br />
hotel_29=interp1(hotelX,hotelZ,-29);<br />
hotel_31=interp1(hotelX,hotelZ,-31);<br />
hotel_32=interp1(hotelX,hotelZ,-32);<br />
hmat=[3,hotel3; 2,hotel2; 1,hotel1;-1,hotel_1; -3,hotel_3; -4,hotel_4; -7,hotel_7; -<br />
9,hotel_9; -11,hotel_11; -13,hotel_13; -17,hotel_17;-19,hotel_19; -22,hotel_22; -<br />
24,hotel_24; -27,hotel_27; -29,hotel_29;-31,hotel_31;-32,hotel_32];<br />
98