Introductory Oceanography (OCNG 251) MidTerm Study Guide: Part 2
Introductory Oceanography (OCNG 251) MidTerm Study Guide: Part 2
Introductory Oceanography (OCNG 251) MidTerm Study Guide: Part 2

Create successful ePaper yourself
Turn your PDF publications into a flip-book with our unique Google optimized e-Paper software.
MidTerm <strong>Study</strong> <strong>Guide</strong>: <strong>Part</strong> 2<br />
<strong>Introductory</strong> <strong>Oceanography</strong> (<strong>OCNG</strong> <strong>251</strong>)<br />
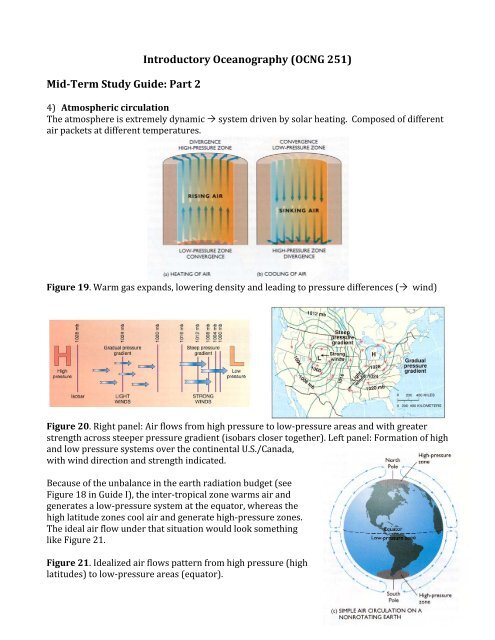
4) Atmospheric circulation<br />
The atmosphere is extremely dynamic system driven by solar heating. Composed of different<br />
air packets at different temperatures.<br />
Figure 19. Warm gas expands, lowering density and leading to pressure differences ( wind)<br />
Figure 20. Right panel: Air flows from high pressure to low‐pressure areas and with greater<br />
strength across steeper pressure gradient (isobars closer together). Left panel: Formation of high<br />
and low pressure systems over the continental U.S./Canada,<br />
with wind direction and strength indicated.<br />
Because of the unbalance in the earth radiation budget (see<br />
Figure 18 in <strong>Guide</strong> I), the inter‐tropical zone warms air and<br />
generates a low‐pressure system at the equator, whereas the<br />
high latitude zones cool air and generate high‐pressure zones.<br />
The ideal air flow under that situation would look something<br />
like Figure 21.<br />
Figure 21. Idealized air flows pattern from high pressure (high<br />
latitudes) to low‐pressure areas (equator).
However:<br />
The Earth rotates upon its axis<br />
The vertical angular velocity increases from 0 km/h at the equator to a maximum value at the<br />
poles Coriolis force.<br />
Figure 22. Deflection of large‐scale movements in the north hemisphere (right panel) and south<br />
hemisphere (right panel). Due to the Coriolis force, every displacement is deviated to the right in<br />
the north hemisphere and to the left in the south hemisphere.<br />
The rotation of earth thus affects major ideal winds movements on earth (figure 21) and leads to<br />
a splitting of the large circulation cells as depicted in Figure 23.<br />
Figure 23. Formation of regional circulation cells due to heating patterns on and rotation of<br />
earth. Low pressure areas are formed at the equator and mid‐latitudes, whereas high pressure<br />
systems form at the tropical lines (~30° latitude north and south) and both poles.<br />
These pressure systems lead to a) surface wind patterns (Figure 24, below) and b) to<br />
precipitation conditions under low‐pressure systems and high evaporation conditions (e.g.<br />
deserts) under areas of high pressure.
Figure 23. Surface wind patterns resulting from high/low pressure cells in the atmosphere.<br />
Constant regional winds result, the most notable of which are the easterlies (east to west) from<br />
~30° to equator and the westerlies (west to east) from ~30° to ~60° latitude.<br />
We will see a little later, that the unbalance in the earth heat budget leads to heat redistribution<br />
linking winds and ocean circulation. In particular, surface oceanic circulation results from<br />
1) Prevailing winds (differential heating at surface and in atmosphere) and<br />
2) Earth’s rotation<br />
This produces prevailing currents and heat transfer (High Heat Capacity = Delayed Response<br />
Time)<br />
Evaporation is the largest transfer flux of energy (heat) from the ocean to the atmosphere<br />
Figure 24. Global heat redistribution from equator to high latitude: The oceans redistribute heat<br />
from low‐ to mid‐latitudes. The atmosphere redistributes heat from mid‐ to high‐latitudes.
Hurricanes are important phenomena that lead to major transfers of heat (and moisture) form<br />
equatorial regions to mid‐ to high‐latitudes. Hurricanes are commonly formed by easterly waves<br />
in the tropical latitudes of most ocean basin (except the south Atlantic). In the Atlantic, the waves<br />
are kinks in the African Easterly Jet, a strong wind that blows over the Atlantic from the West<br />
African coast. The easterly waves trigger strong thunderstorms that move westward. Over the<br />
warm waters of the Atlantic, the thunderstorms embedded in the easterly wave can grow into a<br />
hurricane under the right conditions.<br />
Rule of thumb:<br />
If hurricanes form before 40ºW, then get tend to miss the U.S.A.<br />
If hurricanes form beyond 70ºW, then there is a greater chance that they’ll hit the U.S.A.<br />
Figure 25. Regions of hurricane formation around the globe. Note that hurricane, typhoons, and<br />
cyclones are the same phenomena with different names depending on the region in which they<br />
occur.<br />
"Based on a range of models, it is likely that future tropical cyclones (typhoons and hurricanes)<br />
will become more intense, with larger peak wind speeds and more heavy precipitation<br />
associated with ongoing increases of tropical sea surface temperatures” (IGPCC)<br />
Hurricane incidence & Intensity (Univ. of Colorado):<br />
El Niño (inverse)<br />
Storms in western Africa (direct)<br />
SST Atlantic (direct)<br />
5) Surface ocean circulation<br />
Wind is moving air Air molecules drag water molecules across sea surface: frictional drag<br />
If winds are prolonged, the frictional drag generates a current<br />
Only a small fraction of the wind energy is transferred to the water surface<br />
Because of the large wind circulation patterns depicted in Figure 23, surface ocean circulation<br />
also shows major central loops (“gyres”) in ocean basins (Figure 26).
Figure 26. Global surface ocean circulation showing major gyres in each ocean basin. Note that<br />
the gyres turn clockwise in the north hemisphere and counterclockwise in the south hemisphere<br />
(make sure you can explain why).<br />
Once water molecules in the surface film are set in motion, they exert a frictional drag on the<br />
water molecules immediately beneath them, getting these to move as well.<br />
Motion is transferred downward into the water column<br />
Speed diminishes with depth (friction)<br />
Direction changes with depth (coriolis)<br />
Figure 27. Ekman spiral whereby the integrated transport in the surface of the water column<br />
(50‐100 m at most) occurs perpendicular to the direction of the wind. This transport is to the<br />
right of the wind in the northern hemisphere and to the left of the wind in the southern<br />
hemisphere.<br />
The Ekman spiral thus leads to the actual transport of water to the center of each oceanic gyre<br />
(Figure 28). This transport actually leads to a “mound formation” at the center of such gyres<br />
(Figure 29).
Figure 28. Transfer of water to the center of oceanic gyres. Here the example shows an ocean<br />
basin in the north hemisphere (westerlies are to the north of the easterlies).<br />
Figure 29. “Mound” formation in oceanic gyres. Note that the mound is not symmetric but rather<br />
displaced towards the west of the basin. This is due to the intensification of the circulation, and<br />
narrowing of the western current, from the effect of the earth rotation (vorticity).<br />
The most well known example of an oceanic gyre and western intensification current is the one<br />
from the North Atlantic (Figure 30). The western current is called the Gulf Stream and transfers<br />
vast amounts of water and heat from the inter‐tropical zones to the mid‐latitudes.
Figure 30. Left panel: North Atlantic gyre with fluxes of water transferred (units are in<br />
Sverdrupts: 106 m3/sec). Right panel: colored satellite imagery of heat transport along the Gulf<br />
Stream in the western North Atlantic.<br />
Along the eastern boundary of ocean basins, the currents are not intensified (weaker effect of<br />
vorticity) and wind direction tends to move water away from that coastal region. Ekman<br />
transport is then responsible for the movement of water away from the coast generating a<br />
drawing of water from the bottom to fill the “missing” water at the surface (Figure 31). Although<br />
most regions in the eastern sections of ocean basins are susceptible of upwellings, ocean<br />
bordering continents with high mountain ranges on their western edge (e.g. Nort and South<br />
America) show stronger upwellings due to the “channeling” of the wind along the coast (Figure<br />
32).<br />
Figure 31. Wind blowing (pink arrow) parallel to the coast and thus generating a transport 90°<br />
to the right (north hemisphere). That movement away from the coast generates a “pump” of<br />
deeper water that upwells to the surface.
Figure 32. Top panel: Surface ocean currents are shown in color (red‐yellows for hot‐warm) and<br />
blue‐green for (cold‐cool). The cold water (green coloring) on the western side of North and<br />
South America are intensified by both the transport of water from high latitudes (gyre<br />
circulation) and from deeper water (upwelling formation). Bottom panel: upwelling formation<br />
along the Peruvian coast. Notice that the wind now is moving northward and that Ekman<br />
transport displaces water to the left of the wind current (south hemisphere). On the left hand<br />
side, sea surface temperatures are shown and demonstrate lower temperatures than what is<br />
normal for tropical surface waters.<br />
6) Deep ocean circulation<br />
When warm water reaches the high latitudes and cools, it releases vast amounts of heat to the<br />
atmosphere of the region (and thus supplying energy to balance the regional heat budget of<br />
earth). As water cools, its density increases and it sinks forming deep water masses (convection<br />
of water to the deep ocean; Figure 33). Deep water formation occurs in high latitudes such as<br />
sub‐polar seas (in the north around Iceland, Greenland, and the sub‐Arctic seas; in the south in<br />
Weddell Sea in Antarctica).
Figure 33. Cooling of water in high latitude zones generating convection and deep water<br />
formation.<br />
Figure 34. Ideal density formation at high latitudes and formation of deep water masses<br />
underlying warm light water at the surface. The interface between surface and deep waters is<br />
called the pycnocline (“density difference”) layer.<br />
The density structure of the ocean is thus influenced by cooling in<br />
high latitude regions, and salinity increases due to specific<br />
conditions such as increased evaporation in some ocean basins.<br />
One such basin is the Mediterranean Sea, which undergoes<br />
substantial evaporation and ends up having, as a result, a higher<br />
salinity than the Atlantic. Mediterranean water flows out of the<br />
Gibraltar Straight into the surface of the Atlantic (the Gibraltar<br />
Straight – see picture on the right ‐ is only a few 100 meters deep).<br />
As Mediterranean water flows into the Atlantic, it encounters
lighter (less saline) water and thus sinks until it reaches a point of stable density (basically<br />
surrounded by water of the same density) at about ~1000 m depth. Water masses with specific<br />
density characteristics (forming in specific ocean basins under specific temperature and salinity<br />
conditions) will thus flow into regions of the ocean and stabilize as a function of their density<br />
(densest water will be at the bottom, whereas lightest water will be found at the surface).<br />
Because the Arctic Ocean and its surrounding sub‐Arctic seas (Greenland Sea, Norwegian Sea,<br />
Barent Sea, etc) constitutes a much larger water volume than the Antarctic seas (e.g. Weddell<br />
Sea), most of the deep ocean is filled with dense water originating from the North Atlantic<br />
(Figure 35). The most important water mass in the deep ocean is thus called the North Atlantic<br />
Deep Water mass (NADW). Other major water masses filling the deep ocean are the Antarctic<br />
Intermediate Water mass (AAIW), which is generated from the melting of iceberg released from<br />
the Antarctic ice caps. These iceberg float north with surface currents until they reach areas of<br />
warm water and end up melting. The cold water resulting from this iceberg melting is denser<br />
than the surrounding warm waters and thus sinks. Since the water is relatively fresh (few salt in<br />
ice), it is not as dense as the water from the NADW and thus the AAIW stabilizes between the<br />
surface warm water layer and the NADW. The second Antarctic water mass is that formed along<br />
the Antartic continent from intense cooling of the water (Antarctica being a continent is the<br />
coldest place on earth). This water mass, the Antarctic Bottom Water (AABW) is thus the densest<br />
and sinks below the NADW. Because the volume of water that generates this water mass is<br />
relatively limited with respect to that of the Arctic, it only fills a small part of the deep ocean<br />
(Figure 35).<br />
Figure 35. Density structure of the North Atlantic with major water masses. North Atlantic Deep<br />
Water (NADW) flowing southward from the Arctic region. The Antarctic Intermediate Water<br />
(AAIW) and Antarctic Bottom Water (AABW) flow northward. The Mediterranean water mass<br />
flow westward and extends only across the North Atlantic.<br />
Similar density structures are observed in the Pacific and Indian Oceans, though the direction of<br />
flow for the NADW in these oceans is not north to south, but south to north (after reaching the<br />
South Atlantic, the NADW circles Antarctica and flow northward in the Indian and then the
Pacific Oceans). See Figures 36 and 37 for density structures of the Pacific and Indian Oceans,<br />
repectively.<br />
Figure 36. Density structure of the Pacific Ocean. Note here that density is not graphed, but<br />
salinity (up) and temperature (down left in small). The major green water mass is constituted<br />
mostly by the NADW (deep underneath, in pink in the temperature graph, you’ll find the AABW).<br />
Figure 37. Density structure of the Indian Ocean. Note here that density is not graphed, but<br />
salinity (up) and temperature (down left in small). The major green water mass is constituted<br />
mostly by the NADW (deep underneath, in pink in the temperature graph, you’ll find the AABW).
Deep water formation thus occurs in high latitude regions as presented in Figure 38.<br />
Figure 38. Source of deep‐water formation in dark green with water mass direction of flow.<br />
7) Global ocean circulation<br />
The global ocean circulation is thus a link between surface water loops and deep‐water mass<br />
movements. The overall “conveyor belt” circulation takes a few hundred years (~500 years) but<br />
is not static over time; circulation can accelerate or decelerate depending on climate conditions<br />
and/or water balances. For example the large addition of freshwater to the surface North<br />
Atlantic could decrease the densification of surface water in the North Atlantic and thus slow<br />
down the entire deep‐water circulation, which itself could also alter the speed of surface<br />
returning currents. Hence, the global ocean circulation links all oceans to each other and depends<br />
on atmospheric circulation and wind patterns. The entire structure of earth (sphericity,<br />
seasonality, fluid envelopes in the atmosphere and ocean, rotation of the earth, presence of<br />
continents) affect the redistribution of heat from its zones of surplus (inter‐tropical zones) to its<br />
zones of deficits (high latitudes).