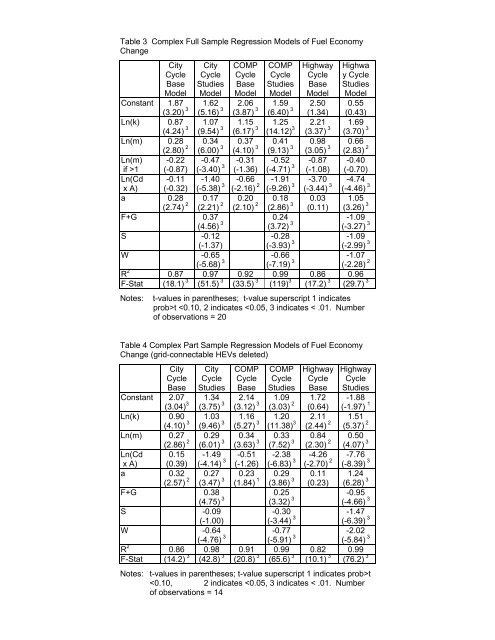
Table 3 Complex Full Sample Regression Models of <strong>Fuel</strong> <strong>Economy</strong> Change City Cycle Base Model Constant 1.87 (3.20) 3 Ln(k) 0.87 (4.24) 3 Ln(m) 0.28 (2.80) 2 Ln(m) -0.22 if >1 (-0.87) Ln(Cd -0.11 x A) (-0.32) a 0.28 (2.74) 2 City Cycle Studies Model 1.62 (5.16) 3 1.07 (9.54) 3 0.34 (6.00) 3 -0.47 (-3.40) 3 -1.40 (-5.38) 3 0.17 (2.21) 2 F+G 0.37 (4.56) 3 COMP Cycle Base Model 2.06 (3.87) 3 1.15 (6.17) 3 0.37 (4.10) 3 -0.31 (-1.36) -0.66 (-2.16) 2 0.20 (2.10) 2 COMP Cycle Studies Model 1.59 (6.40) 3 1.25 (14.12) 3 0.41 (9.13) 3 -0.52 (-4.71) 3 -1.91 (-9.26) 3 0.18 (2.86) 3 0.24 (3.72) 3 Highway Cycle Base Model 2.50 (1.34) 2.21 (3.37) 3 0.98 (3.05) 3 -0.87 (-1.08) -3.70 (-3.44) 3 0.03 (0.11) Highwa y Cycle Studies Model 0.55 (0.43) 1.69 (3.70) 3 0.66 (2.83) 2 -0.40 (-0.70) -4.74 (-4.46) 3 1.05 (3.26) 3 -1.09 (-3.27) 3 S -0.12 -0.28 (-1.37) (-3.93) 3 -1.09 (-2.99) 3 W -0.65 (-5.68) 3 -0.66 (-7.19) 3 -1.07 (-2.28) 2 R 2 0.87 0.97 0.92 0.99 0.86 0.96 F-Stat (18.1) 3 (51.5) 3 (33.5) 3 (119) 3 (17.2) 3 (29.7) 3 Notes: t-values in parentheses; t-value superscript 1 indicates prob>t
HIGHWAY VS. OTHER CYCLE RESULTS - The highway-cycle coefficient estimates are the least stable <strong>and</strong> the least reliable. Because the composite cycle results were obtained by using a composite measure of fuel economy combining the city <strong>and</strong> highway cycle, but with considerably more weight for the city cycle (55% of gpm vs. 45% for highway), it is not surprising that the results for the composite cycle are stable. Despite the uncertainty in the highway-cycle results, those results are also less important in determining the composite fuel economy gain because average gains in fuel economy are considerably greater on the city cycle (sample mean = 67.4%) than the highway cycle (sample mean = 24.7%). So, greater uncertainty on the highway cycle is not particularly troublesome because it relates to a very small part of the composite effect. SUMMARY OF RESULTS Clearly, over the wide range of k (peak kW/kg) values used in this study, there is a strong increase in potential mpg gain via hybridization as power-to-weight ratio increases. As the power-to-weight ratio increases by 10%, the potential to improve mpg increases by about the same amount. Increasing the motor size relative to the engine size appears to provide fuel economy benefits. This occurs in lock step with engine size reduction under the rules of comparison adopted in this study. The inconclusive results for the Ln(m) if m >1 variable before <strong>and</strong> after the inclusion of dummy variables (to allow for variation among studies) suggest that diminishing returns to battery pack <strong>and</strong> motor size must be considered. However, because of motor <strong>and</strong> battery pack costs, this issue is probably not particularly important; hybrids with motor kW in excess of engine kW are not likely to be built by major automobile manufacturers. For the driving cycles simulated, as the power of the motor increases, the ability to recapture braking energy improves. However, at some point — here estimated to be when the motor kW is equal to the engine kW — there is no additional benefit. An, <strong>Santini</strong>, <strong>and</strong> Stodolsky illustrate how, at some point related to the nature of the driving cycle <strong>and</strong> the motor/battery power, all braking energy available is recoverable <strong>and</strong> more motor <strong>and</strong> battery pack provides no value with regard to energy recovery. Past that point, its primary effect is likely to be to add mass, <strong>and</strong> therefore reduce fuel economy. Up to that point, the estimates here imply that at every 10% increase in the value of m results in an increase of 3%–4% in mpg gain for the city <strong>and</strong> composite cycles. For the highway cycle, the estimates imply that the effect of added motor size — or greater engine size reduction, or both — provides an even larger contribution to improving fuel economy. As discussed earlier, it appears that load reduction improves the percentage gain in mpg that is possible. The statistical results support the physics for “drag area” (CdxA), which say that a more efficient engine will improve fuel economy. In this case, the engine is an Atkinson cycle engine, which does not have adequate specific power for use in a conventional vehicle. For the limited information on transmission switches, the results are consistent with a loss of fuel economy when switching from a manual to a CVT (the coefficient value of one observation is compromised by the fact that it uses a different vehicle simulation model). CONCLUSIONS This study estimates that the variability in published estimates of fuel economy gains when switching from a conventional to a hybrid powertrain in an otherwise identical vehicle body can largely be explained if one knows the key vehicle attributes for the compared vehicles. In particular, knowing the 0–60 mph acceleration time, vehicle mass, peak conventional vehicle powertrain kW, <strong>and</strong> peak engine <strong>and</strong> motor kW of the hybrid vehicle allows researchers to explain more than 80% of the variation among studies. Not all of these items are necessary. On the basis of the models developed <strong>and</strong> presented here, or simple extensions of them, researchers can construct estimates of fuel economy improvement by using the following four combinations: (1) kW/kg (variable k) <strong>and</strong> percent engine power reduction in the conventional to hybrid switch (e), (2) kW/kg (k) <strong>and</strong> peak motor power to peak engine power ratio in the hybrid (m), (3) 0-60 mph acceleration time (t) <strong>and</strong> percent engine power reduction in the conventional to hybrid switch (e), <strong>and</strong> (4) 0-60 mph acceleration time (t) <strong>and</strong> peak motor power to peak engine power ratio in the hybrid (m). Options 2 <strong>and</strong> 3 have been done here (Tables 2-4). Options 1 <strong>and</strong> 4 may be done by use of the database in Appendix A. Within the range of values included in the study, CdxA, engine type (if engine efficiency is much different), <strong>and</strong> transmission switches are estimated to make a difference, but only add a few percent points to the statistical explanation (R 2 ) of variation in percent gains in fuel economy. Unexplained variation caused by unknown study details <strong>and</strong>/or different vehicle simulation methods represents only a small percentage of the unexplained R 2 after the previously discussed variables have been included in the regressions. The (absence of positive) results are consistent with an interpretation that when tire rolling resistance (Cr) is the same for both the hybrid <strong>and</strong> conventional vehicle, there is no influence on the percentage difference in fuel economy between the two vehicles. This is hardly a definitive result. The statistical results should be regarded as a tool to help summarize results across studies. In light of the small sample size <strong>and</strong> the likelihood of correlated errors, the estimates of statistical significance are uncertain. Only a few of the technical options for hybridization have been included in the studies surveyed. In many cases, there is not enough information to evaluate the effects of individual components. Nevertheless, the results provide a guide, <strong>and</strong> the data collected provide consistent