

TRANSPORTATION ENERGY DATA BOOK: EDITION 20 - Center for ...
TRANSPORTATION ENERGY DATA BOOK: EDITION 20 - Center for ...
TRANSPORTATION ENERGY DATA BOOK: EDITION 20 - Center for ...

Create successful ePaper yourself
Turn your PDF publications into a flip-book with our unique Google optimized e-Paper software.
<strong>Center</strong> <strong>for</strong> Transportation Analysis<br />
Energy Division<br />
<strong>TRANSPORTATION</strong> <strong>ENERGY</strong> <strong>DATA</strong> <strong>BOOK</strong>:<br />
<strong>EDITION</strong> <strong>20</strong><br />
Stacy C. Davis<br />
Oak Ridge National Laboratory<br />
October <strong>20</strong>00<br />
Prepared <strong>for</strong><br />
Office of Transportation Technologies<br />
U.S. Department of Energy<br />
Prepared by<br />
OAK RIDGE NATIONAL LABORATORY<br />
Oak Ridge, Tennessee 3783 l-6073<br />
managed by<br />
UT-Battelle, LLC<br />
<strong>for</strong> the<br />
U.S. DEPARTMENT OF <strong>ENERGY</strong><br />
under Contract No. DE-AC05-OOOR22725<br />
ORNL-6959<br />
(Edition <strong>20</strong> of ORNL-5 198)
Users of the Transportation Energy Data Book are encouraged to comment on errors,<br />
omissions, emphases, and organization of this report to one of the persons listed below.<br />
Requests <strong>for</strong> additional complementary copies of this report, additional data, or in<strong>for</strong>mation<br />
on an existing table should be referred to Ms. Stacy Davis, Oak Ridge National Laboratory.<br />
Stacy C. Davis<br />
Oak Ridge National Laboratory<br />
P. 0. Box <strong>20</strong>08<br />
Building 3 156, MS-6073<br />
Oak Ridge, Tennessee 3783 l-6073<br />
Telephone: (865) 574-5957<br />
FAX: (865) 574-3851<br />
E-mail: DAVISSC@ornl.gov<br />
Web Site Location: www-cta.ornl.gov<br />
Philip D. Patterson<br />
Office of Transportation Technologies<br />
Department of Energy, EE-30<br />
Forrestal Building, Room 5F-034<br />
1000 Independence Avenue, S. W.<br />
Washington, D.C. <strong>20</strong>585<br />
Telephone: (<strong>20</strong>2) 586-9121<br />
FAX: (<strong>20</strong>2) 586-1637<br />
E-mail: PHILIP.PATTERSON@hq.doe.gov<br />
Web Site Location: www.ott.doe.gov<br />
analytic page: www.ott.doe.gov/fact.html<br />
I<br />
This and previous editions of the<br />
Transportation Energy Data Book<br />
can be found on the web at:<br />
www-cta.ornl.gov/data<br />
I
TABLE OF CONTENTS<br />
FOREWORD ..................................................................... xv<br />
ACKNOWLEDGMENTS .......................................................... xvii<br />
ABSTRACT .................................................................... ..x 1x<br />
INTRODUCTION ................................................................. xxi<br />
CHAPTER1 PETROLEUM ...................................................... l-l<br />
Table 1.1 World Fossil Fuel Potential . . . . . . . . . . . . . . . . . . . . . . . . . . . . . . . . . . . . .<br />
Figure 1.1<br />
Table 1.2<br />
World Fossil Fuel Potential. . . . . . .<br />
World Crude Oil Production, 1960-98 . . . . . . . . . . . . . . . . . . . . . . . . . . . .<br />
Table 1.3 World Oil Consumption, 1960-97 . . . . . . . . . . . . . . . . . . . . . . . . . . . . . . .<br />
Table 1.4 Petroleum Stocks in OECD Countries, End of Year 1973-98 . . . . . . . .<br />
Figure 1.2<br />
Table 1.5<br />
Crude Oil Prices, 1870-98 . . . . . . . . . . . . . . . . .<br />
U.S. Petroleum Net Imports by World Region of Origin, 1960-98 . . . . . . . .<br />
Table 1.6 Summary of 1996 Military Expenditures <strong>for</strong> Defending Oil Supplies<br />
from the Middle East . . . . . . . . . . . . . . . . . . . . . . . . . . . . . . . . . . . . . .<br />
Figure I. 3<br />
Table 1.7<br />
Refinery Gross Output by World Region, 1999 . . . . . . . . . . . . . . . . . .<br />
U.S. Refinery Input of Crude Oil and Petroleum Products, 1987-98 . . . . . . . .<br />
Table 1.8 Refinery Yield of Petroleum Products from a Barrel of Crude Oil, 1978-98 . . . .<br />
Table 1.9 United States Petroleum Production and Consumption, 1973-99 . . . . .<br />
Figure 1.4<br />
Table 1.10<br />
United States Petroleum Production and Consumption, 1973-99 . .<br />
Consumption by Petroleum by End-Use Sector, 1973-99 . . . . . . . . . . . . . . . .<br />
Table 1.11 Transportation of Petroleum and Petroleum Products in the U.S.<br />
byMode,1975-98 . . . . . . . . . . . . . . . . . . . . . . . . . . . . . . . . . . . . . . . . . . . . . . . . .<br />
TRANSPOR’I‘A’IXON <strong>ENERGY</strong> <strong>DATA</strong> <strong>BOOK</strong>: <strong>EDITION</strong> <strong>20</strong>-<strong>20</strong>00<br />
. 1-2<br />
l---2<br />
. 1-3<br />
. 14<br />
. 1-5<br />
I - 6<br />
. 1-7<br />
. 1-8<br />
I - 9<br />
l-10<br />
l-11<br />
1-12<br />
I-13<br />
1-14<br />
1-15
vi<br />
TABLE OF CONTENTS (Continued)<br />
CHAPTER2 <strong>ENERGY</strong> .......................................................... 2-l<br />
Table 2.1 World Production of Primary Energy by Selected Country Groups, 1989-98 ...... 2-2<br />
Table 2.2 World Consumption of Primary Energy by Selected Country Groups, 1989-98 . . . 2-3<br />
Table 2.3 U. S. Consumption of Total Energy by End-Use Sector, 1970-99 ............... 2-4<br />
Table 2.4 Distribution of Energy Consumption by Source, 1973, 1980, and 1999 ........... 2-5<br />
Table 2.5 Domestic Consumption of Transportation Energy by Mode and<br />
FuelType, ...................................................... 2-6<br />
Table 2.6 Transportation Energy Use by Mode, 1996-98 . . . . . . . . . . . . . . . . . . . . . . . . . 2-7<br />
Table 2.7 Transportation Energy Consumption by Mode, 1970-98 . . . . . . . . . . . . . . . . . . . 2-8<br />
Table 2.8 Highway Usage of Gasoline and Special Fuels, 1973-98 . . . . . . . . . . . . . 2-9<br />
Figure 2.1 Motor Gasoline Quantities by Type, 1981 and 1998 . . . . . . . . . . . . . 2-10<br />
Table 2.9 Alternative Vehicle Fuel Consumption, 1992-<strong>20</strong>00 . . . . . . . . . . . . . . . . . . . 2-11<br />
Table 2.10 U.S. Production and Imports of MTBE and Fuel Ethanol, 1978-99 . . . . . . . . . 2-12<br />
Table 2.11 Passenger Travel and Energy Use in the United States, 1998 . . . . . . . . . . . . . . . . . . 2-13<br />
Table 2.12 Energy Intensities of Passenger Modes, 1970-98 . . . . . . . . . . . . . . . . . . . . . 2-14<br />
Figure 2.2 Energy Intensity,<strong>for</strong> Transit in the U.S., 1997 . . . . . . . . . . . . . 2-15<br />
Table 2.13 Intercity Freight Movement and Energy Use in the United States, 1998 . . . . . 2-16<br />
Table 2.14 Energy Intensities of Freight Modes, 1970-98 . . . . . . . . . . . . . . . . . . . . 2-17<br />
CHAPTER 3 GREENHOUSE GAS EMISSIONS . . . . . . . . . . . . . . . . . . . . . . . . . . . . . . . . . . . . . 3-l<br />
Table 3.1 International Man-Made Emissions of Greenhouse Gases, 1990-97 . . . . . . . . . . . . 3-2<br />
Table 3.2 International Man-Made Emissions of Carbon Dioxide, 1990-97 . . . . . . . . . . . . 3-3<br />
Table 3.3 International Man-Made Emissions of Carbon Dioxide by<br />
Source Category, 1990 and 1997 . . . . . . . . . . . . . . . . . . . . . . . . . . . . . . . . . . . . . . 3-4<br />
Table 3.4 Estimated U.S. Emissions of Greenhouse Gases, 1990-98 . . . . . . . . . . . . . . . . 3-5<br />
<strong>TRANSPORTATION</strong><strong>ENERGY</strong><strong>DATA</strong>BOOIC <strong>EDITION</strong>~O-<strong>20</strong>00
Table 3.5<br />
Table 3.6<br />
Table 3.7<br />
Table 3.8<br />
Table 3.9<br />
CHAPTER 4<br />
Table 4.1<br />
Table 4.2<br />
Table 4.3<br />
Table 4.4<br />
Table 4.5<br />
Table 4.6<br />
Table 4.7<br />
Table 4.8<br />
Table 4.9<br />
Table 4.10<br />
Table 4.11<br />
Table 4.12<br />
Table 4.13<br />
Table 4.14<br />
TABLE OF CONTENTS (Continued)<br />
U.S. Carbon Dioxide Emissions from Fossil Energy Consumption by<br />
End-UseSector,1984-98 . . . . . . . . . . . . . . . . . . . . . . . . . . . . . . . . . . . . . . . . . . 3-6<br />
U.S. Carbon Dioxide Emissions from Energy Use in the Transportation<br />
Sector,1980-98 . . . . . . . . . . . . . . . . . . . . . . . . . . . . . . . . . . . . . . . . . . . . . . . . . . . 3-7<br />
Numerical Estimates of Global Warming Potentials Compared With<br />
CarbonDioxide . . . . . . . . . . . . . . . . . . . . . . . . . . . . . . . . . . . . . . . . . . . . . . . . . .<br />
NEAR-TERM Technology: Fuel-Cycle Energy and Greenhouse Gas Emission<br />
Changes of Alternative Transportation Fuels and Advanced Vehicle<br />
Technologies . . . . . . . . . . . . . . . . . . . . . . . . . . . . . . . . . . . . . . . . . . . . . . . . . . . .<br />
. 3-8<br />
3-11<br />
LONG-TERM Technology: Fuel-Cycle Energy and Greenhouse Gas Emission<br />
Changes of Alternative Transportation Fuels and Advanced Vehicle<br />
Technologies . . . . . . . . . . . . . . . . . . . . . . . . . . . . . . . . . . . . . . . . . . . . . . . . . . . . . . . 3-12<br />
CRITERIA POLLUTANTS . . . . . . . . . . . . . . . . . . . . . . . . . . . . . . . . . . . . . . . . . . . 4-1<br />
Total National Emissions of the Criteria Air Pollutants by Sector, 1998 .......... 4-2<br />
Total National Emissions of Carbon Monoxide, 1970-98 ..................... 4-3<br />
Emissions of Carbon Monoxide from Highway Vehicles, 1970-98 .............. 44<br />
Total National Emissions of Nitrogen Oxides, 1970-98 ....................... 4-5<br />
Emissions of Nitrogen Oxides from Highway Vehicles, 1970-98 ............... 4-6<br />
Total National Emissions of Volatile Organic Compounds, 1970-98 ............. 4-7<br />
Emissions of Volatile Organic Compounds from Highway Vehicles, 1970-98 ..... 4-8<br />
Total National Emissions of Particulate Matter (PM-lo), 1970-98 .............. 4-9<br />
Emissions of Particulate Matter (PM-IO) from Highway Vehicles, 1970-98 ..... 4-10<br />
Total National Emissions of Particulate Matter (PM-2.5) 1990-98 ............. 4-l 1<br />
Emissions of Particulate Matter (PM-2.5) from Highway Vehicles, 1990-98 . . . . . . 4-12<br />
National Lead Emission Estimates, 1970-98 . . . . . . . . . . . . . . . . . . . . . . . . . . . . 4-13<br />
State-level Emissions <strong>for</strong> Criteria Pollutants, 1998 . . . . . . . . . . . . . . . . . . . . 4-14<br />
NEAR-TERM Technology: Fuel-Cycle Energy and Criteria Pollutant Emission<br />
Changes of Alternative Transportation Fuels and Advanced Vehicle<br />
Technologies . . . . . . . . . . . . . . . . . . . . . . . . . . . . . . . . . . . . . . . . . . . . . . . . . . . . . . . 4-17<br />
<strong>TRANSPORTATION</strong> <strong>ENERGY</strong> <strong>DATA</strong> <strong>BOOK</strong>: <strong>EDITION</strong> <strong>20</strong>-<strong>20</strong>00<br />
vii
. . .<br />
Vlll<br />
TABLE OF CONTENTS (Continued)<br />
Table 4.15 LONG-TERM Technology: Fuel-Cycle Energy and Greenhouse Gas Emission<br />
Changes of Alternative Transportation Fuels and Advanced Vehicle<br />
Technologies . . . . . . . . . . . . . . . . . . . . . . . . . . . . . . . . . . . . . . . . . . . . . . . . . . . . . . . 4-19<br />
Table 4.16 Pollution from a Typical New Car and Light Truck, <strong>20</strong>00 Model Year . . . . . . . . . 4-32<br />
Table 4.17 Tier 2 Federal Emission Standards . . . . . . . . . . . . . . . . . . . . . . . . . . . . . . . . . . . 4-32<br />
Table 4.18 Federal Exhaust Emission Certification Standards <strong>for</strong> Gasoline- and<br />
Diesel-Powered Light Vehicles . . . . . .-. . . . . . . . . . . . . . . . . . . . . . . . . . . . . . 4-33<br />
Table 4.19 Federal Exhaust Emission Certification Standards <strong>for</strong> Gasoline- and<br />
Diesel-Powered Light Trucks (Category LDTl) . . . . . . . . . . . . . . . . . . . . . . . . 4-34<br />
Table 4.<strong>20</strong> Federal Exhaust Emission Certification Standards <strong>for</strong> Gasoline- and<br />
Diesel-Powered Light Trucks (Category LDT2) . . . . . . . . . . . . . . . . . . . . . . . 4-35<br />
Table 4.21 Federal Exhaust Emission Certification Standards <strong>for</strong> Gasoline- and<br />
Diesel-Powered Light Trucks (Category LDT3) . . . . . . . . . . . . . . . . . . 4-36<br />
Table 4.22 Federal Exhaust Emission Certification Standards <strong>for</strong> Gasoline- and<br />
Diesel-Powered Light Trucks (Category LDT4) . . . . . . . . . . . . . . . . . . . . . . . . 4-37<br />
Table 4.23 Federal Exhaust Emission Certification Standards <strong>for</strong> Gasoline- and<br />
Diesel-Powered Light Heavy Trucks . . . . . . . . . . . . . . . . . . . . . . . . . . . . . , . . 4-3 8<br />
Table 4.24 Federal Exhaust Emission Certification Standards <strong>for</strong> Gasoline- and<br />
Diesel-Powered Heavy Heavy Trucks . . . . . . . . . . . . . . . . . . . . . . . . . . . . . . . . . . . 4-3 9<br />
Table 4.25 Cali<strong>for</strong>nia Passenger Cars and Light Trucks Emission<br />
Certification Standards. . . . . . . . . . . . . . . . . . . . . . . . . . . . . . . . 4440<br />
Table 4.26 Cali<strong>for</strong>nia Vehicle Emission Reduction <strong>for</strong> Passenger Cars and<br />
LightTruclts........................................................ 4-41<br />
Table 4.27 Cali<strong>for</strong>nia Air Resources Board Requirements <strong>for</strong> Meeting Emission Standards . . 4442<br />
CHAPTER 5 <strong>TRANSPORTATION</strong> AND THE ECONOMY. . . . . . . . . . . . . . . . . . . . . . . . . . . . 5-1<br />
Table 5.1 Gasoline Prices <strong>for</strong> Selected Countries, 1978-99 . . . . . . . . . . . . . . . . . . . 5-2<br />
Figure 5.1 Gasoline Prices <strong>for</strong> Selected Countries, 1990 and I998 . . 5-3<br />
Table 5.2 Diesel Fuel Prices <strong>for</strong> Selected Countries, 1978-99 . . . . . . . . . . . . . . . . . . 5-4<br />
Figure 5.2 Diesel Fuel Prices <strong>for</strong> Selected Countries, 1990 and 1998 . . . . . . . . . 5-S<br />
Table 5.3 Prices <strong>for</strong> a Barrel of Crude Oil and a Gallon of Gasoline, 1978-99 . . . . . . . . 5-6<br />
Table 5.4 Retail Prices <strong>for</strong> Motor Fuel, 1978-99 . . . . . . . . . . . . . . . . . . . . . . . 5-7<br />
<strong>TRANSPORTATION</strong> <strong>ENERGY</strong> DAI’A <strong>BOOK</strong>: <strong>EDITION</strong> <strong>20</strong>-<strong>20</strong>00
Table 5.5<br />
Table 5.6<br />
Table 5.7<br />
Table 5.8<br />
Table 5.9<br />
Table 5.10<br />
Table 5.11<br />
Table 5.12<br />
Table 5.13<br />
Table 5.14<br />
Table 5.15<br />
Table 5.16<br />
Table 5.17<br />
Table 5.18<br />
TABLE OF CONTENTS (Continued)<br />
Prices <strong>for</strong> Selected Transportation Fuels, 1978-99 ...................<br />
State Taxes on Motor Fuels, 1999 ...............................<br />
State Tax Exemptions <strong>for</strong> Gasohol, January 1,<strong>20</strong>0O ..................<br />
Federal Excise Taxes on Motor Fuels ......................... : ...<br />
States With Ethanol Tax Incentives ...............................<br />
Average Price of a New Car, 1970-99 ............................<br />
Average Price of a New Car by Sector, 1970-99 ....................<br />
Automobile Operating Cost per Mile, 1975-99. .....................<br />
Fixed Automobile Operating Costs per Year, 1975-99 ................<br />
Economic Indicators, 1970-99 ..................................<br />
Consumer Price Indices, 1970-99 ................................<br />
Motor Vehicle Manufacturing Employment Statistics, 1972-98 ........<br />
Employees of Motor Vehicle and Related Industries, 1990 and 1997 ....<br />
Employment in Transportation and Related Industries, 1960-98 ........<br />
....... 5-8<br />
....... 5-9<br />
...... 5-11<br />
...... 5-l 1<br />
...... 5-12<br />
...... 5-13<br />
...... 5-14<br />
...... 5-15<br />
...... 5-16<br />
...... 5-17<br />
...... 5-17<br />
...... 5-18<br />
...... 5-19<br />
...... 5-<strong>20</strong><br />
CHAPTER 6 HIGHWAY VEHICLES AND CHARACTERISTICS ..................... 6-l<br />
Table 6.1 Automobile Registrations <strong>for</strong> Selected Countries, 1950-96 .................... 6-2<br />
Table 6.2 Truck and Bus Registrations <strong>for</strong> Selected Countries, 1950-96 .................. 6-3<br />
Table 6.3 Automobiles and Trucks in Use, 1970-98 .................................. 6-5<br />
Table 6.4 Vehicle Stock and New Sales in United States, 1998 Calendar Year ............. 6-6<br />
Table 6.5 Highway Vehicle Miles Traveled by Vehicle Type, 1970-98 ................... 6-7<br />
Table 6.6 Automobiles in Operation and Vehicle Travel by Age, 1970 and 1998<br />
Table 6.7 Trucks in Operation and Vehicle Travel by Age, 1970 and 1998 . . . . .<br />
Table 6.8 Average Age of Automobiles and Trucks in Use, 1970-98 . . . . . . . .<br />
Table 6.9 Automobile Scrappage and Survival Rates . . . . . . . . . . . . . . . . . . . . .<br />
Figure 6.1 Automobile Survival Rates . . .<br />
Table 6.10 Light Truck Scrappage and Survival Rates . . . . . . . . . . . . . . . . . .<br />
<strong>TRANSPORTATION</strong> <strong>ENERGY</strong> <strong>DATA</strong> <strong>BOOK</strong>: <strong>EDITION</strong> <strong>20</strong>-<strong>20</strong>00<br />
. . . . . 6-8<br />
. 6-9<br />
. 6-10<br />
6-11<br />
G-12<br />
. 6-13
TABLE OF CONTENTS (Continued)<br />
Figure 6.2 Light Truck Survival Rates. ............................................ 6-14<br />
CHAPTER 7 LIGHT VEHICLES AND CHARACTERISTICS ......................... 7-l<br />
Table 7.1 Summary Statistics <strong>for</strong> Passenger Cars, 1970-98 . . . . . . . . . . . . . . . . . . 7-2<br />
Table 7.2 Summary Statistics <strong>for</strong> Two-Axle, Four-Tire Trucks, 1970-98 . . . . . 7-3<br />
Table 7.3 New Retail Automobile Sales in the United States, 1970-98 . . . . . . . . . . . . . . 7-4<br />
Table 7.4 New Retail Sales of Trucks 10,000 pounds GVW and Less in the<br />
UnitedStates,1970-98 . . . . . . . . . . . . . . . . . . . . . . . . . . . . . . . . . . . . . . . . . . . . . . . . 7-5<br />
Table 7.5 Period Sales, Market Shares, and Sales-Weighted Fuel Economies of New<br />
Domestic and Import Automobiles, Selected Sales Periods 1976-99 . . . . . . . . . . . 7-6<br />
Table 7.6 Period Sales, Market Shares, and Sales-Weighted Fuel Economies of New<br />
Domestic and Import Light Trucks, Selected Sales Period 1976-99 . . . . 7-7<br />
Table 7.7 Light Vehicle Market Shares by Size Class, Sales Period 1976-99 . . . . . . . . . . . 7-8<br />
Table 7.8 Sales-Weighted Engine Size of New Domestic and Import Automobiles<br />
by Size Class, Sales Periods 1976-99 . . . . . . . . . . . . . . . . . . . . . . . . . . . . . . . . . 7-9<br />
Table 7.9 Sales-Weighted Engine Size of New Domestic and Import Light Trucks<br />
by Size Class, Sales Periods 1976-99 . . . . . . . . . . . . . . . . . . . . . . . . . . . . . . . . 7-10<br />
Table 7.10 Sales-Weighted Curb Weight of New Domestic and Import Automobiles<br />
by Size Class, Sales Periods 1976-99 . . . . . . . . . . . . . . . . . . . . . . . . . 7-l 1<br />
Table 7.11 Sales-Weighted Interior Space of New Domestic and Import Automobiles<br />
by Size Class, Sales Periods 1976-99 . . . . . . . . . . . . . . . . . . . . . . . . . . . 7-12<br />
Figure 7.1 Engine Size, Curb Weight, and Interior Space of New Domestic and<br />
Import Automobiles, 1976-99 . . . . . . . . . . . . . . . . . . . . . . 7-l 3<br />
Table 7.12 Sales-Weighted Wheelbase of New Automobiles and Light Trucks,<br />
SalesPeriod1976-99................................................. 7-14<br />
Table 7.13 Average Material Consumption <strong>for</strong> a Domestic Automobile,<br />
1978,1985,and1999................................................. 7-15<br />
Table 7.14 New Light Vehicle Dealerships and Sales, 1970-98 . . . . . . . . . . . . . . . . 7-16<br />
Table 7.15 Conventional and Alternative Fuel Refueling Stations . . . . . . . . . . . . . . . . . . . . . 7-17<br />
Table 7.16 Corporate Average Fuel Economy (CAFE) Standards versus Sales-Weighted<br />
Fuel Economy Estimates <strong>for</strong> Automobiles and Light Trucks, 1978-99 . . . . . . . . . 7-18<br />
Table 7.17 Corporate Average Fuel Economy (CAFE) Fines Collected, 1983-98 . . . . . . . 7-19<br />
<strong>TRANSPORTATION</strong><strong>ENERGY</strong><strong>DATA</strong>BOOIC <strong>EDITION</strong>~O-<strong>20</strong>00
TABLE OF CONTENTS (Continued)<br />
Table 7.18 Tax Receipts from the Sale of Gas Guzzlers, 1980-98 ....................... 7-19<br />
Table 7.19 The Gas Guzzler Tax on New Cars ...................................... 7-<strong>20</strong><br />
Table 7.<strong>20</strong> Vehicle Specifications <strong>for</strong> Tested Vehicles ................................ 7-22<br />
Table 7.21 Fuel Economy by Speed, 1973, 1984 and 1997 ............................ 7-23<br />
Figure 7.2 Fuel Economy by Speed, 1973, 1984 and 1997. ............................ 7-24<br />
Table 7.22 Steady Speed Fuel Economy <strong>for</strong> Tested Vehicles ........................... 7-25<br />
Figure 7.3 Urban Driving Cycle ................................................. 7-26<br />
Figure 7.4 Highway Driving Cycle ............................................... 7-26<br />
Figure 7.5 New York City Driving Cycle ........................................... 7-2 7<br />
Figure 7.6 Representative Number Five Driving Cycle ............................... 7-2 7<br />
Figure 7.7 USOGDrivingCycle .................................................. 7-28<br />
Table 7.23 Occupant Fatalities by Vehicle Type and Nonoccupant Fatalities, 1975-98 ...... 7-29<br />
Table 7.24 Light Vehicle Occupant Safety Data, 1975-98 ............................. 7-30<br />
Table 7.25 Crashes by Crash Severity, Crash Type, and Vehicle Type, 1998 ............... 7-3 1<br />
Figure 7.8 Percent Rollover Occurrence by Vehicle Type and Crash Severity ............. 7-32<br />
CHAPTER 8 HEAVY VEHICLES AND CHARACTERISTICS ........................ 8-1<br />
Table 8.1 Summary Statistics <strong>for</strong> Other Single-Unit and Combination Trucks,<br />
1970-98 ............................................................. 8-2<br />
Table 8.2 New Retail Truck Sales by Gross Vehicle Weight, 1970-98 ................... 8-3<br />
Table 8.3 Truck Statistics by Gross Vehicle Weight Class, 1997 ........................ 8-5<br />
Table 8.4 Percentage of Trucks by Size Class, 1977, 1982, 1987, 1992, and 1997 .......... 8-5<br />
Table 8.5 Truck Fuel Economy by Fuel Type and Size Class, 1997 ...................... 8-6<br />
Table 8.6 Truck Fuel Economy by Size Class, 1977, 1982, 1987,1992, and 1997 .......... 8-6<br />
Table 8.7 Truck Statistics by Size, 1997 ........................................... 8-7<br />
Table 8.8 Percentage of Trucks by Size Ranked by Major Use, 1997 .................... 8-8<br />
Table 8.9 Percentage of Trucks by Fleet Size and Primary Refueling Facility, 1997 ......... 8-9<br />
<strong>TRANSPORTATION</strong><strong>ENERGY</strong><strong>DATA</strong>BOOIC <strong>EDITION</strong>~O-<strong>20</strong>00<br />
Xi
xii<br />
TABLE OF CONTENTS (Continued)<br />
Table 8.10 Percentage of Trucks by Major Use and Primary Refueling Facility, 1997 ....... 8-10<br />
Table 8.11 Growth of Freight Activity in the United States: Comparison of the 1997<br />
and 1993 Commodity Flow Surveys ..................................... 8-12<br />
Table 8.12 Commodity Flow Survey Freight Activity, 1997 ........................... 8-13<br />
Table 8.13 Summary Statistics on Buses by Type, 1970-98 ............................ 8-14<br />
CHAPTER 9 ALTERNATIVE FUEL VEHICLES AND CHARACTERISTICS ........... 9-l<br />
Table 9.1 Estimates of Alternative Fuel Vehicles in Use, 1992-<strong>20</strong>00 ..................... 9-3<br />
Table 9.2 Estimates of Light Alternative Fuel Vehicles, 1996, 1998, and <strong>20</strong>00 .............. 9-4<br />
Table 9.3 Estimates of Heavy Alternative Fuel Vehicles, 1996, 1998, and <strong>20</strong>00 ............. 9-5<br />
Table 9.4 Alternative Fuel Vehicles Available by Manufacturer, Model Year <strong>20</strong>00 .......... 9-6<br />
Table 9.5 Number of Alternative Refuel Sites by State and Fuel Type, 1999 ............... 9-7<br />
Table 9.6 List of Clean Cities as of 12/l/99 by Designation. ............................ 9-8<br />
Figure 9.1 Map of Clean Cities as of 1211199 ......................................... 9-9<br />
Table 9.7 U.S. Advanced Battery Consortium Goals <strong>for</strong> Electric Vehicle Batteries ......... 9-10<br />
Table 9.8 PNGV Goals and Specifications of Hybrid-Electric Vehicles .................. 9-11<br />
CHAPTER 10 FLEET VEHICLES AND CHARACTERISTICS ....................... 10-l<br />
Figure 10.1<br />
Table 10.1<br />
Table 10.2<br />
Table 10.3<br />
Table 10.4<br />
Figure 10.2<br />
Figure 10.3<br />
Table 10.5<br />
Table 10.6<br />
Table 10.7<br />
Fleet Vehicles in Service as of January 1, 1999 ..........................<br />
Top Ten States with Fleets of Ten Vehicles or More, 1999 .................<br />
Fleet Vehicle Composition by Vehicle Type, 1991. .......................<br />
Average Length of Time Fleet Vehicles are Kept Be<strong>for</strong>e Sold to Others, 1991 .<br />
Average Annual and Daily Vehicle-Miles of Travel <strong>for</strong> Fleet Vehicles, 1991 ...<br />
Worldwide Federal Inventory, 1992-97 ................................<br />
Average Miles per Federal Vehicle by Vehicle Type, 1997 .................<br />
Federal Government Vehicles by Agency, Fiscal Year 1997 ................<br />
Federal Fleet Vehicle Acquisitions by Fuel Type, FY 1997 .................<br />
Fuel Consumed by Federal Government Fleets, FY 1997 ..................<br />
<strong>TRANSPORTATION</strong><strong>ENERGY</strong><strong>DATA</strong> <strong>BOOK</strong>: <strong>EDITION</strong>~O-<strong>20</strong>00<br />
1 o-2<br />
10-3<br />
10-4<br />
10-4<br />
10-4<br />
1 o-5<br />
1 O-5<br />
10-6<br />
1 o-7<br />
1 o-7
TABLE OF CONTENTS (Continued)<br />
Table 10.8 Energy Policy Act Purchase Requirements of Light Alternative<br />
FuelVehicles . . . . . . . . . . . . . . . . . . . . . . . . . . . . . . . . . . . . . . . . . . . . . . . . . . . . . . . . . 10-8<br />
CHAPTER 11 HOUSEHOLD VEHICLES AND CHARACTERISTICS . . . . . . . . . . . . . . . . . . 1 l-l<br />
Table 11.1<br />
Table 11.2<br />
Table 11.3<br />
Table 11.4<br />
Table 11.5<br />
Population and Vehicle Profile, 1950-98 . . . . . . . . . . . . . . . . . . . . . . . . . . 1 l-2<br />
Average Annual Expenditures of Households by Income, 1998 ............<br />
Household Vehicle Ownership, 1960-90 Census ........................<br />
Demographic Statistics, 1969, 1977, 1983, 1990, and 1995 NPTS . . . . . . . . 11-5<br />
1 l-3<br />
114<br />
Average Annual Vehicle-Miles, Vehicle Trips and Trip Length per Household<br />
1969, 1977, 1983,1990, and 1995 NPTS . . . . . . . . . . . . . . . . . . . . . . . . . . . . 1 l-6<br />
Table 11.6 Average Annual Person-Miles Traveled (PMT), Person Trips and Trip Length<br />
per Household by Selected Trip Purposes, 1983, 1990, and 1995 NPTS . . .<br />
Table 11.7 Average Number of Vehicles and Vehicle Travel per Household,<br />
1990and1995NPTS..............................................<br />
Figure 11.1 Average Vehicle Occupancy by Vehicle Type, I995 NPTS . . . . . . . . . . . . . . .<br />
Figure 11.2 Average Vehicle Occupancy by Trip Purpose, 1977, 1983, 1990, and<br />
1995NPTS................................................,.....<br />
Table 11.8<br />
Table 11.9<br />
Table 11.10<br />
Table 11.11<br />
Table 11.12<br />
Table 11.13<br />
Table 11.14<br />
Figure 11.3<br />
Table 11.15<br />
Figure 11.4<br />
Figure 11.5<br />
11-7<br />
1 l-8<br />
11-9<br />
11-10<br />
Vehicle-Miles by Trip Purpose, 1995 NPTS . . . . . . . . . . . . . . . . . . . . . . 1 l-l 1<br />
Average Annual Miles per Vehicle by Household Vehicle Ownership,<br />
1995NPTS . . . . . . . . . . . . . . . . . . . . . . . . . . . . . . . . . . . . . . . . . . . . . . . . . . . . . . . . 11-12<br />
Average Age of Vehicles,by Household Vehicle Ownership, 1995 NPTS . . . . . . . . 1 l-12<br />
Average Annual Miles per Household Vehicle by Vehicle Age ................ 1 l-l 3<br />
Journey-to-Work Statistics, 1983, 1990, and 1995 NPTS ..................... 11-14<br />
Means of Transportation to Work, 1980 and 1990 Census . . . . . . . . . . . . . . . . . 11-15<br />
National and Metropolitan Area Comparisons of Journey-to-Work Statistics,<br />
1990Census........................................................ 11-16<br />
Long-Distance Trips by Destination, 1995 . . . . . . . . . . . . . . . . . . . . . . . 11-l 7<br />
Long-Distance Trips by Mode and Purpose, 1995 . . . . . . . . . . . . . . . . . . . . . . . 1 l-l 8<br />
Long-Distance Household Trips by &lode and Trip Distance, 1995. . . I l-19<br />
Shares of Long-Distance Person Trips by Mode artd Household Income, 1995 . 1 l-<strong>20</strong><br />
. . .<br />
Xl11
xiv<br />
TABLE OF CONTENTS (Continued)<br />
CHAPTER 12 NONHIGHWAY MODES . . . . . . . . . . . . . . . . . . . . . . . . . . . . . . . . . . . . . . . . . . 12-1<br />
Table 12.1<br />
Table 12.2<br />
Table 12.3<br />
Table 12.4<br />
Table 12.5<br />
Table 12.6<br />
Table 12.7<br />
Table 12.8<br />
Table 12.9<br />
Table 12.10<br />
Table 12.11<br />
Summary Statistics <strong>for</strong> U.S. Domestic and International Certificated<br />
Route Air Carriers (Combined Totals), 1970-98 . . . . . . . . . . . . . . .<br />
Summary Statistics <strong>for</strong> General Aviation, 1970-98 . . . . . . . .<br />
Tonnage Statistics <strong>for</strong> Domestic and International Waterborne<br />
Commerce, 1970-98 . . . . . . . . . . . . . . . . . . . . . . . . . . . . . . . . . . . . .<br />
Summary Statistics <strong>for</strong> Domestic Waterborne Commerce, 1970-98<br />
Breakdown of Domestic Marine Cargo by Commodity<br />
Class,1998 . . . . . . . . . . . . . . . . . . . . . . . . . . . . . . . . . . . . . . . . . . . . .<br />
Class I Railroad Freight Systems in the United States<br />
Ranked by Revenue Ton-Miles, 1998 . . . . . . . . . . . . . . . . . . . . .<br />
Summary Statistics <strong>for</strong> Class I Freight Railroads, 1970-98 . . . . . . .<br />
Railroad Revenue Carloads by Commodity Group,<br />
1974and1998 . . . . . . . . . . . . . . . . . . . . . . . . . . . . . . . . . . . . . . . . . . .<br />
Intermodal Rail Traffic, 1965-98 . . . . . . . . . . . . . . . . . . . . . .<br />
Summary Statistics <strong>for</strong> the National Railroad Passenger<br />
Corporation (Amtrak), 197 l-98 . . . . . . . . . . . . . . . . . . . . . . . . . . . .<br />
Summary Statistics <strong>for</strong> Rail Transit Operations, 1970-98 . . . . . . . . .<br />
. . .<br />
. .<br />
. . .<br />
. . . .<br />
. . . .<br />
. . . .<br />
. . .<br />
. . . .<br />
. . . .<br />
. . .<br />
12-2<br />
12-3<br />
124<br />
12-5<br />
12-6<br />
12-7<br />
12-8<br />
12-9<br />
12-10<br />
12-l 1<br />
12-12<br />
APPENDIX A. SOURCES ......................................................... A-l<br />
APPENDIX B. CONVERSIONS .................................................... B-l<br />
APPENDIX C. CENSUS DIVISIONS AND REGIONS ................................. C-l<br />
GLOSSARY ..................................................................... G-l<br />
INDEX ........................................................................... I-l<br />
TRANSPORTA'RON<strong>ENERGY</strong><strong>DATA</strong><strong>BOOK</strong>: <strong>EDITION</strong>~O-<strong>20</strong>00
of them.<br />
FOREWORD<br />
This edition has many new tables and graphs. I would like to draw your attention to several<br />
First, Table 1.1 and Figure 1.1 show an estimate of the total potential <strong>for</strong> fossil fuels. All the<br />
values are expressed in trillion of barrels of oil equivalent (tboe). The table shows that the world has<br />
consumed 0.8 1 tboe of conventional oil since oil was first discovered. The remaining conventional<br />
oil is more than double this amount. The potential <strong>for</strong> other fossil fuels are enormous. Remaining<br />
unconventional oil is about eight times that <strong>for</strong> conventional oil. The amount of conventional and<br />
unconventional natural gas is about four time that <strong>for</strong> conventional oil. The potential <strong>for</strong> coal and<br />
methane hydrates is even higher by a large amount. There is no shortage of fossil fuels, but the U.S.<br />
may need fuels that are renewable, domestic and low in carbon.<br />
Second, in Chapter 6, the scrappage functions have been up-dated.<br />
Third, safety in<strong>for</strong>mation is provided in Tables 7.23 through 7.25. It is seen that occupant<br />
fatalities are down since 1975 and that single vehicle crashes are responsible <strong>for</strong> about 60 percent<br />
as many deaths as multiple vehicle crashes.<br />
Fourth, the heavy truck in<strong>for</strong>mation in Chapter 8 has been enhanced with the addition of<br />
1997 data from the Vehicle Inventory and Use Survey.<br />
I hope you find this edition useful.<br />
<strong>TRANSPORTATION</strong><strong>ENERGY</strong>DA?‘ABOOIC <strong>EDITION</strong>~O-<strong>20</strong>00<br />
xv
ACKNOWLEDGMENTS<br />
I would like to express my gratitude to the many individuals who assisted in the preparation<br />
of this document. First, I would like to thank Phil Patterson and the staff of the Office of<br />
Transportation Technologies (OTT) <strong>for</strong> their continued support of the Transportation Energy Dntn<br />
Book project. I would also like to thank Patricia Hu of Oak Ridge National Laboratory (ORNL) <strong>for</strong><br />
her dedicated leadership of this project. This document benefits from the criticism and careful<br />
review of Phil Patterson, OTT, John Maples, Trancon, Inc., and Alicia Birky of the National<br />
Renewable Energy Laboratory. I would also like to thank Robert Gibson, University of Tennessee,<br />
<strong>for</strong> the emission standard tables; Jamie Payne, ORNL, who designed the cover; Sherry Campbell<br />
Gambrell, ORNL, who prepared the title index; and Bob Boundy, Q Systems, who assisted in a<br />
variety of ways. Finally, this book would not have been possible without the dedication of Debbie<br />
Bain, ORNL, who masterfully prepared the manuscript.<br />
<strong>TRANSPORTATION</strong><strong>ENERGY</strong><strong>DATA</strong>BOOIC <strong>EDITION</strong>~O-<strong>20</strong>00<br />
xvii
ABSTRACT<br />
The Transportation Energy Data Book: Edition <strong>20</strong> is a statistical compendium prepared and<br />
published by Oak Ridge National Laboratory (ORNL) under contract with the Office of<br />
Transportation Technologies in the Department of Energy (DOE). Designed <strong>for</strong> use as a desk-top<br />
reference, the data book represents an assembly and display of statistics and in<strong>for</strong>mation that<br />
characterize transportation activity, and presents data on other factors that influence transportation<br />
energy use. The purpose of this document is to present relevant statistical data in the <strong>for</strong>m of tables<br />
and graphs. The latest editions of the Data Book are available to a larger audience via the Internet<br />
(www-cta.ornl.gov/data/tedb.htm).<br />
This edition of the Data Book has 12 chapters which focus on various aspects of the<br />
transportation industry. Chapter 1 focuses on petroleum; Chapter 2 - energy; Chapter 3 -<br />
greenhouse gas emissions; Chapter 4 - criteria pollutant emissions; Chapter 5 -transportation and<br />
the economy; Chapter 6 -highway vehicles; Chapter 7 - light vehicles; Chapter 8 -heavy vehicles;<br />
Chapter 9 - alternative fuel vehicles; Chapter 10 - fleet vehicles; Chapter 1 1 - household vehicles;<br />
and Chapter 12- nonhighway modes. The sources used represent the latest available data. There are<br />
also three appendices which include detailed source in<strong>for</strong>mation <strong>for</strong> some tables, measures of<br />
conversion, and the definition of Census divisions and regions. A glossary of terms and a title index<br />
are also included <strong>for</strong> the readers convenience.<br />
<strong>TRANSPORTATION</strong><strong>ENERGY</strong><strong>DATA</strong>BOOIC <strong>EDITION</strong>~O-<strong>20</strong>00<br />
xix
INTRODUCTION<br />
In January 1976, the Transportation Energy Conservation (TEC) Division of the Energy<br />
Research and Development Administration contracted with Oak Ridge National Laboratory (ORNL)<br />
to prepare a Transportation Energy Conservation Data Book to be used by TEC staff in their<br />
evaluation of current and proposed conservation strategies. The major purposes of the data book<br />
were to draw together, under one cover, transportation data from diverse sources, to resolve data<br />
conflicts and inconsistencies, and to produce a comprehensive document. The first edition of the<br />
TEC Data Book was published in October 1976. With the passage of the Department of Energy<br />
(DOE) Organization Act, the work being conducted by the <strong>for</strong>mer Transportation Energy<br />
Conservation Division fell under the purview of the DOE’s Office of Transportation Programs (now<br />
the Office of Transportation Technologies). DOE, through the Office of Transportation<br />
Technologies, has supported the compilation of Editions 3 through <strong>20</strong>.<br />
Policymakers and analysts need to be well-in<strong>for</strong>med about activity in the transportation sector.<br />
The organization and scope of the data book reflect the need <strong>for</strong> different kinds of in<strong>for</strong>mation. For<br />
this reason, Edition <strong>20</strong> updates much of the same type of data that is found in previous editions.<br />
In any attempt to compile a comprehensive set of statistics on transportation activity, numerous<br />
instances of inadequacies and inaccuracies ?n the basic data are encountered. Where such problems<br />
occur, estimates are developed by ORNL. To minimize the misuse of these statistics, an appendix<br />
(Appendix A) is included to document the estimation procedures. The attempt is to provide<br />
sufficient in<strong>for</strong>mation <strong>for</strong> the conscientious user to evaluate the estimates and to <strong>for</strong>m their own<br />
opinions as to their utility. Clearly, the kcuracy of the estimates camlot exceed the accuracy of the<br />
primary data, an accuracy which in most instances is unknown. In cases where data accuracy is<br />
known or substantial errors are strongly suspected in the data, the reader is alerted. In all cases it<br />
should be recognized that the estimates are not precise.<br />
The majority of the statistics contained in the data book are taken directly from published<br />
sources, although these data may be re<strong>for</strong>matted <strong>for</strong> presentation by ORNL. Consequently, neither<br />
ORNL nor DOE endorses the validity of these data.<br />
<strong>TRANSPORTATION</strong> <strong>ENERGY</strong> <strong>DATA</strong> <strong>BOOK</strong>: <strong>EDITION</strong> <strong>20</strong>-<strong>20</strong>00<br />
xxi
Source<br />
Table 1.2<br />
Table 1.3<br />
Chapter 1<br />
Petroleum<br />
Summary Statistics from Tables/Figures in this Chapter<br />
World Oil Production, 1998<br />
U.S. Oil Production (million barrels per day)<br />
U.S. Share<br />
World Oil Consumption, 1997<br />
U.S. Oil Consumption (million barrels per day)<br />
U.S. Share<br />
6.2<br />
9.3%<br />
18.6<br />
25.5%<br />
Figure 1.2 Refinery yield, 1999 OECD North<br />
Europe America<br />
Gasoline 21.3% 40.8%<br />
Diesel fuel 34.9% 22.0%<br />
Residual fuel 17.0% 7.6%<br />
Kerosene 6.7% 8.9%<br />
Other <strong>20</strong>.1% <strong>20</strong>.7%<br />
Table 1.9 U.S. transportation oil use as a percent of U.S. oil production, 1999 146%<br />
Table 1.9 Net imports as a percentage of U.S. oil consumption, 1999 50%<br />
Table 1.10 Transportation share of oil consumption, 1999 67%<br />
<strong>TRANSPORTATION</strong> <strong>ENERGY</strong> <strong>DATA</strong> <strong>BOOK</strong>: <strong>EDITION</strong> <strong>20</strong>-<strong>20</strong>00<br />
l-l
l-2<br />
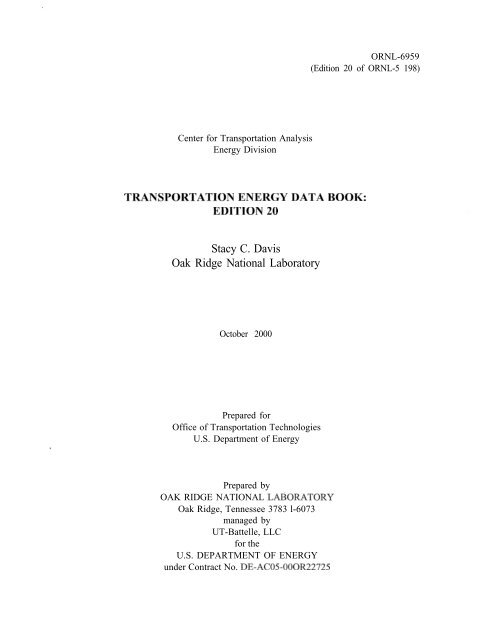
Although the world has consumed about one-third of estimated conventional oil resources, the total fossil fuel<br />
potential is huge. Methane hydrates-u potential source qf natural gas-are not shown in the graph below, but<br />
constitute the largest resource at 137.5 trillion barrels of oil equivalent.<br />
Oil<br />
Use to Date<br />
Conventional<br />
Unconventional<br />
Natural Gas<br />
Conventional<br />
Unconventional<br />
Table 1.1<br />
World Fossil Fuel Potential<br />
(trillion barrels of oil equivalent)<br />
Oil Reserves Resources<br />
0.81<br />
Additional<br />
occurrences<br />
1.10 1.06 0.00<br />
1.34 2.46 13.37<br />
1.03 2.05 0.00<br />
1.41 1.89 2.84<br />
Methane hydrates 0.00 0.00 137.50<br />
Coal 7.35 17.57 <strong>20</strong>.86<br />
Source:<br />
H.H. Rogner, “An Assessment of World Hydrocarbon Resources,” Annual Review of Energy<br />
and Environment, 1997, p. 249.<br />
”<br />
Source:<br />
See Table 1.1.<br />
Figure 1.1. World Fossil Fuel Potential<br />
fg Additional occurances Resources 0 Reserves w Oil<br />
Oil use Conv. oil Unconv. oil Conv. NG Unconv. NG Coal<br />
<strong>TRANSPORTATION</strong> <strong>ENERGY</strong> <strong>DATA</strong> <strong>BOOK</strong>: <strong>EDITION</strong> <strong>20</strong>-<strong>20</strong>00
Table 1.2<br />
World Crude Oil Production, 1960-98”<br />
(million barrels per day)<br />
Total Persian<br />
United U.S. Total OPEC OPEC +’ Non- Gulf<br />
Year States Share OPEC” Share OPEC +’ Share OPEC nation@ World<br />
1960 7.04 33.5% 8.70 41.4% 12.25 58.3% 12.29 5.27 <strong>20</strong>.99<br />
1965 7.80 25.7% 14.35 47.3% 19.83 65.4% 15.98 8.37 30.33<br />
1970 9.64 21.0% 23.30 50.8% 31.16 67.9% 22.59 13.39 45.89<br />
1971 9.46 19.5% 25.21 52.0% 33.58 69.2% 23.31 15.77 48.52<br />
1972 9.44 18.5% 26.89 52.6% 35.69 69.8% 24.25 17.54 51.14<br />
1973 9.21 16.5% 30.63 55.0% 39.82 71.5% 25.05 <strong>20</strong>.67 55.68<br />
1974 8.77 15.7% 30.35 54.5% 40.24 72.2% 25.37 21.28 55.72<br />
1975 8.37 15.8% 26.77 50.7% 37.56 71.1% 26.06 18.93 52.83<br />
1976 8.13 14.2% 30.33 52.9% 41.87 73.0% 27.01 21.51 57.34<br />
1977 8.24 13.8% 30.89 51.7% 43.09 72.2% 28.82 21.73 59.71<br />
1978 8.71 14.5% 29.46 49.0% 42.46 70.6% 30.70 <strong>20</strong>.61 60.16<br />
1979 8.55 13.6% 30.58 48.8% 44.12 70.4% 32.09 21.07 62.67<br />
1980 8.60 14.4% 26.61 44.6% 41.07 68.9% 32.99 17.96 59.60<br />
1981 8.57 15.3% 22.48 40.1% 37.46 66.8% 33.60 15.25 56.08<br />
1982 8.65 16.2% 18.78 35.1% 34.28 64.1% 34.70 12.16 53.48<br />
1983 8.69 16.3% 17.50 32.9% 33.15 62.2% 35.76 11.08 53.26<br />
1984 8.88 16.3% 17.44 32.0% 33.19 60.9% 37.05 10.78 54.49<br />
1985 8.97 16.6% 16.18 30.0% 31.81 58.9% 37.80 9.63 53.98<br />
1986 8.68 15.4% 18.28 32.5% 34.05 60.6% 37.95 11.70 56.23<br />
1987 8.35 14.7% 18.52 32.7% 34.72 61.3% 38.15 12.10 56.67<br />
1988 8.14 13.9% <strong>20</strong>.32 34.6% 36.66 62.4% 38.42 13.46 58.74<br />
1989 7.61 12.7% 22.07 36.9% 38.50 64.3% 37.79 14.84 59.86<br />
1990 7.36 12.2% 23.<strong>20</strong> 38.3% 39.12 64.6% 37.37 15.28 60.57<br />
1991 7.42 12.3% 23.27 38.6% 38.53 64.0% 36.94 14.74 60.21<br />
1992 7.17 11.9% 24.40 40.5% 37.67 62.6% 35.81 15.97 60.21<br />
1993 6.85 11.4% 25.12 41.7% 37.65 62.5% 35.12 16.71 60.24<br />
1994 6.66 10.9% 25.51 41.8% 37.67 61.8% 35.48 16.96 60.99<br />
1995 6.56 10.5% 26.00 41.7% 38.24 61.4% 36.33 17.21 62.33<br />
1996 6.46 10.1% 26.76 41.8% 39.45 61.6% 37.29 17.37 64.05<br />
1997 6.45 9.7% 28.36 42.8% 41.31 62.3% 37.96 18.50 66.32<br />
1998 6.24 9.3% 28.76 43.0% 41.69 62.3% 38.11 19.33 66.87<br />
1960-98 -0.3%<br />
3.2%<br />
Average annual percentage change<br />
3.3% 3.0% 3.5% 3.1%<br />
1970-98 -1.5%<br />
0.8%<br />
1.0% 1.9% 1.3% 1.4%<br />
1988-98 -2.6%<br />
3.5%<br />
1.3% -0.1% 3.7% 1.3%<br />
Source:<br />
U.S. Department of Energy, Energy In<strong>for</strong>mation Administration, Annual Energy Review 1998,<br />
Washington, DC, July 1999, Table 11.4.<br />
“Includes lease condensate. Excludes natural gas plant liquids.<br />
“Organization of Petroleum Exporting Countries. See Glossary <strong>for</strong> membership.<br />
“OPEC includes all OPEC nations plus Russia, Mexico, Norway and Oman.<br />
LISee Glossary <strong>for</strong> Persian Gulf nations.<br />
<strong>TRANSPORTATION</strong><strong>ENERGY</strong><strong>DATA</strong>BOOIC <strong>EDITION</strong>~O-<strong>20</strong>00<br />
l-3
l-4<br />
These data are the latest available; oil consumption data general&lugs behindproduction data (previous<br />
table) by one year.<br />
Year<br />
1960<br />
1965<br />
1970<br />
1971<br />
1972<br />
1973<br />
1974<br />
1975<br />
1976<br />
1977<br />
1978<br />
1979<br />
1980<br />
1981<br />
1982<br />
1983<br />
1984<br />
1985<br />
1986<br />
1987<br />
1988<br />
1989<br />
1990<br />
1991<br />
1992<br />
1993<br />
1994<br />
1995<br />
1996<br />
1997<br />
1960-97 1.7%<br />
1970-97 0.9%<br />
1987-97 1.1%<br />
Table 1.3<br />
World Oil Consumption, 1960-97<br />
(million barrels per day)<br />
United U.S.<br />
States Share<br />
9.80 45.9%<br />
11.51<br />
14.70<br />
15.21<br />
16.37<br />
17.31<br />
16.65<br />
16.32<br />
17.46<br />
18.43<br />
18.85<br />
18.51<br />
17.06<br />
16.06<br />
15.30<br />
15.23<br />
15.73<br />
15.73<br />
16.28<br />
16.67<br />
17.28<br />
17.33<br />
16.99<br />
16.71<br />
17.03<br />
17.24<br />
17.72<br />
17.72<br />
18.31<br />
18.62<br />
Total<br />
Non-OECD<br />
5.56<br />
Total OECD”<br />
World<br />
15.78<br />
21.34<br />
37.0% 22.81 8.33 31.14<br />
31.4% 34.49 12.32 46.81<br />
30.8% 36.07 13.35 49.42<br />
30.8% 38.74 14.35 53.09<br />
30.2% 41.53 15.71 57.24<br />
29.4% 40.12 16.56 56.68<br />
29.0% 38.82 17.38 56.<strong>20</strong><br />
29.3% 41.39 18.28 59.67<br />
29.8% 42.43 19.40 61.83<br />
29.4% 43.62 <strong>20</strong>.54 64.16<br />
28.4% 44.01 21.21 65.22<br />
27.0% 41.41 21.66 63.07<br />
26.4% 39.14 21.76 60.90<br />
25.7% 37.45 22.05 59.50<br />
25.9% 36.59 22.15 58.74<br />
26.3% 37.43 22.41 59.84<br />
26.2% 37.23 22.87 60.10<br />
26.4% 38.28 23.48 61.76<br />
26.5% 38.96 24.04 63.00<br />
26.7% 40.24 24.58 64.82<br />
26.3% 40.88 25.04 65.92<br />
25.8% 40.92 25.06 65.98<br />
25.1% 41.40 25.17 66.57<br />
25.5% 42.41 24.33 66.74<br />
25.7% 42.98 24.01 66.99<br />
25.9% 44.17 24.13 68.30<br />
25.4% 44.95 24.94 69.89<br />
25.7% 46.07 25.25 71.32<br />
25.5% 46.67 26.34 73.01<br />
Average annual percentage change<br />
3.0% 4.3% 3.4%<br />
i.l% 2.9% 1.7%<br />
1.8% 0.9% 1.5%<br />
Source:<br />
U.S. Department of Energy, Energy In<strong>for</strong>mation Administration, Annual Energy Review<br />
f998, Washington, DC, July 1999, Table 11.9.<br />
3. Organization <strong>for</strong> Economic Cooperation and Development. See Glossary <strong>for</strong> membership.<br />
<strong>TRANSPORTATION</strong> <strong>ENERGY</strong> <strong>DATA</strong> <strong>BOOK</strong>: <strong>EDITION</strong> <strong>20</strong>-<strong>20</strong>00
I<br />
The UnitedStates has increased its petroleum stocks by 55%ji-om 1973 to 1984; there has been no signzficantchange in the stocks since 1984. Petroleum<br />
demand, however, has increased 87% in that same time period (see Table 1.3). T?ze Strategic Petroleum Reserve accounted<strong>for</strong> 35% of total U.S. stocks<br />
at the end of 1998.<br />
Table 1.4<br />
Petroleum Stocks in OECD Countries, End of Year 1973-98”<br />
(million barrels)<br />
Other U.S. Strategic<br />
United OECD” OECD” Petroleum<br />
United<br />
States Other<br />
Year France Genmnyb Italy Kingdom Europe Europe Canada Japan Reserve total OECDd OECD”<br />
1973 <strong>20</strong>1 181<br />
187<br />
152 143 156 165 434 380 1,070<br />
140 174 303 375 e<br />
1,008 67 2,588<br />
1975 1980 225 243 319 170 168 564 1,154 1,464 164 495 108 1,133 1,392 72 2,903 3,587<br />
1981 214 297 167 143 516 1,337 161 482 230 1,484 67 3,531<br />
1982 193 272 179 125 489 1,258 136 484 294 1,430 68 3,376<br />
1983 153 249 149 118 473 1,142 121 470 379 1,454 68 3,255<br />
1984 152 239 159 112 468 1,130 128 479 451 1,556 69 3,362<br />
1985 139 233 157 123 440 1,092 113 494 493 1,519 66 3,284<br />
1986 127 252 155 124 475 1,133 111 509 512 1,593 72 3,418<br />
1987 127 259 169 121 454 1,130 126 540 541 1,607 71 3,474<br />
1988 140 266 155 112 445<br />
116 538 560<br />
71 3,440<br />
1989 138 271 164 118 442 1,118 1,133 114 577 580 1,597 1,581 71 3,476<br />
1990 140 265 172 112 474 la163 121 590 586 1,621 73 3,568<br />
1991 153 146 288 310 160 174 119 113 461 476 1,181 119 107 606 603 569 575 1,617 65 67 3,588<br />
1992 1,219 1,592 3,588<br />
1993 158 309 163 118 475 1,221 105 618 587 1,647 69 3,661<br />
1994 158 312 164 115 490 1,240 119 645 592 1,653 69 3,726<br />
107 499 109 630 592 71<br />
1995 1996 159 158 301 300 162 152 108 538 1,228 1,256 103 651 566 1,563 1,507 74 3,601 3,591<br />
1997 164 298 147 105 542 1,256 115 685 563 1,560 74 3,689<br />
1998 161 321 153 108 561 1,304 118 649 571 1,647 66 3,784<br />
1973-9s -0.9% 2.3% 0.0% -1.5%<br />
Average annual percentage change<br />
1.6% 0.8% -0.7% 3.1%<br />
e<br />
2.0% -0.1% 1.5%<br />
1988-98<br />
Source:<br />
1.4% 1.9% -0.1% -0.4% 2.3% 1.6% 0.2% 1.9% 0.2% 0.3% -0.7% 1.0%<br />
Country stocks - U.S. Department of Energy, Energy In<strong>for</strong>mation Administration, International Petroleum Statistics Report, Washington, DC, January <strong>20</strong>00, Table 4.5.<br />
U.S. Strategic Petroleum Reserve - U.S. Department of Energy, Energy In<strong>for</strong>mation Administration, Arz7zual Energy Review, 1998, Washington, DC, July 1999,<br />
Table 5.15.<br />
a Includes crude oil (including strategic reserves), lease condensate, natural gas plant liquids, unfinished oils, and finished petroleum products. Oil stocks include all<br />
non-military stocks held by importers, refiners, Governments, major non-importing final consumers and by <strong>for</strong>eign entities in certain facilities. See Stocks in Glossary <strong>for</strong> details.<br />
b Through 1990, the data <strong>for</strong> Germany are <strong>for</strong> the <strong>for</strong>mer West Germany only. Beginning in 199 1, the data <strong>for</strong> Germany are <strong>for</strong> the unified Germany, i.e., the <strong>for</strong>mer<br />
East Germany and West Germany.<br />
’ Organization <strong>for</strong> Economic Cooperation and Development (OECD). See Glossary <strong>for</strong> membership.<br />
d Australia, New Zealand, and United States Territories. Data <strong>for</strong> Mexico, which joined the OECD on May 18, 1994, are not available.<br />
e Data are not available. The Energy Policy and Conservation Act, effective February 1976, authorized the establishment of the U.S. Strategic Petroleum Reserve.<br />
x
600<br />
0<br />
Figure 1.2. Crude Oil Prices, 1870-98<br />
1870 1890 1910 1930 1950 1970 1990<br />
Source:<br />
Santini, Danilo J., “An Assessment of Oil Supply and Its Implications <strong>for</strong> Future Prices,” Norzrenewable Resources, Vol. 7, No. 2, 1998, pp. 101-121, and<br />
1994-98 data update.<br />
x
I<br />
The share ofpetroleum imported to the U.S. can be calculated using total imports or net imports. Net imports, which is the<br />
prtzferred data, rose to 50% of U.S. petroleum consumption <strong>for</strong> the first time in 1998 (see Table 1.9), while total imports<br />
reached 50% <strong>for</strong> the$rst time in 1993. OPEC share of net imports has been around 50-@/o<strong>for</strong> the last ten years.<br />
Table 1.5<br />
U.S. Petroleum Net Imports by World Region of Origin, 1960-98<br />
(thousand barrels per day)<br />
Net Total OPEC Persian Gulf Persian Gulf<br />
Year imports OPEC” share nations” share<br />
1960 1,613<br />
1965 2,28 1<br />
1970 3,161<br />
1971 3,701<br />
1972 4,519<br />
1973 6,025<br />
1974 5,892<br />
1975 5,846<br />
1976 7,090<br />
1977 8,565<br />
1978 8,002<br />
1979 7,985<br />
1980 6,365<br />
1981 5,401<br />
1982 4,298<br />
1983 4,312<br />
1984 4,715<br />
1985 4,286<br />
1986 5,439<br />
1987 5,914<br />
1988 6,587<br />
1989 7,<strong>20</strong>2<br />
1990 7,161<br />
1991 6,626<br />
1992 6,938<br />
1993 7,618<br />
1994 8,054<br />
1995 7,886<br />
1996 8,498<br />
1997 9,158<br />
1998 9,452<br />
1,311 81.3% c<br />
1,475 64.7% c<br />
1,343 42.5% c<br />
1,671 45.2% c<br />
2,061 45.6% c<br />
2,991 49.6% c<br />
3,277 55.6% c<br />
3,599 61.6% c<br />
5,063 71.4% c<br />
6,190 72.3% c<br />
5,747 71.8% c<br />
5,633 70.5% c<br />
4,293 67.5% c<br />
3,315 61.4% 1,215<br />
22.5%<br />
2,136 49.7% 692<br />
16.1%<br />
1,843 42.7% 439<br />
10.2%<br />
2,037 43.2% 502<br />
10.6%<br />
1,821 42.5% 309<br />
7.2%<br />
2,828 52.0% 909<br />
16.7%<br />
3,055 51.7% 1,074<br />
18.2%<br />
3,513 53.3% 1,529<br />
23.2%<br />
4,124 57.3% 1,858<br />
25.8%<br />
4,285 59.8% 1,962<br />
27.4%<br />
4,065 61.3% 1,833<br />
27.7%<br />
4,071 58.7% 1,773<br />
25.6%<br />
4,253 55.8% 1,774<br />
23.3%<br />
4,233 52.6% 1,723<br />
21.4%<br />
3,980 50.5% 1,563<br />
19.8%<br />
4,193 49.3% 1,596<br />
18.8%<br />
4,542 49.6% 1,747<br />
19.1%<br />
4,789 50.7% 2,091<br />
22.1%<br />
Average annualpercentage change<br />
1960-98 4.8%<br />
3.5%<br />
c<br />
1970-98 4.0%<br />
4.6%<br />
c<br />
1988-98<br />
Source:<br />
3.7%<br />
3.1% 3.2%<br />
U.S. Department of Energy, Energy In<strong>for</strong>mation Administration, Annual Energy Review 1998, Washington, DC,<br />
July 1999, Table 5.7.<br />
” Organization of Petroleum Exporting Countries. See Glossary <strong>for</strong> membership.<br />
b See Glossary <strong>for</strong> Persian Gulf nations.<br />
’ Data are not available.<br />
<strong>TRANSPORTATION</strong> <strong>ENERGY</strong> <strong>DATA</strong> <strong>BOOK</strong>: <strong>EDITION</strong> <strong>20</strong>-<strong>20</strong>00<br />
c<br />
c<br />
c<br />
c<br />
c<br />
c<br />
c<br />
c<br />
c<br />
c<br />
c<br />
c<br />
c<br />
l-7<br />
?!a<br />
I
1-8<br />
Estimates of I996 military expemlitures <strong>for</strong> defending oil supplies in the Middle East range from $6 to $60 billion<br />
per year. This wide range in estimates reflects the difjficulty in assigning a precise figure to the military cost of<br />
defending the U.S. interests in the Middle East. The two main reasons <strong>for</strong> the d&liculty are I) the Department of<br />
Defense does not divide the budget into regional defense sectors ancE 2) it is dtfjjcult to determine how much of the<br />
cost is attributable to defemling Persian Gulf oil.<br />
Table 1.6<br />
Summary of 1996 Military Expenditures <strong>for</strong> Defending Oil Supplies from the Middle East<br />
Original estimates Year of<br />
Source (billion dollars) original estimate<br />
General Accounting Office [I] $33 1990<br />
Congressional Research Service [2] $6.4 1990<br />
Greene and Leiby [3] $14.3 1990<br />
Ravenal [4] $50 1992<br />
Kaufmann and Steinbruner [ 51 $64.5 1990<br />
Delucchi and Murphy” [6] $<strong>20</strong>-40 1996<br />
Average estimate is $32 billion, with a standard deviation of $22 billion.<br />
[l] U.S. General Accounting Offices, Southwest Asia: Cost of Protecting U.S. Interests,<br />
GAO/NSIAD-91-250, Washington, DC, August 1991.<br />
1996 estimate<br />
(constant 1996<br />
billion dollars)<br />
$28”<br />
$6”<br />
$12”<br />
$60”<br />
$55”<br />
$<strong>20</strong>-40”<br />
[2] Congressional Research Service, The External Costs of Oil Used in Transportation, prepared <strong>for</strong><br />
the U.S. Alternative Fuels Council, Washington, DC, June 1992.<br />
[3] Greene, D.L., and P. Leiby, The Social Costs to the U.S. ofMonopolization of the World Oil<br />
Market, 1972- 199 1, ORNL-6744, Oak Ridge National Laboratory, Oak Ridge, TN, March 1993.<br />
[4] Ravenal, E.C., Designing Defense <strong>for</strong> a New World Order: The Military Budget in 1992 and<br />
Beyond, Cato Institute, Washington, DC, 1991.<br />
[5] Kaufmamr, W.W., and J.D. Steinbruner, Decisions <strong>for</strong> Defense: Prospects <strong>for</strong> a New Orcler, The<br />
Brookings Institution, Washington, DC, 199 1.<br />
[6] Delucchi, M.A., and J. Murphy, US. Military Expenclitures to Protect the Use of Persian-Gulf Oil<br />
<strong>for</strong> Motor Vehicles, UCD-ITS-RR-96-3 (15) University of Cali<strong>for</strong>nia, Davis, Cali<strong>for</strong>nia, April<br />
1996.<br />
Source:<br />
Hu, P.S., “Estimates of 1996 U.S. Military Expenditures on Defending Oil Supplies from the Middle<br />
East: A Literature Review,” Oak Ridge National Laboratory, Oak Ridge, TN, March 1996.<br />
“Estimated based on a 3% annual inflation rate and a decrease of 30% in the total Defense budget from<br />
1990 to 1996.<br />
“Provided by the author(s); thus, assumptions used <strong>for</strong> the projection are different from those used in the<br />
other estimates.<br />
“Annual cost to defend all U.S. interests in the Persian Gulf.<br />
<strong>TRANSPORTATION</strong> <strong>ENERGY</strong> <strong>DATA</strong> <strong>BOOK</strong>: EDI’IXON <strong>20</strong>-<strong>20</strong>00
100<br />
90<br />
80<br />
70<br />
60<br />
50<br />
40<br />
30<br />
<strong>20</strong><br />
IO<br />
0<br />
North America<br />
Figure 1.3. Refinery Gross Output by World Region, 1999<br />
34,9<br />
OECD Europe c<br />
International Energy Agency, Monthly Oil Suwey, January <strong>20</strong>00, Paris, France, Table 7.<br />
28.1<br />
a Includes jet kerosene and other kerosene.<br />
b Includes motor gasoline, jet gasoline, and aviation gasoline.<br />
’ Organization <strong>for</strong> Economic Cooperation and Development. See Glossary <strong>for</strong> membership.<br />
27.6<br />
OECD PacificC Total OECDC<br />
Other produlcts<br />
Residual fuel oil<br />
Diesel oil<br />
Total keroserle a<br />
Total gasoline b<br />
Naptha<br />
LPG
5<br />
=I<br />
s<br />
I Oxygenate<br />
refinery input increased signijkantly in 1995, most certainly due to the Clean Air Act Amendments of 1990 which mandated the sale of<br />
re<strong>for</strong>mulated gasoline in certain areas beginning in January 1995.<br />
Year Crude oil<br />
1987<br />
1988<br />
1989<br />
1990<br />
1991<br />
1992<br />
1993<br />
1994<br />
1995<br />
1996<br />
1997<br />
1988-98<br />
Natural gas<br />
liquids<br />
Table 1.7<br />
U.S. Refinery Input of Crude Oil and Petroleum Products, 1987-98<br />
(thousand barrels)<br />
Fuel<br />
ethanol<br />
4,691,783 280,889 d<br />
4,848,175 304,566 d<br />
4,891,381 182,109 d<br />
4,894,379 170,589 d<br />
4,855,016 172,306 d<br />
4,908,603 171,701 d<br />
4,968,641 179,213 3,351<br />
5,061,111 169,868 3,6<strong>20</strong><br />
5,100,317 172,026 9,055<br />
5,195,265 164,552 11,156<br />
5,35 1,466 151,769 11,803<br />
5,434,383 146,921 11,722<br />
1.3% -5.7%<br />
e<br />
Oxygenates<br />
Methanol MTBE”<br />
Other<br />
oxygenatesb<br />
d d d<br />
d d d<br />
d d d<br />
d d d<br />
d d d<br />
d d d<br />
782 49,393 1,084<br />
242 52,937 1,676<br />
246 79,396 3,876<br />
126 79,407 3,444<br />
496 86,240 3,750<br />
675 89,362 3,363<br />
Average annualpercentage change<br />
e e e<br />
Other<br />
hydrocarbons” Other liquids<br />
1993-98<br />
Source:<br />
1.8% -3.9% 28.5% -2.9% 12.6% 25.4%<br />
7.9%<br />
-7.1%<br />
U.S. Department of Energy, Energy In<strong>for</strong>mation Administration, Petroleum Supply Annual, 1998, Vol. 1, June 1999, Table 16, and annual.<br />
(Additional resources: www.eia.doe.gov)<br />
Total input to<br />
refineries<br />
23,304 2<strong>20</strong>,296 5,105,392<br />
19,515 <strong>20</strong>3,794 5,258,386<br />
21,757 <strong>20</strong>2,040 5,297,287<br />
28,642 231,466 5,325,076<br />
31,574 248,691 5,307,587<br />
47,918 224,758 5,352,980<br />
15,543 264,53 1 5,482,538<br />
14,130 179,678 5,483,262<br />
14,668 175,743 5,555,327<br />
<strong>20</strong>,587 193,695 5,668,232<br />
22,976 178,292 5,806,792<br />
22,759 183,376 5,892,561<br />
“Methyl tertiary butyl ether (MTBE).<br />
bIncludes ethyl tertiary butyl ether (ETBE), tertiary amyl methyl ether (TAME), tertiary butyl alcohol (TBA), and other aliphatic alcohols and ethers<br />
intended <strong>for</strong> motor gasoline blending.<br />
‘For 1987-92, includes other hydrocarbons/hydrogen/oxygenates. For 1993-on, includes other hydrocarbons/hydrogen.<br />
dReported in “Other hydrocarbons” category in this year.<br />
‘Data are not available.<br />
-0.2%<br />
-1.7%<br />
1.3%<br />
1.5%
I When<br />
crude oil and other hydrocarbons are processed into products that are, on average, less<br />
dense than the input, a processing volume gain occurs. Due to this gain, the product yield from<br />
a barrel of crude oil is more than 100%. The processing volume gain has been growing over the<br />
years.<br />
Year<br />
Table 1.8<br />
Refinery Yield of Petroleum Products from a Barrel of Crude Oil, 1978-98<br />
(percentage)<br />
Motor Distillate<br />
gasoline fuel oil Jet fuel<br />
1978 44.1 21.4<br />
1979 43.0 21.5<br />
1980 44.5 19.7<br />
1981 44.8 <strong>20</strong>.5<br />
1982 46.4 21.5<br />
1983 47.6 <strong>20</strong>.5<br />
1984 46.7 21.5<br />
1985 45.6 21.6<br />
1986 45.7 21.2<br />
1987 46.4 <strong>20</strong>.5<br />
1988 46.0 <strong>20</strong>.8<br />
1989 45.7 <strong>20</strong>.8<br />
1990 45.6 <strong>20</strong>.9<br />
1991 45.7 21.3<br />
1992 46.0 21.2<br />
1993 46.1 21.9<br />
1994 45.5 22.3<br />
1995 46.4 21.8<br />
1996 45.7 22.7<br />
1997 45.7 22.5<br />
1998 46.2 22.3<br />
6.6<br />
6.9<br />
7.4<br />
7.6<br />
8.1<br />
8.5<br />
9.1<br />
9.6<br />
9.8<br />
0.0<br />
0.0<br />
0.1<br />
Liquified<br />
petroleum gas Other” Total”<br />
2.3<br />
2.3<br />
2.4<br />
2.4<br />
2.2<br />
2.7<br />
2.9<br />
3.1<br />
3.2<br />
3.4<br />
3.6<br />
4.0<br />
3.6<br />
3.8<br />
4.3<br />
4.1<br />
4.2<br />
4.5<br />
4.5<br />
4.6<br />
4.4<br />
29.6 104.0<br />
30.3 104.0<br />
30.0 104.0<br />
28.7 _ 104.0<br />
26.2 104.4<br />
24.8 104.1<br />
24.2 104.4<br />
24.6 104.5<br />
24.8 104.7<br />
24.5 104.8<br />
24.4 104.8<br />
24.2 104.8<br />
24.1 104.9<br />
24.1 105.2<br />
24.0 105.4<br />
23.3 105.4<br />
23.2 105.3<br />
22.9 105.3<br />
22.4 105.7<br />
22.5 105.6<br />
22.5 105.8<br />
Source:<br />
Department of Energy, Energy In<strong>for</strong>mation Administration, Petroleum Supply Annual 1998, Vol. 1,<br />
June 1999, Table 19 and annual. (Additional resources: www.eia.doe.gov)<br />
3. Includes aviation gasoline, kerosene, naphtha and other oils <strong>for</strong> petrochemical feedstock use, special<br />
naphthas, lubricants, waxes, petroleum coke, asphalt and road oil, still gas, and miscellaneous products.<br />
b Products sum greater than 100% due to processing gain. The processing gain <strong>for</strong> years 1978 to 1980 is<br />
assumed to be 4%.<br />
I<br />
( l-11
Table 1.9<br />
United States Petroleum Production and Consumption, 1973-99<br />
(million barrels per day)<br />
Net imports as U.S. petroleum Transportation<br />
Net imports Exports<br />
U.S. World<br />
a percentage<br />
of U.S.<br />
consumption as a<br />
percentage<br />
petroleum use<br />
as a percentage<br />
Crude Petroleum Petroleum petroleum petroleum petroleum of world of domestic<br />
oil products Total Crude oil products consumption” consumption consumption consumption productior?<br />
Year<br />
Domestic<br />
crude oil<br />
production<br />
1973 9.21 3.24 2.78 6.03 0.00 0.23<br />
17.31 56.39 34.8%<br />
30.7%<br />
1974 8.77 3.47 2.42 5.89 0.00 0.22<br />
16.65<br />
55.91<br />
35.4%<br />
29.8%<br />
1975 8.37 4.10 1.75 5.85 0.00 0.<strong>20</strong><br />
16.32<br />
55.48<br />
35.8%<br />
29.4%<br />
1976 8.13 5.28 1.81 7.09 0.00 0.22<br />
17.46 58.74 40.6%<br />
29.7%<br />
1977 8.25 6.57 2.00 8.57 0.05 0.19<br />
18.43<br />
61.63 46.5%<br />
29.9%<br />
1978 8.71 6.<strong>20</strong> 1.80 8.00 0.16 0.<strong>20</strong><br />
18.85 63.30 42.5%<br />
29.8%<br />
e 1979 8.55 6.28 1.70 7.99 0.24 0.24<br />
18.51 65.17 43.1%<br />
28.4%<br />
E 1980 8.60 4.98 1.39 6.37 0.29 0.26<br />
17.06<br />
63.07<br />
37.3%<br />
27.0%<br />
2 1981 8.57 4.17 1.23 5.40 0.23 0.37<br />
16.06<br />
60.87<br />
33.6%<br />
26.4%<br />
z 1982 8.65 3.25 1.05 4.30 0.24 0.58<br />
15.30 59.50 28.1%<br />
25.7%<br />
2 1983 8.69 3.17 1.15 4.31 0.16 0.58<br />
15.23 58.74 28.3%<br />
25.9%<br />
k2 1984 8.88 3.25 1.47 4.72 0.18 0.54<br />
15.73 59.84 30.0%<br />
26.3%<br />
E 1985 8.97 3.00 1.29 4.29 0.<strong>20</strong> 0.58<br />
15.73 60.10 27.3%<br />
26.2%<br />
2 1986 8.68 4.02 1.41 5.44 0.15 0.63<br />
16.28 61.76 33.4%<br />
26.4%<br />
Y 1988 1987 8.35 4.52 1.39 5.91 0.15 0.61<br />
16.67 63.00 35.5%<br />
26.5%<br />
8.14 4.95 1.63 6.59 0.16 0.66<br />
17.28<br />
64.82<br />
38.1%<br />
26.7%<br />
2 1989 7.61 5.70 1.50 7.<strong>20</strong> 0.14 0.72<br />
17.33<br />
65.92 41.6%<br />
26.3%<br />
7.36 4.79 1.38 7.16 0.11 0.75<br />
16.99<br />
65.98 42.2%<br />
25.8%<br />
E<br />
R<br />
.<br />
1990 1991<br />
1992<br />
7.42<br />
7.17<br />
5.67<br />
5.99<br />
0.96<br />
0.94<br />
6.63<br />
6.94<br />
0.12<br />
0.09<br />
0.89<br />
0.86<br />
16.71<br />
17.03<br />
66.57<br />
66.76<br />
39.6%<br />
40.7%<br />
25.1%<br />
25.5%<br />
k? 1993 6.85 6.69 0.93 7.62 0.10 0.90<br />
17.24<br />
67.00 44.2%<br />
25.7%<br />
7 1994 6.66 6.96 1.09 8.05 0.10 0.84<br />
17.72 68.30 45.5%<br />
25.9%<br />
2 1995 6.56 7.14 0.75 7.89 0.10 0.86<br />
17.73<br />
69.87 44.5%<br />
25.4%<br />
1996 6.47 7.40 1.10 8.50 0.11 0.87<br />
18.31 71.40 46.4%<br />
25.6%<br />
1997 6.45 8.12 1.04 9.16 0.11 0.90<br />
18.62<br />
73.13<br />
49.2%<br />
25.5%<br />
1998 6.25 8.60 1.17 9.76 0.11 0.84<br />
18.92 73.64 51.6%<br />
25.7%<br />
1999 5.95 8.47 1.14 9.61 0.11 0.82<br />
19.39<br />
49.6%<br />
1973-99 -1.7% 3.8% -3.4% 1.8%<br />
c<br />
Average nnnunl percentage change<br />
5.0% 0.4% 1 1 OXd<br />
1989-99<br />
Source:<br />
-2.4% 4.0% -2.7% 2.9% -2.4% 1.3% 1.1% 1 .2%6<br />
U.S. Department of Energy, Energy In<strong>for</strong>mation Administration, Monthly Ener,oy Review, March <strong>20</strong>00, Washington, DC, <strong>20</strong>00, pp. 42-47.<br />
World petroleum consumption - U.S. Department of Energy, Energy In<strong>for</strong>mation Administration, Internatiomd Ener*,o Annual 1998, January <strong>20</strong>00, Tablel. 1.<br />
(Additional resources: www.eia.doe.gov)<br />
a Best estimate <strong>for</strong> U.S. petroleum consumption is the amount of petroleum products supplied to the U.S. in a given year. This is not the sum of crude oil production and net imports<br />
due to processing gain and stock changes.<br />
b Transportation petroleum use can be found on Table 1 .lO. This column has been revised to include domestic production of crude oil, natural gas plant liquids, and other<br />
hydrocarbons/hydrogen/oxygenates as shown in the Monthly Energy Review, Table 3.1 a.<br />
’ Data are not available.<br />
‘Average annual percentage change is to the latest possible year.<br />
76.7%<br />
78.3%<br />
82.8%<br />
89.5%<br />
91.7%<br />
91.7%<br />
92.0%<br />
87.9%<br />
86.9%<br />
84.9%<br />
85.3%<br />
86.0%<br />
86.6%<br />
93.1%<br />
98.5%<br />
104.1%<br />
112.1%<br />
114.5%<br />
110.6%<br />
114.5%<br />
118.7%<br />
124.4%<br />
127.0%<br />
130.3%<br />
131.7%<br />
138.7%<br />
146.2%<br />
I<br />
w N
<strong>TRANSPORTATION</strong><strong>ENERGY</strong><strong>DATA</strong><strong>BOOK</strong>: <strong>EDITION</strong>~O-<strong>20</strong>00<br />
1-13
Table 1.10<br />
Consumption of Petroleum by End-Use Sector, 1973-99<br />
(quadrillion Btu)<br />
Residential and<br />
Electric Total in million<br />
Year Transportation Percentage commercial Percentage Industrial Percentage utilities Percentage Total barrels per day”<br />
1973 17.83 51.2% 4.39 12.6% 9.10 26.1% 3.52 10.1% 34.84<br />
17.31<br />
1974 17.40 52.0% 4.00 12.0% 8.69 26.0% 3.37 10.1% 33.46 16.66<br />
1975 17.61 53.8% 3.81 11.6% 8.15 24.9% 3.17 9.7% 32.74<br />
16.33<br />
1976 18.51 52.6% 4.18 11.9% 9.01 25.6% 3.48 9.9% 35.18<br />
17.51<br />
1977 19.24 51.8% 4.21 11.3% 9.77 26.3% 3.90 10.5% 37.12<br />
18.43<br />
1978 <strong>20</strong>.04 52.8% 4.07 10.7% 9.87 26.0% 3.99 10.5% 37.97 18.85<br />
1979 19.83 53.4% 3.45 9.3% 10.57 28.5% 3.28 8.8% 37.13 18.52<br />
1980 19.01 55.6% 3.04 8.9% 9.53 27.9% 2.63 7.7% 34.21<br />
17.11<br />
1981 18.81 58.9% 2.63 8.2% 8.29 26.0% 2.<strong>20</strong> 6.9% 31.93 16.06<br />
1982 18.42 60.9% 2.45 8.1% 7.79 25.8% 1.57 5.2% 30.23 15.29<br />
1983 18.59 61.9% 2.50 8.3% 7.42 24.7% 1.54 5.1% 30.05<br />
15.23<br />
1984 19.22 61.9% 2.54 8.2% 8.01 25.8% 1.29 4.2% 31.06 15.77<br />
1985 19.50 63.1% 2.52 8.2% 7.81 25.3% 1.09 3.5% 30.92<br />
15.73<br />
1986 <strong>20</strong>.27 63.0% 2.56 8.0% 7.92 24.6% 1.45 4.5% 32.<strong>20</strong> 16.28<br />
1987 <strong>20</strong>.87 63.5% 2.59 7.9% 8.15 24.8% 1.26 3.8% 32.87 16.67<br />
1988 21.63 63.2% 2.60 7.6% 8.43 24.6% 1.56 4.6% 34.22 17.33<br />
1989 21.87 63.9% 2.53 7.4% 8.13 23.8% 1.69 4.9% 34.22<br />
17.33<br />
1990 21.81 65.0% 2.17 6.5% 8.32 24.8% 1.25 3.7% 33.55 16.99<br />
1991 21.46 65.3% 2.15 6.5% 8.06 24.5% 1.18 3.6% 32.85 16.72<br />
1992 21.81 65.0% 2.13 6.4% 8.64 25.8% 0.95 2.8% 33.53 17.08<br />
1993 22.<strong>20</strong> 65.6% 2.14 6.3% 8.45 25.0% 1.05 3.1% 33.84 17.24<br />
1994 22.76 65.6% 2.09 6.0% 8.85 25.5% 0.97 2.8% 34.67 17.72<br />
1995 23.<strong>20</strong> 67.1% 2.08 6.0% 8.62 24.9% 0.66 1.9% 34.56<br />
17.73<br />
1996 23.74 66.4% 2.<strong>20</strong> 6.2% 9.10 25.4% 0.73 2.0% 35.77 18.37<br />
1997 24.00 66.2% 2.14 5.9% 9.31 25.7% 0.82 2.3% 36.27 18.62<br />
1998 24.64 66.7% 1.97 5.3% 9.15 24.8% 1.17 3.2% 36.93 18.92<br />
1999 25.21 66.9% 2.07 5.5% 9.45 25.1% 0.97 2.6% 37.70 19.39<br />
1973-99 1.3%<br />
-2.9%<br />
Average amual percentage change<br />
0.1% -4.8% 0.3% 0.4%<br />
1989-99<br />
Source:<br />
1.4% -2.0% * 50, -5.4% 1 .O% 1.1%<br />
U.S. Department ofEnergy, Energy In<strong>for</strong>mation Administration, Monthly Energy Review, March <strong>20</strong>00, pp. 27, 29, 3 1, 33.<br />
(Additional resources: www.eia.doe.gov)<br />
a Calculated from Total column using Table A.3. Approximate Heat Content of Petroleum Products, Weighted Average, from the Monthly Energy<br />
Review, March <strong>20</strong>00.
Table 1.11<br />
Transportation of Petroleum and Petroleum Products in the U.S. by Mode, 1975-98<br />
Pipelines” Water carriers Motor carriersb Railroads Total<br />
(billion (billion (billion (billion (billion<br />
( Year ton-miles) p (percent) e ton-miles) r c ( e ercent) ton-miles) n (percent) t ton-miles) )<br />
1975 507.0 59.88% 298.0 35.<strong>20</strong>% 27.4 3.26% 14.1 1.66% 846.7<br />
1976 515.0 59.35% 306.9 35.37% 32.5 3.75%<br />
13.3 1.53% 867.7<br />
1977 546.0 59.13% 333.3 36.09% 29.6 3.21%<br />
14.5 1.57% 923.4<br />
1978 585.8 50.49% 530.6 45.73% 30.6 2.65%<br />
13.2 1.14% 1,160.2<br />
1979 608.3 51.78% 522.9 44.5 1% 30.1 2.56%<br />
13.5 1.15% 1,174.8<br />
1980 588.2 47.24% 617.8 49.61% 26.8 2.15%<br />
12.5 1.00% 1,245.3<br />
1981 563.7 46.27% 617.2 50.66% 24.9 2.04%<br />
12.6 1.03% 1,218.4<br />
1982 565.7 46.44% 616.9 50.64% 22.7 1.86%<br />
12.9 1.06% 1,218.2<br />
1983 556.1 45.45% 630.5 51.53% 25.1 2.05%<br />
11.8 0.97% 1,223.5<br />
1984 568.1 48.14% 570.7 48.36% 29.2 2.47%<br />
12.2 1.03% 1,180.2<br />
1985 564.3 47.<strong>20</strong>% 590.4 49.39% 28.7 2.40%<br />
12.1 1.01% 1,195.5<br />
1986 577.9 48.65% 568.1 47.83% 29.7 2.50%<br />
12.1 1.02% 1,187.8<br />
1987 586.8 49.08% 566.5 47.37% 30.4 2.54%<br />
12.1 1.01% 1,195.X<br />
1988 601.1 50.59% 543.7 45.76% 30.5 2.57%<br />
12.8 1.08% 1,188.l<br />
1989 584.2 53.39% 466.2 42.61% 30.4 2.78%<br />
13.4 1.22% 1,094.2<br />
1990 584.1 54.24% 449.0 41.70% 29.7 2.76%<br />
14.0 1.30% 1,076.8<br />
1991 578.5 53.27% 465.0 42.81% 28.8 2.65%<br />
13.8 1.27% 1,086.l<br />
1992 588.8 53.93% 459.3 42.07% 28.8 2.64%<br />
14.8 1.36% 1,091.7<br />
1993 592.9 57.31% 401.7 38.82% 24.8 2.40%<br />
15.2 1.47% 1,034.6<br />
1994 591.4 56.50% 411.4 39.31% 28.1, 2.68%<br />
15.8 1.51% 1,046.7<br />
1995 601.1 57.53% 400.9 38.37% 26.3 2.51%<br />
16.6 1.59% 1,044.9<br />
1996 619.2 60.58% 356.5 34.88% 29.7 2.90%<br />
16.8 1.64% 1,022.2<br />
1997 616.5 64.45% 295.6 30.90% 27.7 2.90%<br />
16.7 1.75% 956.5<br />
1998 619.8 66.66% 265.0 28.50% 28.3 3.04%<br />
16.7 1.80% 929.8<br />
1975-98 0.9% -0.5%<br />
Average annualpercentage change<br />
0.1%<br />
0.7% 0.4%<br />
Source:<br />
Association of Oil Pipelines, Shifts in Petroleum Transportation, Washington, DC, April <strong>20</strong>00, Table 1.<br />
a The amounts carried by pipeline are based on ton-miles of crude and petroleum products <strong>for</strong> Federally regulated pipelines (84 percent) plus an<br />
estimated breakdown of crude and petroleum products of the ton-miles <strong>for</strong> pipelines not Federally regulated (16 percent).<br />
b The amounts carried by motor carriers are estimated.
Source<br />
Chapter 2<br />
Energy<br />
Summary Statistics from Tables in this Chapter<br />
Table 2.3 Transportation share of U.S. energy consumption, 1999 28.0%<br />
Table 2.4 Petroleum share of transportation energy consumption, 1999 97.4%<br />
Table 2.6 Transportation energy use by mode, 1998 (trillion Btu)<br />
Automobiles 9,078<br />
Light trucks 6,324<br />
Heavy trucks 4,218<br />
Buses 195<br />
Air 2,351<br />
Water 1,295<br />
Pipeline 901<br />
R a i l 586<br />
Table 2.9 Alternative vehicle fuel and oxygenate consumption, 1999<br />
(thousand gasoline<br />
equivalent gallons)<br />
Liquifiedpetroleum gas 243,648<br />
Compressed natural gas 86,073<br />
Liquified natural gas 6,062<br />
M85/MlOO 1,557<br />
E85/ElOO 2,548<br />
Electricity 1,458<br />
MTBE 3,097,800<br />
Ethanol in gasohol 890,<strong>20</strong>0<br />
<strong>TRANSPORTATION</strong><strong>ENERGY</strong><strong>DATA</strong>BOOIC <strong>EDITION</strong>~O-<strong>20</strong>00<br />
(share)<br />
35.3%<br />
24.6%<br />
16.4%<br />
0.8%<br />
9.2%<br />
5.0%<br />
3.5%<br />
2.3%<br />
(share)<br />
5.6%<br />
2.0%<br />
0.1%<br />
0.0%<br />
0.0%<br />
0.0%<br />
71.6%<br />
<strong>20</strong>.6%<br />
2-l
1989<br />
World total 134.66 136.35 135.90<br />
OECDb 38.07 38.<strong>20</strong> 39.<strong>20</strong><br />
Non OECD 96.58 98.15 96.70<br />
World total 74.24 75.91 76.68<br />
OECDb 30.61 31.44 32.18<br />
Non OECD 43.63 44.47 44.50<br />
World total 91.05 92.28 87.65<br />
OECDb 42.12 42.00 39.96<br />
Non OECD 48.93 50.28 47.69<br />
World total 21.74 22.56 22.98<br />
OECDb 11.84 12.22 12.33<br />
Non OECD 9.90 10.33 10.65<br />
World total 19.82 <strong>20</strong>.37 21.29<br />
OECD” 16.38 16.99 17.93<br />
Non OECD 3.44 3.38 3.36<br />
World total 345.76<br />
Table 2.1<br />
World Production of Primary Energy by Selected Country Groups, 1989-98<br />
(quadrillion Btu)<br />
1990 1991 1992 1993 1994 1995 1996 1997 1998”<br />
351.39<br />
348.48<br />
Petroleum<br />
136.50 136.52<br />
39.70 39.57<br />
96.81 96.95<br />
Natural gas<br />
76.84 78.35<br />
33.02 34.18<br />
43.82 44.17<br />
Coal<br />
88.35 85.72<br />
39.16 38.19<br />
49.19 47.53<br />
Hydroelectric power<br />
22.96 24.31<br />
12.18 12.91<br />
10.78 11.40<br />
Nuclear electric power<br />
21.36 22.07<br />
18.15 18.99<br />
3.21 3.08<br />
Total energyc<br />
350.29 351.33<br />
OECDb 143.05 144.54 145.33 146.23 147.94 152.51 155.25 160.56 161.14 161.33 42.2%<br />
Non OECD<br />
Source:<br />
<strong>20</strong>2.71 <strong>20</strong>6.85 <strong>20</strong>3.15 <strong>20</strong>4.06 <strong>20</strong>3.39 <strong>20</strong>4.04 <strong>20</strong>9.93 214.31 218.08 2<strong>20</strong>:85 57.8%<br />
U.S. Department of Energy, Energy In<strong>for</strong>mation Administration, International Energy Annual 1998, Washington, DC, January <strong>20</strong>00, Table 2.9. (Additional resources:<br />
www.eia.doe.gov)<br />
a Preliminary.<br />
b Organization <strong>for</strong> Economic Cooperation and Development (OECD). See Glossary <strong>for</strong> membership.<br />
’ Geothermal, solar, and wind electric power are included in the total though not shown separately on this table.<br />
1998<br />
Share<br />
138.30 141.47 144.93 149.01 151.96 39.8%<br />
40.94 41.66 43.14 43.59 43.21 11.3%<br />
97.36 99.81 101.79 105.42 108.75 28.5%<br />
79.16 80.23 83.97 84.00 85.49 22.4%<br />
35.67 36.14 38.05 37.94 38.19 10.0%<br />
43.49 44.09 45.92 46.06 47.30 12.4%<br />
87.53 89.67 90.78 90.64 88.61 23.2%<br />
39.58 39.37 40.25 40.55 40.47 10.6%<br />
47.95 50.31 50.53 50.09 48.14 12.4%<br />
24.48 25.73 26.11 26.74 26.63 7.0%<br />
12.43 13.31 13.71 13.96 13.63 3.6%<br />
12.06 12.42 12.40 12.78 13.01 3.4%<br />
22.50 23.35 24.17 23.95 24.48 6.4%<br />
19.61 <strong>20</strong>.35 <strong>20</strong>.84 <strong>20</strong>.59 21.<strong>20</strong> 5.5%<br />
2.89 3.01 3.33 3.36 3.27 0.9%<br />
356.54 365.18 374.87 379.22 382.18 100.0%
World total<br />
OECDb<br />
Non OECD<br />
World total<br />
OECDb<br />
Non OECD<br />
World total<br />
OECDb<br />
Non OECD<br />
World total<br />
OECDb<br />
Non- OECD<br />
World total<br />
OECDb<br />
Non OECD<br />
World total<br />
OECDb<br />
1989<br />
134.82<br />
82.63<br />
52.19<br />
73.93<br />
35.85<br />
38.08<br />
90.33<br />
42.76<br />
47.57<br />
21.89<br />
11.99<br />
9.90<br />
19.82<br />
16.38<br />
3.44<br />
344.83<br />
193.67<br />
Table 2.2<br />
World Consumption of Primary Energy by Selected Country Groups, 1989-98<br />
(quadrillion Btu)<br />
1990 1991 1992 1993 1994 1995 1996 1997 1998”<br />
134.87<br />
82.70<br />
52.17<br />
74.78<br />
36.26<br />
38.52<br />
90.41<br />
41.82<br />
48.59<br />
22.65<br />
12.31<br />
10.33<br />
<strong>20</strong>.37<br />
16.99<br />
3.38<br />
346.83<br />
193.76<br />
136.11<br />
83.63<br />
52.48<br />
76.02<br />
37.69<br />
38.33<br />
87.15<br />
40.77<br />
46.39<br />
23.18<br />
12.53<br />
10.65<br />
21.29<br />
17.93<br />
3.36<br />
347.51<br />
196.<strong>20</strong><br />
Petroleum<br />
136.62 136.61 139.10<br />
85.72 86.56 88.92<br />
50.90 50.05 50.18<br />
Natural gas<br />
76.23 78.40 78.34<br />
38.58 40.<strong>20</strong> 41.33<br />
37.64 38.21 37.01<br />
Coal<br />
87.05 87.54 88.33<br />
39.45 41.05 40.85<br />
47.60 46.49 47.48<br />
Hydroelectric power<br />
23.<strong>20</strong> 24.57 24.77<br />
12.42 13.16 12.71<br />
10.78 11.40 12.06<br />
Nuclear electric power<br />
21.36 22.07 22.50<br />
18.15 18.99 19.61<br />
3.21 3.08 2.89<br />
Total energyc<br />
348.46 353.21 357.25<br />
198.11 <strong>20</strong>3.78 <strong>20</strong>7.38<br />
Non OECD<br />
Source:<br />
151.16 153.07 151.31 150.35 149.43 149.87 153.50 156.78 157.89 157.13 41.6%<br />
U.S. Department of Energy, Energy In<strong>for</strong>mation Administration, International EneQy Annual 1998 Washington, DC, January <strong>20</strong>00, Table 1.8. (Additional resources:<br />
www.eia.doe.gov)<br />
d Preliminary.<br />
b Organization <strong>for</strong> Economic Cooperation and Development (OECD). See Glossary <strong>for</strong> membership.<br />
’ Geothermal, solar, and wind electric power are included in the total though not shown separately on this table.<br />
142.39<br />
90.45<br />
51.94<br />
80.01<br />
43.22<br />
36.79<br />
89.63<br />
40.55<br />
49.07<br />
26.00<br />
13.58<br />
12.42<br />
23.35<br />
<strong>20</strong>.35<br />
3.01<br />
365.72<br />
212.22<br />
145.51<br />
92.70<br />
52.82<br />
84.01<br />
45.70<br />
38.31<br />
91.64<br />
41.99<br />
49.64<br />
26.44<br />
14.03<br />
12.40<br />
24.17<br />
<strong>20</strong>.84<br />
3.33<br />
376.25<br />
219.47<br />
148.62<br />
94.01<br />
54.61<br />
83.77<br />
45.64<br />
38.13<br />
90.19<br />
41.50<br />
48.69<br />
26.96<br />
14.18<br />
12.78<br />
23.95<br />
<strong>20</strong>.59<br />
3.36<br />
378.04<br />
2<strong>20</strong>.15<br />
84.40<br />
45.62<br />
38.78<br />
87.53<br />
41.13<br />
46.40<br />
26.84<br />
13.83<br />
13.01<br />
24.48<br />
21.<strong>20</strong><br />
3.27<br />
377.72<br />
2<strong>20</strong>.59<br />
1998<br />
Share<br />
39.6%<br />
25.0%<br />
14.7%<br />
22.3%<br />
12.1%<br />
10.3%<br />
23.2%<br />
10.9%<br />
12.3%<br />
6.5%<br />
5.6%<br />
0.9%<br />
100.0%<br />
58.4%
2-4<br />
I<br />
Total energy use in the U.S. has grown to 92 quads in 1999. The transportation sector accounts <strong>for</strong> 28% qf total<br />
energy use.<br />
Table 2.3<br />
U. S. Consumption of Total Energy by End-Use Sector, 1970-99”<br />
(quadrillion Btu)<br />
Year Transportation<br />
Percentage<br />
transportation<br />
of total<br />
Residential and<br />
commercial Industrial Total<br />
1970 16.07 24.2% 21.71 28.65 66.43<br />
1971 16.70<br />
24.6% 22.59 28.59 67.88<br />
1972 17.70<br />
24.8% 23.69 29.88 71.27<br />
1973 18.61<br />
25.1% 24.14 31.53 74.28<br />
1974 18.12<br />
25.0% 23.72 30.69 72.54<br />
1975 18.24<br />
25.9% 23.90 28.40 70.55<br />
1976 19.10<br />
25.7% 25.02 30.24 74.36<br />
1977 19.82<br />
26.0% 25.38 31.08 76.29<br />
1978 <strong>20</strong>.62<br />
26.4% 26.08 31.39 78.09<br />
1979 <strong>20</strong>.47<br />
25.9% 25.81 32.62 78.90<br />
1980 19.70<br />
25.9% 25.65 30.61 75.96<br />
1981 19.51<br />
26.4% 25.24 29.24 73.99<br />
1982 19.07<br />
26.9% 25.63 26.15 70.85<br />
1983 19.14<br />
27.1% 25.62 25.76 70.52<br />
1984 19.81<br />
26.7% 26.47 27.87 74.14<br />
1985 <strong>20</strong>.07<br />
27.1% 26.70 27.21 73.98<br />
1986 <strong>20</strong>.82<br />
28.0% 26.85 26.63 74.30<br />
1987 21.46<br />
27.9% 27.61 27.83 76.89<br />
1988 22.31<br />
27.8% 28.92 28.99 80.22<br />
1989 22.57<br />
27.7% 29.42 29.37 81.36<br />
1990 22.54<br />
27.7% 28.80 29.95 81.30<br />
1991 22.13<br />
27.3% 29.42 29.57 81.12<br />
1992 22.47<br />
27.3% 29.27 30.68 82.42<br />
1993 22.90<br />
27.2% 30.45 30.88 84.22<br />
1994 23.52<br />
27.4% 30.70 31.76 85.99<br />
1995 23.97<br />
27.4% 31.54 32.04 87.56<br />
1996 24.52<br />
27.1% 32.94 32.95 90.42<br />
1997 24.82<br />
27.3% 33.09 33.07 90.98<br />
1998 25.36<br />
27.8% 33.17 32.73 91.26<br />
1999 25.92<br />
28.0% 33.63 33.16 92.72<br />
1970-99 1.7%<br />
Average annualpercentage change<br />
1.5% 0.5% 1.2%<br />
1989-99 1.4% 1.3% 1.2% 1.3%<br />
Source:<br />
U.S. Department of Energy, Energy In<strong>for</strong>mation Administration, Monthly Energy Review, March <strong>20</strong>00,<br />
Washington, DC, Table 2.2. (Additional resources: www.eia.doe.gov)<br />
“Electrical energy losses have been distributed among the sectors.<br />
TRANSPOKTATION<strong>ENERGY</strong>DA'TA<strong>BOOK</strong>: <strong>EDITION</strong>~O-<strong>20</strong>00<br />
I
to the lack of consistent historical data, renewable energy sources are not imluded<strong>for</strong> sectors other than the electric utilities.<br />
Additional detailed data about oxygenates and other fuel types <strong>for</strong> the Transportation sector are found on Table 2.9.<br />
r-Due<br />
Energy source<br />
Petroleum<br />
Natural gasa<br />
Coal<br />
Hydroelectric<br />
Nuclear<br />
Electricityb<br />
Other”<br />
Total<br />
Table 2.4<br />
Distribution of Energy Consumption by Source, 1973,1980, and 1999<br />
(percentage)<br />
Transportation<br />
1973 1980 1999<br />
95.8 96.5 97.4<br />
4.0 3.3 2.6<br />
0.0 0.0 0.0<br />
0.0 0.0 0.0<br />
0.0 0.0 0.0<br />
0.2 0.2 0.1<br />
0.0 0.0 0.0<br />
100.0 100.0 100.0<br />
Residential &<br />
Commercial<br />
1973 1980 1999<br />
18.2 11.8 11.7<br />
31.6 29.4 45.2<br />
1.1 0.6 0.6<br />
0.0 0.0 0.0<br />
0.0 0.0 0.0<br />
49.2 58.2 42.5<br />
0.0 0.0 0.0<br />
100.0 100.0 100.0<br />
Industrial Electric utilities<br />
1973 1980 1999 1973 1980 1999<br />
28.9 31.1 36.9 17.7 10.7 2.8<br />
32.9 27.4 39.9 18.9 15.5 9.2<br />
12.8 10.3 9.0 43.6 49.5 55.8<br />
0.1 0.1 0.1 15.0 12.6 9.6<br />
0.0 0.0 0.0 4.6 11.2 22.3<br />
25.2 31.1 14.0 0.0 0.0 0.0<br />
0.0 0.0 0.0 0.2 0.5 0.2<br />
100.0 100.0 100.0 100.0 100.0 100.0<br />
Source:<br />
U.S. Department of Energy, Energy In<strong>for</strong>mation Administration, Monthly Energy Review, March <strong>20</strong>00, Washington, DC, pp. 27, 29, 31, 33.<br />
(Additional resources: www.eia.doe.gov)<br />
“Includes supplemental gaseous fuels. Transportation sector includes pipeline fuel and natural gas vehicle use.<br />
’ Includes electrical system energy losses.<br />
’ Energy generated from geothermal, wood, waste, wind, photovoltaic, and solar thermal energy sources.
2-6<br />
I As<br />
duta about alternative jilel use come available, an attempt is made to incorporate it into this table. Sometimes<br />
assumptions must be made in order to use the data. Please see Appendix A <strong>for</strong> detailed methodology of all energy<br />
data.<br />
HIGHWAY<br />
Automobiles<br />
Motorcycles<br />
Buses<br />
Transit<br />
Intercity”<br />
School”<br />
Trucks<br />
Light truclcsd<br />
Other trucks<br />
OFF-HIGHWAY<br />
Construction<br />
Agriculture<br />
NONHIGHWAY<br />
Air<br />
General aviation<br />
Domestic air carriers<br />
International air carriers’<br />
Water<br />
Freight<br />
Recreational<br />
Pipeline<br />
Rail<br />
Freight (Class I)<br />
Passenger<br />
Transit<br />
Commuter<br />
Intercity”<br />
TOTAL<br />
Source:<br />
See Appendix A <strong>for</strong> Table 2.5.<br />
Table 2.5<br />
Domestic Consumption of Transportation Energy by Mode and Fuel Type, 1998”<br />
(trillion Btu)<br />
Gasoline Diesel fuel<br />
15,544.9<br />
8,,952.3”<br />
25.7<br />
12.5<br />
4.8<br />
7.7<br />
6,554.4<br />
6,076.4<br />
478.0<br />
142.6<br />
29.3<br />
113.3<br />
343.3<br />
37.4<br />
37.4<br />
305.9<br />
305.9<br />
Liquified Residual Natural<br />
petroleum gas Jet fuel fuel oil gas Electricity<br />
4,266.4 23.7 4.8 0.9<br />
126.0 0.1<br />
176.4<br />
76.8<br />
22.6<br />
77.0<br />
3,694.0<br />
238.1<br />
3,726.0<br />
570.1 e<br />
178.5 c<br />
391.6 ’<br />
817.2<br />
294.8<br />
294.8<br />
522.4<br />
502.0<br />
<strong>20</strong>.4<br />
0.5 4.3 0.9<br />
0.5 4.3 0.9<br />
23.2 0.4<br />
9.2 0.4<br />
14.0 0.0<br />
2,313.7 694.6 655.2 309.9<br />
2,313.7<br />
110.0<br />
1,857.3<br />
346.4<br />
694.6<br />
694.6<br />
655.2 246.0<br />
63.9<br />
10.8<br />
61.0<br />
42.6<br />
15.1<br />
9.8 3.3<br />
16,030.g 5,653.7 23.7 2,313.7 694.6 660.0 310.8<br />
” Civilian consumption only. Totals may not include all possible uses of fuels <strong>for</strong> transportation (e.g., snowmobiles),<br />
’ Includes gasohol.<br />
c Estimated using vehicle travel in<strong>for</strong>mation.<br />
d Two-axle, four-tire trucks.<br />
’ 1985 data.<br />
r One half of fuel used by domestic carriers in international operation.<br />
<strong>TRANSPORTATION</strong><strong>ENERGY</strong><strong>DATA</strong>BOOIC <strong>EDITION</strong>~O-<strong>20</strong>00
HIGHWAY<br />
Automobiles<br />
Motorcycles<br />
Buses<br />
Transit<br />
Intercity<br />
School<br />
Trucks<br />
Light trucks ’<br />
Other trucks<br />
OFF-HIGHWAY<br />
Construction<br />
Agriculture<br />
NONHIGHWAY<br />
Air<br />
General aviation<br />
Domestic air carriers<br />
International air<br />
Water<br />
Freight<br />
Recreational<br />
Pipeline<br />
Rail<br />
Freight<br />
Passenger<br />
Transit<br />
Commuter<br />
Intercity<br />
The 1997 data have been revised to include the latest data available.<br />
Table 2.6<br />
Transportation Energy Use by Mode, 1997-98”<br />
Trillion Btu<br />
Thousand barrels per<br />
day crude oil<br />
equivalent b Percentage of total<br />
1997 1998 1997 1998 1997 1998<br />
19,244.3 19,840.7<br />
8,746.3 9,078.4<br />
25.2 25.7<br />
199.1 194.6<br />
93.0 87.3<br />
22.2" 22.6<br />
83.9” 84.7<br />
10,273.7 10,542.O<br />
6,187.5 6,324.l<br />
4,086.2 4,217.g<br />
730.8 712.7<br />
216.1 <strong>20</strong>7.8<br />
514.7 504.9<br />
5,158.4 5,133.9<br />
2,383.9 2,351.l<br />
121.1 147.4<br />
1,831.0 1,857.3<br />
331.8 346.4<br />
1,309.o 1,295.3<br />
1,009.3 989.4<br />
299.7 305.9<br />
987.0 901.2<br />
578.9 586.3<br />
499.7 502.0<br />
78.8 84.3<br />
42.5 43.1<br />
23.7 28.2<br />
12.6" 13.0<br />
9,681.2 9,981.3<br />
4,400.o 4,567.l<br />
12.7 12.9<br />
100.1 97.9<br />
46.8 43.9<br />
11.2" 11.4<br />
42.2" 42.6<br />
5,168.4 5,303.4<br />
3,112.8 3,181.5<br />
2,055.6 2,121.g<br />
367.6 358.5<br />
108.7 104.5<br />
258.9 254.0<br />
2,595.0 2,582.7<br />
1,149.0 1,182.S<br />
60.9 74.2<br />
921.1 934.4<br />
166.9 174.3<br />
658.5 651.6<br />
507.7 497.7<br />
150.8 153.9<br />
496.5 453.4<br />
291.0 295.0<br />
251.4 252.5<br />
39.6 42.4<br />
21.4 21.7<br />
11.9 14.2<br />
6.3' 6.5<br />
76.6%<br />
34.8%<br />
0.1%<br />
0.8%<br />
0.4%<br />
0.1%<br />
0.3%<br />
40.9%<br />
24.6%<br />
16.3%<br />
2.9%<br />
0.90/u<br />
2.0%<br />
<strong>20</strong>.5%<br />
9.1%<br />
0.5%<br />
7.3%<br />
1.3%<br />
5.2%<br />
4.0%<br />
1.2%<br />
3.9%<br />
2.3%<br />
2.0%<br />
0.3%<br />
0.2%<br />
0.1%<br />
0.1%<br />
77.2%<br />
35.3%<br />
0.1%<br />
0.8%<br />
0.3%<br />
0.1%<br />
0.3%<br />
41.0%<br />
24.6%<br />
16.4%<br />
2.8%<br />
0.8%<br />
2.0%<br />
<strong>20</strong>.0%<br />
TOTAL 25J33.5 25,687.3 12,643.9 12922.5 100.0 100%<br />
Source: See Appendix A <strong>for</strong> Table 2.5 (detailed breakdown).<br />
:‘Civilian consumption only. Totals may not include all possible uses of fuels <strong>for</strong> transportation (e.g., snowmobiles).<br />
“Thousand barrels per day crude oil equivalents based average on the EIA weighted average of heat content of petroleum<br />
products used in transportation.<br />
‘Estimated using vehicle travel in<strong>for</strong>mation.<br />
“Two-axle, four-tire trucks.<br />
<strong>TRANSPORTATION</strong> <strong>ENERGY</strong> <strong>DATA</strong> <strong>BOOK</strong>: <strong>EDITION</strong> <strong>20</strong>-<strong>20</strong>00<br />
9.2%<br />
0.6%<br />
7.2%<br />
1.3%<br />
5.0%<br />
3.9%<br />
1.2%<br />
3.5%<br />
2.3%<br />
2.0%<br />
0.3%<br />
0.2%<br />
0.1%<br />
0.1%<br />
2-7
The Federal Highway Administration produced revised estimates of auto, light truck, and other truck historicalfuel use in order to produce a consistent trend. Light trucks<br />
include oickus, vans, and sport utility vehicles. I<br />
Year Autos<br />
Table 2.7<br />
Transportation Energy Consumption by Mode, 1970-98<br />
(trillion Btu)<br />
Light<br />
Light vehicles Motor- Heavy Highway Nonhighway Total<br />
trUCkS subtotal cycles Buses” trucks subtotal Air Water Pipeline Rail subtotal transportationb<br />
8,527 1,540 10,067 7 109 1,503 11,686 1,307 753 985 558 3,603 15,289<br />
2 1970 1975 9,321 2,386 11,707 14 119 1,939 13,779 1,274 851 835 563 3,523 17,302<br />
2 1976 9,844 2,605 12,449 15 129 2,046 14,639 1,333 1,001 803 585 3,722 18,361<br />
9,940 2,799 12,739 16 132 2,268 15,155 1,411 1,103 781 595 3,890 19,045<br />
;<br />
+<br />
><br />
=!<br />
1977 1978<br />
1979<br />
10,140<br />
9,629<br />
8,798<br />
3,022<br />
3,057<br />
2,976<br />
13,162<br />
12,686<br />
11,774<br />
18<br />
22<br />
26<br />
135<br />
137<br />
139<br />
2,539<br />
2,644<br />
2,651<br />
15,854<br />
15,489<br />
14,590<br />
1,467<br />
1,568<br />
1,528<br />
1,311<br />
1,539<br />
1,677<br />
781<br />
856<br />
889<br />
589<br />
613<br />
596<br />
4,148<br />
4,576<br />
4,690<br />
<strong>20</strong>,002<br />
<strong>20</strong>,065<br />
19,280<br />
2 1980 1981 8,695 2,964 11,659 27 143 2,706 14,535 1,455 1,562 899 565 4,481 19,016<br />
g 1982 8,695 2,839 11,534 25 146 2,707 14,412 1,468 1,290 853 488 4,099 18,511<br />
g 1983 8,814 2,995 11,809 22 145 2,757 14,733 1,505 1,187 738 482 3,912 18,645<br />
8,857 3,<strong>20</strong>2 12,059 22 154 2,846 15,081 1,633 1,251 780 523 4,187 19,268<br />
G 1984 1985 8,954 3,422 12,376 23 161 2,842 15,402 1,678 1,311 758 487 4,234 19,636<br />
-I 1986 9,162 3,636 12,798 23 154 2,903 15,878 1,823 1,295 738 423 4,279 <strong>20</strong>,157<br />
r!i 1987 9,179 3,827 13,006 24 157 2,990 16,177 1,894 1,326 775 485 4,480 <strong>20</strong>,657<br />
9,180 4,096 13,276 25 159 3,117 16,577 1,978 1,338 878 498 4,692 21,269<br />
$ 1988 1989 9,25 1 4,173 13,424 26 163 3,196 16,809 1,981 1,376 895 501 4,753 21,562<br />
.<br />
1990 8,707 4,467 13,174 24 163 3,329 16,690 2,059 1,487 928 492 4,966 21,656<br />
g<br />
1991 8,048 4,793 12,841 23 174 3,396 16,434 1,926 1,567 864 463 4,8<strong>20</strong> 21,254<br />
2<br />
8,188 5,134 13,322 24 182 3,460 16,988 1,971 1,641 849 476 4,937 21,925<br />
2 1992 1993 8,389 5,375 13,764 25 192 3,567 17,548 1,996 1,473 889 513 4,871 22,419<br />
% 1994 8,494 5,530 14,024 26 <strong>20</strong>2 3,772 18,024 2,056 1,414 955 546 4,971 22,995<br />
1995 8,519 5,717 14,236 25 179 3,950 18,390 2,117 1,522 971 565 5,175 23,565<br />
z 1996 8,622 5,936 14,558 25 194 4,033 18,850 2,196 1,460 984 578 5,218 24,068<br />
8 1997 8,746 6,188 14,934 25 199 4,086 19,244 2,284 1,309 987 579 5,159 24,403<br />
1998 9,078 6,324 15,402 26 195 4,218 19,841 2,351 1,295 901 586 5,133 24,974<br />
Average annual percentage change<br />
1970-98 0.2% 5.2% 1.5% 4.7% 2.1% 3.8% 1.9% 2.2% 2.0% .0.3% 0.2% 1.3% 1.8%<br />
1988-98 -0.1% 4.4% 1.5% 0.4% 2.1% 3.1% 1.8% 1.7% 1.3% 0.3% 1.6% 0.9% 1.6%<br />
Source:<br />
See Appendix A <strong>for</strong> Table 2.7.<br />
a Begmning in 1992 data became available on alternative fuel use by transit buses.<br />
h Total tl-ansportation figures do not include military and off-highway energy use and may not include all possible uses of fuel <strong>for</strong> transportation (e.g. snowmobiles).
I<br />
The Federal Highway Administration cautions that data from 1993-on may not be directly comparable to earlier years. Some states have improved reportingprocedures<br />
in recent years, and the estimation procedures were revised in 1994. Prior to the Ener,oy Policy Act of 1992, gasohol was defined as a blend ofgasoline and at least IO%,<br />
byvolume, alcohol. EffectiveJanuauy I, 1993, three typesofgasoholwerede$ned: IO%gasohol-containingatleast IO%alcohol; 7,7%gasohol-containing 7.7%alcohol<br />
but less than 10%; and 5.7% gasohol-containing at least 5.7% alcohol but less than 7.7%. See Table 2.9 <strong>for</strong> details on oxygenate usage.<br />
Table 2.8<br />
Highway Usage of Gasoline and Special Fuels, 1973-98<br />
(million gallons)<br />
Ethanol used in Total gasoline and Percent Total highway<br />
Year<br />
1973<br />
Gasoline<br />
c<br />
Gasohol<br />
c<br />
gasohol”<br />
c<br />
gasohol<br />
100,636<br />
Dieselb<br />
9,837<br />
diesel<br />
8.9%<br />
fuel use<br />
110,473<br />
1975 c c c 99,354 9,63 1 8.8% 108,985<br />
1980 100,686 497 49.7 101,183 13,777 12.0% 114,960<br />
1981 98,884 713 71.3 99,597 14,856 13.0% 114,453<br />
1982 96,2<strong>20</strong> 2,259 225.9 98,479 14,905 13.1% 113,384<br />
1983 95,852 4,254 425.5 100,106 15,975 13.8% 116,081<br />
1984 95,996 5,4<strong>20</strong> 542.0 101,416 17,3<strong>20</strong> 14.6% 118,736<br />
1985 95,567 8,004 781.7 103,571 17,751 14.6% 121,322<br />
1986 98,618 8,138 780.7 106,756 18,427 14.7% 125,183<br />
1987 101,790 6,912 800.4 108,702 19,046 14.9% 127,748<br />
1988 101,678 8,138 813.8 109,816 <strong>20</strong>,070 15.5% 129,886<br />
1989 103,691 6,941 694.1 110,632 21,232 16.1% 131,864<br />
1990 102,645 7,539 753.9 110,184 21,399 16.3% 131,583<br />
1991 99,304 8,644 864.4 107,948 <strong>20</strong>,676 16.1% 128,624<br />
1992 102,119 8,831 883.1 110,950 21,988 16.5% 132,938<br />
1993 103,417 10,287 978.8 113,704 23,490 17.1% 137,194<br />
1994 103,997 11,010 1,042.O 115,007 25,124 17.9% 140,131<br />
1995 103,968 13,093 1,213.7 117,061 26,<strong>20</strong>6 18.3% 143,267<br />
1996 107,390 12,125 1,076.l 119,515 27,160 18.5% 146,675<br />
1997 106,237 14,701 1,328.9 1<strong>20</strong>,938 29,394 196% 150,332<br />
1998 110,715 13,979 1,296.g 124,694<br />
Average annualpercentage change<br />
30,190 19.5% 154,884<br />
1973-98<br />
d d d<br />
0.9% 4.6% 1.4%<br />
1988-98<br />
Source:<br />
0.9% 5.6% 4.8% 1.3% 4.2% 1.8%<br />
U.S. Department of Transportation, Federal Highway Administration, Highway Statistics 1998, Washington, DC, 1999, Tables MF-21 and MF-33E, and annual.<br />
(Additional resources: www.fhwa.dot.gov)<br />
’ Estimated <strong>for</strong> 1980-92 as 10% of gasohol consumption.<br />
b Consists primarily of diesel fuel, with small quantities of liquified petroleum gas<br />
‘Data <strong>for</strong> gasoline and gasohol cannot be separated in this year.<br />
d Data are not available.<br />
I
Q)<br />
k<br />
s<br />
e<br />
b<br />
Y<br />
u<br />
IOO-<br />
90 -<br />
80 -<br />
70 -<br />
60 -<br />
50 -<br />
40 -<br />
30 -<br />
<strong>20</strong> -<br />
IO-<br />
O-<br />
1981<br />
Figure 2.1. Motor Gasoline Quantities by Type, 1981 and 1998<br />
50% Leaded<br />
1% Gasohol<br />
49% Unleaded<br />
I998<br />
lxygenated<br />
Re<strong>for</strong>mulai bed<br />
Gasohol<br />
Unleaded<br />
Source:<br />
U.S. Department of Energy, Energy In<strong>for</strong>mation Administration, P&oZeunz Supply Annual 1998, Washington, DC, Tables 17 and <strong>20</strong>.<br />
U.S. Department of Energy, Energy In<strong>for</strong>mation Administration, The Motor Gasoline Industry: Past, Present and Future, Washington, DC,<br />
Table 5.<br />
U.S. Department of Transportation, Federal Highway Administration, Highway Statistics 1998, Washington, DC, Table MF-33E, and annual.
Table 2.9<br />
Alternative Vehicle Fuel Consumption, 1992-<strong>20</strong>00<br />
(thousand gasoline equivalent gallons)<br />
<strong>20</strong>00<br />
Alternative fuel 1992 1993 1994 1995 1996 1997 1998 1999 <strong>20</strong>00” Percentage<br />
Liquified petroleum <strong>20</strong>8,142 264,655 248,467 232,701 239,158 238,356 241,583 243,648 249,550 5.7%<br />
Compressed natural gas 16,823 21,603 24,160 35,162 46,923 65,192 73,251 86,073 104,501 2.4%<br />
Liquified natural gas 585 1,901 2,345 2,759 3,247 3,714 5,343 6,062 7,460 0.2%<br />
M85b 1,069 1,593 2,340 2,023 1,775 1,554 1,212 1,108 1,062 0.0%<br />
Ml00 2,547 3,166 3,190 2,150 347 347 449 449 449 0.0%<br />
E85b 21 48 80 190 694 1,280 1,727 2,489 3,283 0.1%<br />
E95b 85 80 140 995 2,699 1,136 59 59 59 0.0%<br />
Electricity 359 288 430 663 773 1,010 1,<strong>20</strong>2 1,458 1,712 0.0%<br />
Subtotal 229,631 293,334 281,152 276,643 295,616 312,589 324,826 341,346 368,076 8.4%<br />
Oxygenates<br />
MTBE” 1,175,OOO 2,069,<strong>20</strong>0 2,018,800 2,691,<strong>20</strong>0 2,749,700 3,104,<strong>20</strong>0 2,915,600 3,097,800 3,111,500 70.9%<br />
Ethanol in gasohol 701,000 760,000 845,900 910,700 660,<strong>20</strong>0 830,700 916,000 890,<strong>20</strong>0 908,700 <strong>20</strong>.7%<br />
Total 2,105,631 3,122,534 3,145,852 3,878,543 3,705,516 4,247,489 4,156,426 4,311,346 4,388,276 100.0%<br />
Source:<br />
U.S. Department of Energy, Energy In<strong>for</strong>mation Administration, Alternatives to Traditional Transportation Fuels, 1998, Washington, DC, 1999, web site<br />
www.eia.doe.govlcneaflsolar.renewableslalt_trans_fuel98/atfl-13~99.html. (Additional resources: www.eia.doe.gov)<br />
‘Based on plans or projections.<br />
Consumption includes gasoline portion of the mixture.<br />
?Methyl Tertiary Butyl Ether. This category includes a very small amount of other ethers, primarily Tertiary Amy1 Methyl Ether (TAME) and Ethyl<br />
Tertiary Butyl Ether (ETBE).
2-12<br />
Table 2.10<br />
U.S. Production and Imports of MTBE” and Fuel Ethanol, 1978-99<br />
(million gallons)<br />
Year<br />
1978 <strong>20</strong><br />
1979 40<br />
1980 80<br />
1981 85<br />
1982 234<br />
1983 443<br />
1984 567<br />
1985 793<br />
1986 798<br />
1987 825<br />
1988 800<br />
1989 750<br />
1990 756<br />
1991 875<br />
1992 1,080<br />
1993 1,156<br />
1994 1,280<br />
1995 1,355<br />
1996 974<br />
1997 1,274<br />
1998 1,387<br />
1999 1,472<br />
1978-99 22.7%<br />
1989-99 7.0%<br />
Production<br />
Fuel ethanol MTBE”<br />
b b<br />
b b<br />
b b<br />
122 b<br />
132 b<br />
134 b<br />
235 b<br />
302 b<br />
359 b<br />
b b<br />
b b<br />
b b<br />
b b<br />
b b<br />
1,542 b<br />
2,081 10<br />
2,<strong>20</strong>5 12<br />
2,506 16<br />
2,846 13<br />
3,011 4<br />
3,151 3<br />
3,315 b<br />
Imports<br />
Fuel ethanol MTBE”<br />
Aver-age annual percentage change<br />
b b<br />
b b<br />
b<br />
b<br />
b<br />
b<br />
b<br />
b<br />
b<br />
b<br />
b<br />
b<br />
b<br />
b<br />
b<br />
b<br />
b<br />
306<br />
595<br />
692<br />
733<br />
918<br />
1,040<br />
b<br />
Source:<br />
Production - 1992-99 Ethanol and MTBE: U.S. Department of Energy, Energy<br />
In<strong>for</strong>mation Administration, Petroleum Supply Monthly, Washington, DC,<br />
January 1999, Table Dl. 1978-90 Ethanol: ln<strong>for</strong>mation Resources, Inc.,<br />
Washington, DC, 199 1. 198 l-86 MTBE: EA-Mueller,Inc., Baltimore, MD,<br />
1992.<br />
Imports - U.S. Department of Energy, Energy In<strong>for</strong>mation Administration,<br />
Petroleum Supply Annual, 1998, Volume I, Washington, DC, 1999, Table <strong>20</strong>,<br />
and annual.<br />
“Methyl tertiary-butyl ether.<br />
bData are not available.<br />
<strong>TRANSPORTATION</strong><strong>ENERGY</strong><strong>DATA</strong>BOOIC <strong>EDITION</strong>~O-<strong>20</strong>00<br />
b
I Great<br />
care should be taken when comparing modal energy intensity data among modes. Because of the inherent differences between the<br />
transportation modes in the nature of services, routes available, and many additionalfactors, it is not possible to obtain truly comparable<br />
national energy intensities among modes.<br />
Automobiles<br />
Personal trucks<br />
Motorcycles<br />
Buses<br />
Transit<br />
Intercity<br />
School<br />
Air<br />
Certificated route<br />
General aviation<br />
Recreational boats<br />
Rail Intercityb<br />
Transit”<br />
Commuter<br />
Source:<br />
See Appendix A <strong>for</strong> Table 2.11.<br />
“Data are not available.<br />
“Amtrak only.<br />
‘Passenger train cars.<br />
“Passenger train car-miles.<br />
‘Revenue passenger-miles.<br />
‘Estimated using vehicle travel data<br />
%ght and heavy rail.<br />
Table 2.11<br />
Passenger Travel and Energy Use in the United States, 1998<br />
Vehicle- Passenger-<br />
Energy intensities<br />
Number of vehicles miles miles Load factor (Btu per (Btu per Energy use<br />
(thousands) (millions) (millions) (persons/vehicle) vehicle-mile) passenger-mile) (trillion Btu)<br />
131,838.5 1,545,830 2,473,328 1.6 5,873 3,671 9,078.4<br />
55,231.7 626,343 1,002,149 1.6 7,166 4,478 4,488.l<br />
3,879.5 10,260 12,312 1.2 2,505 2,087 25.7<br />
658.2 7,957 a P 243,457 a 194.6<br />
74.6 2,29 1 <strong>20</strong>,602 9.0 38,106 4,238 87.3<br />
19.2 1,366 31,700 23.2 16,545 713 22.6<br />
582.4 4,300 a a 19,698 a 84.7<br />
P B 477,695 a a 41,966 2,004.7<br />
a 5,031 464,395 92.3 369,171 3,999 1,857.3<br />
<strong>20</strong>4.7 a 13,300 a a 11,083 147.4<br />
12,565.9 a a a a a 305.9<br />
17.7 1.3’ 1,176 316d 26,765 5,325” 23.1 16.9 71,684 41,139 3,150 2,441 84.3 13.0’<br />
11.5 609 13,402 22.0 70,772 3,216 43.1<br />
4.9 251 8,038 32.0 112,351 3,508 28.2
Great care should be taken when comparing modal ener*a intensity data among modes. Because of the inherent d#eerences between the transportation modes<br />
in the nature of services, routes available, and many additionalfactors, it is notpossible to obtain truly comparable national energy intensities among modes.<br />
Automobiles<br />
(Btu per (Btu per<br />
vehicle- passengermile)<br />
mile)<br />
Light<br />
truck”<br />
(Btu per<br />
vehiclemile)<br />
Table 2.12<br />
Energy Intensities of Passenger Modes, 1970-98<br />
Buses<br />
Transi? Intercity<br />
(Btu per (Btu per (Btu per<br />
vehicle- passenger- passengermile)<br />
mile) mile)<br />
School<br />
(Btu per<br />
vehiclemile)<br />
Air Rail<br />
Certificated General Intercity Rail<br />
air carriers aviation Amtrak transit<br />
(Btu per (Btu per (Btu per (Btu per<br />
passenger-mile) passenger-mile) passenger-mile)<br />
c<br />
passenger-mile)<br />
Year<br />
1970 9,301 4,896 12,492 3 1,796 2,472 1,051 17,857 10,351 10,374<br />
2,453<br />
1975 9,015 4,745 11,890 33,748 2,814<br />
976 17,040 7,883 10,658 3,677 2,962<br />
1976 9,130 4,805 11,535 34,598 2,896<br />
996 17,051 7,481 10,769 3,397 2,971<br />
1977 8,961 4,716 11,171 35,1<strong>20</strong> 2,889<br />
961 16,983 7,174 11,695 3,568 2,691<br />
1978 8,844 4,655 10,815 36,603 2,883<br />
953 17,018 6,333 11,305 3,683 2,210<br />
1979 8,647 4,551 10,473 36,597 2,795<br />
963 16,980 5,858 10,787 3,472 2,794<br />
1980 7,915 4,166 10,230 36,553 2,813 1,069 16,379 5,837 11,497 3,176 3,008<br />
1981 7,672 4,038 10,001 37,145 3,027 1,155 16,385 5,743 11,123 2,957 2,946<br />
1982 7,485 3,939 9,275 38,766 3,237 1,149 16,296 5,147 13,015 3,156 3,069<br />
1983 7,376 4,098 9,141 31,962 3,177 1,174 16,236 5,107 11,331 2,957 3,212<br />
1984 7,218 4,010 8,945 37,507 3,<strong>20</strong>4 1,247 14,912 5,03 1 11,454 3,027 3,732<br />
1985 7,182 3,990 8,754 38,862 2,421 1,324 16,531 5,679 11,707 2,800 3,461<br />
1986 7,213 4,007 8,578 39,869 3,512<br />
869 15,622 5,447 11,935 2,574 3,531<br />
1987 6,975 3,875 8,376 38,557 3,542<br />
939 15,615 4,753 11,496 2,537 3,534<br />
1988 6,700 3,722 8,155 39,121 3,415<br />
965 15,585 4,814 11,794 2,462 3,585<br />
1989 6,602 3,668 7,779 36,583 3,711<br />
963 15,575 4,796 10,229 2,731 3,397<br />
1990 6,183 3,864 7,774 36,647 3,735<br />
944 16,368 4,811 10,146 2,609 3,453<br />
1991 5,925 3,703 7,381 36,939 3,811<br />
978 16,419 4,560 9,869 2,503 3,710<br />
1992 5,970 3,731 7,263 40,472 4,303<br />
978 16,386 4,482 9,785 2,610 3,575<br />
1993 6,103 3,814 7,<strong>20</strong>8 39,005 4,257<br />
972 19,093 4,304 9,653 2,646 3,687<br />
1994 6,041 3,775 7,232 40,102 4,604<br />
876 <strong>20</strong>,591 4,455 9,163 2,351 3,828<br />
1995 5,923 3,702 7,237 40;175 4,650<br />
804 13,680 4,236 10,152 2,314 3,818<br />
1996 5,874 3,671 7,247 39,307 4,512<br />
785 13,680 4,08 1 10,481 2,389 3,444<br />
1997 5,822 3,639 6,981 38,101 4,318<br />
726 16,432 4,047 9,688 2,458 3,253<br />
1998 5,873 3,671 7,166 382106 4,238<br />
713 19,698 3,999 11,083 2,460 3,216<br />
Avenge nnnunlpercentnge change<br />
1970-98 -1.6% -1.0% -2.0% 0.6% 1.9% -1.4% -0.3% -3.3% -0.2% -1.5%d 1.0%<br />
1988-98<br />
Source:<br />
-1.3% -0.1% -1.3% -0.3% 2.2% -3.0% 2.4% -1.9% -0.6% 0.0% -1.1%<br />
See Appendix A <strong>for</strong> Table 2.12.<br />
“All two-axle, four-tire trucks.<br />
‘Series not continuous between 1983 and 1984 because of a change in data source by the American Public Transit Association (APTA)<br />
‘Data are not available.<br />
‘Average annual percentage change is from earliest year possible.<br />
N
Knoxville, TN -<br />
Boston, MA<br />
Washington, DC<br />
Chicago, IL<br />
New York, NY<br />
National bus average -<br />
St. Louis, MO -<br />
San Francisco, CA<br />
National rail average -<br />
0<br />
Figure 2.2. Energy Intensity <strong>for</strong> Transit in the U.S., 1998<br />
5,000 10,000<br />
Btu per passenger-mile<br />
Source:<br />
U.S. Department of Transportation, Federal Transit Administration, 1998 National Transit Database, Washington, DC.<br />
(Additional resources: www.fta.dot.gov/ntl)
I Great<br />
care should be taken when comparing modal energy intensity data among modes. Because of the inherent dzzerences between-the transportation modes<br />
in the nature ofservices, routes available, and many additionalfactors, it is notpossible to obtain truly comparable national energy intensities among modes.<br />
Table 2.13<br />
Intercity Freight Movement and Energy Use in the United States, 1998<br />
Number of<br />
vehicles Vehicle-miles Ton-miles Tons shipped Average length Energy intensity Energy use<br />
(thousands) (millions) (millions) (millions) of haul (miles) (Btu/ton-mile) (trillion Btu)<br />
Truck” 2,388 133,890 1,027,OOO 3,952 701b 2,990 3,070.6<br />
d<br />
Waterborne commercec 42 672,795 1,087 619 436 293.1<br />
d d d d<br />
Coastwise 3 14,864 250 1,261<br />
d d d d<br />
Lakewise 61,654 122 504<br />
d d d d<br />
Internal and local 294,896 715 416<br />
d d d d d d<br />
Pipeline 847.5<br />
d d d d d d<br />
Natural gas 689.1<br />
d d d<br />
Crude oil and products 6<strong>20</strong>,000 1,116 256 158.4<br />
Class I railroads’ 576 32,657 1,376,802 1,649 835 365 502.0<br />
Source:<br />
See Appendix A <strong>for</strong> Table 2.13.<br />
“The definition of intercity truck was “tightened” to exclude smaller trucks. See Appendix A <strong>for</strong> details.<br />
b701 miles is <strong>for</strong> general freight (less than truckload). Based on data from the Eno Transportation Foundation, the average length of<br />
haul <strong>for</strong> specialized freight (truckload) was 285 miles.<br />
“Includes commerce by <strong>for</strong>eign and domestic carriers in the U.S.<br />
dData are not available.<br />
“Railroad measures are: number vehicles = number freight cars, vehicle-miles = car-miles, ton-miles = revenue ton-miles.
I Great<br />
care should be taken when comparing modal energy intensity data among modes. Because ojthe inherent<br />
dtjferences between the transportation modes in the nature of services, routes available, and many additional<br />
jactors, it is not possible to obtain truly comparable national energy intensities among modes.<br />
Year<br />
1970<br />
Heavy single-unit and<br />
combination trucks<br />
(Btu per vehicle-mile)<br />
24,154<br />
Table 2.14<br />
Energy Intensities of Freight Modes, 1970-98<br />
1971 23,694 18,814<br />
1972 23,871 18,292<br />
1973 23,977 18,468<br />
1974 23,983 18,852<br />
1975 23,836 18,741<br />
1976 23,773 18,938<br />
1977 23,873 19,225<br />
197s 24,013 18,930<br />
1979 24,260 19,187<br />
1980 24,431 18,742<br />
1981 24,892 18,628<br />
1982 24,296 18,403<br />
1983 23,740 17,863<br />
1984 23,363 17,797<br />
1985 23,015 17,500<br />
1986 22,917 17,265<br />
1987 22,391 16,791<br />
1988 22,586 16,758<br />
1989 22,391 16,896<br />
1990 22,765<br />
1991 22,710<br />
1992 22,559<br />
1993 22,308<br />
1994 22,159<br />
1995 22,172<br />
1996 21,964<br />
1997 21,340<br />
1998 21,514<br />
1970-9s -0.4%<br />
1988-98 -0.5%<br />
Source:<br />
See Appendix A <strong>for</strong> Table 2.14.<br />
Class I freight railroad Domestic waterborne<br />
commerce<br />
(Btu per freight car-mile) (Btu per ton-mile) (Btu per ton-mile)<br />
17,668 691 545<br />
1’6,618<br />
5,834<br />
6,044<br />
6,055<br />
6,338<br />
15,993<br />
15,747<br />
15,783<br />
15,372<br />
Average annualpercentage change<br />
-0.5%<br />
-0.9%<br />
717<br />
714<br />
677<br />
681<br />
687<br />
680<br />
669<br />
641<br />
618<br />
597<br />
572<br />
553<br />
525<br />
510<br />
497<br />
486<br />
456<br />
443<br />
437<br />
4<strong>20</strong><br />
391<br />
393<br />
389<br />
388<br />
372<br />
368<br />
370<br />
<strong>TRANSPORTATION</strong><strong>ENERGY</strong><strong>DATA</strong>BOOIC <strong>EDITION</strong>~O-<strong>20</strong>00<br />
365<br />
506<br />
522<br />
576<br />
483<br />
549<br />
468<br />
458<br />
3S3<br />
457<br />
358<br />
360<br />
310<br />
319<br />
346<br />
446<br />
463<br />
402<br />
361<br />
403<br />
388<br />
386<br />
398<br />
389<br />
369<br />
374<br />
412<br />
415<br />
436<br />
-2.3% -0.8%<br />
-1.9% 1.9%
Source<br />
Chapter 3<br />
Greenhouse Gas Emissions<br />
Summary Statistics from Tables in this Chapter<br />
Table 3.1 Greenhouse gas emissions (million metric tonnes) 1990 1997<br />
France 554 550<br />
Germany 1,<strong>20</strong>1 1,036<br />
United Kingdom 727 657<br />
Japan 1,175 1,280<br />
United States 5,903 6,514<br />
Table 3.5 Transportation share of U.S. carbon dioxide emissions from fossil fuel<br />
consumption<br />
1984 30.5%<br />
1990 32.2%<br />
1998 32.6%<br />
Table 3.6 Carbon dioxide emissions from U.S. transportation energy use, 1998<br />
Motor gasoline 60.8%<br />
LiquiJed petroleum gas 0.0%<br />
Jet fuel 13.2%<br />
Distillate fuel <strong>20</strong>.0%<br />
Residual fuel 3.1%<br />
Lubricants 0.4%<br />
Aviation gas 0.2%<br />
Natural gas 2.2%<br />
Electricity 0.1%<br />
<strong>TRANSPORTATION</strong> <strong>ENERGY</strong> <strong>DATA</strong> <strong>BOOK</strong>: <strong>EDITION</strong> <strong>20</strong>-<strong>20</strong>00<br />
3-l<br />
i<br />
md 7-p /
3-2<br />
Australia<br />
Austria<br />
Canada<br />
Denmark<br />
France<br />
Germany<br />
Greece<br />
Ireland<br />
Italy<br />
Japan<br />
Netherlands<br />
New Zealand<br />
Norway<br />
Poland<br />
Portugal<br />
Russian Federation<br />
Spain<br />
Sweden<br />
Switzerland<br />
United Kingdom<br />
United States<br />
Table 3.1<br />
International Man-Made Emissions of Greenhouse Gases, 1990-97”<br />
(CO, equivalent)<br />
1990<br />
(million<br />
metric tonnes)<br />
410.80<br />
73.73<br />
590.55<br />
71.66<br />
553.58<br />
1,<strong>20</strong>1.12<br />
103.80<br />
56.86<br />
532.89<br />
1,175.02<br />
<strong>20</strong>8.31<br />
71.89<br />
47.13<br />
459.05<br />
68.44<br />
2,998.77<br />
301.43<br />
69.47<br />
53.75<br />
726.64<br />
5,902.99<br />
1991 1992 1993 1994 1995 1996 1997<br />
100<br />
106<br />
99<br />
115<br />
104<br />
96<br />
100<br />
99<br />
b<br />
102<br />
103<br />
100<br />
97<br />
b<br />
103<br />
b<br />
(percentage relative to 1990, 1990=100)<br />
101<br />
98<br />
102<br />
108<br />
102<br />
91<br />
101<br />
100<br />
b<br />
103<br />
102<br />
101<br />
97<br />
96<br />
109<br />
b<br />
102<br />
97<br />
103<br />
1 10<br />
98<br />
89<br />
02<br />
00<br />
b<br />
102<br />
103<br />
101<br />
102<br />
b<br />
105<br />
b<br />
100 103 100<br />
93 94 94<br />
103 101 98<br />
100 97 93<br />
99 101 103<br />
Source:<br />
United Nations Framework Convention on Climate Change, Greenhouse Gas Inventory Database,<br />
www.unfccc.delresource, April <strong>20</strong>00, October 1998. (Additional resources: www.unfccc.de)<br />
“Includes National totals of C02, CH4, and N<strong>20</strong>, excluding land-use change and <strong>for</strong>estry.<br />
“Data are not available.<br />
103<br />
99<br />
106<br />
115<br />
97<br />
88<br />
103<br />
103<br />
97<br />
108<br />
103<br />
101<br />
106<br />
96<br />
106<br />
70<br />
104<br />
<strong>TRANSPORTATION</strong> <strong>ENERGY</strong> <strong>DATA</strong> <strong>BOOK</strong>: <strong>EDITION</strong> <strong>20</strong>-<strong>20</strong>00<br />
98<br />
97<br />
93<br />
105<br />
106<br />
101<br />
109<br />
110<br />
99<br />
88<br />
105<br />
104<br />
102<br />
108<br />
107<br />
101<br />
107<br />
b<br />
b<br />
b<br />
108<br />
97<br />
98<br />
91<br />
106<br />
108<br />
103<br />
112<br />
129<br />
101<br />
89<br />
107<br />
105<br />
b<br />
109<br />
111<br />
103<br />
113<br />
95<br />
b<br />
b<br />
b<br />
b<br />
105<br />
114<br />
117<br />
99<br />
86<br />
b<br />
b<br />
b<br />
109 b<br />
105<br />
114<br />
93<br />
111 100<br />
b<br />
b<br />
b<br />
99 96<br />
94 90<br />
109 110
1990<br />
(million<br />
metric tonnes)<br />
Australia 275.34<br />
Austria 62.04<br />
Canada 461.25<br />
Denmark 52.28<br />
France 395.5 1<br />
Germany 1,014.50<br />
Greece 85.35<br />
Ireland 30.72<br />
Italy 432.61<br />
Japan 1,124.53<br />
Netherlands 40.40<br />
New Zealand 25.24<br />
Norway 35.<strong>20</strong><br />
Poland 380.70<br />
Portugal 47.12<br />
Russian Federation 2,372.30<br />
Spain 226.42<br />
Sweden 55.44<br />
Switzerland 45.07<br />
United Kingdom 584.17<br />
United States 4,928.90<br />
Table 3.2<br />
International Man-Made Emissions of Carbon Dioxide, 1990-97”<br />
1991 1992 1993 1994 1995 1996 1997<br />
(percentage relative to 1990, 1990=100)<br />
101 102 103<br />
107 98 96<br />
98 101 101<br />
1<strong>20</strong> 110 114<br />
106 104 99<br />
96 91 90<br />
100 102 102<br />
103 105 104<br />
102<br />
103<br />
102<br />
95<br />
b<br />
104<br />
b b b<br />
b<br />
100 104 100<br />
100 101 101<br />
104 101 98<br />
101 98 96<br />
99 100 103<br />
Source:<br />
United Nations Framework Convention on Climate Change, Greenhouse Gas Inventory Database,<br />
www.unfccc.defresource, April <strong>20</strong>00. (Additional resources: www.unfccc.de)<br />
“Includes National totals of C02, excluding land-use change and <strong>for</strong>estry.<br />
“Data are not available.<br />
103<br />
106<br />
110<br />
97<br />
98<br />
112<br />
b<br />
102<br />
110<br />
107<br />
102<br />
b<br />
107<br />
b<br />
104<br />
98<br />
104<br />
121<br />
98<br />
89<br />
104<br />
108<br />
96<br />
108<br />
107<br />
107<br />
108<br />
98<br />
108<br />
70<br />
105<br />
106<br />
96<br />
95<br />
104<br />
<strong>TRANSPORTATION</strong><strong>ENERGY</strong><strong>DATA</strong><strong>BOOK</strong>: <strong>EDITION</strong>~O-<strong>20</strong>00<br />
108<br />
101<br />
107<br />
114<br />
100<br />
89<br />
106<br />
111<br />
101<br />
108<br />
110<br />
107<br />
109<br />
b<br />
b<br />
b<br />
109<br />
105<br />
98<br />
94<br />
106<br />
112<br />
103<br />
110<br />
140<br />
103<br />
91<br />
108<br />
113<br />
b<br />
110<br />
113<br />
115<br />
117<br />
98<br />
b<br />
b<br />
b<br />
b<br />
106<br />
113<br />
123<br />
102<br />
88<br />
b<br />
b<br />
b<br />
109<br />
0<br />
1<strong>20</strong><br />
118<br />
95<br />
114 102<br />
b<br />
b<br />
100 96<br />
97 93<br />
109 111<br />
b<br />
3-3
Table 3.3<br />
International Man-Made Emissions of Carbon Dioxide by Source Category, 1990 and 1997”<br />
Energy (excl transport) Transport Industrial processes<br />
1990 1997 1990 1997 1990 1997<br />
(MMT) % (MMT) % (MMT) % (MMT) % (MMT) % (MMT) %<br />
Australiab <strong>20</strong>9 75.9 234 75.9<br />
Austria 35 56.2 38 57.7<br />
Canada 275 59.6 306 58.9<br />
Denmark 41 77.8 51 78.7<br />
France 241 61.8 241 59.8<br />
Germany 824 81.3 694 77.6<br />
Greeceb 62 72.7 66 72.1<br />
Irelandb 24 78.6 26 76.1<br />
Italyb 307 70.9 303 69.1<br />
Japan 846 75.2 899 73.1<br />
Netherlandsb 129 80.2 149 80.3<br />
New Zealand 14 56.3 16 51.9<br />
Norway 15 41.5 18 43.9<br />
Poland 342 89.9 324 89.7<br />
Portugal 29 62.3 30 59.6<br />
Russian Federationb 2,326 98.0 1,619 97.5<br />
Spainb 150 66.1 166 66.9<br />
Sweden 33 59.0 33 58.8<br />
Switzerland 26 57.1 24 56.5<br />
United Kingdom 453 77.6 405 74.9<br />
60<br />
14<br />
147<br />
10<br />
123<br />
162<br />
15<br />
5<br />
96<br />
<strong>20</strong>7<br />
29<br />
9<br />
14<br />
29<br />
14<br />
-<br />
58<br />
19<br />
15<br />
116<br />
United States<br />
Source:<br />
3,390 68.6 3,756 68.8 1,499 30.3 1,635 30.0 55 1.1 65 1.2<br />
United Nations Framework Convention on Climate Change, Greenhouse Gas Inventory Database, www.unfccc.de/resource, April <strong>20</strong>00.<br />
(Additional resources: www.unfccc.de)<br />
‘National totals excluding land-use change and <strong>for</strong>estry.<br />
21.6<br />
22.4<br />
31.9<br />
<strong>20</strong>.0<br />
31.5<br />
16.0<br />
17.8<br />
15.9<br />
22.1<br />
18.4<br />
17.7<br />
34.2<br />
39.2<br />
7.6<br />
29.8<br />
0.0<br />
25.7<br />
33.6<br />
32.5<br />
19.9<br />
67<br />
16<br />
174<br />
12<br />
138<br />
175<br />
17<br />
7<br />
110<br />
251<br />
33<br />
11<br />
15<br />
27<br />
17<br />
-<br />
64<br />
<strong>20</strong><br />
15<br />
124<br />
21.8 7 2.4 7 2.3<br />
23.9 13 <strong>20</strong>.5 12 17.6<br />
33.5 32 6.9 38 7.3<br />
18.8 1 1.9 2 2.4<br />
34.3 21 5.4 18 4.4<br />
19.G 28 2.7 25 2.8<br />
18.8 8 9.1 8 8.8<br />
18.8 2 5.3 2 5.0<br />
25.1 28 6.4 23 5.2<br />
<strong>20</strong>.4 59 5.2 GO 4.8<br />
18.1 2 1.2 2 0.9<br />
37.1 2 9.5 1 2.3<br />
36.9 7 18.9 8 18.7<br />
7.4 9 2.4 11 2.9<br />
33.1 3 7.3 3 6.7<br />
0.0 46 2.0 24 1.4<br />
25.9 18 7.8 17 7.0<br />
34.6 4 6.8 4 6.6<br />
35.2 3 7.5 2 5.1<br />
22.9 14 2.4 12 2.2<br />
Total<br />
1990 1997<br />
(MMT) (MMT)<br />
b1997 data were not available. Australia, Greece, Ireland, and the Netherlands data are 1996; Italy and Spain data are 1995; and Russian Federation data are 1994.<br />
275<br />
62<br />
461<br />
52<br />
391<br />
1,014<br />
85<br />
31<br />
433<br />
1,125<br />
161<br />
25<br />
35<br />
381<br />
47<br />
2,372<br />
226<br />
55<br />
45<br />
583<br />
4,943<br />
308<br />
66<br />
519<br />
64<br />
402<br />
894<br />
92<br />
35<br />
438<br />
1,231<br />
185<br />
30<br />
41<br />
362<br />
51<br />
1,660<br />
248<br />
56<br />
43<br />
541<br />
5,456
Table 3.4<br />
Estimated U.S. Emissions of Greenhouse Gases, 1990-98<br />
Greenhouse gas Unit of measurea 1990 1991 1992 1993 1994 1995 1996 1997 1998<br />
Carbon dioxide million metric tons of gas 4,939.0 4,886.0 4,972.9 5,109.5 5,169.7<br />
million metric tons of carbon 1,347.0 1,333.O. 1,356.0 1,389.0 1,410.o<br />
Methane million metric tons of gas 30.2 30.5 30.6 29.9 30.0<br />
million metric tons of carbon (gwp)” 173.0 174.0 175.0 171.0 172.0<br />
Nitrous oxide million metric tons of gas<br />
million metric tons of carbon (gwp)b<br />
Carbon monoxide million metric tons of gas<br />
Nitrogen oxide million metric tons of gas<br />
Nonmethane VOCsd million metric tons of gas<br />
CFC-11,12,113d million metric tons of gas<br />
HCFC-22d million metric tons of gas<br />
HCFC-23 ana PFCsd million metric tons of carbon (gwp)”<br />
1.2 1.2<br />
99.0 101.0<br />
86.8 88.6<br />
21.2 21.3<br />
18.9 19.0<br />
0.2 0.2<br />
0.1 0.1<br />
22.0 22.0<br />
1.2 1.2 1.3<br />
103.0 103.0 111.0<br />
85.5 85.6 89.5<br />
21.6 21.8 22.1<br />
18.6 18.8 19.4<br />
0.1 0.1 0.1<br />
0.1 0.1 0.1<br />
23.0 24.0 26.0<br />
5,2<strong>20</strong>.5 5,395.6 5,464.g<br />
1,424.0 1,472.0 1,490.o<br />
30.2 29.3 29.3<br />
173.0 168.0 168.0<br />
1.3 1.2 1.2<br />
106.0 105.0 104.0<br />
80.7 82.3 79.2<br />
21.5 21.3 21.4<br />
18.6 17.4 17.3<br />
0.1 0.1 0.0<br />
0.1 0.1 0.1<br />
32.0 36.0 38.0<br />
Source:<br />
U.S. Department of Energy, Energy In<strong>for</strong>mation Administration, Emissions of Greenhouse Gases in the United States, 1998, Washington, DC, October<br />
1999, p. ix, x. (Additional resources: www.eia.doe.gov)<br />
Criteria pollutants (CO, NO,, VOC) -U.S. Environmental Protection Agency, NationaZAiu Pollutant Emission Trends, 1900-1997, 1998, pp. A-6, A-l 1,<br />
A- 18. (Additional resources: www.epa.govloarloaqps)<br />
aGases that contain carbon can be measured either in terms of the full molecular weight of the gas or just in terms of their carbon content. See<br />
Appendix B, Table B.5 <strong>for</strong> details.<br />
bBased on global warming potential.<br />
‘Data are not available.<br />
dVOC=volatile organic compounds. CFC=chlorofluorocarbons. HCFC=hydrochlorofluorocarbons. HFC=hydrofluorocarbons.<br />
PFC=perfluorocarbons.<br />
5,483.4<br />
1,495.0<br />
28.8<br />
165.0<br />
1.2<br />
103.0<br />
c<br />
c<br />
c<br />
0.0<br />
0.1<br />
40.0
I Gases<br />
which contain carbon can be measured in terms of the full molecular weight of the gas oy just in. terms of their carbon content. This<br />
tablepvesents carbon content. The ratio of the weight of carbon to carbon dioxide is 0.2727.<br />
Table 3.5<br />
U.S. Carbon Dioxide Emissions from Fossil Energy Consumption<br />
by End-Use Sector, 1984-98”<br />
(million metric tons of carbon)<br />
End use 1984 1985 1986 1987 1988 1989 1990 1991 1992 1993 1994 1995 1996 1997 1998<br />
Energy consumption sectors<br />
Residential 241.1 245.8 244.0 251.0 264.8 267.5 253.1 257.1 255.9 271.7 268.3 270.3 285.9 284.8 284.5<br />
Commercial 188.8 189.6 190.4 197.2 <strong>20</strong>7.6 210.1 <strong>20</strong>6.7 <strong>20</strong>6.4 <strong>20</strong>5.4 211.3 213.8 217.9 226.0 238.0 238.4<br />
Industrial 434.4 424.1 409.0 422.7 444.1 450.4 453.7 442.2 459.8 458.9 467.1 466.0 480.0 483.7 477.7<br />
Transportation 379.0 384.4 399.1 411.1 427.5 432.7 432.8 424.3 431.1 436.4 449.1 457.6 468.7 473.4 484.9<br />
Percentage 30.5% 30.9% 32.1% 32.1% 31.8% 31.8% 32.2% 31.9% 31.9% 31.7% 32.1% 32.4% 32.1% 32.0% 32.6%<br />
Total energy lQ243.3 1,243.g 1,242.5 1,282.O 1,344.0 1,360.g 1,345.2 1,330.O 1,351.3 1,378.2 1,398.3 1,411.7 1,460.5 1,478.0 1,485.4<br />
Electric utility sector<br />
Electric utilityb 427.9 438.9 435.4 452.6 475.9 484.0 476.7 473.3 472.8 490.5 494.0 495.2 513.0 532.8 549.8<br />
Source:<br />
U.S. Department of Energy, Energy In<strong>for</strong>mation Administration, Emissions of Greenhouse Gases in the United States, 1998, Washington, DC,<br />
October 1999, p. 22, and annual. (Additional resources: www.eia.doe.gov)<br />
“Includes energy from petroleum, coal, and natural gas. Electric utility emissions are distributed across consumption sectors.<br />
bDoes not include estimates of carbon dioxide emissions from the use of flue gas desulfurization.<br />
I
Fuel<br />
Motor<br />
gasoline<br />
LPG”<br />
Jet fuel<br />
Distillate fuel<br />
Residual fuel<br />
Lubricants<br />
Aviation gas<br />
Total<br />
Natural gas<br />
Electricity<br />
Total<br />
Table 3.6<br />
U.S. Carbon Dioxide Emissions from Energy Use in the Transportation Sector, 1980-98<br />
(million metric tons of carbon)<br />
1980 1985 1990 1995 1998<br />
Emissions Percentage Emissions Percentage Emissions Percentage Emissions Percentage Emissions Percentage<br />
238.1 62.9%<br />
0.3 0.1%<br />
42.0 11.1%<br />
55.3 14.6%<br />
30.0 7.9%<br />
1.8 0.5%<br />
1.2 0.3%<br />
368.7 97.4%<br />
9.4 2.5%<br />
0.3 0.1%<br />
378.4 100.0%<br />
Petroleum<br />
245.1 63.8% 260.9 60.4% 279.9 61.1% 294.6 60.8%<br />
0.5 0.1% 0.4 0.1% 0.3 0.1% 0.2 0.0%<br />
48.0 12.5% 60.1 13.9% 60.0 13.1% 64.2 13.2%<br />
63.3 16.5% 75.7 17.5% 85.1 18.6% 96.9 <strong>20</strong>.0%<br />
16.7 4.3% 21.9 5.1% 19.7 4.3% 14.9 3.1%<br />
1.6 0.4% 1.8 0.4% 1.7 0.4% 1.8 0.4%<br />
0 . 9 0.2% 0.8 0.2% 0.7 0.2% 0.7 0.2%<br />
376.1 97.8% 421.5 97.5% 447.4 97.6% 473.4 97.6%<br />
Other energy<br />
7.5 2.0% 9.8 2.3% 10.4 2.3% 10.8 2.2%<br />
0.7 0.2% 0.7 0.2% 0.6 0.1% 0.7 0.1%<br />
384.4 100.0% 432.1 100.0% 458.5 100.0% 484.9 100.0%<br />
Source:<br />
U.S. Department of Energy, Energy In<strong>for</strong>mation Administration, Emissions of Greenhouse Gases in the United States, 1998, Washington, DC,<br />
October 1999, p. 24, and annual. (Additional resources: www.eia.doe.gov)<br />
aLiquified petroleum gas.
3-8<br />
Global Warming Potentials (GWP) were developed to allow comparison of each greenhouse gas’<br />
ability to trap heat in the atmosphere relative to carbon dioxide. Extensive research has been<br />
per<strong>for</strong>med and it has been discovered that the effects of various gases on global warming are too<br />
complex to be precisely summarized by a single number. Further understanding of the subject also<br />
causes frequent changes to estimates. Despite that, the scienttfk community has developed<br />
approximations, which are shown below. Most analysts use the loo-year time horizon.<br />
Carbon Dioxide<br />
Methane<br />
Nitrous Oxide<br />
Table 3.7<br />
Numerical Estimates of Global Warming Potentials Compared With Carbon Dioxide<br />
(kilogram of gas per kilogram of carbon dioxide)<br />
Gas<br />
HFCs, PFCs, and other gases<br />
HFC-23<br />
HFC-125<br />
HFC-134a<br />
HFC-152a<br />
HFC-227ea<br />
Perfluoromethane<br />
Perfluoroethane<br />
Sulfur hexafluoride<br />
Direct effect <strong>for</strong> time horizons of<br />
Lifetime<br />
(years) <strong>20</strong> years 100 years 500 years<br />
Variable 1<br />
12 f 3 56<br />
1<strong>20</strong> 280<br />
264<br />
33<br />
15<br />
?L<br />
37<br />
50,000<br />
10,000<br />
3,<strong>20</strong>0<br />
9,<strong>20</strong>0 12,100 9,900<br />
4,800 3,<strong>20</strong>0 11<br />
3,300 1,300 4<strong>20</strong><br />
460 140 42<br />
4,300 2,900 950<br />
4,400 6,500 10,000<br />
6,<strong>20</strong>0 9,<strong>20</strong>0 14,000<br />
16,300 23,900 34,900<br />
Source:<br />
U.S. Department of Energy, Energy In<strong>for</strong>mation Administration, Emissions of Greenhouse Gases in the United<br />
States 1998, Washington, DC, October 1999, p. 8. Original source: Intergovernmental Panel on Climate<br />
Change. (Additional resources: www.eia.doe.gov, www.ipcc.ch)<br />
Note:<br />
The typical uncertainty <strong>for</strong> global warming potentials is estimated by the Intergovernmental Panel on Climate<br />
Change at f 35 percent.<br />
TRANSPOK~ATION <strong>ENERGY</strong> <strong>DATA</strong> <strong>BOOK</strong>: <strong>EDITION</strong> <strong>20</strong>-<strong>20</strong>00<br />
1<br />
21<br />
310<br />
1<br />
7<br />
170
The Greenhouse Gases, Regulated Emissions, and Energy Use<br />
in Transportation (GREET) Model<br />
The energy in greenhouse gas estimates of the most recent version (Version 1 Sa) of the GREET model<br />
are displayed in the next two tables. The model estimates the full fuel-cycle emissions and energy use<br />
associated withvarious transportation fuels and advanced transportation technologies <strong>for</strong> light-duty vehicles.<br />
It calculates fuel-cycle emissions of three greenhouse gases (carbon dioxide, methane, and nitrous oxide)<br />
and five criteria pollutants (volatile organic compounds, carbon monoxide, nitrogen oxides, sulfur oxides,<br />
and particulate matter measuring 10 microns or less). See Chapter 4 <strong>for</strong> the criteria pollutant data from<br />
GREET. The model also calculates the total fuel-cycle energy consumption, fossil fuel consumption, and<br />
petroleum consumption using various transportation fuels. The fuel cycles that are included in the GREET<br />
model are:<br />
. petroleum to conventional gasoline, re<strong>for</strong>mulated gasoline, conventional diesel, re<strong>for</strong>mulated diesel,<br />
liquefied petroleum gas, and electricity via residual oil;<br />
. natural gas to compressed natural gas, liquefied natural gas, liquefied petroleum gas, methanol, Fischer-<br />
Tropsch diesel, dimethyl ether, hydrogen, and electricity;<br />
. coal to electricity;<br />
. uranium to electricity;<br />
. renewable energy (hydropower, solar energy, and wind) to electricity;<br />
. corn, woody biomass, and herbaceous biomass to ethanol;<br />
. soybeans to biodiesel; and<br />
landfill gases to methanol.<br />
Near-term technologies are ones which may be applied to <strong>20</strong>00 model-year cars and Long-term<br />
technologies are ones which may be applied to <strong>20</strong> 10 model-year cars.<br />
For additional in<strong>for</strong>mation about the GREET model, see GREET 1.5 - Transportation Fuel-Cycle Model,<br />
Volume 1: Methodology, Development, Use and Results, ANL/ESD-39, Vol. 1, August 1999, or contact:<br />
Michael Q. Wang<br />
Argonne National Laboratory<br />
9700 South Cass Avenue, ES/362<br />
Argonne, IL 60439-48 15<br />
phone: 630-252-2819<br />
fax: 630-252-3443<br />
email: mqwang@anl.gov<br />
<strong>TRANSPORTATION</strong><strong>ENERGY</strong><strong>DATA</strong>BOOIC <strong>EDITION</strong>~O-<strong>20</strong>00<br />
3-9
3-10<br />
Emissions acronyms<br />
co2 carbon dioxide<br />
GHGs greenhouse gases<br />
Technologies acronyms<br />
BD<strong>20</strong><br />
CARFG2<br />
CD<br />
CID1<br />
CNG<br />
CNGV<br />
Dedi.<br />
DME<br />
El0<br />
E85<br />
E90<br />
ETBE<br />
EtOH<br />
EtOHV<br />
EV<br />
FCV<br />
FFV<br />
FRFG2<br />
FG<br />
FT50<br />
FTlOO<br />
GC<br />
GI<br />
GHGs<br />
GV<br />
I-I,<br />
HB<br />
HEV<br />
LFG<br />
LNG<br />
LNGV<br />
LPG<br />
LPGV<br />
M85<br />
M90<br />
MeOH<br />
MeOHV<br />
MTBE<br />
NG<br />
RFD<br />
SI<br />
SIDI<br />
WB<br />
Acronyms Used on Tables 3.8 and 3.9<br />
Geographical acronyms<br />
CA Cali<strong>for</strong>nia<br />
NE northeast<br />
us United States<br />
mixture of <strong>20</strong>% biodiesel and 80% conventional diesel (by volume)<br />
Cali<strong>for</strong>nia Phase 2 re<strong>for</strong>mulated gasoline<br />
conventional diesel<br />
compression ignition, direct injection<br />
compressed natural gas<br />
compressed natural gas vehicle<br />
dedicated<br />
dimethyl ether<br />
mixture of 10% ethanol and 90% gasoline (by volume)<br />
mixture of 85% ethanol and 15% gasoline (by volume)<br />
mixture of 90% ethanol and 10% gasoline (by volume)<br />
ethyl tertiary butyl ether<br />
ethanol<br />
ethanol vehicle<br />
electric vehicle<br />
fuel-cell vehicle<br />
flexible fuel vehicle<br />
Federal Phase 2 re<strong>for</strong>mulated gasoline<br />
flared gas<br />
mixture of 50% Fischer-Tropsch diesel and 50% conventional diesel (by volume)<br />
100% Fischer-Tropsch diesel<br />
grid-connected<br />
grid-independent<br />
greenhouse gases<br />
gasoline vehicle<br />
hydrogen<br />
herbaceous biomass<br />
hybrid electric vehicle<br />
land-fill gas<br />
liquefied natural gas<br />
liquefied natural gas vehicle<br />
liquefied petroleum gas<br />
liquefied petroleum gas vehicle<br />
mixture of 85% methanol and 15% gasoline by volume<br />
mixture of 90% methanol and 10% gasoline by volume<br />
methanol<br />
methanol vehicle<br />
methyl tertiary butyl ether<br />
natural gas<br />
re<strong>for</strong>mulated diesel<br />
spark ignition<br />
spark-ignition, direct-injection<br />
woody biomass<br />
<strong>TRANSPORTATION</strong> <strong>ENERGY</strong> <strong>DATA</strong> <strong>BOOK</strong>: <strong>EDITION</strong> <strong>20</strong>-<strong>20</strong>00
Table 3.8<br />
NEAR-TERM Technology C<strong>for</strong> MY <strong>20</strong>00 vehicles)<br />
Fuel-Cycle Energy and Greenhouse Gas Emission Changes of Alternative Transportation Fuels and Advanced Vehicle Technologies<br />
(percentage relative to conventional gasoline vehicles fueled with conventional gasoline)<br />
Total Emissions:<br />
GV: FRFG2, GV: FRFG2,<br />
MTBE EtOH<br />
Total Energy 0.0% 0.4%<br />
Fossil fuels 0.0% -3.5%<br />
Petroleum -11.0% -3.6%<br />
co2 1.8% -5.0%<br />
GHGs 2.2% -4.2%<br />
Total Emissions:<br />
Total Energy<br />
Fossil fuels<br />
Petroleum<br />
co2<br />
GHGs<br />
Bi-Fuel Dedi.<br />
CNGV on Dedi. LPGV:<br />
CIDI: CD CNG Dedi. CNGV LPGV: NG Crude<br />
-29.7% 8.6% 5.1% -9.6%<br />
-29.6% 6.9% 3.4% -9.2%<br />
-26.7% -99.3% -99.4% -98.2%<br />
-23.5% -9.9% -12.8% -11.6%<br />
-24.3% -4.1% -6.7% -11.0%<br />
M85 FFV: E85 FFV:<br />
NG Corn<br />
-8.6% 15.3% 17.8%<br />
-8.6% 16.0% -41.9%<br />
-3.4% -72.6% -74.3%<br />
-9.8% -1.9% -36.3%<br />
-9.6% -1.7% -25.8%<br />
GC SIDI<br />
HEV: GI SIDI GI SIDI<br />
CARFG2, HEV: HEV:<br />
El0 GV: EV: NE US EtOH, CA FRFG2, FRFG2, GI CID1<br />
Corn EV: US Mix Mix EV: CA Mix Mix MTBE EtOH HEV: CD<br />
2.0% -13.7% -14.2% -17.0% -35.8% -47.4% -47.2% -52.5%<br />
-3.4% -39.1% -46.4% -69.0% -52.6% -47.4% -49.2% -52.5%<br />
-6.3% -98.2% -96.8% -99.6% -61.7% -53.2% -49.3% -50.6%<br />
-2.9% -25.5% -41.5% -70.3% -54.0% -46.5% -50.0% -48.4%<br />
-1.9% -26.7% -41.9% -70.1% -53.1% -45.2% -48.6% -48.5%<br />
Source:<br />
Wang, Michael Q., GREET 1.5a Model Results, Argonne National Laboratory, Argonne, IL, April <strong>20</strong>00.<br />
Note: See page preceding Table 3.8 <strong>for</strong> acronym definitions.
Table 3.9<br />
LONG-TERM Technology (Jar MY <strong>20</strong>10 vehicles)<br />
Fuel-Cycle Energy and Greenhouse Gas Emission Changes of Alternative Transportation Fuels and Advanced Vehicle Technologies<br />
(percentage relative to gasoline vehicles fueled with re<strong>for</strong>mulated gasoline)<br />
Total Emissions:<br />
Dedi. Dedi. Dedi. Dedi. Dedi.<br />
Dedi. Dedi. Dedi. LPGV: MeOHY: MeOHV: EtOHV: EtOHV:<br />
Dedi. CNGV LNGV: NG LNGV: FG LPGV: NG Crude M90, NG M90, FG E90, Corn E90, WB<br />
Total Energy -8.5% -5.7% -89.8% -17.8% -16.9% 10.5% -77.5% 10.1% 90.7%<br />
Fossil fuels -9.4% -5.2% -90.0% -17.5% -16.9% 11.1% -77.7% -52.0% -88.7%<br />
Petroleum -99.4% -97.8% -95.9% -98.2% -1.3% -78.1% -78.1% -80.1% -76.1%<br />
co2 -25 .O% -24.5% -93.3% -21.0% -19.5% -8.1% -77.1% -49.8% -122.8%<br />
GHGs -22.0% -21.5% -90.0% -<strong>20</strong>.7% -19.4% -8.2% -75.5% -40.3% -115.4%<br />
Total Emissions:<br />
Total Energy<br />
Fossil fuels<br />
Petroleum<br />
co2<br />
GHGs<br />
Dedi.<br />
EtOHV:<br />
E90. HB<br />
GI SIDI<br />
SIDI: Dedi. MeOH Dedi. MeOH Dedi. EtOH Dedi. EtOH Dedi. EtOH HEV:<br />
FRFG2, SIDI: M90, SIDI: M90, SIDI: E90, SIDI: E90, SIDI: E90, FRFG2, GI SI HEV:<br />
EtOH NG FG corn HB EtOH CNG<br />
77.6% -<strong>20</strong>.0% -5.2% -82.7% -3.1% 67.8% 56.3% -47.4% -43.5%<br />
-80.5% -<strong>20</strong>.0% -4.7% -135.5% -57.8% -90.1% -82.8% -47.4% -44.0%<br />
-78.5% -<strong>20</strong>.0% -82.1% -82.1% -82.5% -78.9% -81.1% -47.4% -99.6%<br />
-94.9% -<strong>20</strong>.0% -21.4% -82.1% -55.8% -1<strong>20</strong>.1% -95.5% -47.4% -53.7%<br />
-80.7% -19.5% -21.2% -80.5% -47.2% -113.3% -82.8% -46.3% -51.0%<br />
Table continued on next page. See page preceding Table 3.8 <strong>for</strong> acronym definitions.
Table 3.9 (continued)<br />
LONG-TERM Technology ($or MY <strong>20</strong>10 vehicles)<br />
Fuel-Cycle Energy and Greenhouse Gas Emission Changes of Alternative Transportation Fuels and Advanced Vehicle Technologies<br />
(percentage relative to gasoline vehicles fueled with re<strong>for</strong>mulated gasoline)<br />
Total Emissions:<br />
GI SIDI GI SIDI GI SIDI GI SIDI GI SIDI<br />
GI SI HEV: GI SI HEV: GI SI HEV: GI SI HEV: HEV: M90, HEV: M90, HEV: E90, HEV: E90, HEV: E90,<br />
LNG, NG LNG, FG LPG, NG LPG, Crude NG FG corn HJ3<br />
Total Energy -41.8% -93.7% -46.8% -46.2% -54.0% -54.1% -36.3% 10.4% 2.8%<br />
Fossil fuels -4 1.4% -93.8% -46.6% -46.3% -35.7% -121.7% -72.2% -93.5% -88.7%<br />
Petroleum -98.7% -97.5% -98.8% -36.1% -87.3% -87.3% -88.5% -86.1% -87.5%<br />
co2 -53.4% -95.9% -48.9% -47.9% -46.8% -86.8% -71.0% -113.3% -97.1%<br />
GHGs -50.7% -93 .O% -47.9% -47.1% -46.0% -85.0% -64.5% -107.9% -87.9%<br />
Total Emissions:<br />
Total Energy<br />
Fossil fuels<br />
Petroleum<br />
co2<br />
GHGs<br />
GC SIDI GC SIDI<br />
GC SIDI HEV: RFG2, HEV: RFG2, GC SI HEV: GC SI HEV: GC SI HEV: GC SI HEV: GC SI HEV: GC SI HEV:<br />
HEV: RFG2, EtOH, NE EtOH, CA CNG, US CNG, NE CNG, CA LNG, NG, LNG, FG, LNG, NG,<br />
EtOH. US Mix US Mix Mix Mix US Mix Mix US Mix US Mix NE US Mix<br />
-43.9% -44.4% -44.1% -40.9% -41.5% -41.2% -39.7% -77.2% -40.2%<br />
-47.5% -48.8% -55.3% -45.9% -47.3% -54.0% -44.0% -81.8% -45.2%<br />
-61.4% -61.3% -61.7% -99.3% -99.2% -99.7% -98.7% -97.8% -98.5%<br />
-44.5% -48.1% -55.6% -50.2% -53.9% -61.6% -50.0% -80.7% -53.2%<br />
-44.1% -47.5% -54.9% -48.6% -52.0% -59.6% -48.4% -78.9% -51.3%<br />
Table continued on next page. See page preceding Table 3.8 <strong>for</strong> acronym definitions.
Table 3.9 (continued)<br />
LONG-TERM Technology C<strong>for</strong> MY <strong>20</strong>10 vehicles)<br />
Fuel-Cycle Energy and Greenhouse Gas Emission Changes of Alternative Transportation Fuels and Advanced Vehicle Technologies<br />
(percentage relative to gasoline vehicles fueled with re<strong>for</strong>mulated gasoline)<br />
Total Emissions:<br />
GC SI HEV: GC SI HEV: GC SI HEV: GC SI HEV: GC SI HEV: GC SI HEV: GC SI HEV: GC SI HEV: GC SI HEV:<br />
LNG, FG, LNG, NG, LNG, FG, LPG, NG, LPG, Crude, LPG, NG, LPG, Crude, LPG, NG, LPG, Crude,<br />
NE US Mix CA Mix CA Mix US. Mix U.S. Mix NE US Mix NE US Mix CA Mix CA Mix<br />
E Total Energy -77.7% -40.0% -77.4% -43.3% -42.9% -43.9% -43.5% -43.6% -43.2%<br />
E<br />
2<br />
Fossil fuels<br />
Petroleum<br />
-83.1%<br />
-97.6%<br />
-51.0%<br />
-98.9%<br />
-89.4%<br />
-98.1%<br />
-47.7%<br />
-98.8%<br />
-47.5%<br />
-53.6%<br />
-49.0%<br />
-98.6%<br />
-48.8%<br />
-53.4%<br />
-55.0%<br />
-99.1%<br />
-55.0%<br />
-53.8%<br />
8<br />
F<br />
cl<br />
2<br />
co2<br />
GHGs<br />
-84.0%<br />
-82.1%<br />
-59.9%<br />
-57.9%<br />
-91.2%<br />
-89.1%<br />
-46.7%<br />
-46.4%<br />
-46.0%<br />
-45.8%<br />
-50.0%<br />
-49.4%<br />
-49.3%<br />
-48.9%<br />
-56.8%<br />
-56.1%<br />
-56.3%<br />
-55.8%<br />
E<br />
r. GC SIDI GC SIDI GC SIDI GC SIDI<br />
::<br />
=I<br />
%<br />
z<br />
GC SIDI GC SIDI HEV: M90, HEV: M90, GC SIDI GC SIDI<br />
HEV: M90, HEV: M90, NG, NE US FG, NE US HEV: M90, HEV: M90,<br />
NG, US Mix FG, US Mix Mix Mix NG, CA Mix FG, CA Mix<br />
HEV: E90, HEV: E90,<br />
Corn, US WB, us<br />
Mix Mix<br />
GC SIDI<br />
HEV: E90;<br />
HB, US Mix<br />
z<br />
z<br />
Total Emissions:<br />
Total Energy -35.7% -72.3% -36.2% -72.9% -35.9% -72.6% -35.9% -2.3% -7.8%<br />
Fossil fuels -40.0% -101.8% -41.2% -103.2% -47.1% -109.7% -66.2% -81.5% -78.1%<br />
Petroleum -90.5% -90.5% -90.3% -90.3% -90.8% -90.8% -91.3% -89.7% -90.7%<br />
c o 2 -45.3% -74.1% -48.5% -77.4% -55.2% -84.5% -62.7% -93.1% -81.5%<br />
GHGs -45.1% -73.1% -48.1% -76.3% -54.6% -83.2% -58.4% -89.6% -75.2%<br />
Table continued on next page. See page preceding Table 3.8 <strong>for</strong> acronym definitions.
Table 3.9 (continued)<br />
LONG-TERM Technology C<strong>for</strong> MY <strong>20</strong>10 vehicles)<br />
Fuel-Cycle Energy and Greenhouse Gas Emission Changes of Alternative Transportation Fuels and Advanced Vehicle Technologies<br />
(percentage relative to gasoline vehicles fueled with re<strong>for</strong>mulated gasoline)<br />
Total Emissions:<br />
GC SIDI GC SIDI GC SIDI GC SIDI GC SIDI<br />
HEV: E90, HEV: E90, HEV: E90, HEV: E90, HEV: E90, GC SIDI<br />
Com,NE WB,NEUS HB,NEUS Corn, CA WB, CA HEV: E90, ClDI: DME, CIDI: DME,<br />
US Mix Mix Mix Mix Mix HB, CAMix CIDI: RFD NG FG<br />
Total Energy -36.4% -i.6% -8.2% -36.1% -2.5% -8.0% -35.1% -17.1% -94.8%<br />
Fossil fuels -67.5% -82.4% -79.2% -73.7% -86.6% -84.6% -35.1% -16.6% -148.4%<br />
Petroleum -91.2% -89.5% -90.5% -91.6% -89.8% -90.9% -25 .O% -97.9% -97.9%<br />
co2 -66.0% -95.4% -84.4% -73 .O% -100.4% -90.6% -30.7% -33.5% -94.5%<br />
GHGs -61.5% -91.8% -77.9% -68.3% -96.6% -83.9% -31.6% -34.3% -93.4%<br />
Total Emissions:<br />
Total Energy<br />
Fossil fuels<br />
Petroleum<br />
GI CID1 GI CID1 GI CID1 GI CID1<br />
CIDI: CIDI: GI CID1 HEV: DME, HEV: DME, HEV: HEV: GI CID1<br />
FTlOO.NG FTlOO. FG CIDI: BD<strong>20</strong> HEV: RFD NG FG FTlOO, NG FTlOO, FG HEV: BD<strong>20</strong><br />
4.0% -92.0% -3 1.5% -57.7% -45.9% -96.6% -32.2% -94.8% -55.3%<br />
4.7% -145.6% -31.7% -57.7% -45.6% -131.6% -31.7% -129.8% -55.5%<br />
-97.5% -97.5% -36.7% -51.1% -98.6% -98.6% -98.4% -98.4% -58.7%<br />
co2 -<strong>20</strong>.9% -87.7% -38.9% -54.8% -56.7% -96.5% -48.4% -92.0% -60.2%<br />
GHGs -22.3% -87.3% -39.3% -55.0% -56.7% -95.3% -48.9% -91.3% -60.0%<br />
Table continued on next page. See page preceding Table 3.8 <strong>for</strong> acronym definitions.
Table 3.9 (continued)<br />
LONG-TERM Technology C<strong>for</strong> MY <strong>20</strong>10 vehicles)<br />
Fuel-Cycle Energy and Greenhouse Gas Emission Changes of Alternative Transportation Fuels and Advanced Vehicle Technologies<br />
(percentage relative to gasoline vehicles fueled with re<strong>for</strong>mulated gasoline)<br />
Total Emissions:<br />
GC CID1 GC CID1<br />
GC CID1 GC CID1 GC CID1 GC CID1 GC CID1 HEV: DME, HEV: DME, GC CID1 GC CID1<br />
HEV: RFD, HEV: RFD, HEV: RFD, HEV: DME, HEV: DME, NG, NE US FG, NE US HEV: DME, HEV: DME,<br />
US Mix NE US Mix CA Mix NG, US Mix FG, US Mix Mix Mix NG, CA Mix FG, CA Mix<br />
Total Energy -50.7% -51.3% -51.0% -42.1% -79.2% -42.7% -79.8% -42.4% -79.5%<br />
Fossil fuels -55.2% -56.6% -62.7% -46.4% -109.3% -47.7% -110.7% -53.5% -117.3%<br />
Petroleum -63.8% -63.6% -64.1% -98.6% -98.6% -98.5% -98.5% -98.9% -98.9%<br />
co2 -50.5% -53.8% -60.7% -51.9% -81.0% -55.0% -84.3% -61.7% -91.4%<br />
GHGs -51.0% -54.1% -60.9% -52.3% -80.5% -55.2% -83.7% -61.8% -90.6%<br />
Total Emissions:<br />
Total Energy<br />
Fossil fuels<br />
Petroleum<br />
co2<br />
GHGs<br />
GC CID1 GC CID1 GC CID1 GC CID1 GC CID1 GC CID1<br />
HEV: HEV: HEV: HEV: HEV: HEV: GC CID1 GC CID1 GC CID1<br />
FTlOO, NG, FTlOO, FG, FTlOO, NG, FTlOO, FG, FTlOO, NG, FTlOO, FG, HEV: BD<strong>20</strong>, HEV: BD<strong>20</strong>, HEV: BD<strong>20</strong>,<br />
US Mix US Mix NE US Mix NE US Mix CA Mix CA Mix US Mix NE US Mix CA Mix<br />
-32.1% -77.9% -32.6% -78.5% -32.3% -78.2% -49.0% -49.6% -49.3%<br />
-36.2% -108.0% -37.5% -109.4% -43.2% -115.9% -53.6% -55 .O% -61.3%<br />
-98.4% -98.4% -98.2% -98.3% -98.7% -98.7% -69.4% -69.2% -69.7%<br />
-45.8% -77.7% -48.9% -81.0% -55.5% -88.1% -54.4% -57.8% -65.0%<br />
-46.6% -77.6% -49.5% -80.7% -56.0% -87.6% -54.7% -57.9% -64.9%<br />
Table continued on next page. See page preceding Table 3.8 <strong>for</strong> acronym definitions.
Table 3.9 (continued)<br />
LONG-TERM Technology uor MY <strong>20</strong>10 vehicles)<br />
Fuel-Cycle Energy and Greenhouse Gas Emission Changes of Alternative Transportation Fuels and Advanced Vehicle Technologies<br />
(percentage relative to gasoline vehicles fueled with re<strong>for</strong>mulated gasoline)<br />
Total Emissions:<br />
FCV:<br />
Gaseous H,,<br />
Electric Electric Electric FCV: NG, FCV:<br />
Vehicle, US Vehicle, NE Vehicle, CA Gaseous H,, Refueling Gaseous H,, FCV: Liquid FCV: Liquid FCV: Liquid<br />
Mix US Mix Mix NG, Central Station Solar H,, NG H,, FG H,, Solar<br />
Total Energy -39.0% -40.9% -39.9% -53.8% -48.3% -62.6% -38.9% -86.9% -71.9%<br />
Fossil fuels -54.0% -58.4% -79.0% -55.8% -49.8% -91.4% -39.4% -87.1% -71.7%<br />
Petroleum -98.7% -98.2% -99.6% -99.6% -96.5% -99.8% -99.1% -99.2% -98.5%<br />
co2 -45.3% -56.3% -79.7% -62.3% -58.3% -90.5% -5 1.4% -90.1% -99.1%<br />
GHGs -46.3% -56.7% -79.8% -63 .O% -58.5% -90.6% -52.8% -91.1% -99.2%<br />
Total Emissions:<br />
FCV: FCV: FCV: RFG2, EtOH FCVs: EtOH FCVs: EtOH FCVs: NG FCV: FCV: LNG,<br />
MeOH, NG MeOH, FG EtOH FCV: RFD Corn HB CNG NG<br />
Total Energy -45.1% -96.4% -50.0% -51.4% -37.7% 13.9% 5.5% -51.9% -50.5%<br />
Fossil fuels -44.8% -131.4% -50.0% -51.3% -77.5% -101.0% -95.7% -52.4% -50.2%<br />
Petroleum -98.4% -98.4% -50.0% -43.7% -96.5% -93.9% -95.5% -99.7% -98.9%<br />
co2 -56.0% -96.2% -50.0% -48.0% -76.1% -122.8% -104.9% -60.5% -60.3%<br />
GHGs -56.5% -95.8% -50.7% -49.5% -70.8% -118.9% -96.7% -59.6% -59.3%<br />
Table continued on next page. See page preceding Table 3.8 <strong>for</strong> acronym definitions.
Table 3.9 (continued)<br />
LONG-TERM Technology C<strong>for</strong> MY <strong>20</strong>10 vehicles)<br />
Fuel-Cycle Energy and Greenhouse Gas Emission Changes of Alternative Transportation Fuels and Advanced Vehicle Technologies<br />
(percentage relative to gasoline vehicles fueled with re<strong>for</strong>mulated gasolide)<br />
2<br />
%<br />
g<br />
Total Emissions:<br />
FCV: LNG, FCV: LPG, FCV: LPG,<br />
FG NG Crude<br />
::<br />
1<br />
;!<br />
Total Energy<br />
Fossil fuels<br />
-94.7%<br />
-94.7%<br />
-54.8%<br />
-54.6%<br />
-54.3%<br />
-54.3%<br />
2<br />
2M<br />
FJ<br />
2<br />
Petroleum<br />
co2<br />
GHGs<br />
-97.9%<br />
-96.4%<br />
-95.3%<br />
-99.0%<br />
-56.5%<br />
-57.2%<br />
-96.9%<br />
-55.7%<br />
-56.5%<br />
Y<br />
ei<br />
L<br />
g<br />
.<br />
Source:<br />
Wang, Michael Q., GREET 1.5a Model Results, Argonne National Laboratory, Argonne, IL, April <strong>20</strong>00.<br />
s<br />
2<br />
2<br />
fs<br />
Note: See page preceding Table 3.8 <strong>for</strong> acronym definitions.
Source<br />
Chapter 4<br />
Criteria Pollutants<br />
Summary Statistics from Tables in this Chapter<br />
Table 4.1 Transportation’s share of U.S. emissions, 1998<br />
co 78.6%<br />
No,<br />
voc<br />
PM-1 0<br />
PM-2.5<br />
SO2<br />
NH,<br />
Table 4.10 Transportation’s share of lead emissions<br />
1970<br />
1998<br />
<strong>TRANSPORTATION</strong><strong>ENERGY</strong><strong>DATA</strong>BOOIC <strong>EDITION</strong>~O-<strong>20</strong>00<br />
53.4%<br />
43.5%<br />
2.1%<br />
7.2%<br />
7.2%<br />
5.2%<br />
82.3%<br />
13.1%<br />
4-l
4-2<br />
Table 4.1<br />
Total National Emissions of the Criteria Air Pollutants by Sector, 1998<br />
(millions of short tons/percentage)<br />
Sector c o NO, voc PM-10 PM-2.5 SO, NH,<br />
Highway vehicles<br />
50.39 7.77 5.33 0.26 0.<strong>20</strong> 0.33 0.25<br />
56.3% 31.8% 29.7% 0.7% 2.4% 1.7% 5.1%<br />
Aircraft<br />
0.96 0.16 0.18 0.04 0.03 0.01 0.00<br />
l.IO% 0.7% 1.0% 0. I % 0.3% 0.1% 0.1%<br />
Railroads<br />
0.12 0.95 0.05 0.03 0.03 0.11 0.00<br />
0.1% 3.9%) 0.3% 0.1% 0.4% 0.6% 0.0%<br />
Vessels<br />
0.14 1.00 0.04 0.04 0.04 0.26 0.00<br />
0.2% 4.1% 0.2% O.lO/;; 0.5% 1.3% 0.0%<br />
Other off-highway<br />
18.71 3.17 2.19 0.35 0.31 0.70 0.00<br />
<strong>20</strong>.9% 13.0% 12.2% 1.0% 3.7% 3.6'S 0. a(?4<br />
Transportation total<br />
70.30 13.05 7.79 0.72 0.61 1.41 0.26<br />
78.6% 53.4'S 43.5% 2.1% 7.2% 7.2'S 5.2%<br />
Stationary source fuel combustion 5.37 10.19 0.89 1.09 0.79 16.72 0.06<br />
6.0*/o 41.7% 5.0% 3.1% 9.4% 85.1% 1.2%<br />
Industrial processes<br />
3.71 0.80 8.02 0.71 0.39 1.46 0.25<br />
4.1°% 3.3% 44.8% 2.0% 4.7% 7.4% 5.1%)<br />
Waste disposal and recycling total 1.15 0.10 0.43 0.31 0.24 0.04 0.09<br />
1.3% 0.4% 2.4% 0.9% 2.8% 0.2% s 1.7%<br />
Miscellaneous<br />
8.92 0.33 0.79 31.92 6.35 0.01 4.28<br />
10.0% 1.3% 4.4'% 91.9% 75.8% 0.1% 8 6.6%<br />
Total of all sources<br />
89.45 24.45 17.92 34.74 8.38 19.65 4.94<br />
100.0% 100. OC% 100.0% 100.0% 100.0% loo.or% 100.0%<br />
Source:<br />
All other-U. S. Environmental Protection Agency, National Air Pollutant Emission Trends, 1900-1998, <strong>20</strong>00,<br />
Appendix A. (Additional resources: www.epa.gov/oar/oaqps)<br />
Note:<br />
CO = Carbon monoxide. NO, = Nitrogen oxides. PM-10 = Particulate matter less than 10 microns.<br />
PM-2.5 = Particulate matter less than 2.5 microns. SO, = Sulfur dioxide. VOC = Volatile organic compounds.<br />
NH, = Ammonia.<br />
<strong>TRANSPORTATION</strong><strong>ENERGY</strong><strong>DATA</strong><strong>BOOK</strong>: <strong>EDITION</strong>~O-<strong>20</strong>00
I<br />
The transportation sector accounted<strong>for</strong> more than three-fourths qf the nation ‘s carbon monoxide (CO)<br />
emissions in 1998. Highway vehicles are by far the source of the greatest amount oJ’C0. For details<br />
on the highway emissions of CO, see Table 4.3.<br />
Table 4.2<br />
Total National Emissions of Carbon Monoxide, 1970-98”<br />
(million short tons)<br />
Percent<br />
of total,<br />
Source category 1970 1980 1990 1995 1997 1998 1998<br />
Highway vehicles 88.03 78.05<br />
Aircraft 0.51 0.74<br />
Railroads 0.07 0.10<br />
Vessels” 0.02 0.06<br />
Other off-highway 11.38 13.59<br />
Transportation total 100.00 92.54<br />
Stationary fuel combustion total 4.63 7.30<br />
Industrial processes total 9.84 6.95<br />
Waste disposal and recycling total 7.06 2.30<br />
Miscellaneous total 7.91 8.34<br />
Total of all sources 129.44 117.43<br />
57.85 54.11<br />
0.90 0.94<br />
0.12 0.11<br />
0.13 0.13<br />
17.04 19.04<br />
76.04 74.33<br />
5.51 5.93<br />
4.77 4.61<br />
1.08 1.19<br />
11.21 7.05 8.92 8.92<br />
98.53 93.35 89.45<br />
51.67 50.39 56.3%<br />
0.96 0.96 1.1%<br />
0.12 0.12 0.1%<br />
0.14 0.14 0.2%<br />
18.71 18.71 <strong>20</strong>.9%<br />
70.30<br />
5.37<br />
3.71<br />
1.15<br />
70.30<br />
5.37<br />
3.71<br />
1.15<br />
89.45<br />
78.6%<br />
6.0%<br />
4.1%<br />
1.3%<br />
10.0%<br />
100.0%<br />
Source:<br />
U. S. Environmental Protection Agency, National Air Pollutant Emission Trends, 1900-1998, <strong>20</strong>00,<br />
pp. A-l-A-5, and annual. (Additional resources: www.epa/oar/oaqps)<br />
Note:<br />
Emission estimation methodology changes indicated by shaded areas. Transportation methodologies<br />
changed in 1970, while all others changed in 1990.<br />
“The sums of subcategories may not equal total due to rounding.<br />
“Recreational marine vessels.<br />
<strong>TRANSPORTATION</strong> <strong>ENERGY</strong> <strong>DATA</strong> <strong>BOOK</strong>: <strong>EDITION</strong> <strong>20</strong>-<strong>20</strong>00 &pjg-gg&<br />
4-3
Table 4.3<br />
Emissions of Carbon Monoxide from Highway Vehicles, 1970-98”<br />
(million short tons)<br />
Percent of<br />
Source category 1970 1975 1980 1985 1990 1992 1993 1994 1995 1996 1997 1998 total, 1998<br />
Gasoline powered<br />
Light vehicles &motorcycles 64.03 59.28 53.56 49.45 37.41 39.37 39.16 37.51 33.70 28.73 27.04 27.04 53.7%<br />
Light trucksb 16.57 15.77 16.14 18.96 13.82 14.57 15.<strong>20</strong> 17.35 14.83 19.27 18.36 18.73 37.2%<br />
Heavy vehicles 6.71 7.14 7.19 7.72 5.36 4.57 4.48 5.53 4.12 3.77 3.35 3.07 6.1%<br />
Total 87.31 82.19 76.89 76.13 56.58 58.51 58.84 60.38 52.65 51.77 48.75 48.83 96.9%<br />
Diesel powered<br />
Light vehicles c 0.03 0.02 0.02 0.03 0.03 0.03 0.03 0.03 0.03 0.03 0.03 0.1%<br />
Light trucksb c c 0.00 0.00 0.01 0.01 0.01 0.01 0.01 0.01 0.01 0.01 0.0%<br />
Heavy vehicles 0.72 0.92 1.14 1.24 1.23 1.32 1.33 1.41 1.41 1.45 1.47 1.51<br />
Total 0.72 0.95 1.16 1.26 1.27 1.35 1.37 1.45 1.45 1.49 1.51 1.55 3.1%<br />
Total<br />
Highway vehicle total 88.03 83.13 78.05 77.39 57.85 59.86 60.<strong>20</strong> 61.83 54.11 53.26 50.26 50.39 100.0%<br />
Percent diesel 0.8% 1.1% 1.5% 1.6% 2.2% 2.3% 2.3% 2.3% 2.7% 2.8% 3.0% 3.1%<br />
Source:<br />
U. S. Environmental Protection Agency, National Air Pollutant Emission Trends, 1900-1998,<strong>20</strong>00, p. A-3 and annual.<br />
(Additional resources: www.epa.gov/oar/oaqps)<br />
“The sums of subcategories may not equal total due to rounding.<br />
bLess than 8,500 pounds.<br />
‘Data are not available.<br />
P<br />
b
I<br />
The transportation sector accounted <strong>for</strong> over half of the nation ‘s nitrogen oxide (NOx) emissions in<br />
1998, with the majority coming jiom highway vehicles. For details on the highway emissions qf NOx,<br />
see Table 4.5.<br />
Table 4.4<br />
Total National Emissions of Nitrogen Oxides, 1970-98”<br />
(million short tons)<br />
Percent<br />
of total,<br />
Source category 1970 1980 1990 1995 1997 1998 1998<br />
Highway vehicles 7.39 8.62 7.09<br />
Railroads 0.50 0.73 0.93<br />
Other off-highway<br />
1.44 2.80 3.88<br />
Transportation total<br />
Stationary fuel combustion total<br />
9.32 12.15<br />
10.06 11.32<br />
7.83 7.88<br />
0.99 0.95<br />
4.14 4.30<br />
11.89 12.95 13.13 13.05<br />
10.89 10.83 10.40 10.19<br />
Industrial processes total<br />
0.78 0.56 0.80 0.77 0.79 0.80<br />
Waste disposal and recycling total 0.44 0.11 0.09 0.10 0.10 0.10<br />
Miscellaneous total 0.33 0.25 0.37 0.27 0.41 0.33<br />
Total of all sources <strong>20</strong>.93 24.38 24.05 24.92 24.82 24.45<br />
Source:<br />
U. S. Environmental Protection Agency, National Air Pollutant Emission Trends, 1900-1998,<strong>20</strong>00,<br />
pp. A-6-A-10, and annual. (Additional resources: www.epa/oar/oaqps)<br />
Note:<br />
Emission estimation methodology changes indicated by shaded areas. Transportation methodologies<br />
changed in 1970, while all others changed in 1990.<br />
“The sums of subcategories may not equal total due to rounding.<br />
<strong>TRANSPORTATION</strong><strong>ENERGY</strong><strong>DATA</strong><strong>BOOK</strong>: <strong>EDITION</strong>~O-<strong>20</strong>00<br />
7.77<br />
0.95<br />
4.33<br />
31.8%<br />
3.9%<br />
17.7%<br />
53.3%<br />
41.7%<br />
3.3%<br />
0.4%<br />
1.3%<br />
100.0%<br />
4-5
Table 4.5<br />
Emissions of Nitrogen Oxides from Highway Vehicles, 1970-98”<br />
(million short tons)<br />
Percent of<br />
Source category 1970 1975 1980 1985 1990 1992 1993 1994 1995 1996 1997 1998 total, 1998<br />
Gasoline powered<br />
Light vehicles & motorcycles 4.16 4.73 4.42 3.81 3.22 3.61 3.68 3.57 3.44 2.98 2.93 2.85 36.7%<br />
Light trucksb 1.28 1.46 1.41 1.53 1.26 1.36 1.42 1.66 1.52 1.95 1.96 1.95 24.7%<br />
Heavy vehicles 0.28 0.32 0.30 0.33 0.33 0.31 0.32 0.35 0.33 0.33 0.33 0.32 4.2%<br />
Total 5.71 6.51 6.13 5.67 4.80 5.28 5.42 5.58 5.30 5.26 5.22 5.09 65.5%<br />
Diesel powered<br />
Light vehicles c 0.02 0.03 0.03 0.04 0.04 0.04 0.04 0.04 0.04 0.03 0.03 0.4%<br />
Light trucksb c c 0.01 0.01 0.01 0.01 0.01 0.01 0.01 0.01 0.01 0.01 0.2%<br />
Heavy vehicles 1.68 2.12 2.46 2.39 2.24 2.30 2.34 2.45 2.48 2.54 2.61 2.63 33.9%<br />
Total 1.68 2.14 2.49 2.42 2.29 2.35 2.39 2.49 2.53 2.59 2.66 2.68 34.5%<br />
Total<br />
Highway vehicle total 7.39 8.65 8.62 8.09 7.09 7.62 7.81 8.08 7.83 7.85 7.87 7.77 100.0%<br />
Percent diesel<br />
22.7% 24.8% 28.9% 30.0% 32.3% 30.8% 30.6% 30.9% 32.3% 33.0% 33.7% 34.5%<br />
Source:<br />
U. S. Environmental Protection Agency, National Air Pollutant Emission Trends, 1900-1998, <strong>20</strong>00, p. A-9 and annual.<br />
(Additional resources: www.epa.govloarloaqps)<br />
“The sums of subcategories may not equal total due to rounding.<br />
bLess than 8,500 pounds.<br />
‘Data are not available.
I<br />
The transportation sector accounted <strong>for</strong> over 40% of the nation s volatile organic compound (VOC)<br />
emissions in 1998, with the majority coming from highway vehicles. For details on the highway<br />
emissions of VOC, see Table 4.7.<br />
Table 4.6<br />
Total National Emissions of Volatile Organic Compounds, 1970-98”<br />
(million short tons)<br />
Percent<br />
of total,<br />
Source category 1970 1980 1990 1995 1997 1998 1998<br />
Highway vehicles 12.97 8.98 6.31<br />
Off-highway 1.71 2.14 2.55<br />
Transportation total 14.69 11.12 8.86<br />
Stationary fuel combustion total 0.72 1.05 1.01<br />
Industrial processes total 12.33 12.10 9.01<br />
Waste disposal and recycling total 1.98 0.76 0.99<br />
Miscellaneous total I .lO 1.13 1.07<br />
Total of all sources 30.82 26.17 <strong>20</strong>.94<br />
5.70 5.33 5.33 29.7%<br />
2.70 2.46 2.46 13.7%<br />
8.40 7.79 7.79 43.5%<br />
1.07 0.89 0.89 5.0%<br />
9.71 8.02 8.02 44.8%<br />
1.07 0.43 0.43 2.4%<br />
0.57 1.26 0.79 4.4%<br />
<strong>20</strong>.82 18.88 17.92 100.0%<br />
Source:<br />
U. S. Environmental Protection Agency, National Air Pollutant Emission Trends, 1900-1998,<strong>20</strong>00,<br />
pp. A-l 1-A-17, and annual. (Additional resources: www.epa.gov/oar/oaqps)<br />
Note:<br />
Emission estimation methodology changes indicated by shaded areas. Transportation methodologies changed<br />
in 1970, while all others changed in 1990.<br />
“The sum of subcategories may not equal total due to rounding. The EPA’s definition of<br />
volatile organic compounds excludes methane, ethane, and certain other nonphotochemically<br />
reactive organic compounds.<br />
<strong>TRANSPORTATION</strong><strong>ENERGY</strong><strong>DATA</strong>BOOIC <strong>EDITION</strong>~O-<strong>20</strong>00<br />
4-7
Table 4.7<br />
Emissions of Volatile Organic Compounds from Highway Vehicles, 1970-98”<br />
(thousand short tons)<br />
Percent of<br />
Source category 1970 1975 1980 1985 1990 1992 1993 1994 1995 1996 1997 1998 total, 1998<br />
Gasoline powered<br />
Light vehicles & motorcycles 9,193 7,248 5,907 5,864 3,947 3,832 3,812 3,748 3,426 2,875 2,796 2,832 47.6%<br />
Light trucksb 2,770 2,289 2,059 2,425 1,622 1,588 1,647 1,909 1,629 2,060 2,017 2,015 33.9%<br />
Heavy vehicles 1,<strong>20</strong>6 1,038 830 988 662 739 772 906 735 917 889 877 14.7%<br />
Total 13,169 10,575 8,796 9,277 6,231 6,159 6,231 6,563 5,790 5,852 5,702 5,724 96.3%<br />
Diesel powered<br />
Light vehicles c 15 8 8 13 13 13 13 14 12 12 12 0.2%<br />
Light trucksb c c 2 2 3 3 3 4 4 5 5 5 0.1%<br />
Heavy vehicles 266 335 392 360 297 302 3-o 1 313 302 245 227 <strong>20</strong>5 3.4%<br />
Total 266 350 402 370 313 318 317 330 3<strong>20</strong> 262 244 222 3.7%<br />
Total<br />
Highway vehicle total 13,435 10,925 9,198 9,647 6,544 6,477 6,548 6,893 6,110 6,114 5,946 5,946 100.0%<br />
Percent diesel 2.0% 3.2% 4.4% 3.8% 4.8% 4.9% 4.8% 4.8% 5.2% 4.3% 4.1% 3.7%<br />
Source:<br />
U. S. Environmental Protection Agency, National Air Pollutant Emission Trends, 1900-1998, <strong>20</strong>00, p. A-16 and annual.<br />
(Additional resources: www.epa.gov/oarloaqps)<br />
“The sums of subcategories may not equal total due to rounding.<br />
bLess than 8,500pounds.<br />
‘Data are not available.
I The<br />
transportation sector accounted<strong>for</strong> only 2% of the nation S particulate matter (PM-l 0) emissions in 1998. For details on the highway<br />
emissions of PM-1 0, see Table 4.9.<br />
Table 4.8<br />
Total National Emissions of Particulate Matter (PM-lo), 1970-98”<br />
(million short tons)<br />
Percent<br />
of total,<br />
Source category 1970 1980 1990 1995 1996 1997 1998 1998<br />
Highway vehicles 0.44 0.40 0.34 0.29 0.28 0.27<br />
Off-highway 0.22 0.40 0.49 0.46 0.46 0.46<br />
Transportation total 0.66 0.80 0.83 0.75 0.74 0.73<br />
Stationary fuel combustion total 2.87 2.45 1.<strong>20</strong> 1.18 1.17 1.09<br />
Industrial processes total ‘7.67 2.75 1.04 0.95 0.68 0.70<br />
Waste disposal and recycling total 1.00 0.27 0.27 0.29 0.30 0.31<br />
Miscellaneous total 0.84 0.85 26.63 23.91 30.14 31.40<br />
Total of all sources 13.04 7.12 29.96 27.07 33.04 34.23<br />
Source:<br />
U. S. Environmental Protection Agency, National Air Pollutant Emission Trends, 1900-1998,<strong>20</strong>00,<br />
pp. A-22-A-26, and annual. (Additional resources: http:/www.epa.gov/oar/oaqps)<br />
0.26 0.7%<br />
0.46 1.3%<br />
0.72 2.1%<br />
1.09 3.1%<br />
0.71 2.0%<br />
0.31 0.9%<br />
31.40 91.9%<br />
34.74 100.0%<br />
Note:<br />
Emission estimation methodology changes indicated by shaded areas. Transportation methodologies changed in 1970, while all others changed<br />
in 1990.<br />
“Fine particle matter less than 10 microns. The sums of subcategories may not equal total due to rounding.
Table 4.9<br />
Emissions of Particulate Matter (PM-lo) from Highway Vehicles, 1970-98”<br />
(thousand short tons)<br />
Percent of<br />
Source cateeorv 1970 1975 1980 1985 1990 1992 1993 1994 1995 1996 1997 1998 total, 1998<br />
Gasoline powered<br />
Light vehicles & motorcycles 225 <strong>20</strong>7 1<strong>20</strong> 77 61 64 65 62 62 55 56 56 21.8%<br />
Light trucksb 70 72 55 43 30 31 31 35 32 41 41 40 15.6%<br />
Heavy vehicles 13 15 15 14 10 9 10 10 9 9 9 8 3.1%<br />
Total 308 294 190 134 101 104 106 107 103 105 106 104 40.5%<br />
Diesel powered<br />
Light vehicles c 10 12 8 9 9 8 8 8 7 6 6 2.3%<br />
Light trucksb c c 2 1 1 2 2 2 2 2 2 2 0.8%<br />
Heavy vehicles 136 166 194 219 224 228 <strong>20</strong>5 <strong>20</strong>4 181 168 158 144 56.0%<br />
Total 136 177 <strong>20</strong>9 228 235 239 215 213 190 177 167 152 59.1%<br />
Total<br />
Highway vehicle total 443 471 397 363 336 343 321 3<strong>20</strong> 293 282 272 257 100.0%<br />
Percent diesel 30.7% 37.6% 52.6% 62.8% 69.9% 69.7% 67.0% 66.6% 64.8% 62.8% 61.4% 59.1%<br />
Source:<br />
U. S. Environmental Protection Agency, National Air Pollutant Emission Trends, 1900-1998, <strong>20</strong>00, p. A-25 and annual.<br />
(Additional resources: www.epa.govloarloaqps)<br />
“The sums of subcategories may not equal total due to rounding.<br />
bLess than 8,500 pounds.<br />
‘Data are not available.
The transportation sector accounted <strong>for</strong> only 7% of the nation ‘s particulate matter (PM-2.5) emissions in 1998. For details on the highway<br />
emissions of PM-2.5, see Table 4.11.<br />
Table 4.10<br />
Total National Emissions of Particulate Matter (PM-2.5), 1990-98<br />
(million short tons)<br />
Percent<br />
of total,<br />
Source category 1990 1991 1992 1993 1994 1995 1996 1997 1998 1998<br />
Highway vehicles 0.28 0.29 0.28 0.26 0.26 0.23<br />
Off-highway 0.44 0.43 0.43 0.43 0.42 0.40<br />
Transportation total 0.71 0.72 0.71<br />
Stationary fuel combustion total 0.91 0.89 0.93<br />
Industrial processes total 0.56 0.57 0.58<br />
Waste disposal and recycling total 0.23 0.24 0.24<br />
Miscellaneous total 5.55 5.31 5.19<br />
Total of all sources 7.96 7.74 7.65<br />
0.68 0.68<br />
0.85 0.84<br />
0.50 0.50<br />
0.29 0.27<br />
5.00 5.68<br />
7.33 7.98<br />
Source:<br />
U.S. Environmental Protection Agency, National Air Pollutant Emission Trends, 1900-1998, <strong>20</strong>00, pp. A-27-A-31, and annual.<br />
(Additional resources: www.epa.gov/oar/oaqps)<br />
0.63<br />
0.90<br />
0.50<br />
0.25<br />
4.90<br />
7.18<br />
0.22<br />
0.41<br />
0.63<br />
0.86<br />
0.38<br />
0.23<br />
6.09<br />
8.<strong>20</strong><br />
0.21 0.<strong>20</strong> 2.4%<br />
0.41 0.41 4.9%<br />
0.62<br />
0.79<br />
0.39<br />
0.24<br />
6.45<br />
8.48<br />
0.61 7.3%<br />
0.79 9.4%<br />
0.39 4.7%<br />
0.24 2.8%<br />
6.35 75.7%<br />
8.38 100.0%
I Diesel<br />
vehicles are responsible<strong>for</strong> the majority of highway vehicle PM-2.5 emissions. Nearly two-thirds of the PM-2.5 emissions are from heavy<br />
diesel trucks. I<br />
Table 4.11<br />
Emissions of Particulate Matter (PM-2.5) from Highway Vehicles, 1990-98”<br />
(thousand short tons)<br />
Percent<br />
of total,<br />
Source category 1990 1991 1992 1993 1994 1995 1996 1997 1998 1998<br />
Gasoline powered<br />
Light vehicles & motorcycles 37 38 38 38 36 36 32 32 33 16.8%<br />
Light trucksb 19 21 <strong>20</strong> <strong>20</strong> 23 <strong>20</strong> 25 25 25 12.7%<br />
Heavy vehicles 7 6 6 7 7 6 6 6 5 2.5%<br />
Total 63 65 64 65 66 62 63 63 63 32.0%<br />
Diesel powered<br />
Light vehicles 8 8 8 7 7 7 6 6 5 2.5%<br />
Light trucksb 1 1 2 1 2 2 2 2 2 1.0%<br />
Heavy vehicles <strong>20</strong>3 212 <strong>20</strong>6 183 182 161 149 140 127 64.5%<br />
Total 212 221 216 192 190 169 157 147 134 68.0%<br />
Total<br />
Highway vehicle total 275 286 280 257 256 231 221 211 197 100.0%<br />
Percent diesel 77.1% 77.3% 77.1% 74.7% 74.2% 73.2% 71.0% 69.7% 68.0%<br />
Source:<br />
U.S. Environmental Protection Agency, National Air Pollutant Emission Trends, 1900-1998, <strong>20</strong>00, p. A-30 and annual.<br />
(Additional resources: www.epa.govloarloaqps)<br />
a The sums of subcategories may not equal total due to rounding.<br />
b Less than 8,500 pounds.
I Historically<br />
the transportation sector, highway vehicles in particular, have been a major source of lead emissions in the U.S. Regulatory<br />
action in 1978 required a gradual reduction of the lead content of all gasoline over a period of many years. The transportation sector<br />
accounts <strong>for</strong> only 13% of lead emissions in 1998.<br />
Table 4.12<br />
National Lead Emission Estimates, 1970-98”<br />
(thousand short tons per year)<br />
Source category 1970 1975 1980 1985 1990 1995 1996 1997 1998<br />
Highway vehicles 171.96 130.21 60.50 18.05 0.42 0.02 0.02 0.02 0.02<br />
Off-highway 9.74 6.13 4.21 0.92 0.78 0.54 0.51 0.50 0.50<br />
Transportation total 181.70 136.34 64.71 18.97 1.<strong>20</strong> 0.56 0.52 0.52 0.52<br />
Stationary source fuel combustion 10.62 10.35 4.30 0.52 0.50 0.49 0.49 0.49 0.50<br />
Industrial processes 26.36 11.38 3.94 2.53 2.47 2.27 2.27 2.32 2.33<br />
Waste disposal and recycling total 2.<strong>20</strong> 1.60 1.21 0.87<br />
Total of all sources 2<strong>20</strong>.87 159.66 74.15 22.89<br />
4.98 0.80 3.93 0.60 3.90 0.61 3.95 0.62 3.97 0.62<br />
Source:<br />
U. S. Environmental Protection Agency, National Air Pollutant Emission Trends, 1900-1998,<strong>20</strong>00, pp. A-34-A-35, and annual.<br />
(Additional resources: www.epa.gov/oar/oaqps)<br />
“The sums of subcategories may not equal due to rounding.<br />
Percent<br />
of total,<br />
1998<br />
0.5%<br />
12.7%<br />
13.1%<br />
12.7%<br />
58.6%<br />
100.0% 15.6%
4-14<br />
Table 4.13<br />
State-level Emissions <strong>for</strong> Criteria Pollutants, 1998<br />
(thousand short tons)<br />
Volatile Particulate Particulate<br />
Carbon Nitrogen organic Sulfur matter matter<br />
State<br />
monoxide oxides” compounds” dioxide (PM- 10) (PM-2.5)<br />
Alabama<br />
2,361 619<br />
419<br />
764<br />
619<br />
184<br />
Alaska 2,249 99 457 12 274 155<br />
Arizona 1,370 450 281 225 336 145<br />
Arkansas 1,147 267 223 125 529 132<br />
Cali<strong>for</strong>nia 8,072 1,456 1,215 182 1,973 535<br />
’ Colorado 1,<strong>20</strong>0 400 274 137 518 126<br />
Connecticut 793 153 156 66 119 30<br />
District of Columbia 100 23 22 11 6 2<br />
Delaware 216 77 51 96 39 14<br />
Florida 5,<strong>20</strong>3 1,059 891 1,008 822 260<br />
Georgia 3,998 730 576 660 1,103 3<strong>20</strong><br />
Hawaii 321 59 53 35 35 11<br />
Idaho 956 116 115 39 678 161<br />
Illinois 2,890 1,076 748 1,153 1,028 261<br />
Indiana 2,526 848 518 1,164 641 154<br />
Iowa 1,045 343 239 283 GO2 130<br />
Kansas 1,230 479 257 163 1,570 299<br />
Kentucky 1,389 682 330 753 345 103<br />
Louisiana 2,184 825 425 405 441 149<br />
Maine 488 94 109 53 158 102<br />
Maryland 1,107 344 183 339 227 57<br />
Massachusetts 1,188 304 264 264 290 72<br />
Michigan 3,309 880 765 628 569 153<br />
Minnesota 1,552 476 381 162 1,011 222<br />
Mississippi 1,414 353 304 305 458 130<br />
Missouri 1,816 546 360 482 1,286 252<br />
Montana 703 176 105 GO 1,137 216<br />
Nebraska 681 239 154 94 632 125<br />
Nevada 5<strong>20</strong> 157 98 66 143 39<br />
New Hampshire 355 82 74 148 54 17<br />
New Jersey 1,454 466 408 257 313 96<br />
New Mexico 855 279 140 199 4,987 781<br />
New York 3,337 723 753 688 767 222<br />
N. Carolina 2,773 745 605 729 501 172<br />
N. Dakota 380 235 105 327 430 92<br />
Ohio 3,934 1,198 706 1,921 658 195<br />
Oklahoma 1,518 440 295 157 1,033 193<br />
Oregon 1,988 271 272 58 686 224<br />
Pennsylvania 2,909 840 575 1,221 547 156<br />
Rhode Island 221 35 49 12 25 8<br />
S. Carolina 1,638 367 334 290 410 112<br />
S. Dakota 333 119 78 53 349 73<br />
Tennessee 2,037 761 528 789 375 130<br />
Texas 5,644 2,140 1,388 1,096 3,655 733<br />
Utah 942 233 161 79 238 G9<br />
Vermont 240 46 44 16 75 18<br />
Virginia 2,149 532 471 373 409 118<br />
Washington 2,035 364 347 155 430 149<br />
W. Virginia 721 500 141 787 152 50<br />
Wisconsin 1,600 480 400 378 391 112<br />
Wyoming 3&l 270 68 179 663 122<br />
Total<br />
Source:<br />
89,454 24,454 17,917 19,647 34,741 8,379<br />
U.S. Environmental Protection Agency, National Air Pollutant Emission Trends, 1900-1998, <strong>20</strong>00, p. 2-8.<br />
(Additional resources: www.epa.gov/oar/oaqps)<br />
Note:<br />
The sums of the States may not equal national totals due to rounding.<br />
a Excluding biogenics. <strong>TRANSPORTATION</strong> <strong>ENERGY</strong> <strong>DATA</strong> <strong>BOOK</strong>: <strong>EDITION</strong> <strong>20</strong>--2OOc)
The Greenhouse Gases, Regulated Emissions, and Energy Use<br />
in Transportation (GREET) Model<br />
The energy and criteria pollutant estimates of the most recent version (Version 1 Sa) of the GREET<br />
model are displayed in the next two tables. The model estimates the full fuel-cycle emissions and energy<br />
use associated with various transportation fuels and advanced transportation technologies <strong>for</strong> light<br />
vehicles. It calculates fuel-cycle emissions of five criteria pollutants (volatile organic compounds,<br />
carbon monoxide, nitrogen oxides, sulfur oxides, and particulate matter measuring 10 microns or less)<br />
and three greenhouse gases (carbon dioxide, methane, and nitrous oxide). See Chapter 3 <strong>for</strong> the<br />
greenhouse gas data from GREET. The model also calculates the total fuel-cycle energy consumption,<br />
fossil fuel consumption, and petroleum consumption using various transportation fuels. The fuel cycles<br />
that are included in the GREET model are:<br />
. petroleum to conventional gasoline, re<strong>for</strong>mulated gasoline, conventional diesel, re<strong>for</strong>mulated diesel,<br />
liquefied petroleum gas, and electricity via residual oil;<br />
. natural gas to compressed natural gas, liquefied natural gas, liquefied petroleum gas, methanol,<br />
Fischer-Tropsch diesel, dimethyl ether, hydrogen, and electricity;<br />
. coal to electricity;<br />
. uranium to electricity;<br />
. renewable energy (hydropower, solar energy, and wind) to electricity;<br />
. corn, woody biomass, and herbaceous biomass to ethanol;<br />
. soybeans to biodiesel; and<br />
. landfill gases to methanol.<br />
Near-term technologies are ones which may be applied to <strong>20</strong>00 model-year cars and long-term<br />
technologies are ones which may be applied to <strong>20</strong> 10 model-year cars.<br />
For additional in<strong>for</strong>mation about the GREET model, see GREET I. 5 - Transportation Fuel- CycleModel,<br />
Volume 1: Methodology, Development, Use andResults, ANL/ESD-39, Vol. 1, August 1999, or contact:<br />
Michael Q. Wang<br />
Argonne National Laboratory<br />
9700 South Cass Avenue, ES/362<br />
Argonne, IL 60439-4815<br />
phone: 630-252-2819<br />
fax: 630-252-3443<br />
email: mqwang@anl.gov<br />
4-15<br />
<strong>TRANSPORTATION</strong> <strong>ENERGY</strong> <strong>DATA</strong> <strong>BOOK</strong>: <strong>EDITION</strong> <strong>20</strong>-<strong>20</strong>00 GYfgg&
4-16<br />
Acronyms Used on Tables 4.14 and 4.15<br />
Emissions acronyms<br />
co carbon monoxide<br />
NOx nitrogen oxides<br />
PM10 particulate matter measuring 10 microns or less<br />
sox sulfur oxides<br />
voc volatile organic compounds<br />
Technologies acronyms<br />
BD<strong>20</strong><br />
CARFG2<br />
CD<br />
CID1<br />
CNG<br />
CNGV<br />
Dedi.<br />
DME<br />
El0<br />
E85<br />
E90<br />
ETBE<br />
EtOH<br />
EtOHV<br />
’ EV<br />
FCV<br />
FFV<br />
FRFG2<br />
FG<br />
FT50<br />
FTlOO<br />
GC<br />
GI<br />
GHGs<br />
GV<br />
HZ<br />
HB<br />
HEV<br />
LFG<br />
LNG<br />
LNGV<br />
LPG<br />
LPGV<br />
M85<br />
M90<br />
MeOH<br />
MeOHV<br />
MTBE<br />
NG<br />
RFD<br />
SI<br />
SIDI<br />
WB<br />
Geographical acronyms<br />
CA Cali<strong>for</strong>nia<br />
NE northeast<br />
us United States<br />
mixture of <strong>20</strong>% biodiesel and 80% conventional diesel (by volume)<br />
Cali<strong>for</strong>nia Phase 2 re<strong>for</strong>mulated gasoline<br />
conventional diesel<br />
compression ignition, direct injection<br />
compressed natural gas<br />
compressed natural gas vehicle<br />
dedicated<br />
dimethyl ether<br />
mixture of 10% ethanol and 90% gasoline (by volume)<br />
mixture of 85% ethanol and 15% gasoline (by volume)<br />
mixture of 90% ethanol and 10% gasoline (by volume)<br />
ethyl tertiary butyl ether<br />
ethanol<br />
ethanol vehicle<br />
electric vehicle<br />
fuel-cell vehicle<br />
flexible fuel vehicle<br />
federal Phase 2 re<strong>for</strong>mulated gasoline<br />
flared gas<br />
mixture of 50% Fischer-Tropsch diesel and 50% conventional diesel (by volume)<br />
100% Fischer-Tropsch diesel<br />
grid-connected<br />
grid-independent<br />
greenhouse gases<br />
gasoline vehicle<br />
hydrogen<br />
herbaceous biomass<br />
hybrid electric vehicle<br />
land-fill gas<br />
liquefied natural gas<br />
liquefied natural gas vehicle<br />
liquefied petroleum gas<br />
liquefied petroleum gas vehicle<br />
mixture of 85% methanol and 15% gasoline by volume<br />
mixture of 90% methanol and 10% gasoline by volume<br />
methanol<br />
methanol vehicle<br />
methyl tertiary butyl ether<br />
natural gas<br />
re<strong>for</strong>mulated diesel<br />
spark ignition<br />
spark-ignition, direct-injection<br />
woody biomass<br />
<strong>TRANSPORTATION</strong><strong>ENERGY</strong><strong>DATA</strong><strong>BOOK</strong>: <strong>EDITION</strong>~O-<strong>20</strong>00
Table 4.14<br />
NEAR-TERM Technology C<strong>for</strong> MY <strong>20</strong>00 vehicles)<br />
Fuel-Cycle Energy and Criteria Pollutant Emission Changes of Alternative Transportation Fuels and Advanced Vehicle Technologies<br />
(percentage relative to conventional gasoline vehicles fueled with conventional gasoline)<br />
Total Emissions:<br />
Total Energy<br />
Fossil fuels<br />
Petroleum<br />
voc<br />
co<br />
NOx<br />
PM10<br />
sox<br />
Urban Emissions:<br />
voc<br />
co<br />
NOx<br />
PM10<br />
sox<br />
Bi-Fuel Dedi.<br />
GV: FRFG2, GV: FRFG2, CNGV on Dedi. LPGV: M85 FFV: E85 FFV:<br />
MTBE EtOH CIDI: CD CNG Dedi. CNGV LPGV: NG Crude NG corn<br />
0.0% 0.4%<br />
0.0% -3.5%<br />
-11.0% -3.6%<br />
-15.6% -11.1%<br />
-19.1% -19.5%<br />
0.7% 2.8%<br />
-1.6% 38.9%<br />
-28.8% -16.2%<br />
-29.7%<br />
-29.6%<br />
-26.7%<br />
-61.5%<br />
-79.4%<br />
55.8%<br />
158.8%<br />
-31.3%<br />
8.6%<br />
6.9%<br />
-99.3%<br />
-52.0%<br />
-19.0%<br />
35.0%<br />
-33.0%<br />
-28.3%<br />
5.1%<br />
3.4%<br />
-99.4%<br />
-75.0%<br />
-19.0%<br />
26.6%<br />
-34.9%<br />
-30.6%<br />
-9.6%<br />
-9.2%<br />
-98.2%<br />
-64.2%<br />
-25 .O%<br />
-<strong>20</strong>.5%<br />
-42.2%<br />
-77.3%<br />
-8.6%<br />
-8.6%<br />
-3.4%<br />
-59.3%<br />
-24.6%<br />
-15.4%<br />
-32.8%<br />
-57.3%<br />
15.3%<br />
16.0%<br />
-72.6%<br />
-19.3%<br />
-22.7%<br />
1.4%<br />
-26.5%<br />
-58.7%<br />
17.8%<br />
-41.9%<br />
-74.3%<br />
55.6%<br />
-37.4%<br />
103.3%<br />
619.9%<br />
168.7%<br />
-19.7% -<strong>20</strong>.2% -62.8% -47.7% -76.6% -60.3% -63.2% -<strong>20</strong>.2% -19.1%<br />
-<strong>20</strong>.0% -<strong>20</strong>.0% -80.5% -19.5% -19.5% -24.9% -24.9% -25.0% -39.9%<br />
-4.2% -4.6% 111.5% 29.8% 19.1% -9.3% -9.1% -12.0% -7.6%<br />
-1.4% -1.7% 258.6% -29.8% -31.7% -31.3% -31.3% -22.8% -<strong>20</strong>.7%<br />
-82.7% -82.9% -4.0% -96.0% -96.1% -98.1% -98.0% -73.7% -79.0%<br />
Table continued on next page. See page preceding Table 4.14 <strong>for</strong> acronym definitions.
Table 4.14 (continued)<br />
NEAR-TERM Technology C<strong>for</strong> MY <strong>20</strong>00 vehicles)<br />
Fuel-Cycle Energy and Criteria Pollutant Emission Changes of Alternative Transportation Fuels and Advanced Vehicle Technologies<br />
(percentage relative to conventional gasoline vehicles fueled with conventional gasoline)<br />
Total Emissions:<br />
Total Energy<br />
Fossil fuels<br />
Petroleum<br />
voc<br />
co<br />
NOx<br />
PM10<br />
sox<br />
GC SIDI<br />
HEV: GI SIDI GI SIDI<br />
CARFG2, HEV: HEV:<br />
El0 GV: EV: NE US EtOH, CA FRFG2, FRFG2, GI CID1<br />
corn EV: US Mix Mix EV: CA Mix Mix MTBE EtOH HEV: CD<br />
2.0%<br />
-3.4%<br />
-6.3%<br />
14.7%<br />
-42.8%<br />
10.1%<br />
57.7%<br />
15.7%<br />
-13.7%<br />
-39.1%<br />
-98.2%<br />
-88.7%<br />
-98.1%<br />
64.3%<br />
48.9%<br />
464.9%<br />
-14.2%<br />
-46.4%<br />
-96.8%<br />
-91.5%<br />
-98.0%<br />
14.3%<br />
12.3%<br />
242.4%<br />
-17.0%<br />
-69.0%<br />
-99.6%<br />
-96.1%<br />
-98.7%<br />
-50.5%<br />
-30.3%<br />
Urban Emissions:<br />
voc<br />
10.5% -99.8% -99.5% -99.6% -51.1% -30.4% -30.6% -63.7%<br />
co<br />
-43.9% -99.9% -99.9% -99.9% -44.0% -<strong>20</strong>.0% -<strong>20</strong>.0% -80.6%<br />
NOx<br />
0.2% -95.8% -90.8% -93.2% -29.3% -1.8% -2.0% 110.6%<br />
PM10<br />
0.1% -35.9% -33.3% -34.7% -6.3% 6.0% 5.8% 258.0%<br />
sox -6.7% -96.2% -90.4% -99.1% -93.2% -90.9% -91.0% -35.2%<br />
-5.9%<br />
-35.8%<br />
-52.6%<br />
-61.7%<br />
-50.6%<br />
-44.0%<br />
-24.5%<br />
-3.0%<br />
-40.1%<br />
-47.4%<br />
-47.4%<br />
-53.2%<br />
-34.1%<br />
-<strong>20</strong>.4%<br />
-17.2%<br />
-12.2%<br />
-62.6%<br />
Source:<br />
Wang, Michael Q., GREET 1.5a Model Results, Argonne National Laboratory, Argonne, IL, April <strong>20</strong>00.<br />
Note: See page preceding Table 4.14 <strong>for</strong> acronym definitions.<br />
-47.2%<br />
-49.2%<br />
-49.3%<br />
-31.7%<br />
-<strong>20</strong>.6%<br />
-16.1%<br />
9.1%<br />
-55.9%<br />
-52.5%<br />
-52.5%<br />
-50.6%<br />
-65.2%<br />
-80.0%<br />
47.4%<br />
151.8%<br />
-53.7%
Table 4.15<br />
LONG-TERM Technology G<strong>for</strong> MY <strong>20</strong>10 vehicles)<br />
Fuel-Cycle Energy and Greenhouse Gas Emission Changes of Alternative Transportation Fuels and Advanced Vehicle Technologies<br />
(percentage relative to gasoline vehicles fueled with re<strong>for</strong>mulated gasoline)<br />
Dedi. Dedi. Dedi. Dedi. Dedi.<br />
Dedi. Dedi. Dedi. LPGV: MeOHV: MeOHV: EtOHV: EtOHV:<br />
g Dedi. CNGV LNGV: NG LNGV: FG LPGV: NG Crude M90, NG M90, FG E90, Corn E90, WE3<br />
E<br />
2<br />
=!<br />
Total Emissions:<br />
Total Energy -8.5% -5.7% -89.8% -17.8% -16.9% 10.5% -77.5% 10.1% 90.7%<br />
2<br />
9<br />
Fossil fuels<br />
Petroleum<br />
-9.4%<br />
-99.4%<br />
-5.2%<br />
-97.8%<br />
-90.0%<br />
-95.9%<br />
-17.5%<br />
-98.2%<br />
-16.9%<br />
-1.3%<br />
11.1%<br />
-78.1%<br />
-77.7%<br />
-78.1%<br />
-52.0%<br />
-80.1%<br />
-88.7%<br />
-76.1%<br />
%<br />
2 voc -63.3% -54.1% -59.8% -56.8% -50.8% -13.8% -<strong>20</strong>.0% 87.4% <strong>20</strong>.2%<br />
F<br />
2<br />
co<br />
NOx<br />
-38.8%<br />
31.0%<br />
-36.7%<br />
77.6%<br />
-40.8%<br />
-23.3%<br />
-40.1%<br />
-38.4%<br />
-39.5%<br />
-29.8%<br />
2.4%<br />
4.5%<br />
-2.2%<br />
-115.6%<br />
1.7%<br />
156.9%<br />
15.1%<br />
287.7%<br />
E<br />
7i<br />
PM10<br />
sox<br />
-33.4%<br />
-32.6%<br />
-29.5%<br />
-76.9%<br />
-68.5%<br />
-77.1%<br />
-38.4%<br />
-71.8%<br />
-30.1%<br />
-48.4%<br />
-22.4%<br />
-59.1%<br />
-62.5%<br />
-60.6%<br />
601.2%<br />
140.8%<br />
147.6%<br />
-159.8%<br />
g<br />
=i Urban Emissions:<br />
5;<br />
Z voc -57.1% -58.2% -58.6% -47.4% -51.1% -11.1% -11.1% -9.4% -9.4%<br />
z<br />
c o -39.3% -39.9% -40.0% -39.9% -39.9% -0.2% -0.2% 0.0% -0.1%<br />
% NOx 106.3% -8.3% -11.0% -3.7% -2.8% -17.2% -17.2% 7.4% 0.4%<br />
z<br />
PM10 -24.5% -25.9% -26.1% -25.2% -25.1% -14.5% -14.5% -12.4% -12.9%<br />
sox -80.6% -98.1% -98.3% -91.5% -91.3% -77.9% -77.9% -83.0% -85.4%<br />
Table continued on next page. See page preceding Table 4.14 <strong>for</strong> acronym definitions.
Table 4.15 (continued)<br />
LONG-TERM Technology ($or MY <strong>20</strong>10 vehicles)<br />
Fuel-Cycle Energy and Greenhouse Gas Emission Changes of Alternative Transportation Fuels and Advanced Vehicle Technologies<br />
(percentage relative to gasoline vehicles fueled with re<strong>for</strong>mulated gasoline)<br />
Dedi. SIDI: Dedi. MeOH Dedi. MeOH Dedi. EtOH Dedi. EtOH Dedi. EtOH<br />
GI SIDI<br />
HEV:<br />
EtOHV: FRFG2, SIDI: M90, SIDI: M90, SIDI: E90, SIDI: E90, SIDI: E90, FRFG2, GI SI HEV:<br />
% E90, HB EtOH NG FG Corn HB EtOH CNG<br />
::<br />
2<br />
Total Emissions:<br />
Total Energy 77.6% -<strong>20</strong>.0% -5.2% -82.7% -3.1% 67.8% 56.3% -47.4% -43.5%<br />
is<br />
P<br />
Fossil fuels<br />
Petroleum<br />
-80.5%<br />
-78.5%<br />
-<strong>20</strong>.0%<br />
-<strong>20</strong>.0%<br />
-4.7%<br />
-82.1%<br />
-135.5%<br />
-82.1%<br />
-57.8%<br />
-82.5%<br />
-90.1%<br />
-78.9%<br />
-82.8%<br />
-81.1%<br />
-47.4%<br />
-47.4%<br />
-44.0%<br />
-99.6%<br />
F<br />
2 voc 13.9% -11.4% -22.8% -28.3% 69.1% 10.0% 4.5% -28.7% -66.3%<br />
Y co 12.4% -0.8% 1.2% -2.9% 0.9% 12.7% 10.4% -2.0% -40.4%<br />
1<br />
NOx 307.8% -16.6% -14.0% -119.6% 128.2% 243.2% 261.0% -39.2% -12.4%<br />
i<br />
??<br />
PM10<br />
sox<br />
129.9%<br />
-97.5%<br />
-4.2%<br />
-<strong>20</strong>.0%<br />
-<strong>20</strong>.2%<br />
-75.6%<br />
-55.4%<br />
-76.8%<br />
532.5%<br />
111.9%<br />
133.3%<br />
-152.6%<br />
117.7%<br />
-97.8%<br />
-21.5%<br />
-47.4%<br />
-33.7%<br />
-58.3%<br />
E<br />
? Urban Emissions:<br />
2 voc -9.5% -7.3% -15.8% -15.8% -14.4% -14.4% -14.5% -32.1% -58.3%<br />
0”<br />
co 0.0% -0.1% -0.2% -0.2% 0.0% -0.1%. -0.1% -0.1% -39.6%<br />
% NOx 3.3% -4.9% -18.3% -18.3% 3.4% -2.8% -0.2% -11.7% 55.7%<br />
8<br />
P M 1 0 -12.7% 12.0% -2.1% -2.1% -0.3% -0.7% -0.5% 5.0% -16.5%<br />
sox -84.0% -<strong>20</strong>.0% -80.6% -80.6% -85.0% -87.1% -85.9% -47.4% -88.0%<br />
Table continued on next page. See page preceding Table 4.14 <strong>for</strong> acronym definitions.
Table 4.15 (continued)<br />
LONG-TERM Technology C<strong>for</strong> MY <strong>20</strong>10 vehicles)<br />
Fuel-Cycle Energy and Greenhouse Gas Emission Changes of Alternative Transportation Fuels and Advanced Vehicle Technologies<br />
@ercentage relative to gasoline vehicles fueled with re<strong>for</strong>mulated gasoline)<br />
Total Emissions:<br />
Total Energy<br />
Fossil fuels<br />
Petroleum<br />
voc<br />
co<br />
NOx<br />
PM10<br />
sox<br />
Urban Emissions:<br />
voc<br />
co<br />
NOx<br />
PM10<br />
sox<br />
GI SIDI GI SIDI GI SIDI GI SIDI GI SIDI<br />
GI SI HEV: GI SI HEV: GI SI HEV: GI SI HEV: HEV: M90, HEV: M90, HEV: E90, HEV: E90, HEV: E90,<br />
LNG, NG LNG, FG LPG, NG LPG, Crude NG FG Corn HI3<br />
-41.8% -93.7%<br />
-4 1.4% -93.8%<br />
-98.7% -97.5%<br />
-60.6% -64.1%<br />
-39.1% -41.6%<br />
16.3% -46.0%<br />
-31.3% -55.4%<br />
-85.8% -85.9%<br />
-46.8%<br />
-46.6%<br />
-98.8%<br />
-60.5%<br />
-41.1%<br />
-54.0%<br />
-36.5%<br />
-81.7%<br />
-46.2%<br />
-46.3%<br />
-36.1%<br />
-56.6%<br />
-40.7%<br />
-48.4%<br />
-31.1%<br />
-66.6%<br />
-54.0%<br />
-35.7% --121.7%<br />
-87.3%<br />
-33.5%<br />
-0.7%<br />
-32.2% -.101.7%<br />
-25.6%<br />
-76.3%<br />
-54.1%<br />
-87.3%<br />
-37.1%<br />
-3.3%<br />
-48.7%<br />
-77.2%<br />
-36.3%<br />
-72.2%<br />
-88.5%<br />
25.0%<br />
-1.1%<br />
56.1%<br />
335.5%<br />
10.4%<br />
-93.5%<br />
-86.1%<br />
-13.9%<br />
6.7%<br />
131.8%<br />
72.9%<br />
39.4% - 134.6%<br />
2.8%<br />
-88.7%<br />
-87.5%<br />
-17.6%<br />
5.1%<br />
143.5%<br />
62.6%<br />
-98.6%<br />
-58.9% -59.2% -50.0% -52.4% -25.7% -25.7% -24.7% -24.7% -24.8%<br />
-40.0% -40.1% -40.0% -40.0% -0.2% -0.2% -0.1% -0.2% -0.1%<br />
-15.2% -16.8% -11.6% -11.1% -21.0% -21.0% -6.7% -10.8% -9.1%<br />
-17.3% -17.5% -16.8% -16.8% -7.1% -7.1% -5.9% -6.2% -6.0%<br />
-98.8% -98.9% -94.5% -94.4% -87.2% -87.2% -90.1% -91.5% -90.7%<br />
Table continued on next page. See page preceding Table 4.14 <strong>for</strong> acronym definitions.
Table 4.15 (continued)<br />
LONG-TERM Technology C<strong>for</strong> MY <strong>20</strong>10 vehicles)<br />
Fuel-Cycle Energy and Greenhouse Gas Emission Changes of Alternative Transportation Fuels and Advanced Vehicle Technologies<br />
(percentage relative to gasoline vehicles fueled with re<strong>for</strong>mulated gasoline)<br />
Total Emissions:<br />
Total Energy<br />
Fossil fuels<br />
Petroleum<br />
voc<br />
co<br />
NOx<br />
PM10<br />
sox<br />
Urban Emissions:<br />
voc<br />
co<br />
NOx<br />
PM10<br />
sox<br />
GC SIDI GC SIDI<br />
GC SIDI HEV: RFG2, HEV: RFG2, GC SI HEV: GC SI HEV: GC SI HEV: GC SI HEV: GC SI HEV: GC SI HEV:<br />
HEV: RFG2, EtOH, NE EtOH, CA CNG, US CNG, NE CNG, CA LNG, NG, LNG, FG, LNG, NG,<br />
EtOH, US Mix US Mix Mix Mix US Mix Mix US Mix US Mix NE US Mix<br />
-43.9%<br />
-47.5%<br />
-61.4%<br />
-46.7%<br />
-30.6%<br />
4.9%<br />
-18.7%<br />
68.1%<br />
-44.4% -44.1%<br />
-48.8% -55.3%<br />
-61.3% -61.7%<br />
-47.6% -48.8%<br />
-30.6% -30.9%<br />
-12.3% -37.0%<br />
-24.2% -30.3%<br />
11.4% -40.4%<br />
-40.9%<br />
-45.9%<br />
-99.3%<br />
-72.0%<br />
-44.2%<br />
25.1%<br />
-17.8%<br />
73.3%<br />
-41.5%<br />
-47.3%<br />
-99.2%<br />
-73.1%<br />
-44.1%<br />
6.9%<br />
-26.1%<br />
5.1%<br />
-41.2%<br />
-54.0%<br />
-99.7%<br />
-74.5%<br />
-44.5%<br />
-19.5%<br />
-35.3%<br />
-61.3%<br />
-39.7%<br />
-44.0%<br />
-98.7%<br />
-67.9%<br />
-43.2%<br />
45.8%<br />
-16.1%<br />
53.5%<br />
-77.2%<br />
-81.8%<br />
-97.8%<br />
-70.5%<br />
-45 .O%<br />
0.9%<br />
-33.5%<br />
53.4%<br />
-40.2%<br />
-45.2%<br />
-98.5%<br />
-68.8%<br />
-43.2%<br />
31.2%<br />
-23.2%<br />
-43.7%’ -43.6% -43.7% -69.2% -69.1% -69.2% -69.7% -69.8% -69.6%<br />
-30.1% -30.0% -30.0% -43.7% -43.7% -43.7% -44.0% -44.0% -44.0%<br />
-32.2% -26.4% -30.8% 16.3% 21.9% 17.7% -34.8% -36.0% -29.4%<br />
-6.1% -5.6% -6.0% -21.2% -<strong>20</strong>.6% -21.1% -21.8% -21.9% -21.3%<br />
-59.2% -55.9% -61.4% -88.1% -84.4% -90.7% -95.9% -96.0% -92.7%<br />
Table continued on next page. See page preceding Table 4.14 <strong>for</strong> acronym definitions.<br />
-6.2%
Table 4.15 (continued)<br />
LONG-TERM Technology C<strong>for</strong> MY <strong>20</strong>10 vehicles)<br />
Fuel-Cycle Energy and Greenhouse Gas Emission Changes of Alternative Transportation Fuels and Advanced Vehicle Technologies<br />
(percentage relative to gasoline vehicles fueled with re<strong>for</strong>mulated gasoline)<br />
Total Emissions:<br />
Total Energy<br />
Fossil fuels<br />
Petroleum<br />
voc<br />
co<br />
NOx<br />
PM10<br />
sox<br />
Urban Emissions:<br />
voc<br />
co<br />
GC SI HEV: GC SI HEV: GC SI HEV: GC SI HEV: GC SI HEV: GC SI HEV: GC SI HEV: GC SI HEV: GC SI HEV:<br />
LNG, FG, LNG, NG, LNG, FG, LPG, NG, LPG, Crude, LPG, NG, LPG, Crude, LPG, NG, LPG, Crude,<br />
NE US Mix CA Mix CA Mix U.S. Mix U.S. Mix NE US Mix NE US Mix CA Mix CA Mix<br />
-77.7%<br />
-83.1%<br />
-97.6%<br />
-71.4%<br />
-45.0%<br />
-15.5%<br />
-40.9%<br />
-6.5%<br />
-40.0%<br />
-51.0%<br />
-98.9%<br />
-70.1%<br />
-43.5%<br />
10.0%<br />
-31.1%<br />
-64.3%<br />
-77.4%<br />
-89.4%<br />
-98.1%<br />
-72.7%<br />
-45.3%<br />
-39.3%<br />
-49.1%<br />
-65.0%<br />
-43.3%<br />
-47.7%<br />
-98.8%<br />
-68.2%<br />
-44.7%<br />
-4.9%<br />
-19.8%<br />
56.4%<br />
-42.9%<br />
-47.5%<br />
-53.6%<br />
-65.3%<br />
-44.4%<br />
-0.9%<br />
-15.9%<br />
67.3%<br />
-43.9%<br />
-49.0%<br />
-98.6%<br />
-69.1%<br />
-44.6%<br />
-21.9%<br />
-27.1%<br />
-4.6%<br />
-43.5%<br />
-48.8%<br />
-53.4%<br />
-66.3%<br />
-44.3%<br />
-18.2%<br />
-23.4%<br />
5.8%<br />
-43.6%<br />
-55.0%<br />
-99.1%<br />
-70.4%<br />
-45 .O%<br />
-46.5%<br />
-35.3%<br />
-64.0%<br />
-43.2%<br />
-55.0%<br />
-53.8%<br />
-67.6%<br />
-44.7%<br />
-43.5%<br />
-31.7%<br />
-54.1%<br />
-69.8% -69.6% -69.8% -63.6% -65.3% -63.5% -65.2% -63.6% -65.3%<br />
-44.0% -44.0% -44.0% -44.0% -44.0% -44.0% -44.0% -44.0% -44.0%<br />
NOx -30.6% -33.5% -34.7% -32.3% -3 1.9% -26.8% -26.2% -30.9% -30.4%<br />
PM10 -21.4% -21.7% -21.8% -21.5% -21.4% -<strong>20</strong>.9% -<strong>20</strong>.9% -21.3% -21.3%<br />
sox -92.7% -98.2% -98.3% -92.8% -92.7% -89.5% -89.3% -95.1% -95.1%<br />
Table continued on next page. See page preceding Table 4.14 <strong>for</strong> acronym definitions.
Table 4.15 (continued)<br />
LONG-TERM Technology C<strong>for</strong> MY <strong>20</strong>10 vehicles)<br />
Fuel-Cycle Energy and Greenhouse Gas Emission Changes of Alternative Transportation Fuels and Advanced Vehicle Technologies<br />
(percentage relative to gasoline vehicles fueled with re<strong>for</strong>mulated gasoline)<br />
GC SIDI GC SIDI GC SIDI GC SIDI<br />
GC SIDI GC SIDI HEV: M90, HEV: M90, GC SIDI GC SIDI HEV: E90, HEV: E90, GC SIDI<br />
E HEV: M90, HEV: M90, NG, NE US FG, NE US HEV: M90, HEV: M90, Corn, US WB, us HEV: E90,<br />
$ NG, US Mix FG, US Mix Mix Mix NG, CA Mix FG, CA Mix Mix Mix HB, US Mix<br />
E Total Emissions:<br />
2 Total Energy -35.7% -72.3% -36.2% -72.9% -35.9% -72.6% -35.9% -2.3% -7.8%<br />
2M<br />
E<br />
2<br />
Fossil fuels<br />
Petroleum<br />
-40.0%<br />
-90.5%<br />
-101.8%<br />
-90.5%<br />
-41.2%<br />
-90.3%<br />
-103.2%<br />
-90.3%<br />
-47.1%<br />
-90.8%<br />
-109.7%<br />
-90.8%<br />
-66.2%<br />
-91.3%<br />
-81.5%<br />
-89.7%<br />
-78.1%<br />
-90.7%<br />
F<br />
;;’<br />
voc<br />
co<br />
-50.0%<br />
-29.7%<br />
-52.6%<br />
-3 1.6%<br />
-50.9%<br />
-29.6%<br />
-53.5%<br />
-31.5%<br />
-52.1%<br />
-29.9%<br />
-54.7%<br />
-31.8%<br />
-7.9%<br />
-30.0%<br />
-35.9%<br />
-24.4%<br />
-38.5%<br />
-25.5%<br />
E<br />
NOx<br />
PM10<br />
10.7%<br />
-12.1%<br />
-39.2%<br />
-28.8%<br />
-5.5%<br />
-19.2%<br />
-57.3%<br />
-36.2%<br />
-29.0%<br />
-27.1%<br />
-83.6%<br />
-44.4%<br />
74.2%<br />
247.5%<br />
128.6%<br />
58.7%<br />
137.0%<br />
51.3%<br />
g<br />
z<br />
5<br />
z<br />
sox<br />
Urban Emissions:<br />
60.2% 59.6% 0.7% 0.0% -57.3% -58.2% 143.4% 18.3% 44.3%<br />
s voc -47.9% -47.9% -47.8% -47.8% -47.8% -47.8% -47.2% -47.2% -47.2%<br />
g co -30.1% -30.1% -30.1% -30.1% -30.1% -30.1% -30.1% -30.1% -30.1%<br />
8 NOx -39.0% -39.0% -33.5% -33.5% -37.7% -37.7% -28.8% -31.7% -30.5%<br />
PM10 -14.7% -14.7% -14.2% -14.2% -14.6% -14.6% -13.8% -14.0% -13.9%<br />
sox -87.6% -87.6% -84.3% -84.3% -89.8% -89.8% -89.7% -90.7% -90.1%<br />
Table continued on next page. See page preceding Table 4.14 <strong>for</strong> acronym definitions.
Table 4.15 (continued)<br />
LONG-TERM Technology C<strong>for</strong> MY <strong>20</strong>10 vehicles)<br />
Fuel-Cycle Energy and Greenhouse Gas Emission Changes of Alternative Transportation Fuels and Advanced Vehicle Technologies<br />
(percentage relative to gasoline vehicles fueled with re<strong>for</strong>mulated gasoline)<br />
Total Emissions:<br />
Total Energy<br />
Fossil fuels<br />
Petroleum<br />
voc<br />
co<br />
NOx<br />
PM10<br />
sox<br />
Urban Emissions:<br />
voc<br />
co<br />
NOx<br />
PM10<br />
sox<br />
GC SIDI GC SIDI GC SIDI GC SIDI GC SIDI<br />
HEV: E90, HEV: E90, HEV: E90, HEV: E90, HEV: E90, GC SIDI<br />
Com,NE WB,NEUS HB,NEUS Corn, CA WB, CA HEV: E90, CIDI: DME, CIDI: DME,<br />
US Mix Mix Mix Mix Mix HB, CAMix CIDI: RFD NG FG<br />
-36.4%<br />
-67.5%<br />
-91.2%<br />
-8.7%<br />
-29.9%<br />
60.4%<br />
244.5%<br />
97.1%<br />
-47.1%<br />
-30.0%<br />
-23.4%<br />
-13.3%<br />
-86.4%<br />
-2.6%<br />
-82.4%<br />
-89.5%<br />
-36.4%<br />
-24.3%<br />
123.6%<br />
55.5%<br />
-19.9%<br />
-47.1%<br />
-30.1%<br />
-28.3%<br />
-13.7%<br />
-8.2%<br />
-79.2%<br />
-90.5%<br />
-39.3%<br />
-25.4%<br />
128.5%<br />
46.4%<br />
-6.0%<br />
-47.1%<br />
-30.0%<br />
-25.9%<br />
-13.5%<br />
-36.1%<br />
-73.7%<br />
-91.6%<br />
-9.9%<br />
-30.2%<br />
40.4%<br />
241.1%<br />
52.0%<br />
-47.2%<br />
-30.0%<br />
-27.4%<br />
-13.7%<br />
-2.5%<br />
-86.6%<br />
-89.8%<br />
-37.2%<br />
-24.5%<br />
116.4%<br />
51.9%<br />
-57.2%<br />
-47.2%<br />
-30.1%<br />
-30.9%<br />
-14.0%<br />
-8.0%<br />
-84.6%<br />
-90.9%<br />
-40.3%<br />
-25.7%<br />
116.1%<br />
40.9%<br />
-55.0%<br />
-47.2%<br />
-30.1%<br />
-29.3%<br />
-13.8%<br />
-35.1%<br />
-35.1%<br />
-25.0%<br />
-62.4%<br />
-2.2%<br />
-22.1%<br />
-12.7%<br />
-34.1%<br />
-63.4%<br />
-0.1%<br />
43.1%<br />
-1.4%<br />
-17.1%<br />
-16.6%<br />
-97.9%<br />
-73.5%<br />
-0.1%<br />
-18.3%<br />
-34.5%<br />
-81.9%<br />
-76.0%<br />
-0.3%<br />
32.7%<br />
-12.0%<br />
-94.8%<br />
-148.4%<br />
-97.9%<br />
-83.9%<br />
-4.1%<br />
-124.2%<br />
-69.7%<br />
-83.4%<br />
-76.0%<br />
-0.3%<br />
32.7%<br />
-12.0%<br />
-88.5% -87.3% -92.0% -92.2% -92.1% 6.8% -95.7% -95.7%<br />
Table continued on next page. See page preceding Table 4.14 <strong>for</strong> acronym definitions.
Table 4.15 (continued)<br />
LONG-TERM Technology <strong>for</strong> MY <strong>20</strong>10 vehicles)<br />
Fuel-Cycle Energy and Greenhouse Gas Emission Changes of Alternative Transportation Fuels and Advanced Vehicle Technologies<br />
(percentage relative to gasoline vehicles fueled with re<strong>for</strong>mulated gasoline)<br />
Total Emissions:<br />
Total Energy<br />
Fossil fuels<br />
Petroleum<br />
voc<br />
co<br />
NOx<br />
PM10<br />
sox<br />
Urban Emissions:<br />
voc<br />
co<br />
NOx<br />
PM10<br />
sox<br />
GI CID1 GI CID1 GI CID1 GI CID1<br />
CIDI: CIDI: GI CID1 HEV: DME, HEV: DME, HEV: HEV: GI CID1<br />
FT100,NG FTlOO, FG CIDI: BD<strong>20</strong> HEV: RFD NG FG FTlOO, NG FTlOO, FG HEV: BD<strong>20</strong><br />
4.0% -92.0%<br />
4.7% -145.6%<br />
-97.5% -97.5%<br />
-71.5% -77.8%<br />
-0.2% -4.9%<br />
-24.4% -145.8%<br />
-34.3% -74.9%<br />
-82.6% -83.5%<br />
-31.5%<br />
-31.7%<br />
-36.7%<br />
-37.8%<br />
0.0%<br />
<strong>20</strong>.9%<br />
-5.9%<br />
-32.6%<br />
-57.7%<br />
-57.7%<br />
-51.1%<br />
-67.1%<br />
-3.1%<br />
-38.6%<br />
-<strong>20</strong>.1%<br />
-57.0%<br />
-45.9%<br />
-45.6%<br />
-98.6%<br />
-76.9%<br />
-1.7%<br />
-36.1%<br />
-36.5%<br />
-88.2%<br />
-96.6%<br />
-131.6%<br />
-98.6%<br />
-83.7%<br />
-4.4%<br />
-105.2%<br />
-59.5%<br />
-89.2%<br />
-32.2%<br />
-3 1.7%<br />
-98.4%<br />
-73.1%<br />
-1.8%<br />
-40.1%<br />
-35.7%<br />
-88.6%<br />
-94.8%<br />
-129.8%<br />
-98.4%<br />
-77.2%<br />
-4.9%<br />
-119.3%<br />
-62.2%<br />
-89.3%<br />
-55.3%<br />
-55.5%<br />
-58.7%<br />
-51.1%<br />
-1.7%<br />
-10.6%<br />
-16.4%<br />
-56.1%<br />
-66.7% -66.7% -61.3% -64.6% -76.3% -76.3% -66.8% -66.8% -63.2%<br />
-0.3% -0.3% 0.5% -0.2% -0.3% -0.3% -0.3% -0.3% 0.2%<br />
33.0% 33.0% 78.6% 38.3% 31.5% 31.5% 31.7% 31.7% 61.4%<br />
-8.9% -8.9% -0.8% -2.0% -12.1% -12.1% -9.0% -9.0% -2.7%<br />
-94.9% -94.9% -9.6% -30.4% -97.2% -97.2% -96.7% -96.7% -41.1%<br />
Table continued on next page. See page preceding Table 4.14 <strong>for</strong> acronym definitions.
Table 4.15 (continued)<br />
LONG-TERM Technology C<strong>for</strong> MY <strong>20</strong>10 vehicles)<br />
Fuel-Cycle Energy and Greenhouse Gas Emission Changes of Alternative Transportation Fuels and Advanced Vehicle Technologies<br />
(percentage relative to gasoline vehicles fueled with re<strong>for</strong>mulated gasoline)<br />
Total Emissions:<br />
Total Energy<br />
Fossil fuels<br />
Petroleum<br />
voc<br />
co<br />
NOx<br />
PM10<br />
sox<br />
Urban Emissions:<br />
voc<br />
co<br />
NOx<br />
PM10<br />
sox<br />
GC CID1 GC CID1<br />
GC CID1 GC CID1 GC CID1 GC CID1 GC CID1 HEV: DME, HEV: DME, GC CID1 GC CID1<br />
HEV: RFD, HEV: RFD, HEV: RFD, HEV: DME, HEV: DME, NG, NE US FG, NE US HEV: DME, HEV: DME,<br />
US Mix NE US Mix CA Mix NG, US Mix FG, US Mix Mix Mix NG, CA Mix FG, CA Mix<br />
-50.7%<br />
-55.2%<br />
-63.8%<br />
-73.5%<br />
-3 1.4%<br />
6.3%<br />
-8.0%<br />
74.7%<br />
-51.3%<br />
-56.6%<br />
-63.6%<br />
-74.5%<br />
-31.3%<br />
-10.4%<br />
-15.2%<br />
16.0%<br />
-75.1% -75.0%<br />
-30.2% -30.1%<br />
-3.8% 1.2%<br />
-11.8% -11.3%<br />
-48.3% -45.3%<br />
-51.0%<br />
-62.7%<br />
-64.1%<br />
-75.8%<br />
-31.7%<br />
-34.7%<br />
-23.3%<br />
-41.3%<br />
-75.0%<br />
-30.2%<br />
-2.6%<br />
-11.7%<br />
-50.4%<br />
-42.1%<br />
-46.4% -.109.3%<br />
-98.6%<br />
-80.5%<br />
-30.4%<br />
8.1%<br />
-19.9%<br />
51.9%<br />
-79.2%<br />
-98.6%<br />
-85.4%<br />
-32.3%<br />
-42.5%<br />
-36.7%<br />
51.2%<br />
-83.3% -83.3%<br />
-30.2% -30.2%<br />
-2.4% -2.4%<br />
-18.2% -18.2%<br />
-94.7% -94.7%<br />
Table continued on next page. See page preceding Table 4.14 <strong>for</strong> acronym definitions..<br />
-42.7%<br />
-47.7% -,110.7%<br />
-98.5%<br />
-81.4%<br />
-30.3%<br />
-7.9%<br />
-27.0%<br />
-7.7%<br />
-79.8%<br />
-98.5%<br />
-86.3%<br />
-32.3%<br />
-60.4%<br />
-44.1%<br />
-8.5%<br />
-83.2% -83.2%<br />
-30.1% -30.1%<br />
2.6% 2.6%<br />
-17.7% -17.7%<br />
-91.5% -91.5%<br />
-42.4%<br />
-53.5% - 117.3%<br />
-98.9%<br />
-82.7%<br />
-30.6%<br />
-31.1%<br />
-34.9%<br />
-65.8%<br />
-79.5%<br />
-98.9%<br />
-87.6%<br />
-32.6%<br />
-86.4%<br />
-52.3%<br />
-66.7%<br />
-83.3% -83.3%<br />
-30.1% -30.1%<br />
-1.1% -1.1%<br />
-18.1% -18.1%<br />
-97.0% -97.0%
Table 4.15 (continued)<br />
LONG-TERM Technology C<strong>for</strong> MY <strong>20</strong>10 vehicles)<br />
Fuel-Cycle Energy and Greenhouse Gas Emission Changes of Alternative Transportation Fuels and Advanced Vehicle Technologies<br />
(percentage relative to gasoline vehicles fueled with re<strong>for</strong>mulated gasoline)<br />
GC CID1 GC CID1 GC CID1 GC CID1 GC CID1 GC CID1<br />
HEV: HEV: HEV: HEV: HEV: HEV: GC CID1 GC CID1 GC CID1<br />
FTlOO, NG, FTlOO, FG, FTlOO, NG, FTlOO, FG, FTlOO, NG, FTlOO, FG, HEV: BD<strong>20</strong>, HEV: BD<strong>20</strong>, HEV: BD<strong>20</strong>,<br />
E US Mix US Mix NE US Mix NE US Mix CA Mix CA Mix US Mix NE US Mix CA Mix<br />
g<br />
2<br />
;!<br />
Total Emissions:<br />
Total Energy<br />
2 Fossil fuels<br />
!2<br />
F<br />
2<br />
Petroleum<br />
voc<br />
F co<br />
2 NOx<br />
! PM10<br />
x. .<br />
sox<br />
g<br />
1 Urban Emissions:<br />
E voc<br />
z co<br />
z NOx<br />
z PM10<br />
sox<br />
-32.1%<br />
-36.2%<br />
-98.4%<br />
-77.9%<br />
-30.4%<br />
5.2%<br />
-19.3%<br />
51.5%<br />
-76.6%<br />
-30.2%<br />
-2.2%<br />
-16.0%<br />
-94.4%<br />
-77.9%<br />
-108.0%<br />
-98.4%<br />
-80.9%<br />
-32.7%<br />
-52.8%<br />
-38.7%<br />
51.1%<br />
-76.6%<br />
-30.2%<br />
-2.2%<br />
-16.0%<br />
-94.4%<br />
-32.6%<br />
-37.5%<br />
-98.2%<br />
-78.8%<br />
-30.4%<br />
-10.8%<br />
-26.4%<br />
-7.9%<br />
-76.6%<br />
-30.1%<br />
2.8%<br />
-15.5%<br />
-91.1%<br />
-78.5%<br />
-109.4%<br />
-98.3%<br />
-81.8%<br />
-32.6%<br />
-71.0%<br />
-46.1%<br />
-8.5%<br />
-76.6%<br />
-30.1%<br />
2.8%<br />
-15.5%<br />
-91.1%<br />
-32.3%<br />
-43.2% -.115.9%<br />
-98.7%<br />
-80.1%<br />
-30.7%<br />
-34.1%<br />
-34.3%<br />
-65.8%<br />
-76.6%<br />
-30.1%<br />
-0.9%<br />
-15.9%<br />
-96.6%<br />
Table continued on next page. See page preceding Table 4. 4 <strong>for</strong> acronym definitions.<br />
-78.2%<br />
-98.7%<br />
-83.1%<br />
-32.9%<br />
-97.5%<br />
-54.3%<br />
-66.5%<br />
-76.6%<br />
-30.1%<br />
-0.9%<br />
-15.9%<br />
-96.6%<br />
-49.0%<br />
-53.6%<br />
-69.4%<br />
-61.8%<br />
-30.3%<br />
26.8%<br />
-5.3%<br />
75.4%<br />
-74.1%<br />
-29.8%<br />
19.6%<br />
-11.5%<br />
-53.7%<br />
-49.6%<br />
-55.0%<br />
-69.2%<br />
-62.7%<br />
-30.3%<br />
10.3%<br />
-12.7%<br />
14.5%<br />
-74.0%<br />
-29.8%<br />
24.6%<br />
-11.0%<br />
-50.5%<br />
-49.3%<br />
-61.3%<br />
-69.7%<br />
-64.0%<br />
-30.6%<br />
-13.6%<br />
-<strong>20</strong>.9%<br />
-44.7%<br />
-74.0%<br />
-29.8%<br />
<strong>20</strong>.8%<br />
-11.4%<br />
-55.9%
Table 4.15 (continued)<br />
LONG-TERM Technology C<strong>for</strong> MY <strong>20</strong>10 vehicles)<br />
Fuel-Cycle Energy and Greenhouse Gas Emission Changes of Alternative Transportation Fuels and Advanced Vehicle Technologies<br />
(percentage relative to gasoline vehicles fueled with re<strong>for</strong>mulated gasoline)<br />
Total Emissions:<br />
Total Energy<br />
Fossil fuels<br />
Petroleum<br />
voc<br />
co<br />
NOx<br />
PM10<br />
sox<br />
Urban Emissions:<br />
voc<br />
co<br />
NOx<br />
PM10<br />
sox<br />
FCV:<br />
Gaseous H,,<br />
Electric Electric Electric FCV: NG FCV:<br />
Vehicle, US Vehicle, NE Vehicle, CA Gaseous H,, Refueling Gaseous H,, FCV: Liquid FCV: Liquid FCV: Liquid<br />
Mix US Mix Mix NG, Central Station Solar H,, NG H,, FG H,, Solar<br />
-39.0%<br />
-54.0%<br />
-98.7%<br />
-89.4%<br />
-97.6%<br />
107.7%<br />
18.6%<br />
377.4%<br />
-99.7%<br />
-99.9%<br />
-81.5%<br />
-32.5%<br />
-40.9%<br />
-58.4%<br />
-98.2%<br />
-92.5%<br />
-97.4%<br />
49.7%<br />
-7.0%<br />
178.8%<br />
-99.5%<br />
-99.8%<br />
-61.6%<br />
-30.6%<br />
-39.9%<br />
-79.0%<br />
-99.6%<br />
-96.9%<br />
-98.5%<br />
-34.4%<br />
-35.5%<br />
-14.6%<br />
-99.7%<br />
-99.9%<br />
-76.5%<br />
-32.0%<br />
-53.8%<br />
-55.8%<br />
-99.6%<br />
-95.4%<br />
-96.9%<br />
-30.8%<br />
-39.7%<br />
-22.6%<br />
-99.7%<br />
-99.9%<br />
-85.4%<br />
-33.7%<br />
-48.3%<br />
-49.8%<br />
-96.5%<br />
-92.8%<br />
-95.6%<br />
0.8%<br />
-37.2%<br />
-33.6%<br />
-94.7%<br />
-97.1%<br />
102.7%<br />
-26.1%<br />
-62.6%<br />
-91.4%<br />
-99.8%<br />
-96.4%<br />
-98.8%<br />
-39.3%<br />
-42.0%<br />
-28.4%<br />
-38.9%<br />
-39.4%<br />
-99.1%<br />
-94.3%<br />
-96.3%<br />
-32.5%<br />
-37.4%<br />
-87.6%<br />
-99.4% -99.5%<br />
-99.8% -100.0%<br />
-72.7% -94.5%<br />
-33.4% -33.5%<br />
-86.9%<br />
-87.1%<br />
-99.2%<br />
-99.9%<br />
-99.8%<br />
-109.3%<br />
-62.8%<br />
-93.1%<br />
-99.5%<br />
-100.0%<br />
-94.6%<br />
-33.5%<br />
-71.9%<br />
-71.7%<br />
-98.5%<br />
-96.2%<br />
-99.4%<br />
-85.7%<br />
-49.4%<br />
-98.8%<br />
-99.0%<br />
-99.9%<br />
-88.2%<br />
-32.6%<br />
-89.3% -78.5% -96.7% -98.3% -98.0% -98.3% -99.4% -99.4% -98.7%<br />
Table continued on next page. See page preceding Table 4.14 <strong>for</strong> acronym definitions.
Table 4.15 (continued)<br />
LONG-TERM Technology C<strong>for</strong> MY <strong>20</strong>10 vehicles)<br />
Fuel-Cycle Energy and Greenhouse Gas Emission Changes of Alternative Transportation Fuels and Advanced Vehicle Technologies<br />
(percentage relative to gasoline vehicles fueled with re<strong>for</strong>mulated gasoline)<br />
Total Emissions:<br />
Total Energy<br />
Fossil fuels _<br />
Petroleum<br />
voc<br />
co<br />
NOx<br />
PM10<br />
sox<br />
Urban Emissions:<br />
voc<br />
co<br />
NOx<br />
PM10<br />
sox<br />
FCV: FCV: FCV: RFG2, EtOH FCVs: EtOH FCVs: EtOH FCVs: NG FCV: FCV: LNG,<br />
MeOH, NG MeOH, FG EtOH FCV: RFD Corn HB CNG NG<br />
-45.1%<br />
-44.8%<br />
-98.4%<br />
-70.7%<br />
-77.2%<br />
-53.6%<br />
-46.8%<br />
-85.7%<br />
-73.5%<br />
-80.0%<br />
-82.5%<br />
-34.0%<br />
-96.6%<br />
-96.4%<br />
-131.4%<br />
-98.4%<br />
-74.3%<br />
-79.9%<br />
-123.6%<br />
-70.2%<br />
-86.5%<br />
-73.5%<br />
-80.0%<br />
-82.5%<br />
-34.0%<br />
-96.6%<br />
-50.0%<br />
-50.0%<br />
-50.0%<br />
-52.8%<br />
-78.7%<br />
-55.2%<br />
-41.5%<br />
-53.7%<br />
-54.1%<br />
-79.9%<br />
-72.6%<br />
-32.7%<br />
-95.6%<br />
-5 1.4%<br />
-51.3%<br />
-43.7%<br />
-85.0%<br />
-79.0%<br />
-58.3%<br />
-39.3%<br />
-55.6%<br />
-90.8%<br />
-79.9%<br />
-63.7%<br />
-33.1%<br />
-75.7%<br />
-37.7%<br />
-77.5%<br />
-96.5%<br />
-4.0%<br />
-77.2%<br />
50.1%<br />
354.1%<br />
45.9%<br />
-72.0%<br />
-79.8%<br />
-55.1%<br />
-31.6%<br />
-95.8%<br />
Table continued on next page. See page preceding Table 4.14 <strong>for</strong> acronym definitions.<br />
13.9%<br />
-101.0%<br />
-93.9%<br />
-47.0%<br />
-68.6%<br />
133.8%<br />
63.7%<br />
5.5%<br />
-95.7%<br />
-95.5%<br />
-51.1%<br />
-70.3%<br />
146.7%<br />
52.3%<br />
-146.5% - 106.6%<br />
-72.0% -72.0%<br />
-79.9% -79.9%<br />
-62.1% -59.2%<br />
-32.0% -31.8%<br />
-98.2% -96.8%<br />
-51.9%<br />
-52.4%<br />
-99.7%<br />
-88.3%<br />
-78.8%<br />
-36.9%<br />
-46.0%<br />
-65.4%<br />
-87.9%<br />
-79.6%<br />
-15.7%<br />
-32.4%<br />
-99.1%<br />
-50.5%<br />
-50.2%<br />
-98.9%<br />
-83.4%<br />
-77.7%<br />
-12.4%<br />
-44.0%<br />
-87.9%<br />
-88.5%<br />
-79.9%<br />
-75.9%<br />
-33.2%<br />
-99.0%<br />
P<br />
LJ<br />
0
Table 4.15 (continued)<br />
LONG-TERM Technology flor MY <strong>20</strong>10 vehicles)<br />
Fuel-Cycle Energy and Greenhouse Gas Emission Changes of Alternative Transportation Fuels and Advanced Vehicle Technologies<br />
(percentage relative to gasoline vehicles fueled with re<strong>for</strong>mulated gasoline)<br />
Total Emissions:<br />
FCV: LNG, FCV: LPG, FCV: LPG,<br />
FG NG Crude<br />
Total Energy -94.7% -54.8% -54.3%<br />
Fossil fuels -94.7% -54.6% -54.3%<br />
Petroleum -97.9% -99.0% -96.9%<br />
voc -86.5% -86.2% -82.9%<br />
co -79.9% -79.4% -79.1%<br />
NOx -65.4% -72.2% -67.5%<br />
PM10 -64.5% -48.3% -43.8%<br />
sox -88.0% -84.5% -71.6%<br />
Urban Emissions:<br />
voc -88.7% -84.8% -86.8%<br />
co -80.0% -79.9% -79.9%<br />
NOx -77.3% -72.9% -72.4%<br />
PM10 -33.3% -32.7% -32.7%<br />
sox -99.1% -95.3% -95.2%<br />
Source:<br />
Wang, Michael Q., GREET 1.5a Model Results, Argonne National Laboratory, Argonne, IL, April <strong>20</strong>00.<br />
Note: See page preceding Table 4.14 <strong>for</strong> acronym definitions.
4-32<br />
The average light truck pollutes 40 percent more than the average car, according to the<br />
American Council<strong>for</strong> an Energy-Efficient Economy. One reason <strong>for</strong> the difference is that cars<br />
and light trucks have not been held to the same emissions standards. However, that is<br />
beginning to change.<br />
Early in <strong>20</strong>00, the Environmental Protection Agency issued a final rule <strong>for</strong> more stringent<br />
tailpipe emission standards <strong>for</strong> all new passenger vehicles, including sport utility vehicles<br />
(SUVs), minivans, vans, andpick-up trucks. This is thefirst time that SUVs and other light-duty<br />
trucks are subjected to the same national pollution standards as passenger cars.<br />
Table 4.16<br />
Pollution from a Typical New Car and Light Truck, <strong>20</strong>00 Model Year<br />
(pounds of pollutant per 15,000 miles of travel)<br />
Car Light truck<br />
Carbon dioxide 15,<strong>20</strong>0 21,<strong>20</strong>0<br />
Carbon monoxide 4<strong>20</strong> 547<br />
Nitrogen oxide 50 83<br />
Hydrocarbons 55 74<br />
Particulate matter 2.7 3.3<br />
Source:<br />
DeCicco, John, and Martin Thomas, Green Guide to Cars and Trucks: Model<br />
Year <strong>20</strong>00, American Council <strong>for</strong> an Energy-Efficient Economy,<br />
Washington, DC, <strong>20</strong>00, p. 113. (Additional resources: www.aceee.org)<br />
Note:<br />
Includes both tailpipe and fuel-cycle emissions. Assumes 15,000 miles driven<br />
per year.<br />
Table 4.17<br />
Tier 2 Federal Emission Standards<br />
Vehicle types Standard Time frame<br />
Light-duty vehicles and light light-duty trucks<br />
(less than 6,000 lbs. GVW)<br />
Heavy light-duty trucks (6,000-8,500 lbs. GVW)<br />
and medium-duty passenger vehicles<br />
(8,500-10,000 lbs. GVW)<br />
0.07 grams per mile NO, Phased in<br />
<strong>20</strong>04-<strong>20</strong>07<br />
0.07 grams per mile NO, Phased in<br />
<strong>20</strong>04-<strong>20</strong>09<br />
Source:<br />
U.S. Environmental Protection Agency, Office of Mobile Sources, Regulatory Announcement,<br />
“EPA ‘s Program <strong>for</strong> Cleaner Vehicles and Cleaner Gasoline,” EPA4<strong>20</strong>-F-99-05 1,<br />
December 1999. (Federal Register, Vol. 65, No. 28, Thursday, February 10,<strong>20</strong>0O.)<br />
(Additional resources: www.epa.gov/oms/tr2home.htm)<br />
e* TFLANSPORTATION<strong>ENERGY</strong><strong>DATA</strong>BOOIC <strong>EDITION</strong>~O-<strong>20</strong>00
Table 4.18<br />
Federal Exhaust Emission Certification Standards <strong>for</strong> Gasoline- and Diesel-Powered Light Vehicles a,b<br />
(grams per mile)<br />
Prior to<br />
Engine Type & Pollutant control 1968-69 1970-71 1972 1973-74 1975-76 1977-79 1980 1981 1982-86 1987-93 1994-<strong>20</strong>04b<br />
Gasoline<br />
Hydrocarbons (total)<br />
Non-methane hydrocarbons<br />
11<br />
d<br />
-_-_-_-____-_ :.,...::,...!: - C 2.2 - - 3.4---_-<br />
‘..:,- . . . . :~,::;:k:‘:.,. ; ,.. . . . . . ‘;$: 1.. ..I:’<br />
1 1.5 ] 0.41<br />
.\.I, : ‘_. ..:_:._: ,_ : ‘. .::.y 1. ,: . .I._ . .I:.. :“.‘.: _:. ., j.;, ,_, : ",,<br />
0.41<br />
0.25<br />
(4<br />
(0.31)<br />
Carbon monoxide<br />
Cold-temp. carbon monoxide f<br />
; _: : .::; ,( ).,.,. 1, ., ,.'. '.<br />
.:',.:::~~".~~.~~.:~~:;; ,: 2 :'f : ,,<br />
3.4<br />
10<br />
(4.2)<br />
Nitrogen oxides<br />
Particulates<br />
,: ‘,<br />
.* _1_<br />
0.4<br />
0.08<br />
(&<br />
(0.10)<br />
Diesel<br />
Hydrocarbons (total)<br />
_ __________ -<br />
‘.. .:..;.:, ‘_<br />
”<br />
,,:. ,: :..: -. :,: :.:: ::.:c .A...._ 1 1.5 1 0.41<br />
0.41 (4<br />
Non-methane hydrocarbons<br />
..<br />
Carbon monoxide 1 80 I, ..:::'i,$.\:.e::, .~....~.._._i..~. _: _,: ::. :,,::..:, ..: .f : :_ .,.. :_:. :. .::: .:<br />
__ ,___;<br />
3.4 (4.2)<br />
Nitrogen oxides<br />
.:, :.: '\ ::.:y.: : ::;:i:;g;; 1 3.1 2.0 1.0 1.0 (1.25)<br />
.,<br />
Particulates Test Procedure ] ;<br />
7-mode :: i. ,. i. .: ,. _I ..;:.y, . Z..“i _.__,...,,._ . :.,. . i.. :.:.: P.. ,::; . : ‘:.‘:_ .-., . : _:. :.. :,:.: ,,: : 2 ,;. . .:,_y -_.; ..::.: ..; _. .<br />
cvs-75.<br />
:. :,:_ .: ,I 0.60 1 0.<strong>20</strong> 0.08 (0.10)<br />
Useful Life (intermediate) b<br />
(full)<br />
‘.: “‘e<br />
_<br />
;‘_,: ..: ,.: . . . . . .:. 15 yrs/50,000 mi<br />
5 yrs/5o,ooomi I10 yrs/100,000 mi<br />
Source:<br />
40 CFR 86.085-2; 40 CFR 86.090-2; 40 CFR 86.090-S; 40 CFR 86.094-8; 40 CFR 86.096-2; 40 CFR 86.096-8; 40 CFR 86.098-8;40 CFR 86.099-8; 40 CFR<br />
86.082-2; 40 CFR 86.000-8. Lisa Snapp, Office of Air and Radiation, Environmental Protection Agency, Personal communication, April 1999.<br />
?he test procedure <strong>for</strong> measuring exhaust emissions has changed several times over the course of vehicle emissions regulation. The 7-mode procedure was used<br />
through model year 1971 and was replaced by the CVS-72 procedure beginning in model year 1972. The CVS-75 became the test procedure as of model year 1975. While it may<br />
appear that the total hydrocarbon and carbon monoxide standards were relaxed in 1972-74, these standards were actually more stringent due to the more stringent nature of the<br />
CVS-72 test procedure. Additional standards <strong>for</strong> carbon monoxide and composite standards <strong>for</strong> non-methane hydrocarbons and nitrogen oxides tested over the new Supplemental<br />
Federal Test Procedure will be phased-in during model years <strong>20</strong>00-02; these standards are not shown in this table.<br />
bAll emission standards must be met <strong>for</strong> a useful life of 5 years150,OOO miles. Beginning in with model year 1994, a second set of emission standards must also be met<br />
<strong>for</strong> a full useful life of 10 years/lOO,OOO miles (these standards are shown in parentheses). Tier 1 exhaust standards were phased-in during 1994-96 at a rate of 40, 80, and 100<br />
percent, respectively.<br />
‘In 1968-69, exhaust emission standards were issued in parts per million (ppm) rather than grams per mile and are, there<strong>for</strong>e, incompatible with this table.<br />
dNo estimate available.<br />
%o standard set.<br />
fThe cold CO emission standard is measured at <strong>20</strong> degrees F (rather than 75 degrees F) and is applicable <strong>for</strong> a 5-year/50,000-mile useful life.
Table 4.19<br />
Federal Exhaust Emission Certification Standards <strong>for</strong> Gasoline- and Diesel-Powered Light Trucks (Category LDTl) u,b,c<br />
(grams per mile)<br />
Prior to<br />
Engine Type & Pollutant<br />
Gasoline<br />
control 1968-69 1970-71 1972 1973-74 1975 1976-78 1979-81 1982-83 1984 1985-86 1987 1988-93 1994 1995-<strong>20</strong>04<br />
Hydrocarbons (total)<br />
Non-methane hydrocarbons<br />
11 (I 1 2.2 1 3.4<br />
:,: ., .,,,_,_. ::. ..;:,:,::- .“,:~:>~,:..,.-<br />
1 2.0 1 1.7 JO.80<br />
::.:.;,,.:. :. ,..:. ;(:, ,,. ,, ,.,: .::..::.r.:.. ., ‘: :. .:..: :.I’<br />
0.80)<br />
> .’ .:::.:.~::~...::::~.:~..I o,(j jo.31)<br />
Carbon monoxide<br />
Cold-temp. carbon monoxide g<br />
oNitrogen x i d<br />
Particulates<br />
e<br />
8:<br />
1<br />
e<br />
3.4 4.2<br />
1::. .$ : j, .! .,i .:.; ~~;~~~~~~~~~~~~~~~:~~:.~~~~~~..;~~~ ..: ; ,:jl;: .:. ..:;.:<br />
,<br />
;i-“2;..~ I-gj:‘:i.-l:iE,~~~:l.~..~~~~~~-~~~~.~:; ::$$tf; ;.I.< :, “4 y<br />
s~,~~.<br />
. . :: ..:__. .A.. . .<br />
I I . . c, )<br />
. . . . . . ::.. 1. ::.. >:+:.:.:: . . . . . ..-...-.,._., \-,., ,.,.,. :.:.:.:.:.:.:.~.:.:.)‘.:: _.,. :_:: . . : .‘:._ :.I,‘. ..y. ,.,_, .,:. ,., ,.;;,. :. :. .,~,:,“~:‘::;,-.:.‘y..: :. ..I ..- .‘..‘ ,,,. . . . . ,-:.:i: ::. :,:;::: ;,,: :‘:.::.Y..<br />
: :.. ‘.:, __ :: ‘2 ._ :::: .::.: :..:.y.:.‘.~$~..; y.:.:: >:.:.:,.‘.;.~.>: :.,_ .:.r~,‘.‘~.:.:,’ . . i : ;,.:..:, ,:. . . . . . . . . . . ,,...: ..:. ,,., _ .).,., .:. :,~.~.~.., y ._: :. “: ._ ‘._. ::,,. .:_:, ::. -. ..ii: . . : _. . . ;. . . ., ,. . . :.I, . . . .,.,...;..,..... _. ,_.,I :.: ._l :: ,I;a. .i_. ,.1:::,;:.: ..,.. .,.,. .,~.., j _: .,., 1 0.08 (0.10)<br />
Source:<br />
40 CFR 86.082-2; 40 CFR 86.085-2; 40 CFR 86.090-2; 40 CFR 86.090-g; 40 CFR 86.091-g; 40 CFR 86,094-g; 40 CFR 86.096-2; 40 CFR 86.096-g; 40 CFR 86,099-g;<br />
40 CFR 86.000-g; 40 CFR 86.001-g; 40 CFR 86.004-g. Lisa Snapp, Office of Air and Radiation, Environmental Protection Agency, Personal communication.<br />
aLight truck categories LDTl-LDT4 were not actually created until 1994. From 1968 to 1978 all trucks with a Gross Vehicle Weight Rating (GVWR) up to 6,000 lbs<br />
were classified as light trucks and were required to meet the same standards. As of 1979, the maximum weight was raised to 8,500 lbs GVWR. During 1988 through 1993, light<br />
trucks were divided into two subcategories that coincide with the current LDTl and LDT2/3/4 categories.<br />
bThe test procedure <strong>for</strong> measuring exhaust emissions has changed several times over the course of vehicle emissions regulation. The 7-mode procedure was used<br />
through model year 1971 and was replaced by the CVS-72 procedure beginning in model year 1972. The CVS-75 became the test procedure as of model year 1975. While it may<br />
appear that the total hydrocarbon and carbon monoxide standards were relaxed in 1972-74, these standards were actually more stringent due to the more stringent nature of the<br />
CVS-72 test procedure. Additional standards <strong>for</strong> carbon monoxide and composite standards <strong>for</strong> non-methane hydrocarbons and nitrogen oxides tested over the new<br />
Supplemental Federal Test Procedure will be phased-in during model years <strong>20</strong>00-02; these standards are not shown in this table.<br />
‘Emission standards had to be met <strong>for</strong> a useful life of 5 years/50,000 miles through model year 1983, and a full useful life of 11 years 1<strong>20</strong>,000 miles was defined <strong>for</strong><br />
1985-93 (several useful life options were available <strong>for</strong> 1984). Beginning in model year 1994, emission standards were established <strong>for</strong> an intermediate useful life of 5 yearsi50,OOO<br />
miles as well as a full useful life of 11 years/1<strong>20</strong>,000 miles (these standards are shown in parentheses). Hydrocarbon standards, however, were established only <strong>for</strong> full useful<br />
life. Tier 1 exhaust standards, except PM standards, were phased-in during 1994-96 at a rate of 40, 80, and 100 percent, respectively. PM standards were phased-in at a rate of 40,<br />
80, and 100 percent during 1995-97.<br />
din 1968-69, exhaust emission standards were issued in parts per million (ppm) rather than grams per mile and are, there<strong>for</strong>e, incompatible with this table.<br />
%o estimate available.<br />
fNo standard set.<br />
“The cold CO emission standard is measured at <strong>20</strong> degrees F (rather than 75 degrees F) and is applicable <strong>for</strong> a 5-year/jO,OOO-mile useful life.<br />
hGross vehicle weight rating (GVWR) is the maximum design loaded weight. Loaded vehicle weight (LVW) is the curb weight (nominal vehicle weight) plus 300 lbs.
Table 4.<strong>20</strong><br />
Federal Exhaust Emission Certification Standards <strong>for</strong> Gasoline- and Diesel-Powered Light Trucks (Category LDT2) a,b,c<br />
(grams per mile)<br />
Prior to<br />
Engine Tvpe & Pollutant control 1968-69 1970-71 1972 1973-74 1975 1976-78 1979-81 1982-83 1984 1985-86 1987 1988-90 1991-93 1994 1995-<strong>20</strong>04<br />
Gasoline<br />
Hydrocarbons (total)<br />
Non-methane hydrocarbons<br />
Carbon monoxide<br />
Source:<br />
40 CFR 86.082-2; 40 CFR 86.085-2; 40 CFR 86090-2; 40 CFR 86,090-g; 40 CFR 86.091-g; 40 CFR 86.094-g; 40 CFR 86.096-2; 40 CFR 86.096-g; 40 CFR 86,099-g; 40 CFR 86.000-g; 40<br />
CFR 86.001-9; 40 CFR 86.004-g. Lisa Snapp, Office of Air and Radiation, Environmental Protection Agency, Personal communication, April 1999.<br />
aLight truck categories LDTl-LDT4 were not actually created until 1994. From 1968 to 1978 all trucks with a Gross Vehicle Weight Rating (GVWR) up to 6,000 Ibs<br />
were classified as light trucks and were required to meet the same standards. As of 1979, the maximum weight was raised to 8,500 lbs GVWR. During 1988-93, light trucks were<br />
divided into two subcategories that coincide with the current LDTl and LDT2/3/4 categories.<br />
bThe test procedure <strong>for</strong> measuring exhaust emissions has changed several times over the course of vehicle emissions regulation. The 7-mode procedure was used<br />
through model year 1971 and was replaced by the CVS-72 procedure beginning in model year 1972. The CVS-75 became the test procedure as of model year 1975. While it may<br />
appear that the total hydrocarbon and carbon monoxide standards were relaxed in 1972-74, these standards were actually more stringent due to the more stringent nature of the<br />
CVS-72 test procedure. Additional standards <strong>for</strong> carbon monoxide and composite standards <strong>for</strong> non-methane hydrocarbons and nitrogen oxides tested over the new<br />
Supplemental Federal Test Procedure will be phased-in during model years <strong>20</strong>00-02; these standards are not shown in this table.<br />
‘Emission standards had to be met <strong>for</strong> a useful life of 5 years/50,000 miles through model year 1983, and a full useful life of 11 years 1<strong>20</strong>,000 miles was defined <strong>for</strong><br />
1985-93 (several<br />
useful life options were available <strong>for</strong> 1984). Beginning in model year 1994, emission standards were established <strong>for</strong> an intermediate useful life of 5 yearsi50,OOO miles as well as<br />
a full useful life of 11 years/1<strong>20</strong>,000 miles (these standards are shown in parentheses). Hydrocarbon standards, however, were established only <strong>for</strong> full useful life. Tier 1 exhaust<br />
standards, except PM standards, were phased-in during 1994-96 at a rate of 40, 80, and 100 percent, respectively. PM standards were phased-in at a rate of 40, 80, and 100<br />
percent during 1995-97.<br />
din 1968-69, exhaust emission standards were issued in parts per million (ppm) rather than grams per mile and are, there<strong>for</strong>e, incompatible with this table.<br />
eNo estimate available.<br />
fNo standard set.<br />
“The cold CO emission standard is measured at <strong>20</strong> degrees F (rather than 75 degrees F) and is applicable <strong>for</strong> a 5-year/50,000mile useful life.<br />
hGross vehicle weight rating (GVWR) is the maximum design loaded weight. Loaded vehicle weight (LVW) is the curb weight (nominal vehicle weight) plus 300 Ibs. P<br />
%
Table 4.21<br />
Federal Exhaust Emission Certification Standards <strong>for</strong> Gasoline- and Diesel-Powered Light Trucks (Category LDT3) u,6,c<br />
Diesel<br />
Hydrocarbons (total)<br />
Non-methane hydrocarbons<br />
IO.80<br />
::I..:,<br />
. ,.. ...,;,.., .
2<br />
2<br />
%<br />
0”<br />
z<br />
Table 4.22<br />
Federal Exhaust Emission Certification Standards <strong>for</strong> Gasoline- and Diesel-Powered Light Trucks (Category LDT4) a,b,c<br />
(grams per mile)<br />
Prior to<br />
Engine Tvne & Pollutant control 1968-69 1970-71 1972 1973-74 1975 1976-78 1979-81 1982-83 1984 1985-86 1987 1988-89 1990 1991-95 1996-<strong>20</strong>04<br />
Hydrocarbons (total)<br />
Non-methane hydrocarbons<br />
L--L-II __ cl_JU, 1 2.0 1 1.7 10.80 I f (0.80)<br />
,,: ._;I c ,.:‘.:,~.:.::::;:.... ,.\. ._.,_,._. . ..i. , ‘;. :oi>.:: .:Q’:>z.> $+,,:.:, ::::_. ;.:., . . .; ;,;,.:; ;, ,: :‘.: ., . ,. ..‘.j::.,.:‘i.:~::;:., : -.I’. ~““:::,.::;$j: : ._._.,.,,,.,,./ .:l:~.::~.:::;::~;~~;~,.~~~:::~.~.~~.~:::~,:.:;,:.: .,.,., j .i,.,_ .,:,< ,,._ ,. .,... y,‘..:.: ::::,.,- ,.,,: ,. ‘.. . . .‘,. . , :. . . . _~...<br />
‘...:.:.,.:.:,,.: . . .._..C _,._., . ; . . ..~~..j~.~~....:.~~,..~.:.~.~.~,~,~.-.~.’.~.~.~.~.~ ,i.,, : _: .:. : ‘..... :...: :.:.:.::.:.:.;.: .,..,, .\ , . . . :.;.:.:.;.. . . ,;,.,., . ~~~.~. ,.L’ . ._ :, ..:. . . :<br />
, i,, I.. ,,,.‘.ihi;aaa*x ~_. ._ .,.:.:.:.:.: .‘i’: :.: I. .:...:.: .::.:. .,., y:<br />
,_. ._ xi ‘“~~.~.‘...‘.‘..~...~.“ _...... :.:.:y;‘:.><br />
xx‘*~.x~\mI^ a*d ^ 0.39 (0.56)<br />
Carbon monoxide<br />
Cold-temp. carbon monoxide R<br />
8: d 1 23 1 39 ---Go--.--- --_-_ L-!L- _-____-_____ -...L..zL----- [ 5.0<br />
. . . . . . . . ..l..:~~:~Br’:‘:~~.:,~~ ..::i~j::ji:l:i:I,........:..~<br />
::.:..:.-..:.. ..I’. :.. : :...~:..,‘~.:‘j:‘,::.~~:;:,~~..~;.,<br />
,.F.‘~~‘:.:~.<br />
.j ,:?.:<br />
:.>;.:.:.,<br />
:.’ :.:..j;:;!:j:<br />
:::. :<br />
:::+::;,j ,~g~;~~i:;:~~..:..~:~~~<br />
,:.. ..::.;:...<br />
:‘._. :.: ‘: :: ::.;:.,:<br />
.,.._<br />
:‘::; ::,>:>;i<br />
,..... 1 12.5<br />
(7.3)<br />
(0<br />
Nitrogen oxides<br />
Particulates<br />
e<br />
.:..:. >;,:.:.:.:.; ..:.. i: ~.:i.:.;.:c,~.~.:.~...~ V..i,.~... .._I.... I.. . _... , .::. . Y:...-_...,.......:.5. . . . . . _....., . .._..I_ :.: ‘.::~:..’ :: . . :.,.: _: .::<br />
1 2.3 1 2.3 1 1.7 1 1.1<br />
:: ,, >‘:, ,.:.,.: ):.‘.:.>: ~:.,..,.““.,...‘,‘. ~ ,... ,.,. :i .,_, . . j . ,,.,.,__., . . . . _, :. ,._.,., : .:: ,_ ::: .___,,, . ., . : 2.; ::, ,.; , __.;, ,. _._.,..._._..___ ..::<br />
: . .<br />
.::,::,.<br />
. . .._ .>_.: _.,.,., _._ ;.. _., :__I ,.,~,...,.,.,. ,.. .,. ..\. ;._ ..,. .,:. .,.,<br />
. . . ..:.,>,.y:. . :.- ..‘.;“.” ~,I . ..i ,.\:&A.. .:_. .: c. ..;,: _: ;:.:, .i... . . . :i.. .
Table 4.23<br />
Federal Exhaust Emission Certification Standards <strong>for</strong> Gasoline- and Diesel-Powered Light Heavy Trucks<br />
(Grams per brake horsepower-hour)<br />
Engine Type & Pollutant 1970-73 1974-78 1979-83 1984 1985-86 1987 1988-89 1990 1991-93 1994-97 1998-<strong>20</strong>03 <strong>20</strong>04+<br />
Gasoline<br />
Hydrocarbons + nitrogen oxides (HC + NOx)<br />
-~:::~~~~~,..:1:~.~~:~~. :: .._ ;:::‘-:::.y{;;: ;.:;:::j >.:: :. :;.\. .:.- . . _. .:. ,. :<br />
. . _,,.. .,_,:. . ...+, ‘:l’::~,.;::::.::i:~~~~~;:::::l:l .,_,.,.__ ,_ _.,. ::‘;,;ii’;;~g~;;$j~~~<br />
Hydrocarbons (HC)<br />
Nitrogen oxides (NOx)<br />
1.9<br />
.a .; .:: : : ,: ,,_., .: ,.,_ .: __.,. _._.;..,.; _::: ,: _,:.. .::, ,; $.:::..:<br />
:,, . . :,. .,.,:,.: :. ::::‘:‘.: ::j::::.: ._‘..> :: :: 7. ::c- :_ .: .: 110.6<br />
Il.1<br />
6.0 15.0 14.0<br />
Carbon Monoxide (CO) lb (40 125 137.1 114.4<br />
Diesel<br />
Hydrocarbons + nitrogen oxides (HC + NOx)<br />
$i;$?’ “:::;,j 1 6 110<br />
--~.---l-,~~.-;~---r-r-~~~.<br />
,. _:.:. \. I.. . . . ...>...-. :. ., :. : . . : .: . . ‘.X.,., ._ .;,__ >::. .,: :..:.,. . ... . . .;:.:.:,y.,:.>, ~ .i._..._. : _.,_,... \ ,: __., ,.,. .; .:. : :. . . . . : .:: , i:: ._:, ,.<br />
g :: ‘::: ().ijO 10.25 (0.10<br />
2.4c<br />
!2 Smoke Opacity (acceleration/lugging/peak) d 40/<strong>20</strong>/a I<strong>20</strong>/15150<br />
$ Weight Criteria <strong>for</strong> Light Heavy Trucks e GVWR over 6,000 lb4 GVWR over 8,500 lbs 1 GVWR 8,501 through 14,000 Ibs<br />
2 Test Procedure (gasoline2f g-mode steady-state MVMA transient<br />
F<br />
(diesel) f 13-mode steady-state 1 EPA transient<br />
1 Useful Life (gasoline) g<br />
Sources:<br />
5 years/50,000 miles 8 years/l 10,000 miies<br />
r?<br />
40 CFR 86.082-2; 40 CFR 86.085-2; 40 CFR 86.088-10; 40 CFR 86.090-2; 40 CFR 86.090-10; 40 CFR 86,090-l 1; 40 CFR 86.091-10; 40 CFR 86.091-l 1; 40 CFR 86.093-I 1; 40<br />
CFR 86.094-I 1; 40 CFR 86.096-2; 40 CFR 86.096-10; 40 CFR 86,096-l 1; 40 CFR 86.098-10; 40 CFR 86,098-l 1; 40 CFR 86.099-10; 40 CFR 86,099-l 1; 40 CFR<br />
E<br />
86,004-l 1; 40 CFR 86.004-15. Lisa Snapp, Office of Air and Radiation, Environmental Protection Agency, Personal communication, April 1999. Rob French, Office of<br />
2<br />
Air and Radiation, Environmental Protection Agency, Personal communication, April 1999.<br />
aNo standard set.<br />
bAlthough emission standards <strong>for</strong> hydrocarbons and carbon monoxide were in effect <strong>for</strong> these years, they were not measured in grams/brake horsepower-hour and are,<br />
there<strong>for</strong>e, incompatible with this table.<br />
‘Vehicles can meet a composite non-methane hydrocarbon and nitrogen oxide standard of 2.5, if they meet a non-methane hydrocarbon standard of no more than 0.5.<br />
dSmoke opacity is expressed in percentage <strong>for</strong> acceleration, lugging, and peak modes (acceleration/lugging/peak). Lugging is when a vehicle is carrying a load.<br />
eGross vehicle weight rating (GVWR) is the maximum design loaded weight.<br />
fSeveral testing procedures have been used during the course of exhaust emission control. A steady-state g-mode test procedure (13-mode <strong>for</strong> diesel) was used <strong>for</strong> 1970-<br />
83 standards, For 1984, either the steady-state tests or the EPA transient test procedure could be used. For diesels, the EPA transient test was required from 1985 to the present.<br />
For gasoline-powered vehicles, either the EPA or MVMA (Motor Vehicle Manufacturers Association) transient test procedure could be used during 1985-86, and the<br />
MVMA procedure was required thereafter.<br />
gEmissions standards apply to the useful life of the vehicle. Useful life was 5 years/50,000 miles through 1983, and 8 years/l 10,000 miles <strong>for</strong> model year 1985 and<br />
after. 1984 was a transitional year in which vehicles could meet the older standard (and test procedure) or the newer one. Useful life requirement <strong>for</strong> gasoline-powered trucks<br />
meeting NOx standards <strong>for</strong> 1998 and after is IO years/l 10,000 miles. The useful life requirements <strong>for</strong> heavy diesel truck standards are more complex and vary by vehicle weight,<br />
pollutant, test procedure, and year. Consult the U.S. Code of Federal Regulations <strong>for</strong> further in<strong>for</strong>mation.
Gasoline<br />
Hydrocarbons (HC)<br />
Nitrogen oxides (NOx)<br />
Table 4.24<br />
Federal Exhaust Emission Certification Standards <strong>for</strong> Gasoline- and Diesel-Powered Heavy Heavy Triicks<br />
(Grams per brake horsepower-hour)<br />
Engine Type & Pollutant 1970-73 1974-78 1979-83 1984 1985-86 1987 1988-89 1990 1991-93 1994-97 1998-<strong>20</strong>03 <strong>20</strong>04+<br />
Carbon Monoxide (CO)<br />
Diesel<br />
Hydrocarbons + nitrogen oxides (HC + NOx)<br />
Hydrocarbons (HC)<br />
Nitrogen oxides (NOx)<br />
Non-methane hydrocarbons + nitrogen oxides<br />
Carbon Monoxide (CO)<br />
Particulates<br />
Smoke Opacity (acceleration/lugging/peak) d<br />
Weight Criteria <strong>for</strong> Heavy Heavy Trucks e<br />
Test Procedure (gasoline)f<br />
(diesel)f<br />
Useful Life (gasoline) g<br />
Sources:<br />
40 CFR 86.082-2; 40 CFR 86.085-2; 40 CFR 86.088-10; 40 CFR 86.090-2; 40 CFR 86.090-10; 40 CFR 86.090-l 1; 40 CFR 86.091-10; 40 CFR 86.091-11; 40 CFR 86,093-l 1;<br />
40 CFR 86,094-l 1; 40 CFR 86.096-2; 40 CFR 86.096-10; 40 CFR 86.096-l 1; 40 CFR 86.098-10; 40 CFR 86,098-l 1; 40 CFR 86.099-10; 40 CFR 86,099-l 1; 40 CFR<br />
86.004-I 1; 40 CFR 86.004-15. Lisa Snapp, Office of Air and Radiation, Environmental Protection Agency, Personal communication, April 1999. Rob French, Office of<br />
Air and Radiation, Environmental Protection Agency, Personal communication, April 1999.<br />
aNo standard set<br />
bAlthough emission standards <strong>for</strong> hydrocarbons and carbon monoxide were in effect <strong>for</strong> these years, they were not measured in grams/brake horsepower-hour and are,<br />
there<strong>for</strong>e, incompatible with this table.<br />
‘Vehicles can meet a composite non-methane hydrocarbons and nitrogen oxides standard of 2.5, if they meet a non-methane hydrocarbon standard of no more than 0.5.<br />
dSmoke opacity is expressed in percentage <strong>for</strong> acceleration, lugging, and peak modes (acceleration/lugging/peak). Lugging is when a vehicle is carrying a load.<br />
eGross vehicle weight rating (GVWR) is the maximum design loaded weight.<br />
fSeveral testing procedures have been used during the course of exhaust emission control. A steady-state g-mode test procedure (13-mode <strong>for</strong> diesel) was used <strong>for</strong> 1970-<br />
83 standards. For 1984, either the steady-state tests or the EPA transient test procedure could be used. For diesels, the EPA transient test was required from 1985 to the present.<br />
For gasoline-powered vehicles, either either the EPA or MVMA (Motor Vehicle Manufacturers Association) transient test procedure could be used during 1985-86, and the<br />
MVMA procedure was required thereafter.<br />
“Emissions standards apply to the useful life of the vehicle. Useful life was 5 years/50,000 miles through 1983, and 8 years/l 10,000 miles <strong>for</strong> model year 1985 and<br />
after. 1984 was a transitional year in which vehicles could meet the older standard (and test procedure) or the newer one. Useful life requirement <strong>for</strong> gasoline-powered trucks<br />
meeting NOx standards <strong>for</strong> 1998 and after is IO years/l 10,000 miles. The useful life requirements <strong>for</strong> heavy diesel truck standards are more complex and vary by vehicle<br />
weight, pollutant, test procedure, and year. Consult the U.S. Code of Federal Regulations <strong>for</strong> further in<strong>for</strong>mation.
0”<br />
8<br />
Table 4.25<br />
C’uZifovniu Passenger Cars and Light Trucks Emission Certification Standards<br />
(grams/mile)<br />
Vehicle Useful Life<br />
Vehicle Emission<br />
5 Years / 50,000 Miles 10 Years / 100,000 Miles<br />
Tw Category THC NMHCb NMOG” CO NOx PM HCHO THC” NMHCb NMOG’ CO NO, PM HCHO<br />
Passenger car Tier 0 - 0.39 - 7.0 0.4 0.08d 0.015”<br />
Tier 1 - 0.25 - 3.4 0.4 0.08d 0.015” - 0.31 - 4.2 0.6 - -<br />
TLEV - - 0.125 ‘3.4 0.4 - 0.015 - - 0.156 4.2 0.6 0.08d 0.018<br />
LEV - - 0.075 3.4 0.2 - 0.015 - - - - 0.090 4.2 0.3 0.08d 0.018<br />
ULEV 0.040 1.7 0.2<br />
0.008<br />
0.055 2.1 0.3 0.04d 0.011<br />
ZEV 0.0 0.00 0.000 0.0 0.0 0.00 0.000 -----------------1111111 0.00 1111 0.00 0.000 0.0 0.0 0.00 0.000<br />
LDTI Tier 0 - 0.39 - 9.0 0.4 0.08d 0.015”<br />
Tier 1 - 0.25 - 3.4 0.4 O.Osd 0.015” - 0.31 - 4.2 0.6 - -<br />
TLEV - - 0.125 3.4 0.4 - 0.015 - - 0.156 4.2 0.6 0.08d 0.018<br />
LEV - - 0.075 3.4 0.2 - 0.015 - - 0.090 4.2 0.3 0.08d 0.018<br />
ULEV - - 0.040 1.7 0.2 - 0.008 - - 0.055 2.1 0.3 0.04d 0.011<br />
ZEV 0.0 0.00 0.000 0.0 0.0 0.00 0.000 0.00 0.00 0.000 0.0 0.0 0.00 0.000<br />
LDT2 Tier 0 - 0.50 - 9.0 1.0 0.08d 0.018”<br />
Tier 1 - 0.32 - 4.4 0.7 0.08d 0.018’ - 0.40 - 5.5 0.97 - -<br />
TLEV - - 0.160 4.4 0.7 - 0.018 - - 0.<strong>20</strong>0 5.5 0.9 O.lod 0.023<br />
LEV - - 0.100 4.4 0.4 - 0.018 - - 0.130 5.5 0.5 O.lOd 0.023<br />
ULEV - - 0.050 2.2 0.4 - 0.009 - - 0.070 2.8 0.5 0.05d 0.013<br />
Source:<br />
U.S. Environmental Protection Agency, Office of Mobile Sources, EPA 4<strong>20</strong>-B-98-001. (Additional resources: www.epa.gov/OMSWWW)<br />
Note:<br />
LDTI = light truck up through 3,750 lbs. loaded vehicle weight; LDT2 = light truck greater than 3,750 lbs. loaded vehicle weight.<br />
a THCE <strong>for</strong> methanol vehicles. Does not apply to CNG vehicles.<br />
’ THCE <strong>for</strong> Tier 0 methanol vehicles. NMHCE <strong>for</strong> other alcohol vehicles.<br />
’ NMHC <strong>for</strong> diesel-fueled vehicles.<br />
d Diesel-fueled vehicles only.<br />
e Ethanol- and methanol-fueled vehicles only.<br />
P<br />
b<br />
0
I Califknia’s<br />
Low-Emission Vehicle regulationsprovide<strong>for</strong> reduced emission vehicles to be available to consumers.<br />
Vehicles meeting these stanclards have even lower emissions than the basic stanclards <strong>for</strong> all new vehicles sold in<br />
Cali<strong>for</strong>nia. Currently, there is a wide array qf TLEVs and LEVs, ancl a few ULEVs and ZEVs on the market. For<br />
a listing of the available low emission vehicles, see the Cali<strong>for</strong>nia Air Resources Board web site referenced below.<br />
Table 4.26<br />
Cali<strong>for</strong>nia Vehicle Emission Reduction <strong>for</strong><br />
Passenger Cars and Light Trucks<br />
Transitional Low-Emission Vehicle (TLEV)<br />
Low-Emission Vehicle (LEV)<br />
Ultra-Low-Emission Vehicle (ULEV)<br />
Zero-Emission Vehicles (ZEV)<br />
Emission reduction from the<br />
basic Cali<strong>for</strong>nia standards’<br />
HC co NOx<br />
50% = zz<br />
70% = 50%<br />
85% 50% 50%<br />
100% 100% 100%<br />
Source:<br />
Cali<strong>for</strong>nia Air Resources Board web site, www.arb.ca.gov/msprog/ccbg/ccbg.htm<br />
(Additional resources: www.arb.ca.gov)<br />
Note:<br />
= indicates equivalent emissions to vehicles meeting the basic Cali<strong>for</strong>nia standard.<br />
?See Table 4.23.<br />
<strong>TRANSPORTATION</strong><strong>ENERGY</strong><strong>DATA</strong><strong>BOOK</strong>: <strong>EDITION</strong>~O-<strong>20</strong>00<br />
1<br />
4-41
4-42<br />
I<br />
The Cak<strong>for</strong>nia Air Resources Board adopted requirements in 1991 <strong>for</strong>fleet mixture in order to meet the emission<br />
standards. By the year <strong>20</strong>01, it is proposed that 90% of each vehicle man.ufacturer’sJleet be low-emission<br />
vehicles. A March 1996 amendment to theplan allows the marketplace to determine the number ofzero emission<br />
vehicles from 1998 to <strong>20</strong>02.<br />
Table 4.27<br />
Cali<strong>for</strong>nia Air Resources Board Requirements <strong>for</strong> Meeting Emission Standards<br />
Year<br />
1993<br />
1994<br />
1995<br />
1996<br />
1997<br />
1998<br />
1999<br />
<strong>20</strong>00<br />
<strong>20</strong>01<br />
<strong>20</strong>02<br />
<strong>20</strong>03<br />
Conventional<br />
vehicles<br />
100%<br />
90%<br />
85%<br />
80%<br />
73%<br />
48%<br />
25%<br />
Transitional<br />
low-emission Low-emission<br />
vehicles vehicles<br />
10%<br />
15%<br />
<strong>20</strong>%<br />
25%<br />
48%<br />
73%<br />
90%<br />
90%<br />
85%<br />
75%<br />
Ultra-lowemission<br />
vehicles<br />
2%<br />
2%<br />
2%<br />
2%<br />
5%<br />
10%<br />
15%<br />
Source:<br />
Cali<strong>for</strong>nia Air Resources Board, Mobile Sources Division, El Monte, CA, 1996.<br />
(Additional resources: www.arb.ca.gov)<br />
<strong>TRANSPORTATION</strong><strong>ENERGY</strong><strong>DATA</strong><strong>BOOK</strong>: <strong>EDITION</strong>~O-<strong>20</strong>00<br />
Zero<br />
emission<br />
vehicles<br />
10%
Source<br />
Figure 5.1<br />
Table 5.4<br />
Table 5.10<br />
Table 5.12<br />
Table 5.18<br />
Chapter 5<br />
Transportation and the Economy<br />
Summary Statistics from Tables/Figures in this Chapter<br />
Share of gasoline cost attributed to taxes, 1998<br />
Canada<br />
France<br />
Germany<br />
47%<br />
80%<br />
74%<br />
Japan 60%<br />
United Kingdom 76%<br />
United States 36%<br />
Retail prices <strong>for</strong> motor fuel in the U.S., 1999 (current cents per gallon)<br />
Gasoline, average <strong>for</strong> all types<br />
122.1<br />
Diesel fuel 97.0<br />
Average price of a new car, 1999 (current dollars)<br />
Domestic<br />
21,022<br />
18,725<br />
Import 30,350<br />
Automobile operating costs, 1999<br />
Variable costs (constant 1998 dollars per 10,000 miles) 1,039<br />
Fixed costs (constant 1998 dollars per 10,000 miles) 4,635<br />
Transportation share of total employment<br />
1960 13.5%<br />
1980 11.3%<br />
1998 10.5%<br />
<strong>TRANSPORTATION</strong> <strong>ENERGY</strong> <strong>DATA</strong> <strong>BOOK</strong>: <strong>EDITION</strong> <strong>20</strong>-<strong>20</strong>00<br />
5-l
Table 5.1<br />
Gasoline Prices <strong>for</strong> Selected Countries, 1978-99<br />
Current dollars per gallon<br />
Average annual<br />
percentage change<br />
1978” 1982” 1986” 1990b 1994b 199Gb 1997b 1998b 1999b 1978-99 1990-99<br />
d d<br />
d d d d d<br />
China 0.93b<br />
1.05<br />
d d d<br />
d d<br />
1.92 2.28 2.25” 2.65’ 2.32 ’ d<br />
d d<br />
India<br />
Japan 2.00’ 2.60” 2.79’ 3.05’ 4.14 3.77 3.28’ 2.94 3.13” 2.2% 0.3%<br />
France 2.15 2.56 2.58 3.40 3.31 4.41 4.22 3.82 3.79 2.7% 1.2%<br />
United Kingdom 1.22 2.42 2.07 2.55 2.86 3.47 4.25 3.90 3.97 5.8% 5.0%<br />
Germany 1.75 2.17 1.88 2.72 3.34 4.32 3.87 3.33 3.36 3.2% 2.4%<br />
United Canada Statesd 0.69 0.66’ 1.37” 1.32” 0.93’ 1.31” 1.92” 1.04” 1.57 1.24 1.80 1.28 1.92 1.42 1.55 1.27 1.54 1.13 3.9% 2.6% -2.4% 0.9%<br />
Average annual<br />
Constant 1998 dollars” per gallon percentage change<br />
1978” 1982” 1986” 1990b 1994b 1 99Gb 1997b 1998b 1999b 1978-99 1990-99<br />
China d d d d d 0.97<br />
d d<br />
1.03 d d<br />
India d d d 2.40 2.51 2.34 2.69” 2.32”<br />
d<br />
d d<br />
Japan 5.00” 4.39’ 4.15’ 3.81” 4.55 3.92 3.33” 2.94 3.06” -2.3% -2.4%<br />
France 5.37 4.32 3.84 4.24 3.64 4.58 4.29 3.82 3.71 -1.7% -1.5%<br />
United Kingdom 3.05 4.09 3.08 3.18 3.15 3.61 4.32 3.90 3.88 1.2% 2.2%<br />
Germany 4.37 3.67 2.80 3.39 3.67 4.49 3.93 3.33 3.29 -1.3% -0.2%<br />
Canada 1.72” 2.31” 1.95” 2.40’ 1.73 1.87 1.95 1.55 1.51 -0.6% -5.0%<br />
United Statese 1.65” 2.23’ 1.38’ 1.30 1.36 1.33 1.44 1.27 1.11 -1.9% -1.7%<br />
Source:<br />
U.S. Department of Energy, Energy In<strong>for</strong>mation Administration, International Energy Annual I998 Washington, DC, January <strong>20</strong>00, Table 7.2 and annual.<br />
(Additional resources: ww.eia.doe.gov)<br />
Note:<br />
Comparisons between prices and price trends in different countries require care. They are of limited validity because of fluctuations in exchange rates; differences in product<br />
quality, marketing practices, z&d market structures; and the extent to which the standard categories of sales are representative of total national sales <strong>for</strong> a given period.<br />
a Prices represent the retail prices (including taxes) <strong>for</strong> premium leaded gasoline. Prices are representative <strong>for</strong> each country based on quarterly data averaged <strong>for</strong> the year<br />
’ Regular gasoline.<br />
’ Data are not available.<br />
d These estimates are <strong>for</strong> international comparisons only and do not necessarily correspond to gasoline price estimates in other sections of the book<br />
c Adjusted by the U.S. Consumer Price Inflation Index.
Figure 5.1. Gasoline Prices <strong>for</strong> Selected Countries, 1990 and 1998<br />
Canada France Germany Japan<br />
Source:<br />
Table 5.1 and International Energy Agency, Energy Prices and Taxes, Fourth Quarter 1998, Paris, France, 1999.<br />
(Additional resources: www.iea.org)<br />
El cost Tax<br />
I998<br />
1990 1998
Table 5.2<br />
Diesel Fuel Prices <strong>for</strong> Selected Countries, 1978-99<br />
Average annual<br />
Current dollars per gallon percentage change<br />
1978” 1982” 1986” 1990b 1994b 199Gb 1997b 1998b 1999b 1978-99 1990-99<br />
b c c c c c c c c<br />
China 0.88 2.73<br />
c c c c c c<br />
India 0.78 0.74 0.92 1.11 1.01<br />
c<br />
c<br />
Japan 1.78 1.90 1.75 2.48 2.51 2.34 2.40 1.95 1.2%<br />
France 1.30 1.88 1.69 1.78 2.10 3.10 3.08 2.71 2.23 2.6% 2.5%<br />
United Kingdom 1.24 2.05 1.71 2.04 2.46 3.26 3.78 3.92 3.47 5.0% 6.1%<br />
Germany 1.48 1.81 1.51 2.72 2.16 3.02 2.91 2.43 2.03 1.5% -3.2%<br />
c<br />
c<br />
Canada 1.27 1.27 1.55 1.47 1.43 1.56 1.46 1.32 -1.8%<br />
United StatesC 0.54 1.16 0.94 0.99 0.96 1.15 1.29 1.12 0.97 2.8% -0.2%<br />
Constant 1998 dollarsd per gallon<br />
Average annual<br />
percentage change<br />
1978” 1982” 1986” 1990b 1994b 1996b 1997b 1998b 1999b 1978-99 1990-99<br />
c c c c c c c c c<br />
China 0.91 2.67<br />
e c c c c c<br />
India 0.97 0.81 0.96 1.13 1.01<br />
c<br />
c<br />
Japan 3.01 2.83 2.18 2.73 2.61 2.38 2.40 1.91 1.5%<br />
France 3.25 3.18 2.51 2.22 2.31 3.22 3.13 2.71 2.18 -1.9% -0.2%<br />
United Kingdom 3.10 3.46 2.54 2.55 2.71 3.39 3.84 3.92 3.40 0.4% 3.2%<br />
3.70 3.06 2.25 3.39 2.38 3.14 2.96 2.43 1.99 -2.9% -5.7%<br />
Germany<br />
c c<br />
Canada 2.15 1.89 1.93 1.62 1.49 1.58 1.46 1.29 -4.4%<br />
United Statesd 1.35 1.96 1.40 1.24 1.06 1.<strong>20</strong> 1.31 1.12 0.95 -1.7% -2.9%<br />
Source:<br />
U.S. Department of Energy, Energy In<strong>for</strong>mation Administration, International Energy Annual 1998, Washington, DC, January <strong>20</strong>00, Table 7.2 and annual.<br />
(Additional resources: www.eia.doe.gov)<br />
Note:<br />
Comparisons between prices and price trends in different countries require care. They are of limited validity because of fluctuations in exchange rates; differences in<br />
product quality, marketing practices, and market structures; and the extent to which the standard categories of sales are representative of total national sales <strong>for</strong> a<br />
given period.<br />
a Prices represent the retail prices (including taxes) <strong>for</strong> diesel fuel. Prices are representative <strong>for</strong> each counky based on quarterly data averaged <strong>for</strong> the year.<br />
b Data are not available.<br />
c These estimates are <strong>for</strong> international comparisons only and do not necessarily correspond to gasoline price estimates in other sections of the book.<br />
d Adjusted by the US. Consumer Price Inflation Index.
-<br />
I<br />
.<br />
I<br />
.<br />
I<br />
.<br />
I<br />
I<br />
Figure 5.2. Diesel Prices <strong>for</strong> Selected Countries, 1990 and 1998<br />
Canada France Germany Japan<br />
Source:<br />
Table 5.2 and International Energy Agency, Energy Prices and Taxes, Fourth Quarter 1998, Paris, France, 1999.<br />
(Additional resources: www.iea.org)<br />
El cost Tax
5-6<br />
I<br />
Though the cost of crude oil certainly injluences the price of gasoline, it is not the only factor which<br />
determines the price at the pump. Processing cost, transportation cost, and taxes also play a major<br />
part of the cost of a gallon of gasoline. The average price of a barrel of crude oil (in constant 1990<br />
dollars) declined by 38% jrom I990 to 1999, while the average price of a gallon of gasoline declined<br />
22% in this same time period.<br />
Table 5.3<br />
Prices <strong>for</strong> a Barrel of Crude Oil and a Gallon of Gasoline, 1978-99<br />
Crude oil” Gasoline”<br />
(dollars per barrel) (cents per gallon)<br />
Ratio of<br />
gasoline<br />
to<br />
crude oil<br />
Year Current Constant 1998” Current Constant 1998”<br />
1978 12.5<br />
31.1 65.2<br />
162.9 219.8<br />
1979 17.7<br />
39.8 88.2<br />
198.1 <strong>20</strong>9.1<br />
1980 28.1<br />
55.5 122.1<br />
241.6 182.7<br />
1981 35.2<br />
63.2 135.3<br />
242.5 161.3<br />
1982 31.9<br />
53.8 128.1<br />
216.4 168.8<br />
1983 29.0<br />
47.4 122.5<br />
<strong>20</strong>0.5 177.5<br />
1984 28.6<br />
44.9 119.8<br />
188.0 175.7<br />
1985 26.8<br />
40.5 119.6<br />
181.3 187.8<br />
1986 14.6<br />
21.6 93.1<br />
138.4 268.7<br />
1987 17.9<br />
25.7 95.7<br />
137.3 224.5<br />
1988 14.7<br />
<strong>20</strong>.2 96.3<br />
132.7 275.7<br />
1989 18.0<br />
23.6 106.0<br />
139.4 247.7<br />
1990 22.2<br />
27.7 121.7<br />
151.8 230.0<br />
1991 19.1<br />
22.8 119.6<br />
143.1 263.5<br />
1992 18.4<br />
21.4 119.0<br />
138.3 271.2<br />
1993 16.4<br />
18.5 117.3<br />
132.4 300.2<br />
1994 15.6<br />
17.2 117.4<br />
129.1 316.3<br />
1995 17.2<br />
18.4 1<strong>20</strong>.5<br />
128.9 293.7<br />
1996 <strong>20</strong>.7<br />
21.5 128.8<br />
133.8 261.2<br />
1997 19.0<br />
19.3 129.1<br />
131.1 284.8<br />
1998 12.5<br />
12.6 111.5<br />
111.5 372.6<br />
1999 17.5<br />
17.1 122.1<br />
118.5 291.3<br />
Average annual percentage change<br />
1978-99 1.6%<br />
-2.8% 3.0% -1.5%<br />
1989-99 -0.3%<br />
-3.2% 1.3% -1.6%<br />
Sources:<br />
Crude oil - U.S. Department of Energy, Energy Infoimation Administration, Monthly Energy Review,<br />
March <strong>20</strong>00, Washington, DC, Table 9.1.<br />
Gasoline - U.S. Department of Energy, Energy In<strong>for</strong>mation Administration, Monthly Energy Review,<br />
March <strong>20</strong>00, Washington, DC, Table 9.4.<br />
(Additional resources: www.eia.doe.gov)<br />
“Refiner acquisition cost of composite (domestic and imported) crude oil.<br />
“Average <strong>for</strong> all types. These prices were collected from a sample of service stations in 85 urban areas<br />
selected to represent all urban consumers. Urban consumers make LIP about 80% of the total U.S. population.<br />
“Adjusted by the Consumer Price Inflation Index.<br />
<strong>TRANSPORTATION</strong><strong>ENERGY</strong><strong>DATA</strong>BOOR: <strong>EDITION</strong>~O-<strong>20</strong>00
Year<br />
Current<br />
Diesel fuel a<br />
Constant<br />
1998”<br />
Table 5.4<br />
Retail Prices <strong>for</strong> Motor Fuel, 1978-99<br />
(cents per gallon, including tax)<br />
Unleaded regular gasoline b Unleaded premium gasoline b Average <strong>for</strong> all<br />
(87 to 88.9 octane) (91 octane and above) gasoline types b<br />
Current<br />
Constant<br />
1998”<br />
Current<br />
Constant<br />
1998”<br />
1978 d<br />
d<br />
67.0<br />
167.4<br />
d<br />
0.0<br />
65.2<br />
1979<br />
d<br />
90.3 <strong>20</strong>2.8<br />
d<br />
0.0<br />
88.2<br />
1980<br />
101 <strong>20</strong>0<br />
124.5 246.3<br />
0.0<br />
122.1<br />
1981<br />
118 212<br />
137.8 247.0<br />
147.0<br />
263.5<br />
135.3<br />
1982<br />
116 196<br />
129.6 218.9<br />
141.5<br />
239.0<br />
128.1<br />
1983<br />
1<strong>20</strong> 196<br />
124.1 <strong>20</strong>3.1<br />
138.3<br />
226.3<br />
122.5<br />
1984<br />
122 191<br />
121.2 190.2<br />
136.6<br />
214.4<br />
119.8<br />
1985<br />
122 185<br />
1<strong>20</strong>.2 182.2<br />
134.0<br />
<strong>20</strong>3.1<br />
119.6<br />
1986<br />
94 0<br />
92.7 137.8<br />
108.5<br />
161.3<br />
93.1<br />
1987<br />
96 138<br />
94.8 136.0<br />
109.3<br />
156.8<br />
95.7<br />
1988<br />
95 131<br />
94.6 130.4<br />
110.7<br />
152.6<br />
96.3<br />
1989<br />
102 134<br />
102.1 134.3<br />
119.7<br />
157.4<br />
106.0<br />
1990<br />
107 0<br />
116.4 145.2<br />
134.9<br />
168.3<br />
121.7<br />
1991<br />
91 109<br />
114.0 136.4<br />
132.1<br />
158.1<br />
119.6<br />
1992<br />
106 123<br />
112.7 130.9<br />
131.6<br />
152.9<br />
119.0<br />
1993<br />
98 111<br />
110.8 125.0<br />
130.2<br />
146.9<br />
117.3<br />
1994<br />
96 0<br />
111.2 122.3<br />
130.5<br />
143.5<br />
117.4<br />
1995<br />
97 0<br />
114.7 122.7<br />
133.6<br />
142.9<br />
1<strong>20</strong>.5<br />
1996<br />
115 1<strong>20</strong><br />
123.1 127.9<br />
141.3<br />
146.8<br />
128.8<br />
1997<br />
129 131<br />
123.4 125.3<br />
141.6<br />
143.8<br />
129.1<br />
1998<br />
112 112<br />
105.9 105.9<br />
125.0<br />
125.0<br />
111.5<br />
1999<br />
97 95<br />
116.5 114.0<br />
Average annualpercentage change<br />
135.7<br />
132.8<br />
122.1<br />
1978-99 -0.2%” -3.8%’ 2.7% -1.8% -0.4%’ -3.7%’ 3.0%<br />
1989-99<br />
Source:<br />
-0.5% -3.4% 1.3% -1.6% 1.3% -1.7% 1.4%<br />
Gasoline - U.S. Department of Energy, Energy In<strong>for</strong>mation Administration, Monthly Energy Review, <strong>20</strong>00, Washington, DC, Table 9.4.<br />
Diesel - U.S. Department of Energy, Energy In<strong>for</strong>mation Administration, International Energy Annual 1998, Washington, DC, January <strong>20</strong>00, Table 7.2.<br />
(Additional resources: www.eia.doe.gov)<br />
Collected from a survey of prices on January 1 of the current year.<br />
bThese prices were collected from a sample of service stations in 85 urban areas selected to represent all urban consumers. Urban consumers make up about 80% of the<br />
total U.S. population.<br />
‘Adjusted by the Consumer Price Inflation Index.<br />
dData are not available.<br />
‘Average annual percentage change is from the earliest year possible to 1999.<br />
Current<br />
Constant<br />
1998”<br />
162.9<br />
198.1<br />
241.6<br />
242.5<br />
216.4<br />
<strong>20</strong>0.5<br />
188.0<br />
181.3<br />
138.4<br />
137.3<br />
132.7<br />
139.4<br />
151.8<br />
143.1<br />
138.3<br />
132.4<br />
129.1<br />
128.9<br />
133.8<br />
131.1<br />
111.5<br />
119.5<br />
-1.5%<br />
-1.5%
Thefielprices shown here are refiner salesprices of transportation fuels to end users, excluding tax. Sales to end users are those made directly to the ultimate<br />
consumer, including bulkconsumers. Bulksales to utility, industrial, and commercial accountspreviously included in the wholesalk category are now counted<br />
as sales to end users.<br />
Table 5.5<br />
Prices <strong>for</strong> Selected Transportation Fuels, 1978-99<br />
(cents per gallon, excluding tax)<br />
Finished aviation Kerosene-type<br />
Propanea<br />
gasoline jet fuel No. 2 diesel fuel<br />
Year Current<br />
Constant<br />
1998b Current<br />
Constant<br />
1998b Current<br />
Constant<br />
1998b Current<br />
Constant<br />
1998b<br />
s 1978 33.5 83.7 51.6<br />
128.9 38.7<br />
96.7 37.7 94.2<br />
2 1979 35.7 80.2 d8.9<br />
154.8 54.7<br />
122.9 58.5 131.4<br />
2 1980 48.2 95.4 108.4<br />
214.5 86.6<br />
171.3 81.8 161.8<br />
2 1981 56.5 101.3 130.3<br />
233.6 102.4<br />
183.6 99.5 178.4<br />
2 1982 59.2 100.0 131.2<br />
221.6 96.3<br />
162.7 94.2 159.1<br />
YJ 1983 70.9 116.0 125.5<br />
<strong>20</strong>5.4 87.8<br />
143.7 82.6 135.2<br />
2 1984 73.7 115.7 123.4<br />
193.7 84.2<br />
132.2 82.3 129.2<br />
71.7 108.7 1<strong>20</strong>.1<br />
182.0 79.6<br />
1<strong>20</strong>.6 78.9 119.6<br />
$ 1985 1986<br />
74.5 110.8 101.1<br />
150.3 52.9<br />
78.7 47.8 71.1<br />
& 1987<br />
70.1 100.6 90.7<br />
130.1 54.3<br />
77.9 55.1 79.0<br />
71.4 98.4 89.1<br />
122.8 51.3<br />
70.7 50.0 68.9<br />
8 1988 1989 61.5 80.9 99.5<br />
130.9 59.2<br />
77.9 58.5 76.9<br />
. . 1990 74.5 92.9 112.0<br />
139.7 76.6<br />
95.6 72.5 90.4<br />
LY<br />
2=i 1991<br />
1993 1992<br />
73.0<br />
64.3<br />
87.4<br />
74.7<br />
104.7<br />
102.7<br />
125.3<br />
119.3<br />
65.2<br />
61.0<br />
78.0<br />
70.9<br />
64.8<br />
61.9<br />
77.6<br />
71.9<br />
67.3 75.9 99.0<br />
111.7 58.0<br />
65.5 60.2 67.9<br />
0” 1994 53.0 58.3 95.7<br />
105.2 53.4<br />
58.7 55.4 GO.9<br />
1995 49.2 52.6 100.5<br />
107.5 54.0<br />
57.7 56.0 59.9<br />
z<br />
1996 60.5 62.9 111.6<br />
116.0 65.1<br />
67.6 68.1 70.8<br />
8<br />
1997 55.2 56.1 112.8<br />
114.6 61.3<br />
62.3 64.2 65.2<br />
1998 40.5 40.5 97.5<br />
97.5 45.2<br />
45.2 49.4 49.4<br />
1999 45.7 44.7 105.9<br />
103.6 53.8<br />
52.6 57.9 56.7<br />
Aver-age annualpercentage change<br />
1978-99 1.5% -2.9% 3.5%<br />
-1.0% 1.6%<br />
-2.9% 2.1% -2.4%<br />
1989-99<br />
Source:<br />
-2.9% -5.8% O.G% -2.3% -1.0% -3.9%<br />
-0.1% -3.0%<br />
U.S. Department of Energy, Energy In<strong>for</strong>mation Administration, Morztlzl~~ Erzeqgv Review, March <strong>20</strong>00, Washington, DC, Table 9.7.<br />
(Additional resources: www.eia.doe.gov)<br />
aConsumer grade.<br />
bAdjusted by the Consumer Price Inflation Index.
Table 5.6<br />
State Taxes on Motor Fuels, 1999<br />
(dollars per gallon or gasoline equivalent gallon)<br />
(Footnotes <strong>for</strong> this table appear on next page)<br />
State Gasoline Diesel fuel Gasohol CNG Propane Methanol Ethanol<br />
Alabama 0.16 0.17 0.16 a a 0.16” 0.16”<br />
Alaska 0.08 0.08 0.08” 0.08 0.00 0.08” 0.08”<br />
Arizona 0.18 0.18 0.00 O.lod 0.18 0.18 0.00<br />
Arkansas 0.185 0.185 0.185 0.05" 0.165 0.185 0.185<br />
Cali<strong>for</strong>nia 0.18 0.18 0.18 0.07" 0.06 0.09 0.09<br />
Colorado 0.22 0.<strong>20</strong>5 0.22 0.<strong>20</strong>5 0.<strong>20</strong>5 0.<strong>20</strong>5 0.<strong>20</strong>5<br />
Connecticut 0.39 0.18 0.38 0.18f 0.18f 0.37" 0.37"<br />
Delaware 0.23 0.22 0.23 0.22 0.22 0.22 0.23<br />
District of<br />
Columbia 0.<strong>20</strong> 0.<strong>20</strong> 0.<strong>20</strong> 0.<strong>20</strong> 0.<strong>20</strong> 0.<strong>20</strong> 0.<strong>20</strong><br />
Florida 0.04 0.04 0.04 a n 0.04" 0.04"<br />
Georgia 0.075 0.075 0.075 0.075 0.075 0.075 0.075<br />
Hawaii (Honolulu)s 0.325 0.325 0.325 0.325 0.22 0.325 0.325<br />
Idaho 0.25 0.25 0.25 0.197" 0.181 0.25" 0.25"<br />
Illinois 0.19 0.215 0.19 0.19 0.19 0.19” 0.19”<br />
Indiana 0.15 0.16 0.15 a a 0.15 0.15<br />
Iowa 0.<strong>20</strong> 0.225 0.19 0.16" 0.<strong>20</strong> 0.19" 0.19"<br />
Kansas 0.18 0.<strong>20</strong> 0.18 0.17 0.17 0.<strong>20</strong> 0.<strong>20</strong><br />
Kentucky 0.15 0.12 0.15 0.12 0.15 0.15 0.15<br />
Louisiana 0.<strong>20</strong> 0.<strong>20</strong> 0.<strong>20</strong> 0.16' 0.16' 0.<strong>20</strong>" 0.<strong>20</strong>"<br />
Maine 0.19 0.<strong>20</strong> 0.19 0.18 0.18 0.18 0.18<br />
Maryland 0.235 0.2425 0.235 0.235 0.235 0.235 0.235<br />
Massachusetts 0.21 0.21 0.21 0.0 0.097 0.21 0.21<br />
Michigan 0.15 0.15 0.18 0.0 0.15 0.15” 0.025"<br />
Minnesota 0.<strong>20</strong> 0.<strong>20</strong> 0.<strong>20</strong> 0.00173Y 0.15 NA 0.<strong>20</strong>"<br />
Mississippi 0.18 0.18 0.18 0.18” 0.17 0.18” 0.18”<br />
Missouri 0.17 0.17 0.17 a a 0.17b 0.17”<br />
Montana 0.27 0.2775 0.27 0.07k a 0.27 0.27<br />
Nebraska 0.253 0.253 0.253 0.253 0.253 0.253 0.253"<br />
Nevada 0.23 0.27 0.23 0.23" 0.23" 0.23 0.23<br />
New Hampshire 0.18 0.18 0.18 0.18 0.18 0.18” 0.18”<br />
New Jersey 0.105 0.135 0.105 0.0525 0.0525 0.105" 0.105"<br />
New Mexico 0.22 0.18 0.22 0.06' 0.06' 0.22b 0.22"<br />
New York 0.08' 0.10’ 0.08' 0.08' 0.08' 0.08l 0.08'<br />
North Carolina 0.217 0.217 0.217 0.217 0.217 0.217 0.217<br />
North Dakota 0.<strong>20</strong> 0.<strong>20</strong> 0.<strong>20</strong> 0.<strong>20</strong> 0.<strong>20</strong> 0.<strong>20</strong>" 0.<strong>20</strong>"<br />
Ohio 0.22 0.22 0.22 0.22 0.22 0.22" 0.22"<br />
<strong>TRANSPORTATION</strong><strong>ENERGY</strong><strong>DATA</strong>BOOIC <strong>EDITION</strong>~O-<strong>20</strong>00<br />
5-9
5-10<br />
Table 5.6 (continued)<br />
State Taxes on Motor Fuels, 1999<br />
(dollars per gallon or gasoline equivalent gallon)<br />
State Gasoline Diesel fuel Gasohol CNG<br />
Oklahoma 0.16 0.13 0.16 a<br />
Oregon 0.24 0.24 0.24 0.24<br />
Pennsylvania 0.12”’ 0.12”’ 0.12”’ 0.12”<br />
Rhode Island 0.28 0.28 0.28 0.0<br />
Propane Methanol Ethanol<br />
0.16 0.16” O.lbb<br />
0.24 0.24 0.24<br />
0.12” 0.12” 0.12”’<br />
0.28 0.28 0.28<br />
South Carolina 0.16 0.16 0.16 0.16 0.16 0.16 0.16<br />
South Dakota 0.18 0.18 0.16 0.06 0.16 0.06 0.06<br />
Tennessee 0.<strong>20</strong> 0.17 0.17 0.13 0.17 0.17 0.17<br />
Texas 0.<strong>20</strong> 0.<strong>20</strong> 0.<strong>20</strong> 0.15 0.15 0.<strong>20</strong>b 0.<strong>20</strong>”<br />
Utah 0.19 0.19 0.19 0.19m 0.19” 0.19 0.19<br />
Vermont 0.16 0.17 0.16 0.16 a 0.16 0.16<br />
Virginia 0.175 0.16 0.175 0.10 0.10 0.175” 0.175”<br />
Washington 0.23 0.23 0.23 a a 0.23 0.23<br />
West Virginia 0.<strong>20</strong>5 0.<strong>20</strong>5 0.<strong>20</strong>5 0.<strong>20</strong>5 0.<strong>20</strong>5 0.<strong>20</strong>5 0.<strong>20</strong>5<br />
Wisconsin 0.254 0.254 0.254 0.<strong>20</strong>3 0.186 0.254 0.254<br />
Wyoming 0.08 0.08 0.00 0.00 0.00 0.08b 0.08”<br />
Source:<br />
Energy Futures, Inc., The Clean Fuels and Electric Vehicles Report, Boulder, CO, February 1999,<br />
pp. 150-151.<br />
aAnnual flat fee.<br />
bBlends with gasoline only.<br />
‘November-February tax rate is $0.02.<br />
dPer 1.25 therm.<br />
ePer 100 ft3.<br />
fCNG, LNG, and LPG are exempt from motor fuel taxes when used as vehicle fuel until July 1, <strong>20</strong>0 1.<br />
“For County of Honolulu; <strong>for</strong> County of Maui LPG tax is $0.<strong>20</strong>/gal. and all other fuels are taxed at $0.1 g/gal.;<br />
other counties have all fuels taxed at $0.26/gal.<br />
“Per therm.<br />
‘Optional: flat fee may be paid instead.<br />
jPer cubic foot; LNG is taxed at $O.l2/gal.<br />
kPer 1<strong>20</strong> ft3.<br />
‘Plus a petroleum business tax; the amount varies but is usually in the ballpark of $0.12-$0.14.<br />
mPlus 0.1035 oil franchise tax.<br />
<strong>TRANSPORTATION</strong><strong>ENERGY</strong><strong>DATA</strong><strong>BOOK</strong>: <strong>EDITION</strong>~O-<strong>20</strong>00
As of January <strong>20</strong>00, only five states offered tax exemptions to encourage the use of gasohol<strong>for</strong> transportation<br />
purposes. This list is quite short compared to the 30 states which offered gasohol tax exemptions BYeen years<br />
ago. Still, the Federal Government encourages gasohol use via a diference in the Federal tax rates of<br />
gasoline and gasohol.<br />
Table 5.7<br />
State Tax Exemptions <strong>for</strong> Gasohol, January 1,<strong>20</strong>0O<br />
State<br />
Exemption<br />
(Cents/gallon of gasohol)<br />
Alaska 8.0<br />
Connecticut 1.0<br />
Idaho 2.5<br />
Iowa 1.0<br />
South Dakota 2.0<br />
Source:<br />
U.S. Department of Transportation, Federal Highway Administration, “Monthly Motor Fuel<br />
Reported by the States, October 1999,” February <strong>20</strong>00, Washington, DC, Table MF-<br />
121T. (Additional resources: www.fhwa.dat.gov)<br />
Fuel<br />
Gasoline<br />
Diesel”<br />
Gasohol<br />
Gasohol<br />
Methanol<br />
Ethanol<br />
CNG<br />
LNG<br />
LPG<br />
Table 5.8<br />
Federal Excise Taxes on Motor Fuels<br />
10% Ethanol<br />
7.7% Ethanol<br />
5.7% Ethanol<br />
10% Methanol<br />
7.7% Methanol<br />
5.7% Methanol<br />
Qualified”<br />
Partially exempt”<br />
Qualified”<br />
Partially exemptc<br />
Cents per gallon<br />
18.40<br />
24.40<br />
13.00<br />
14.24<br />
15.32<br />
12.40<br />
13.78<br />
14.98<br />
12.85<br />
9.<strong>20</strong><br />
12.85<br />
9.25<br />
48.54/m&<br />
11.90<br />
13.60<br />
Source:<br />
Energy Futures, Inc., The Clean Fuels and Electric Vehicles Report, Boulder,<br />
CO, February 1999, pp. 150-l 5 1.<br />
a Reduced diesel rates are specified <strong>for</strong> marine fleets, trains and certain intercity buses. Diesel rates<br />
are also reduced <strong>for</strong> diesel/alcohol blends. Diesel used exclusively in state and local government fleets,<br />
non-profit organization vehicles, school buses and qualified local buses is exempt from Federal taxes.<br />
“Qualified - contains at least 85 percent methanol or ethanol or other alcohol produced from a<br />
substance other than petroleum or natural gas.<br />
“Partially exempt - > 85 percent alcohol and produced from natural gas.<br />
dThousand cubic feet.<br />
<strong>TRANSPORTATION</strong> <strong>ENERGY</strong> <strong>DATA</strong> <strong>BOOK</strong>: <strong>EDITION</strong> <strong>20</strong>-<strong>20</strong>00<br />
5-l 1
5-12<br />
State Ethanol tax incentives<br />
CA<br />
FL<br />
HI<br />
ID<br />
IN<br />
IL<br />
IA<br />
MO<br />
MT<br />
NE<br />
NC<br />
OH<br />
SD<br />
WY<br />
$O.O8/ethanol gallon (blender)<br />
Table 5.9<br />
States With Ethanol Tax Incentives<br />
E&5 and M85 excise tax is half of the gasoline tax. Neat alcohol fuels are exempt from<br />
fuel taxes.<br />
County governments receive waste reduction credits <strong>for</strong> using yard trash, wood, or<br />
paper waste as feed stocks <strong>for</strong> fuel.<br />
4% ethanol sales tax exemption<br />
$0.2 1 excise tax exemption <strong>for</strong> ethanol or biodiesel<br />
10% gross income tax deduction <strong>for</strong> improvements to ethanol producing facilities.<br />
2% sales tax exemption <strong>for</strong> 10% volume ethanol blends<br />
$0.01 (blender)<br />
$0.25 (producer), $0.005 (blender) until Oct. 1, 1997<br />
$0.<strong>20</strong> (producer)<br />
$0.30 (producer)<br />
$0.<strong>20</strong> (producer), $0.50 ETBE (producer)<br />
Individual income and corporate tax credit of <strong>20</strong>% <strong>for</strong> the construction of an ethanol<br />
plant using agricultural or <strong>for</strong>estry products; an additional 10% if the distillery is<br />
powered with alternative fuels.<br />
$0.40 (producer)<br />
$0.01 (blender), income tax credit<br />
$0.<strong>20</strong> (blender), $0.<strong>20</strong> (producer) Alternative fuels are taxed at $O.O6/gal<br />
$0.40 (producer)<br />
Source:<br />
U.S. Department of Energy, Clean Cities Guide to AlternativeFuel Vehicle Incentives andlaws, 2nd<br />
edition, Washington, DC, November 1996.<br />
(Additional resources: www.ccities.doe.gov)<br />
<strong>TRANSPORTATION</strong><strong>ENERGY</strong><strong>DATA</strong><strong>BOOK</strong>: <strong>EDITION</strong>~O-<strong>20</strong>00
I<br />
In current dollars, import cars, on average, were less expensive than domestic cars until 1982.<br />
Since then, import prices have nearly tripled, while domestic prices have nearly doubled (current<br />
dollars).<br />
Year<br />
Domestic”<br />
Table 5.10<br />
Average Price of a New Car, 1970-99<br />
Import<br />
Current<br />
dollars<br />
Constant<br />
1998<br />
dollars” %E<br />
Constant<br />
1998<br />
dollars”<br />
Total<br />
Constant<br />
Current 1998<br />
dollars dollars”<br />
1970 3,708 15,568 2,648 11,118 3,542 14,872<br />
1971 3,919 15,776 2,769 11,147 3,742 15,064<br />
1972 4,034 15,721 2,994 11,668 3,879 15,117<br />
1973 4,181 15,339 3,344 12,268 4,052 14,865<br />
1974 4,524 14,956 4,<strong>20</strong>6 13,310 4,440 14,679<br />
1975 5,084 15,400 4,384 13,280 4,950 14,994<br />
1976 5,506 15,769 4,923 14,099 5,418 15,517<br />
1977 5,985 16,102 5,072 13,645 5,814 15,642<br />
1978 6,478 16,188 5,934 14,829 6,379 15,941<br />
1979 6,889 15,473 6,704 15,058 6,847 15,379<br />
1980 7,609 15,055 7,482 14,803 7,574 14,985<br />
1981 8,912 15,976 8,896 15,947 8,910 15,972<br />
1982 9,865 16,662 9,957 16,818 9,890 16,727<br />
1983 10,516 17,<strong>20</strong>8 10,868 17,784 10,606 17,356<br />
1984 11,079 17,390 12,336 19,362 11,375 17,854<br />
1985 11,589 17,563 12,853 19,479 11,838 17,941<br />
1986 12,3 19 18,317 13,670 <strong>20</strong>,326 12,652 18,812<br />
1987 12,922 18,536 14,470 <strong>20</strong>,757 13,386 19,<strong>20</strong>2<br />
1988 13,418 18,493 15,221 <strong>20</strong>,978 13,932 19,<strong>20</strong>1<br />
1989 13,936 18,327 15,510 <strong>20</strong>,397 14,371 18,899<br />
1990 14,489 18,076 16,640 <strong>20</strong>,760 15,042 18,766<br />
1991 15,192 18,182 16,327 19,540 15,475 18,521<br />
1992 15,644 18,175 18,593 21,601 16,336 18,979<br />
1993 15,976 18,029 <strong>20</strong>,261 22,864 16,871 19,039<br />
1994 16,930 18,619 21,989 24,183 17,903 19,689<br />
1995 16,864 18,035 23,<strong>20</strong>2 24,813 17,959 19,<strong>20</strong>6<br />
1996 17,468 18,152 26,<strong>20</strong>5 27,23 1 18,777 19,512<br />
1997 17,838 18,116 28,193 28,633 19,551 19,856<br />
1998 18,579 18,579 31,986 31,986 <strong>20</strong>,849 <strong>20</strong>,849<br />
1999 18,725 18,323 30,350 29,699 21,022 <strong>20</strong>,571<br />
Average annualpercentage change<br />
1970-99 5.7% 0.6% 8.8% 3.4% 6.3% 1.1%<br />
1989-99 3.0% 0.0% 6.9% 3.6% 3.9% 0.9%<br />
Source:<br />
U.S. Department of Commerce, Bureau of Economic Analysis, National Income and Product Accounts,<br />
underlying detail estimates <strong>for</strong> Motor Vehicle Output, Washington, DC, <strong>20</strong>00.<br />
(Additional resources: www.stat-usa.gov)<br />
“Includes transplants.<br />
bAdjusted by the Consumer Price Inflation Index.<br />
<strong>TRANSPORTATION</strong><strong>ENERGY</strong><strong>DATA</strong><strong>BOOK</strong>: <strong>EDITION</strong>~O-<strong>20</strong>00<br />
5-13
5-14<br />
Table 5.11<br />
Average Price of a New Car by Sector, 1970-99<br />
Consumer Business Government<br />
Year<br />
Current<br />
dollars<br />
Constant<br />
1998<br />
dollars”<br />
Current<br />
dollars<br />
Constant<br />
1998<br />
dollars”<br />
Current<br />
dollars<br />
Constant<br />
1998<br />
dollars”<br />
1970 3,507 14,725<br />
3,676 15,434 2,976 12,495<br />
1971 3,705 14,915<br />
3,878 15,611 3,150 12,681<br />
1972 3,840 14,965<br />
4,036 15,728 3,249 12,662<br />
1973 4,035 14,803<br />
4,137 15,177 3,23 1 11,853<br />
1974 4,459 14,742<br />
4,448 14,705 3,351 11,078<br />
1975 4,960 15,025<br />
4,994 15,128 3,604 10,917<br />
1976 5,424 15,534 5,482 15,700 3,739 10,708<br />
1977 5,801 15,607 5,887 15,838 4,813 12,949<br />
1978 6,433 16,076 6,319 15,791 5,180 12,945<br />
1979 6,871 15,433<br />
6,858 15,404 5,518 12,394<br />
1980 7,619 15,074<br />
7,537 14,912 6,164 12,196<br />
1981 9,028 16,183<br />
8,743 15,673 7,217 12,937<br />
1982 10,070 17,009<br />
9,598 16,211 7,932 13,397<br />
1983 10,901 17,838 10,108 16,541 8,152 13,340<br />
1984 11,705 18,372 10,867 17,057 9,034 14,180<br />
1985 12,163 18,433 11,493 17,418 9,546 14,467<br />
1986 13,047 19,400 12,078 17,959 10,188 15,149<br />
1987 13,777 19,763 12,723 18,251 10,946 15,702<br />
1988 14,337 19,759 13,238 18,245 12,585 17,345<br />
1989 14,783 19,441 13,599 17,884 14,497 19,065<br />
1990 15,8<strong>20</strong> 19,737 13,816 17,236 14,279 17,814<br />
1991 16,337 19,552 14,413 17,250 16,103 19,272<br />
1992 17,089 19,854 15,321 17,800 17,55 1 <strong>20</strong>,391<br />
1993 17,608 19,871 15,918 17,963 18,171 <strong>20</strong>,506<br />
1994 18,806 <strong>20</strong>,682 16,917 18,605 18,398 <strong>20</strong>,234<br />
1995 18,895 <strong>20</strong>,<strong>20</strong>7 17,0<strong>20</strong> 18,<strong>20</strong>2 17,048 18,232<br />
1996 <strong>20</strong>,098 <strong>20</strong>,885 17,718 18,412 14,099 14,651<br />
1997 21,177 21,507 18,<strong>20</strong>1 18,485 15,027 15,261<br />
1998 22,715 22,715 19,218 19,218 15,105 15,105<br />
1999 23,040 22,546 19,166 18,755 14,984 14,663<br />
Average annual percentage change<br />
1970-99 6.7% 1.5% 5.9% 0.7% 5.7% 0.6%<br />
1989-99 4.5% 1.5% 3.5% 0.5% 0.3% -2.6%<br />
Source:<br />
U.S. Department of Commerce, Bureau of Economic Analysis, National Income and Product Accounts,<br />
underlying detail estimates <strong>for</strong> Motor Vehicle Output, Washington, DC, <strong>20</strong>00.<br />
(Additional resources: www.stat-usa.gov)<br />
‘Adjusted by the Consumer Price Inflation Index.<br />
<strong>TRANSPORTATION</strong> <strong>ENERGY</strong> <strong>DATA</strong> <strong>BOOK</strong>: <strong>EDITION</strong> <strong>20</strong>-<strong>20</strong>00
I<br />
The total cost of operating an automobile is the sum of the fuced cost (depreciation, insura?zFe, jkance charge, and license fee) and the variable cost, which is<br />
related to the amount of travel. The cost of operating a car in 1999 (constant 1998 cents) was approximately 57 cents per mile. Gas and oil accounted<strong>for</strong> only<br />
9.7% of total costper mile in 1999, which is the lowest in the series histoT.<br />
Table 5.12<br />
Automobile Operating Cost per Mile, 1975-99<br />
Variable costs (constant 1998 cents per mile”) Constant 1998 dollars per 10,000 miles ’<br />
Total cost per<br />
Model<br />
year ’ Gas and oil<br />
Percentage gas and<br />
oil of total cost Maintenance Tires Variable cost Fixed cost Total cost<br />
mile b (constant<br />
1998 cents “)<br />
1975 14.60 26.3% 2.94 2.00 1,954 3,593 5,546 55.46<br />
1977 11.06 <strong>20</strong>.4% 2.77 1.78 1,560 3,871 5,432 54.32<br />
1979 9.23 17.1% 2.47 1.46 1,316 4,068 5,384 53.84<br />
1980 11.59 21.0% 2.22 1.27 1,508 4,022 5,530 55.30<br />
1981 11.24 19.6% 2.12 1.29 1,465 4,257 5,722 57.22<br />
1982 11.38 <strong>20</strong>.8% 1.69 1.06 1,414 4,050 5,464 54.64<br />
1983<br />
1984<br />
1985d<br />
1986<br />
10.87<br />
9.72<br />
9.34<br />
6.66<br />
19.9%<br />
19.8%<br />
22.6%<br />
15.1%<br />
1.70<br />
1.63<br />
1.86<br />
2.04<br />
1.11<br />
0.99<br />
0.99<br />
1 .oo<br />
1,368<br />
1,234<br />
1,218<br />
969<br />
4,101<br />
3,682<br />
2,904<br />
3,430<br />
5,469<br />
4,916<br />
4,122<br />
4,400<br />
54.69<br />
49.16<br />
41.22<br />
44.00<br />
1987 6.89 14.7% 2.30 1.15 1,033 3,649 4,682 46.82<br />
1988 7.17 13.6% 2.21 1.10 1,089 4,176 5,265 52.65<br />
1989 6.84 13.6% 2.50 1.05 1,039 3,985 5,024 50.24<br />
1990 6.74 13.2% 2.62 1.12 1,048 4,062 5,110 51.10<br />
1991 8.02 15.4% 2.63 1.08 1,173 4,050 5,223 52.23<br />
1992<br />
1993<br />
1994<br />
6.97<br />
6.77<br />
6.16<br />
13.1%<br />
13.3%<br />
12.0%<br />
2.56<br />
2.71<br />
2.75<br />
1.05<br />
1.02<br />
1.21<br />
1,057<br />
1,050<br />
1,012<br />
4,260<br />
4,045<br />
4,119<br />
5,318<br />
5,094<br />
5,130<br />
53.18<br />
50.94<br />
51.30<br />
1995 6.42 12.3% 2.78 1.50 1,069 4,161 5,23 1 52.31<br />
1996<br />
1997<br />
6.13<br />
6.70<br />
11.5%<br />
12.4%<br />
2.91<br />
2.84<br />
1.45<br />
1.42<br />
1,050<br />
1,097<br />
4,295<br />
4,294<br />
5,344<br />
5,391<br />
53.44<br />
53.91<br />
1998 6.30 11.5% 3.10 1.40 1,080 4,403 5,483 54.83<br />
1999 5.49’ 9.7% 3.23 1.67 1,039 4,635 5,674 56.74<br />
Average annual percentage change<br />
1975-84 -4.4% -6.3% -7.5% -4.9% 0.3% -1.3% -1.3%<br />
1985-99 -3.5% 4.0% 3.8% -1.1% 3.4% 2.3% 2.3%<br />
Source:<br />
American AutomobiIe Association, Your Driving Costs, 1999 Edition, Heathrow, FL, and annual. (Additional resources: www.aaa.com, www.nmzheimer.com)<br />
” Adjusted by the Consumer Price Inflation Index.<br />
’ Based on 10,000 miles per year.<br />
’ Data <strong>for</strong> 1976 and 1978 are not available.<br />
d Fixed and total operating costs precedin,0 1985 are not comparable with 1985 and later data. Fixed cost depreciation from 1975-84 was based on four years or 60,000 miles. After 1984,<br />
the depreciation was based on six years or 60,000 miles.<br />
’ Fuel cost data used in this c&ulation was l.O98/gallon; which is much lower than most 1999 averages. This calculation was done early in 1999 when prices were<br />
much lower.<br />
- -. .- .-<br />
I
Model year Fire & theftb<br />
1975 161<br />
1977<br />
1978<br />
1979<br />
1980<br />
1981<br />
1982<br />
1983<br />
1984<br />
1985<br />
1986<br />
1987<br />
1988<br />
1989<br />
1990<br />
1991<br />
1992<br />
1993<br />
1994<br />
1995<br />
1996<br />
1997<br />
1998<br />
1999<br />
215 506<br />
142 345<br />
166 377<br />
138 340<br />
136 323<br />
90 258<br />
131 329<br />
126 314<br />
139 300<br />
128 284<br />
125 281<br />
119 280<br />
143 322<br />
137 308<br />
138 309<br />
131 303<br />
121 262<br />
100 227<br />
102 226<br />
113 257<br />
108 307<br />
115 262<br />
159 318<br />
Table 5.13<br />
Fixed Automobile Operating Costs per Year, 1975-99<br />
(constant 1998 dollars)”<br />
Property License, Average<br />
damage & registration Finance fixed cost<br />
Collision” liabilityd &taxes Depreciation charge Total per day<br />
427 573 91 2,342 e 3,593 9.84<br />
673 199 2,279<br />
572 185 2,234<br />
541 <strong>20</strong>2 2,116<br />
491 162 2,054<br />
455 158 2,307<br />
410 91 2,290<br />
363 167 2,198<br />
353 166 1,894<br />
323 174 1,899<br />
345 193 1,963<br />
361 <strong>20</strong>1 2,160<br />
391 192 2,459<br />
406 199 2,754<br />
397 <strong>20</strong>6 2,941<br />
422 <strong>20</strong>2 3,043<br />
433 <strong>20</strong>8 3,230<br />
434 <strong>20</strong>7 3,253<br />
440 224 3,286<br />
438 226 3,314<br />
443 238 3,334<br />
407 223 3,319<br />
479 223 3,294<br />
474 221 3,367<br />
Average annualpercentage change<br />
1975-99 -0.1% -1.2% -0.8% 3.8% 1.5% e 1.7%<br />
1989-99 1.1% - 0 . 1 % 1.6% 1.1% 2.0% -0.1% 1.4%<br />
Source:<br />
American Automobile Association, “Your Driving Costs,” 1999 Edition, Heathrow, FL, and annual. (Additional resources: www.aaa.com,<br />
www.runzheimer.com)<br />
Note:<br />
The data in this table are costs peryeau, while the data on the previous table are costs per mile.<br />
a Adjusted by the Consumer Price Inflation Index.<br />
b $50 deductible 1975 through 1977; $100 deductible 1978 through 1992; $250 deductible <strong>for</strong> 1993 - on.<br />
’ $100 deductible through 1977; $250 deductible 1978 through 1992; $500 deductible <strong>for</strong> 1993 - on.<br />
d Coverage: $100,000/$300,000.<br />
c Data are not available.<br />
c<br />
e<br />
665<br />
837<br />
878<br />
910<br />
913<br />
829<br />
864<br />
947<br />
862<br />
779<br />
823<br />
848<br />
932<br />
967<br />
785<br />
764<br />
780<br />
808<br />
805<br />
802<br />
811<br />
3,871 10.60<br />
3,479 9.52<br />
4,068 11.14<br />
4,022 11.02<br />
4,257 11.67<br />
4,050 11.10<br />
4,101 11.24<br />
3,682 10.09<br />
3,699 10.14<br />
3,860 10.57<br />
3,991 10.93<br />
4,219 11.56<br />
4,648 12.73<br />
4,837 13.25<br />
5,047 13.82<br />
5,272 14.44<br />
5,062 13.87<br />
5,041 13.81<br />
5,085 13.93<br />
5,193 14.23<br />
5,169 14.17<br />
5,175 14.18<br />
5,351 14.66<br />
1.7%<br />
1.4%
Year<br />
1970<br />
1980<br />
1990<br />
1997<br />
1998<br />
1970<br />
1980<br />
1990<br />
1999<br />
Table 5.14<br />
Economic Indicators, 1970-99<br />
(billion dollars)<br />
Gross National Total transportation<br />
Product outlays<br />
Constant Constant<br />
Current 1998” Current 1998”<br />
Transportation as a<br />
percent of GNP<br />
1,015.5 4,194.0 192.8 809.5 19.0%<br />
2,732.0 5,327.4 533.0 1,054.6 19.5%<br />
5,567.8 6,848.4 951.0 1,186.4 17.1%<br />
8,102.9 8,102.9 1,317.2 1,337.7 16.3%<br />
8,750.O 8,750.O 1,378.l 1,378.l 15.7%<br />
Personal Consumption Transportation Personal Transportation PCE as<br />
Expenditures Consumption Expenditures” a percent of total PCE<br />
640.0 2,687.l 81.5 342.2 12.7%<br />
1,732.6 3,428.0 238.5 471.9 13.8%<br />
3,761.2 4,692.4 453.9 566.3 12.1%<br />
6,257.3 6,123.l 694.6 679.7 11.1%<br />
Sources:<br />
GNP - U.S. Department of Commerce, Bureau of Economic Analysis, Survey of Current Business, April <strong>20</strong>00,<br />
Table 1.9, p. D-4, and annual. (Additional resources: www.bea.doc.gov)<br />
Transportation outlays - Eno Transportation Foundation, Transportation in America 1999, Seventeenth Edition,<br />
Lansdowne, VA, <strong>20</strong>00, p. 38.<br />
PCE - U.S. Department of Commerce, Bureau of Economic Analysis, Survey of Current Business, March <strong>20</strong>00,<br />
Table 2.2 and annual. (Additional resources: www.bea.doc.gov/bea/scbinf.html)<br />
Year<br />
1970<br />
1980<br />
1990<br />
1999<br />
Consumer<br />
Price Index<br />
1 .ooo<br />
2.122<br />
3.365<br />
4.291<br />
Table 5.15<br />
Consumer Price Indices, 1970-99<br />
(1970 = 1.000)<br />
Transportation New car Used car<br />
Consumer Consumer Consumer<br />
Price Indexc Price Index Price Index<br />
1.000 1 .ooo 1.000<br />
2.216 1.667 1.995<br />
3.213 2.283 3.769<br />
3.581 2.696 4.872<br />
Gross National<br />
Product<br />
Source:<br />
Bureau of Labor Statistics, Consumer Price Index Table 1A <strong>for</strong> 1999, and annual. [GNP-see above.]<br />
(Additional resources: stats.bls.gov/cpihome.htm)<br />
1 .ooo<br />
2.690<br />
5.483<br />
9.217<br />
a Adjusted by the implicit GNP price deflator.<br />
“Transportation Personal Consumption Expenditures include user operating expenses (new and used auto<br />
purchases, gas and oil, repair, greasing, washing, parking, storage, rental, other motor vehicles, insurance<br />
premiums, tires, tubes and other parts); purchased intercity transportation; and purchased local transportation.<br />
d Transportation Consumer Price Index includes new and used cars, gasoline, auto insurance rates, intracity<br />
mass transit, intracity bus fare, and airline fares.<br />
<strong>TRANSPORTATION</strong><strong>ENERGY</strong><strong>DATA</strong><strong>BOOK</strong>: <strong>EDITION</strong>~O-<strong>20</strong>00<br />
5-17
Table 5.16<br />
Motor Vehicle Manufacturing Employment Statistics, 1972-98<br />
Motor vehicle Sales of Sales of Total Employees per Employees per<br />
manufacturing domestic domestic Employees per Expenditure domestic vehicle million dollar million dollar<br />
employees automobiles” light trucksb hundred per new expenditures” expenditure expenditure<br />
Year (thousands) (thousands) (thousands) vehicles sold domestic car (millions) (current) (constant 199Sd)<br />
1972 415 9,327 2,096 3.6 $4,034 $46,080 9.0 29.9<br />
1973 462 9,676 2,512 3.8 $4,181 $50,958 9.1 28.5<br />
1974 416 7,454 2,163 4.3 $4,524 $43,507 9.6 27.6<br />
1975 375 7,053 2,053 4.1 $5,084 $46,295 8.1 21.4<br />
1976 416 8,611 2,7<strong>20</strong> 3.7 $5,506 $62,388 6.7 16.7<br />
1977 442 9,109 3,108 3.6 $5,985 $73,119 6.0 14.3<br />
1978 470 9,312 3,473 3.7 $6,478 $82,821 5.7 12.5<br />
1979 463 8,341 2,844 4.1 $6,889 $77,053 6.0 12.2<br />
1980 368 6,581 1,959 4.3 $7,609 $64,98 1 5.7 10.5<br />
1981 359 6,<strong>20</strong>9 1,745 4.5 $8,912 $70,886 5.1 8.6<br />
1982 318 5,759 2,062 4.1 $9,865 $77,154 4.1 6.6<br />
1983 349 6,795 2,518 3.7 $10,516 $97,936 3.6 5.5<br />
1984 392 7,952 3,257 3.5 $11,079 $124,185 3.2 4.7<br />
1985 409 8,<strong>20</strong>5 3,691 3.4 $11,589 $137,863 3.0 4.3<br />
1986 400 8,215 3,671 3.4 $12,319 S 146,424 2.7 3.8<br />
1987 381 7,081 3,785 3.5 $12,922 $140,410 2.7 3.7<br />
1988 357 7,526 4,195 3.0 $13,418 $157,272 2.3 3.0<br />
1989 350 7,073 4,108 3.1 $13,936 $155,818 2.2 2.8<br />
1990 329 6,897 3,948 3.0 $14,489 $157,133 2.1 2.6<br />
1991 316 6,137 3,595 3.2 $15,192 $147,849 2.1 2.5<br />
1992 314 6,277 4,233 3.0 $15,644 $164,418 1.9 2.2<br />
1993 319 6,742 4,987 2.7 $15,976 $187,383 1.7 1.9<br />
1994 340 7,255 5,638 2.6 $16,930 $218,278 1.6 1.7<br />
1995 355 7,129 5,663 2.8 $16,864 $215,724 1.6 1.7<br />
1996 342 7,254 6,088 2.6 $17,468 $233,058 1.5 1.5<br />
1997 352 6,917 6,226 2.7 $17,838 $234,440 1.5 1.5<br />
1998 344 6,761 6,683 2.6 $18,579 $249,776 1.4 1.4<br />
Average hnnualpercentage change<br />
1972-98 -0.7% -1.2% 4.6% -1.2% 6.1% 6.7% -6.9% -11.1%<br />
1988-98 -0.4% -1.1% 4.8% -1.4% 3.3% 4.7% -4.8% -7.3%<br />
Source:<br />
Employees - U.S. Department of Labor, Bureau of Labor Statistics, Covered Employment and Wages, SIC 3711, www.bls.gov, April <strong>20</strong>00.<br />
Sales - See Table 6.4. Expenditures - See Table 5.10.<br />
a Vehicles produced in North America.<br />
b Less than 10,000 pounds gross vehicle weight.<br />
c Estimated as domestic auto and light truck vehicle sales multiplied by average expenditure.<br />
d Adjusted by the implicit Gross National Product price deflator.
Employees of motor vehicle and related industries comprise 7.6% of the labor<strong>for</strong>ce. For employment in the<br />
entire transportation industry, see the next table.<br />
Industry<br />
Motor vehicle and equipment<br />
manufacturing<br />
Motor vehicles and equipment<br />
Travel trailers and campers<br />
Transportation equipment not<br />
elsewhere classified<br />
Automotive stampings<br />
Carburetors, pistons, piston<br />
rings, and valves<br />
Vehicular lighting equipment<br />
Storage batteries<br />
Electrical equipment<strong>for</strong><br />
internal combustion engines<br />
Tires and inner tubes<br />
Cold-rolled steel sheet, strip,<br />
and bars<br />
Road construction and<br />
maintenance<br />
Motor freight transportation and<br />
related services<br />
Trucking and courier services,<br />
except by air or by the U.S.<br />
Postal Service<br />
Petroleum refining and wholesale<br />
distribution<br />
Passenger transportation<br />
Automotive sales and servicing<br />
Table 5.17<br />
Employees of Motor Vehicle and Related Industries, 1990 and 1997<br />
1990 1997<br />
Percent of Percent of Percent of Percent of Percent<br />
total motor total U.S. total motor total U.S. change<br />
Employees vehicle employment” Employees vehicle employment” 1990-95<br />
1,055,595 15.0%<br />
707,160 10.0%<br />
14,301 0.2%<br />
17,263 0.2%<br />
111,548 1.6%<br />
19,674 0.3%<br />
15,586 0.2%<br />
23,518 0.3%<br />
61,675 0. Yr%<br />
68,505 1.0%<br />
16,365 0.2%<br />
261,461 3.7%<br />
l&X2,836 23.6%<br />
1.1% 1,192,105 14.8% 1.1% 12.9%<br />
0.8%<br />
0.0%<br />
0.0%<br />
815,513<br />
b<br />
60,739<br />
10.1%<br />
0.1% 126,712 I. 6%<br />
0.0% 18,290 0.2%<br />
0.0% 16,689 0.2%<br />
0.0(X 23,131 0.3%<br />
0.1’S 52,885 0.7%<br />
O.lC% 63,699 0.8%<br />
0.0% 14,447 0.2%<br />
0.3%<br />
1,458,847 <strong>20</strong>.71%; 1.6% 1,811,597<br />
264,8<strong>20</strong> 3.8%<br />
672,27 1 9.5%<br />
3,135,783 44.5%<br />
b<br />
0.8%<br />
b<br />
15.3%<br />
0.8% 0.1% 251.8%<br />
0.1%<br />
0.0%<br />
O.OC%<br />
0.0%<br />
0.1%<br />
0.1%<br />
0.0%<br />
b<br />
13.6%<br />
-7.0%<br />
7.1%<br />
-1.6’X<br />
-14.3%<br />
-7.0%<br />
-11.7%<br />
b b b b<br />
1.8% 2,056,223 25.5% 2.0% 23.7%<br />
0.3% 238,298<br />
0.7% 907,395<br />
3.4% 3,656,899<br />
22.5%<br />
3.0%<br />
11.3%<br />
45.4%<br />
1.7%<br />
0.2%<br />
0.9%<br />
3.5%<br />
24.2%<br />
-10.0%<br />
35.0%<br />
Total of motor vehicle and related 7,052,766 100.0% 7.5% 8,050,9<strong>20</strong> 100.0% 7.6% 14.2%<br />
industries<br />
U.S. Total” 93,476,087 100.0% 105,299,123 100.0% 12.6%<br />
Source:<br />
U.S. Department of Commerce, Bureau of the Census, County Business Patterns web site: tier2censusgov/cbp/, February <strong>20</strong>00.<br />
(Additional resources: wwwcensusgov)<br />
:‘Data <strong>for</strong> employees of establishments totally exempt from FICA are excluded, as are self-employed persons, domestic<br />
service workers, railroad employees, agricultural production workers and most government employees.<br />
“Data are not available.<br />
TELANSPORTATION<strong>ENERGY</strong><strong>DATA</strong><strong>BOOK</strong>: <strong>EDITION</strong>~O-<strong>20</strong>00<br />
16.6%<br />
5-19
5-<strong>20</strong><br />
Transportation Service<br />
Air transport 191<br />
Bus, intercity 41<br />
Local transport 101<br />
Railroads 885<br />
Oil pipeline 23<br />
Taxi 121<br />
Trucking & truck materials 770<br />
Water 232<br />
Total 2,364<br />
Transportation Equipment Manufacturing<br />
Aircraft & parts 646<br />
Motor vehicles, equipment, tires 829<br />
Railroad equipment 43<br />
Ship & boat building & repair 141<br />
Other transportation equipment 33<br />
Total 1,692<br />
Transportation Related Industries<br />
AutomotiveIacccssory retail dealers 807<br />
Automotive wholesalers 215<br />
Automotive service & garages 251<br />
Gasoline service stations 461<br />
Highway & street construction 294<br />
Petroleum’ 311<br />
Other industries<br />
Truck drivers & deliverymen 1,477<br />
Freight handlers 365<br />
Total<br />
Government Transportation Emplovees<br />
4,181<br />
U.S. Department of Transportation 38<br />
Highways, state & local 499<br />
US. Postal Service” 83<br />
Other’ 18<br />
Total 638<br />
Total transportation employment 8,875<br />
Total employed civilians<br />
Transportation percent of total<br />
65,778<br />
Table 5.18<br />
Employment in Transportation and Related Industries, 1960-98<br />
(persons in thousands)<br />
1960 1965 1970 1975 1980 1985 1990 1995 1998<br />
229 351 362 453 537<br />
42 43 39 38 36<br />
83 77 69 79 90<br />
735 627 538 532 346<br />
<strong>20</strong> 18 17 21 19<br />
110 107 83 53 38<br />
882 998 996 1,189 1,285<br />
230 215 190 213 214<br />
2,331 2,436 2,294 2,578 2,565<br />
624 669 514 652 647<br />
945 914 892 904 964<br />
56 51 52 71 34<br />
160 170 194 221 193<br />
57 111 115 149 130<br />
1,842 1,915 1,767 1,997 1,968<br />
902 996 1,076 1,048 1,185<br />
255 3<strong>20</strong> 367 418 433<br />
324 384 400 571 730<br />
522 614 616 561 61 I<br />
324 331 297 268 264<br />
292 333 390 533 568<br />
1,521 1,565 1,796 1,931 2,050<br />
411 456 613 622 574<br />
4,551 4,999 5,545 5,952 6,415<br />
789 9<strong>20</strong> 1,008<br />
<strong>20</strong> 24 26<br />
136 <strong>20</strong>3 235<br />
285 238 231<br />
<strong>20</strong> 15 14<br />
33 31 31<br />
1,534 1,587 1,745<br />
173 175 180<br />
2,990 3,192 3,470<br />
709 451 524<br />
886 1,112 1,130<br />
34 38 37<br />
189 160 164<br />
46 53 55<br />
1,864 1,812 1,910<br />
1,292 1,388 1,356<br />
451 492 518<br />
926 981 1,249<br />
641 649 689<br />
245 228 253<br />
521 429 442<br />
2,148 2,861 2,601<br />
504 536 628<br />
6,728 7,564 7,737<br />
45 66 75 72<br />
61<br />
65 64 65<br />
550 568 569 532 549 569 543 530<br />
83 103 98 92 104 115 118 122<br />
16 12 13 13<br />
11<br />
11<br />
11 12<br />
694 749 755 709 725 760 736 729<br />
9,418 10,099 10,361 11,236 11,673 12,342 13,304 13,845<br />
71,088 78,627 85,783 99,303 107,150 117,914 125,136 131,463<br />
13.5% 13.2% 12.8% 12.1% 11.3% 10.9% 10.5% 10.6% 10.5%<br />
Source:<br />
Eno Transportation Foundation, Transportation in America 1999, Seventeenth Edition, Lansdowne, VA, <strong>20</strong>00, p. 6 1<br />
’ Estimated by assuming transport share of total petroleum industry employment is same as transport share of petroleum domestic demand.<br />
’ Estimated share (approximately 14%) of total employees engaged in transportation work.<br />
’ Agencies include Civil Aeronautics Board (sunset in 19X5), Federal Maritime Commission, Federal Energy Regulatory Commission,<br />
Interstate Commerce Commission, Railroad Retirement Board, and Panama Canal Commission.<br />
<strong>TRANSPORTATION</strong> <strong>ENERGY</strong> <strong>DATA</strong> <strong>BOOK</strong>: <strong>EDITION</strong> <strong>20</strong>-<strong>20</strong>00
Source<br />
Table 6.1<br />
Table 6.2<br />
Table 6.3<br />
Table 6.3<br />
Table 6.5<br />
Table 6.8<br />
Table 6.9<br />
Table 6.10<br />
Chapter 6<br />
Highway Vehicles and Characteristics<br />
Summary Statistics from Tables in this Chapter<br />
U.S. share of world automobile registrations, 1996<br />
U.S. share of world truck & bus registrations, 1996<br />
Number of automobiles, 1998 (Polk - in thousands)<br />
Number of trucks, 1998 (Polk - in thousands)<br />
Vehicle miles traveled, 1997<br />
Automobiles<br />
Motorcycles<br />
Two-axle, four-tire trucks<br />
Other single-unit trucks<br />
Combination trucks<br />
Buses<br />
Average age of vehicles, 1998<br />
Automobiles<br />
Trucks<br />
Median lifetime of vehicles<br />
Automobiles<br />
Light trucks<br />
26.7%<br />
41.3%<br />
125,966<br />
79,077<br />
(million miles)<br />
1,.545,830<br />
10,260<br />
866,228<br />
67,894<br />
128,159<br />
6,996<br />
(years)<br />
8.8<br />
8.3<br />
(years)<br />
<strong>TRANSPORTATION</strong><strong>ENERGY</strong><strong>DATA</strong>BOOIC <strong>EDITION</strong>~O-<strong>20</strong>00 0<br />
14.0<br />
15.2<br />
6-1
1950<br />
1955<br />
1960<br />
2 1965<br />
2 1970<br />
E 1975<br />
r: 1980<br />
2 1985<br />
2 1986<br />
!2 1987<br />
% 1988<br />
2 1989<br />
F 1990<br />
2 1991<br />
1992<br />
E 1993<br />
?Y 1994<br />
g 1995<br />
: 1996<br />
is<br />
2<br />
z 1950-96<br />
L 1970-96 1986-96<br />
8v<br />
Table 6.1<br />
Automobile Registrations <strong>for</strong> Selected Countries, 1950-96<br />
(thousands)<br />
United United U.S. percentage World<br />
Year China India Japan France Kingdom Germanya Canadab StatesC of worldC totaId<br />
c<br />
e<br />
e<br />
e<br />
43<br />
153<br />
e<br />
e<br />
2,307<br />
360<br />
e<br />
e<br />
1,913<br />
2,96 1<br />
40,339<br />
52,145<br />
76.0%<br />
71.4%<br />
53,05 1<br />
73,036<br />
e e<br />
457 4,950 5,650 4,856 4,104 61,671 62.7% 98,305<br />
c e<br />
2,181 8,3<strong>20</strong> 9,131 9,719 5,279 75,258 53.8% 139,776<br />
e<br />
e<br />
8,779 11,860 11,802 14,376 6,602 89,244 46.1% 193,479<br />
e<br />
351<br />
e<br />
e<br />
17,236<br />
23,660<br />
15,180<br />
18,440<br />
14,061<br />
15,438<br />
18,161<br />
23,236<br />
8,870<br />
10,256<br />
106,706<br />
121,601<br />
41.0%<br />
38.0%<br />
260,<strong>20</strong>1<br />
3<strong>20</strong>,390<br />
795 1,607 27,845 <strong>20</strong>,800 18,953 26,099 11,118 127,885 34.5% 370,504<br />
966 1,780 28,654 21,090 19,415 27,224 11,586 130,004 34.1% 380,923<br />
1,112 2,007 29,478 21,500 <strong>20</strong>,108 28,304 11,686 131,482 33.9% 388,188<br />
1,304 2,295 30,776 21,970 <strong>20</strong>,977 29,190 12,086 133,836 33.0% 405,49 1<br />
1,464 2,486. 32,621 22,5<strong>20</strong> 21,919 30,152 12,380 134,559 32.4% 415,844<br />
1,622 2,694 34,924 23,010 22,528 30,695 12,622 133,700 30.7% 435,050<br />
1,852 2,954 37,076 23,550 22,744 31,309 12,578 128,300 29.1% 441,377<br />
2,262 3,<strong>20</strong>5 38,963 24,0<strong>20</strong> 23,008 37,579 12,781 126,581 28.0% 452,3 11<br />
2,860 3,361 40,772 24,385 23,402 39,<strong>20</strong>2 12,927 127,327 28.3% 450,473<br />
3,497 3,569 42,678 24,900 23,832 39,918 13,122 127,883 27.0% 473,487<br />
4,179 3,837 44,680 25,100 24,307 40,499 13,183 128,387 26.9% 477,010<br />
4,700 4,246 46,868 25,500 24,864 41,045 13,300 129,728 26.7% 485,954<br />
e<br />
e<br />
17.1%<br />
e<br />
e<br />
9.1%<br />
16.4%<br />
6.7%<br />
5.0%<br />
Average annual percenta,oeechange<br />
e<br />
5.3%<br />
e<br />
3.0% 2.9%<br />
e<br />
1.9% 2.5%<br />
e<br />
e<br />
0.0%<br />
4.9%<br />
3.6%<br />
2.5%<br />
Source:<br />
Motor Vehicle Manufacturers Association, WorldMotor Vehicle Data, 1998 Edition, Detroit, MI, 1998, pp. 8, 23, 28,42, 85, 98, 169,<strong>20</strong>6, 230 and annual.<br />
(Additional resources: www.aama.com)<br />
a Data <strong>for</strong> 199 1 and prior include West Germany only. Kraftwagen are included with automobiles.<br />
b Data from 199 1 and later are not comparable to prior data.<br />
’ Data from 1985 and later are not comparable to prior data.<br />
d World totals were recalculated from 1985-94 based on change in U.S. data.<br />
e Data are not available.
Year China India Japan France<br />
1950<br />
1955<br />
1960<br />
1965<br />
1970<br />
1975<br />
1980<br />
1985<br />
1986<br />
1987<br />
1988<br />
1989<br />
1990<br />
1991<br />
1992<br />
1993<br />
1994<br />
1995<br />
1996<br />
e e<br />
e e<br />
e e<br />
e e<br />
e e<br />
811<br />
e<br />
1,480 e<br />
2,402 1,045<br />
2,884 1,090<br />
3,247 1,229<br />
3,716 1,383<br />
4,118 1,457<br />
4,496 1,536<br />
4,721 1,687<br />
5,177 1,872<br />
5,316 1,967<br />
5,922 2,083<br />
6,221 2,221<br />
6,750 2,506<br />
1950-96<br />
1970-96<br />
e<br />
e<br />
e<br />
e<br />
1986-96 8.9% 8.7%<br />
Table 6.2<br />
Truck and Bus Registrations <strong>for</strong> Selected Countries, 1950-96<br />
(thousands)<br />
183<br />
318<br />
896<br />
4,119<br />
8,803<br />
10,854<br />
14,197<br />
18,313<br />
19,319<br />
<strong>20</strong>,424<br />
21,674<br />
22,472<br />
22,773<br />
22,839<br />
22,694<br />
22,490<br />
22,333<br />
22,173<br />
21,933<br />
11.0%<br />
3.6%<br />
1.3%<br />
United United U.S. percentage World<br />
Kingdom Germany” Canadab States’ of world totald<br />
c<br />
e<br />
1,060<br />
1,244<br />
1,540 1,534 786<br />
1,770 1,748 1,021<br />
1,850 1,769 1,228<br />
2,210 1,934 1,337<br />
2,550 1,9<strong>20</strong> 1,617<br />
3,310 3,278 1,723<br />
3,980 3,336 1,760<br />
4,<strong>20</strong>0 3,452 1,801<br />
4,370 3,621 1,846<br />
4,570 3,754 1,914<br />
4,748 3,774 1,989<br />
4,910 3,685 2,114<br />
5,040 3,643 2,672<br />
5,065 3,604 2,842<br />
5,140 3,605 2,960<br />
5,195 3,635 3,062<br />
5,255 3,621 3,122<br />
Average annual pevcentageechange<br />
e<br />
2.7%<br />
e<br />
4.1%<br />
2.8%<br />
2.8%<br />
0.8%<br />
e<br />
e<br />
e<br />
e<br />
643 8,823 50.9% 17,349<br />
952 10,544 46.1% 22,860<br />
1,056 12,186 42.6% 28,583<br />
1,232 15,100 39.6% 38,118<br />
1,481 19,175 36.2% 52,899<br />
2,158 26,243 38.8% 67,698<br />
2,955 34,195 37.7% 90,592<br />
3,149 43,804 37.4% 117,038<br />
3,213 45,697 38.6% 118,373<br />
3,576 47,428 37.4% 126,890<br />
3,766 50,557 37.6% 134,294<br />
3,889 52,797 37.4% 141,184<br />
3,931 55,097 37.2% 148,073<br />
3,402 59,837 38.9% 153,695<br />
3,413 63,781 39.6% 161,219<br />
3,409 66,736 40.1% 166,614<br />
3,466 70,162 45.1% 155,591<br />
3,485 73,143 43.1% 169,749<br />
3,515 76,637 41.3% 185,404<br />
Source:<br />
Motor Vehicle Manufacturers Association, World Motor Vehicle Data, 1998 Edition, Detroit, MI, 1998, pp. 8,23, 28,42, 85,98, 169,<strong>20</strong>6,230 and annual.<br />
(Additional resources: www.aama.com)<br />
a Data <strong>for</strong> 199 1 and prior include West Germany only. Kraftwagen are included with automobiles (Table 1.1).<br />
b Data from 199 1 and later are not comparable to prior data.<br />
’ Data from 1985 and later are not comparable to prior data.<br />
d World totals were recalculated from 1985-94 based on change in US. data.<br />
’ Data are not available.<br />
e<br />
e<br />
5.3%<br />
5.3%<br />
4.9%<br />
4.6%<br />
2
6-4<br />
0<br />
VEHICLES IN USE<br />
Both the Federal Highway Administration (FHWA) and The Polk Company report figures on the<br />
automobile and truck population each year. The two estimates, however, differ by as much as 25.6 % <strong>for</strong><br />
trucks (1992). The differences can be attributed to several factors:<br />
The FHWA data include all vehicles which have been registered at any time throughout the calendar<br />
year. There<strong>for</strong>e, the data include vehicles which were retired during the year and may double count<br />
vehicles which have been registered in different states or the same states to different owners. The Polk<br />
Company data include only those vehicles which are registered on July 1 of the given year.<br />
The classification of mini-vans, station wagons on truck chasses, and utility vehicles as passenger cars<br />
or trucks causes important differences in the two estimates. The Polk Company data included<br />
passenger vans in the automobile count until 1980; since 1980 all vans have been counted as trucks.<br />
Recently, the Federal Highway Administration adjusted their definition of automobiles and trucks.<br />
Starting in 1993, some minivans and sport utility vehicles that were previously included with<br />
automobiles were included with trucks. This change produced a dramatic change in the individual<br />
percentage differences of cars and trucks. The difference in total vehicles has been less than 5 % each<br />
year since 1990 and does not appear to be significantly affected by the FHWA reclassifications.<br />
0 The FHWA data include all non-military Federal vehicles, while The Polk Company data include only<br />
those Federal vehicles which are registered within a state. Federal vehicles are not required to have<br />
State registrations, and, according to the General Services Administration, most Federal Vehicles are<br />
not registered.<br />
According to The Polk Company statistics, the number of passenger cars in use in the U.S. declined<br />
from 1991 to 1992. This is the first decline in vehicle stock since the figures were first reported in 1924.<br />
However, the data should be viewed with caution. A redesign of Polk’s approach in 1992 allowed a<br />
national check <strong>for</strong> duplicate registrations, which was not possible in earlier years. Polk estimates that, due<br />
to processing limitations, its vehicle population counts may have been inflated by as much as 1 ‘/z percent.<br />
Assuming that percentage is correct, the number of passenger cars in use would have declined from 1991<br />
to 1992 under the previous Polk method. The growing popularity of light trucks being used as passenger<br />
vehicles could also have had an impact on these figures.<br />
<strong>TRANSPORTATION</strong><strong>ENERGY</strong><strong>DATA</strong>BOOIC <strong>EDITION</strong>~O-<strong>20</strong>00
1970<br />
1971<br />
1972<br />
E 1973<br />
2 1974<br />
4 1975<br />
g 1976<br />
1977<br />
!2<br />
1978<br />
E<br />
1979<br />
;il 1980<br />
2 1981<br />
& 1982<br />
8 1984 1983<br />
Year FHWA<br />
89,243<br />
92,718<br />
97,082<br />
101,985<br />
104,856<br />
106,706<br />
110,189<br />
112,288<br />
116,573<br />
118,429<br />
121,601<br />
123,098<br />
123,702<br />
126,444<br />
128:158<br />
127,885<br />
130,004<br />
131,482<br />
133,836<br />
134,559<br />
133,700<br />
128,300<br />
126,581<br />
127,327<br />
127,883<br />
128,387<br />
129,728<br />
129,749<br />
.<br />
1985<br />
t?<br />
1986<br />
75 1987<br />
z 1988<br />
g 1989<br />
1990<br />
z8<br />
1991<br />
1992<br />
1993<br />
1994<br />
1995<br />
1996<br />
1997<br />
1998 131,839<br />
(3<br />
Table 6.3<br />
Automobiles and Trucks in Use, 1970-98<br />
(thousands)<br />
Automobiles Trucks Total<br />
The Polk Percentage The Polk Percentage The Polk Percentage<br />
Company difference FHWA Company difference FHWA Company difference<br />
80,448 10.9% 18,797 17,688 6.3%<br />
83,138 11.5% 19,871 18,462 7.6%<br />
86,439 12.3% 21,308 19,773 7.8%<br />
89,805 13.6% 23,244 21,412 8.6%<br />
92,608 13.2% 24,630 23,3 12 5.7%<br />
95,241 12.0% 25,781 24,813 3.9%<br />
97,818 12.6% 27,876 26,560 5.0%<br />
99,904 12.4% 29,3 14 28,222 3.9%<br />
102,957 13.2% 31,336 30,565 2.5%<br />
104,677 13.1% 32,914 32,583 1 .O%<br />
104,564 16.3% 33,667 35,268 -4.5%<br />
105,839 16.3% 34,644 36,069 -4.0%<br />
106,867 15.8% 35,382 36,987 -4.3%<br />
108,961 16.0% 36,723 38,143 -3.7%<br />
112,019 14.4% 37,507 40,143 -6.6%<br />
114,662 11.5% 43,210 42,387 1.9%<br />
117,268 10.9% 45,103 44,826 0.6%<br />
119,849 9.7% 46,826 47,344 -1.1%<br />
121,519 10.1% 49,94 1 50,22 1 -0.6%<br />
122,758 9.6% 52,172 53,<strong>20</strong>2 -1.9%<br />
123,276 8.5% 54,470 56,023 -2.8%<br />
123,268 4.1% 59,<strong>20</strong>6 58,179 1.8%<br />
1<strong>20</strong>,347 5.2% 63,136 61,172 3.2%<br />
121,055 5.2% 66,082 65,260 1.3%<br />
121,997 4.8% 69,49 1 66,717 4.2%<br />
123,242 4.2% 72,458 70,199 3.2%<br />
124,613 4.1% 75,940 73,68 1 3.1%<br />
124,673 4.1% 77,307 76,398 1.2%<br />
125,966 4.7% 79,062 79,077 0.0%<br />
108,040 98,136 10.1%<br />
112,589 101,600 10.8%<br />
118,390 106,212 11.5%<br />
125,229 111,217 12.6%<br />
129,487 115,9<strong>20</strong> 11.7%<br />
132,487 1<strong>20</strong>,054 10.4%<br />
138,065 124,378 11.0%<br />
141,602 128,126 10.5%<br />
147,909 133,522 10.8%<br />
151,343 137,260 10.3%<br />
155,267 139,832 11.0%<br />
157,743 141,908 11.2%<br />
159,084 143,854 10.6%<br />
163,166 147,104 10.9%<br />
165,665 152,162 8.9%<br />
171,095 157,049 8.9%<br />
175,106 162,094 8.0%<br />
178,308 167,193 6.6%<br />
183,777 171,740 7.0%<br />
186,73 1 175,960 6.1%<br />
188,171 179,299 4.9%<br />
187,505 181,447 3.3%<br />
189,717 181,519 4.5%<br />
193,409 186,315 3.8%<br />
197,375 188,714 4.6%<br />
<strong>20</strong>0,845 193,441 3.8%<br />
<strong>20</strong>5,669 198,294 3.7%<br />
<strong>20</strong>7,056 <strong>20</strong>1,071 3.0%<br />
210,901 <strong>20</strong>5,043 2.9%<br />
Source:<br />
FHWA - U.S. Department of Transportation, Federal Highway Administration, Highway Statistics 1998, Washington, DC, 1999, Table VM- 1, p. V-47, and annual.<br />
(Additional resources: www.fhwa.dot.gov)<br />
Polk - The Polk Company, Detroit, Michigan. FURTHER REPRODUCTION PROHIBITED. (Additional resources: www.polk.com)<br />
m<br />
Ll
6-6<br />
0<br />
The data on automobile stock by size class are estimations based on historical sales data. This method assumes<br />
a constant scrappage rate<strong>for</strong> all size classes. The data on trucks by weight class are based on estimates from the<br />
1997 Vehicle Inventory and Use Survey (latest available survey).<br />
Autos<br />
Two seaters<br />
Minicompact<br />
Subcompact<br />
Compact<br />
Midsize<br />
Large<br />
Autos<br />
Business fleet autos”<br />
Personal autos<br />
Table 6.4<br />
Vehicle Stock and New Sales in United States, 1998 Calendar Year<br />
Vehicle stock<br />
Thousands Percentage<br />
125,966 100.0%<br />
2,129 1.7%<br />
1,297 1 .O%<br />
27,817 22.1%<br />
40,759 32.4%<br />
36,499 29.0%<br />
17,464 13.9%<br />
125,966 100.0%<br />
9,550 7.6%<br />
116.416 92.4%<br />
Motorcycles 3,879’ 100.0%<br />
Recreational vehicles<br />
c c<br />
Trucks 79,077 100.0%<br />
Light (O-10,000 lbs) 73,971 93.5%<br />
Medium (lO,OOl-26,000 lbs) 2,351 3.0%<br />
Heavy-heavy (26,001 lbs and over) 2,754 3.5%<br />
Trucks 79,077 100.0%<br />
Business fleet trucks< 19,500 lbsd 7,329 9.3%<br />
Personal trucks < 19,500 lbs 68,<strong>20</strong>2 86.2%<br />
Trucks > 19,500 lbs. 3,546 4.5%<br />
Source:<br />
See Appendix A <strong>for</strong> Table 6.4. (Additional resources: www.polk.com)<br />
New sales<br />
Domestic ImporP Total<br />
(thousands) (thousands) (thousands)<br />
6,761 (83.1%) 1,378 (16.9%) 8,139 (100.0%)<br />
0 (0.0%) 12 (100.0%) 12 (100.0%)<br />
1,278 (85.0%) 226 (15.0%) 1,504 (100.0%)<br />
1,863 (80.0%) 465 (<strong>20</strong>.0%) 2,328 (100.0%)<br />
2,524 (80.6%) 608 (19.4%) 3,132 (100.0%)<br />
1,043 (98.3%) 19 (1.7%) 1,062 (100.0%)<br />
54 (52.8%) 48 (47.2%) 101 (100.0%)<br />
c c c<br />
c c c<br />
c c c<br />
c c c<br />
441 (100.0%) 0 (0.0%) 441 (100.0%)<br />
c c<br />
7,826 (100.0%)<br />
6,683 (91.5%) 616 (8.4%) 7,300 (100.0%)<br />
c c<br />
<strong>20</strong>3 (100.0%)<br />
c c<br />
324 (100.0%)<br />
c E c<br />
c c e<br />
c c c<br />
c c c<br />
a Total auto and truck vehicle stock as of July 1 from The Polk Company (FURTHER REPRODUCTION PROHIBITED).<br />
’ Includes domestic-sponsored imports.<br />
’ Data are not available.<br />
’ In fleets of four or more vehicles.<br />
e Includes mostly on-highway motorcycles. Many states do not require registration <strong>for</strong> off-highway vehicles.<br />
<strong>TRANSPORTATION</strong><strong>ENERGY</strong><strong>DATA</strong>BOOIC <strong>EDITION</strong>~O-<strong>20</strong>00
Table 6.5<br />
Highway Vehicle Miles Traveled by Vehicle Type, 1970-98<br />
(million miles)<br />
Two-axle, Other<br />
four-tire single-unit Combination<br />
Year Automobiles Motorcycles trucks trucks trucks Buses” Total<br />
1970 916,700 2,979<br />
1971 966,330 3,607<br />
1972 1,021,365 4,33 1<br />
1973 1,045,981 5,194<br />
1974 1,007,25 1 5,445<br />
1975 1,033,950 5,629<br />
1976 1,078,215 6,003<br />
1977 1,109,243 6,349<br />
1978 1,146,508 7,158<br />
1979 1,113,640 8,637<br />
1980 1,111,596 10,214<br />
1981 1,133,332 10,690<br />
1982 1,161,713 9,910<br />
1983 1,195,054 8,760<br />
1984 1,227,043 8,784<br />
1985 1,246,798 9,086<br />
1986 1,270,167 9,397<br />
1987 1,315,982 9,506<br />
1988 1,370,271 10,024<br />
1989 1,401,221 10,371<br />
1990 1,408,266 9,557<br />
1991 1,358,185 9,178<br />
1992 1,371,569 9,557<br />
1993 1,374,709 9,906<br />
1994 1,406,089 10,240<br />
1995 1,438,294 9,797<br />
1996 1,469,854 9,9<strong>20</strong><br />
1997 1,502,556 10,081<br />
1998 1,545,830 10,260<br />
123,286 27,08 1 35,134<br />
137,870 28,985 37,217<br />
156,622 31,414 40,706<br />
176,833 33,661 45,649<br />
182,757 33,441 45,966<br />
<strong>20</strong>0,700 34,606 46,724<br />
225,834 36,390 49,680<br />
250,591 39,339 55,682<br />
279,414 42,747 62,992<br />
291,905 42,012 66,992<br />
290,935 39,813 68,678<br />
296,343 39,568 69,134<br />
306,141 40,658 70,765<br />
327,643 42,546 73,586<br />
358,006 44,419 77,377<br />
390,961 45,441 78,063<br />
423,915 45,637 81,038<br />
456,870 48,022 85,495<br />
502,<strong>20</strong>7 49,434 88,551<br />
536,475 50,870 91,879<br />
574,571 51,901 94,341<br />
649,394 52,898 96,645<br />
706,863 53,874 99,510<br />
745,750 56,772 103,116<br />
764,634 61,284 108,932<br />
790,029 62,705 115,451<br />
816,540 64,072 118,899<br />
850,739 66,893 124,584<br />
866,228 67,894 128,159<br />
Average annual percentage change<br />
4,544 1,109,724<br />
4,802 1,178,811<br />
5,348 1,259,786<br />
5,792 1,313,110<br />
5,684 1,280,544<br />
6,055 1,327,664<br />
6,258 1,402,380<br />
5,823 1,467,027<br />
5,885 1,544,704<br />
5,947 1,529,133<br />
6,059 1,527,295<br />
6,24 1 1,555,308<br />
5,823 1,595,OlO<br />
5,199 1,652,788<br />
4,640 1,7<strong>20</strong>,269<br />
4,478 1,774,826<br />
4,717 1,834,872<br />
5,330 1,921,<strong>20</strong>4<br />
5,475 2,025,962<br />
5,670 2,096,487<br />
5,726 2,144,362<br />
5,750 2,172,050<br />
5,778 2,247,151<br />
6,125 2,296,378<br />
6,409 2,357,588<br />
6,4<strong>20</strong> 2,422,696<br />
6,563 2,485,848<br />
6,842 2,561,695<br />
6,996 2,625,367<br />
1970-98 1.9% 4.5% 7.2% 3.3% 4.7% 1.6% 3.1%<br />
1988-98 1.2% 0.2% 5.6% 3.2% 3.8% 2.5% 2.6%<br />
Source:<br />
U.S. Department of Transportation, Federal Highway Administration, Highway Statistics 1998,<br />
Washington, DC, 1999, Table VM-1, p. V-47, and annual.<br />
(Additional resources: www.fhwa.dot.gov)<br />
“The data do not correspond with vehicle-miles of travel presented in the “Bus” section of this chapter due<br />
to differing data sources.<br />
<strong>TRANSPORTATION</strong> <strong>ENERGY</strong> <strong>DATA</strong> <strong>BOOK</strong>: <strong>EDITION</strong> <strong>20</strong>-<strong>20</strong>00<br />
6-7
I<br />
z<br />
Age<br />
(years)<br />
Under 1”<br />
1<br />
2<br />
3<br />
4<br />
5<br />
6<br />
7<br />
8<br />
9<br />
10<br />
11<br />
12<br />
13<br />
14<br />
1.5 and older<br />
Subtotal<br />
Age not given<br />
Table 6.6<br />
Automobiles in Operation and Vehicle Travel by Age, 1970 and 1998<br />
1970 1998 1998 Estimated vehicle<br />
Vehicles Cumulative<br />
(thousands) Percentage percentage<br />
6,288 7.8%<br />
9,299 11.6%<br />
8,816 11.0%<br />
7,878 9.8%<br />
8,538 10.6%<br />
8,506 10.6%<br />
7,116 8.8%<br />
6,268 7.8%<br />
5,058 6.3%<br />
4.1%<br />
2,776 3,267 3.5%<br />
2.1%<br />
1,692 799<br />
1.0%<br />
996 1.2%<br />
794 1.0%<br />
2.336 2.9%<br />
80,427<br />
22<br />
100.0%<br />
7.8%<br />
19.4%<br />
30.3%<br />
40.1%<br />
50.8%<br />
61.3%<br />
70.2%<br />
78.0%<br />
84.3%<br />
88.3%<br />
91.8%<br />
93.9%<br />
94.9%<br />
96.1%<br />
97.1%<br />
100.0%<br />
travel Average<br />
Vehicles Cumulative Cumulative annual miles<br />
(thousands) Percentage percentage Percentage percentage per vehicle<br />
5,619 4.5%<br />
8,049 6.4%<br />
7,564 6.0%<br />
8,926 7.1%<br />
7,878 6.3%<br />
7,953 6.3%<br />
7,3<strong>20</strong> 5.8%<br />
7,536 6.0%<br />
7,6<strong>20</strong> 6.0%<br />
8,187 6.5%<br />
8,008 6.4%<br />
7,439 5.9%<br />
6,870 5.5%<br />
5,774 4.6%<br />
4,636 3.7%<br />
16,587 13.2%<br />
125,966<br />
0<br />
Total 80,449 125,966<br />
Average age 5.6 8.8<br />
4.5% 6.1% 6.1% 15,600<br />
10.9% 6.3% 12.4% 11,<strong>20</strong>0<br />
16.9% 5.9% 18.3% 11,300<br />
23.9% 7.2% 25.5% 11,600<br />
30.2% 6.8% 32.3% 12,400<br />
36.5% 7.0% 39.3% 12,700<br />
42.3% 6.6% 45.9% 12,900<br />
48.3% 7.2% 53.1% 13,800<br />
54.4% 7.8% 60.9% 14,800<br />
60.9% 8.2% 69.2% 14,500<br />
67.2% 5.0% 74.2% 9,000<br />
73.1% 4.7% 78.8% 9,000<br />
78.6% 4.3% 83.1% 9,000<br />
83.2% 3.6% 86.7% 9,000<br />
86.8% 2.9% 89.6% 9,000<br />
100.0% 10.4% 100.0% 9,000<br />
Source:<br />
The Polk Company, Detroit, MI. FURTHER REPRODUCTION PROHIBITED.<br />
Vehicle travel - Average annual miles per auto by age were multiplied by the number of vehicles in operation by age to estimate the vehicle travel. Average<br />
annual miles per auto by age - generated by ORNL from the Nationwide Pemorzal T?*ansportation Survey web site: www-cta.oml.gov/npts.<br />
(Additional resources: www.polk.com, www-cta.oml.gov/npts)<br />
aAutomobiles sold as of July 1 of each year.<br />
- -- - _ _. _ - - - -- - - - -. -. -. -. -. -~ .~ _~ .- -~ .-
Table 6.7<br />
Trucks in Operation and Vehicle Travel by Age, 1970 and 1998<br />
1998 Estimated<br />
1970 1998 vehicle travel Average annual<br />
Age Vehicles Cumulative Vehicles Cumulative Cumulative miles per<br />
(years) (thousands) Percentage percentage (thousands) Percentage percentage Percentage percentage vehicle<br />
Under 1” 1,262 7.1% 7.1% 5,030 6.4% 6.4% 7.9% 7.9% 17,500<br />
1 1,881 10.6% 17.8% 6,550 8.3% 14.6% 11.3% 19.1% 19,<strong>20</strong>0<br />
2 1,536 8.7% 26.5% 5,545 7.0% 21.7% 9.8% 29.0% 19,800<br />
3 1,428 8.1% 34.6% 6,165 7.8% 29.5% 9.9% 38.9% 17,900<br />
4 1,483 8.4% 43.0% 5,593 7.1% 36.5% 8.8% 47.6% 17,500<br />
5 1,339 7.6% 50.5% 4,711 6.0% 42.5% 7.2% 54.8% 17,000<br />
6 1,154 6.5% 57.1% 3,870 4.9% 47.4% 5.4% 60.2% 15,600<br />
7 975 5.5% 62.6% 3,800 4.8% 52.2% 5.2% 65.4% 15,400<br />
8 826 4.7% 67.3% 3,647 4.6% 56.8% 4.9% 70.3% 15,100<br />
9 621 3.5% 70.8% 4,171 5.3% 62.1% 4.9% 75.3% 13,<strong>20</strong>0<br />
10 658 3.7% 74.5% 3,979 5.0% 67.1% 3.3% 78.6% 9,<strong>20</strong>0<br />
11 583 3.3% 77.8% 3,418 4.3% 71.4% 2.8% 81.4% 9,<strong>20</strong>0<br />
12 383 2.2% 80.0% 3,448 4.4% 75.8% 2.8% 84.2% 9,<strong>20</strong>0<br />
13 417 2.4% 82.3% 2,855 3.6% 79.4% 2.4% 86.6% 9,<strong>20</strong>0<br />
14 414 2.3% 84.7% 2,367 3.0% 82.4% 2.0% 88.5% 9,<strong>20</strong>0<br />
15 and older 2,710 15.3% 100.0% 13,928 17.6% 100.0% ,, 50, 100.0% 9,<strong>20</strong>0<br />
Subtotal 17,670 100.0% 79,077 100.0%<br />
Age not given 15 0<br />
Total 17,685 79,077<br />
Average age 7.3 8.3<br />
Source:<br />
The Polk Company, Detroit, MI. FURTHER REPRODUCTION PROHIBITED.<br />
Vehicle travel-The average annual vehicle-miles per truck by age were multiplied by the number of trucks in operation by age to estimate the vehicle<br />
travel. Average annual miles per truck by age were generated by ORNL from the 1992 Truck Inventory and Use Survey public use tape provided by U.S.<br />
Department of Commerce, Bureau of the Census, Washington, DC, 1995. (Additional resources: www.polk.com, www.census.gov)<br />
“Trucks sold as of July 1 of each year.
6-10<br />
I<br />
The average age of automobiles was lower than the average age of trucks until 1995. Since then, the<br />
average automobile age continues to grow, while the average truck age has held about the same. The<br />
increasingpopularity of light trucks aspersonalpassenger vehicles may have had an influence on<br />
the average age of truck.<br />
Table 6.8<br />
Average Age of Automobiles and Trucks in Use, 1970-98<br />
(years)<br />
Calendar<br />
Automobiles<br />
year Mean” Medianb<br />
Trucks<br />
Mean” Median”<br />
1970 5.6 4.9 7.3 5.9<br />
1971 5.7 5.1 7.4 6.1<br />
1972 5.7 5.1 7.2 6.0<br />
1973 5.7 5.1 6.9 5.8<br />
1974 5.7 5.2 7.0 5.6<br />
1975 6.0 5.4 6.9 5.8<br />
1976 6.2 5.5 7.0 5.8<br />
1977 6.2 5.6 6.9 5.7<br />
1978 6.3 5.7 6.9 5.8<br />
1979 6.4 5.9 6.9 5.9<br />
1980 6.6 6.0 7.1 6.3<br />
1981 6.9 6.0 7.5 6.5<br />
1982 7.2 6.2 7.8 6.8<br />
1983 7.4 6.5 8.1 7.2<br />
1984 7.5 6.7 8.2 7.4<br />
1985 7.6 6.9 8.1 7.6<br />
1986 7.6 7.0 8.0 7.7<br />
1987 7.6 6.9 8.0 7.8<br />
1988 7.6 6.8 7.9 7.1<br />
1989 7.6 6.5 7.9 6.7<br />
1990 7.8 6.5 8.0 6.5<br />
1991 7.9 6.7 8.1 6.8<br />
1992 8.1 7.0 8.4 7.2<br />
1993 8.3 7.3 8.6 7.5<br />
1994 8.4 7.5 8.4 7.5<br />
1995 8.5 7.7 8.4 7.6<br />
1996 8.6 7.9 8.3 7.7<br />
1997 8.7 8.1 8.3 7.8<br />
1998 8.8 8.3 8.3 7.6<br />
Source:<br />
The Polk Company, Detroit, MI. FURTHER REPRODUCTION PROHIBITED.<br />
(Additional resources: www.polk.com)<br />
“Mean is the sum of the products of units multiplied by age, divided by the total units.<br />
“Median is a value in an ordered set of values below and above which there are an equal number of values.<br />
TRANSPOKTATION<strong>ENERGY</strong><strong>DATA</strong>BOOIC <strong>EDITION</strong>~O-<strong>20</strong>00<br />
I
I Using<br />
current registration data and a scrappage model by Greenspan and Cohen, [ 1996 paper:<br />
http://www.bog.frb.fed.us/pubs/feds/l996~199640~19964Opap.pd~, ORNL calculated new automobile<br />
scrappage rates. The expected median lifetime <strong>for</strong> a 1990 model year automobile is 14 years. These data are<br />
fitted model values which assume constant economic conditions.<br />
Table 6.9<br />
Automobile Scrappage and Survival Rates<br />
1970,198O and 1990 Model Years<br />
Vehicle 1970 model year 1980 model year 1990 model year<br />
age”<br />
(vears)<br />
Survival<br />
rate”<br />
Scrappage<br />
rateC<br />
Survival<br />
rateb<br />
Scrappage<br />
rateC<br />
Survival<br />
rateb<br />
Scrappage<br />
rateC<br />
4 98.5 3.5 100.0 2.8 100.0 1.8<br />
5 94.0 4.5 96.4 3.7 99.9 2.4<br />
6 88.7 5.6 92.0 4.6 96.8 3.1<br />
7 82.7 6.8 86.9 5.5 93.2 3.8<br />
8 76.1 7.9 81.2 6.5 89.0 4.5<br />
9 69.1 9.1 75.1 7.5 84.3 5.3<br />
10 62.0 10.4 68.6 8.6 79.1 6.1<br />
11 54.8 11.6 62.0 9.7 73.6 7.0<br />
12 47.7 12.9 55.3 10.8 67.8 7.8<br />
13 41.0 14.2 48.7 12.0 61.9 8.8<br />
14 34.6 15.5 42.3 13.1 55.9 9.7<br />
15 28.8 16.8 36.2 14.3 49.9 10.7<br />
16 23.6 18.2 30.6 15.5 44.0 11.7<br />
17 19.0 19.5 25.5 16.8 38.4 12.8<br />
18 15.0 <strong>20</strong>.9 <strong>20</strong>.9 18.0 33.1 13.9<br />
19 11.6 22.3 16.8 19.3 28.1 15.0<br />
<strong>20</strong> 8.9 23.7 13.4 <strong>20</strong>.6 23.6 16.1<br />
21 6.6 25.1 10.4 21.9 19.5 17.3<br />
22 4.9 26.6 8.0 23.3 15.9 18.4<br />
23 3.5 28.0 6.0 24.6 12.8 19.6<br />
24 2.5 29.4 4.5 26.0 10.1 <strong>20</strong>.9<br />
25 1.7 30.9 3.2 27.3 7.9 22.1<br />
26 1.2 32.3 2.3 28.7 6.1 23.3<br />
27 0.8 33.8 1.6 30.1 4.6 24.6<br />
2x 0.5 35.2 1.1 31.5 3.4 25.9<br />
29 0.3 36.7 0.7 32.9 2.5 27.2<br />
30 0.2 38.1 0.5 34.3 1.8 28.5<br />
Median<br />
lifetime<br />
11.3 years 12.2 years 14.0 years<br />
Source:<br />
Schmoyer, Richard L., unpublished study on scrappage rates, Oak Ridge National Laboratory, Oak Ridge,<br />
TN, <strong>20</strong>00.<br />
“It was assumed that scrappage <strong>for</strong> vehicles less than 4 years old is 0.<br />
“The percentage of 1970/80/90 model year automobiles which will be in use at the end of a given year.<br />
“The percentage of 1970/80/90 model year automobiles which will be retired from use within a given year.<br />
6-11<br />
<strong>TRANSPORTATION</strong> <strong>ENERGY</strong> <strong>DATA</strong> <strong>BOOK</strong>: <strong>EDITION</strong> <strong>20</strong>-<strong>20</strong>00 0
90<br />
80<br />
70<br />
60<br />
50<br />
40<br />
30<br />
<strong>20</strong><br />
10<br />
0<br />
Source: See Table 6.9.<br />
Model Year ‘70<br />
Figure 6.1. Automobile Survival Rates<br />
Model Year ‘80<br />
Age (Years)<br />
Model Year
I<br />
Using current registration data and a scrappage model by Greenspan and Cohen [ 1996 paper:<br />
http://www.bog.frb.fed.us/pubs/feds/l996/199640/199640pap.pdfl, ORNL calculated new light truck<br />
scrappage rates. The expected median lifetime <strong>for</strong> a 1990 model year light truclz is 15.2 years. These data<br />
areJitted model values which assume constant economic conditions.<br />
Table 6.10<br />
Scrappage and Survival Rates <strong>for</strong> Light Trucks<br />
Vehicle<br />
1970 model year<br />
19jO model year<br />
1990 model year<br />
age” Survival Scrappage Survival Scrappage Survival Scrappage<br />
Cvears) rateb rateC<br />
rate” rateC<br />
rateb ratcC<br />
4 99.8 1.6 99.2 1.9 99.6 1.8<br />
5 97.7 2.2 96.8 2.5 97.3 2.3<br />
G 95.1 2.7 93.8 3.1 94.5 2.9<br />
7 92.0 3.2 90.3 3.7 91.3 3.4<br />
8 88.5 3.8 86.4 4.4 87.6 4.0<br />
9 84.6 4.4 82.0 5.0 83.5 4.7<br />
10 80.4 5.0 77.4 5.7 79.1 5.3<br />
11 75.8 5.6 72.5 6.4 74.4 5.9<br />
12 71.1 6.3 67.3 7.1 69.5 6.6<br />
13 66.2 6.9 62.1 7.8 64.4 7.3<br />
14 61.1 7.6 56.8 8.5 59.3 8.0<br />
15 56.1 8.3 51.5 9.3 54.1 8.7<br />
16 51.0 9.0 46.3 10.0 49.0 9.4<br />
17 46.1 9.7 41.3 10.8 44.0 10.2<br />
18 41.3 10.4 36.5 11.6 39.2 10.9<br />
19 36.7 11.2 32.0 12.4 34.6 11.7<br />
<strong>20</strong> 32.3 11.9 27.8 13.2 30.3 12.5<br />
21 28.2 12.7 23.9 14.1 26.3 13.3<br />
22 24.4 13.5 <strong>20</strong>.3 14.9 22.6 14.1<br />
23 <strong>20</strong>.9 14.3 17.1 15.7 19.2 14.9<br />
24 17.7 15.1 14.3 16.6 16.2 15.7<br />
25 14.9 15.9 11.8 17.5 13.5 16.6<br />
26 12.4 16.8 9.6 18.3 11.1 17.4<br />
27 10.2 17.6 7.8 19.2 9.1 18.3<br />
28 8.3 18.5 6.2 <strong>20</strong>.1 7.4 19.2<br />
29 6.7 19.3 4.9 21.0 5.9 <strong>20</strong>.0<br />
30 5.4 <strong>20</strong>.2 3.8 21.9 4.7 <strong>20</strong>.9<br />
Median<br />
lifetime<br />
16.8 years 15.7 years 15.2 years<br />
Source:<br />
Schmoyer, Richard L., unpublished study on scrappage rates, Oak Ridge National Laboratory, Oak Ridge,<br />
TN, <strong>20</strong>00.<br />
“It was assumed that scrappage <strong>for</strong> vehicles less than 4 years old is 0.<br />
“The percentage of 1970/80/90 model year light trucks which will be in use at the end of a given year.<br />
“The percentage of 1970/80/90 model year light trucks which will be retired from use within a given year.<br />
6-13<br />
<strong>TRANSPORTATION</strong> <strong>ENERGY</strong> <strong>DATA</strong><strong>BOOK</strong>: <strong>EDITION</strong>~O-<strong>20</strong>00 0
100<br />
90<br />
80<br />
70<br />
60<br />
50<br />
40<br />
30<br />
<strong>20</strong><br />
10<br />
0<br />
Source: See Table 6.9.<br />
Model Year ‘70<br />
-,-~<br />
Figure 6.2. Light Truck Survival Rates<br />
Model Year ‘9<br />
I_“~---~““-__.--^--_l____l -~-.---11.~1_111._“. .“_ - ~__^---“.“.--_“._,,^,” ,..-.-- -_-~-,~,<br />
Model Year<br />
,-,x-- ,,,.,,, “..,_.1,“_<br />
.,,,- ^ _-., .,...,... ,,,.“.<br />
,?-A%--_-.-“-“-,- ^. II” ---11.-^--.~1--- .-~-I”I”~~““,.-..)^-~ .,-, ----x.._-<br />
I I I I I I<br />
5 15 <strong>20</strong><br />
Age (Years)<br />
25<br />
,-”<br />
.^<br />
30<br />
,,x.<br />
,-~<br />
..,.,<br />
..-
Source<br />
Chapter 7<br />
Light Vehicles and Characteristics<br />
Summary Statistics from Tables in this Chapter<br />
Table 7.1 Passenger cars, 1998<br />
Registrations (thousands)<br />
Vehicle miles (million miles)<br />
Fuel economy (miles per gallon)<br />
Table 7.2 Two-axle, four tire trucks, 1998<br />
Registrations (thousands)<br />
Vehicle miles (million miles)<br />
Fuel economy (miles per gallon)<br />
Table 7.5 Automobile sales, 1999 sales period<br />
Minicompact<br />
Subcompact<br />
Compact<br />
Midsize<br />
Large<br />
Two-seater<br />
Table 7.7 Light truck share of total light vehicle sales<br />
1976<br />
1999<br />
Table 7.6 Light truck sales, 1999 sales period<br />
Small pickup<br />
Large pickup<br />
Small van<br />
Large van<br />
Small utility<br />
Large utility<br />
Table 7.16 Corporate average fuel economy<br />
Automobile standard, MY 1999<br />
Automobile fuel economy, MY 1999<br />
Light truck standard, MY 1999<br />
Light truck fuel economy, MY 1999<br />
Table 7.21 Average fuel economy loss from 55 to 70 mph<br />
<strong>TRANSPORTATION</strong><strong>ENERGY</strong><strong>DATA</strong>BOOIC <strong>EDITION</strong>~O-<strong>20</strong>00<br />
131,839<br />
1,.545,830<br />
21.4<br />
71,818<br />
866,228<br />
17.1<br />
12,903<br />
1,622,483<br />
2,367,048<br />
3,359,492<br />
1,180,739<br />
103,248<br />
19.8%<br />
48.1%<br />
302,426<br />
2,830,271<br />
1,319,398<br />
416,813<br />
942,298<br />
2,190,549<br />
(mpg><br />
27.5<br />
28.3<br />
<strong>20</strong>.7<br />
<strong>20</strong>.7<br />
17.1%<br />
7-1
7-2<br />
I<br />
The Federal Highway Administration released revised historical data back to 1985 in their “Highway Statistics<br />
Summary to 1995” report. As a result, the data in this table have been revised. The data in this table from<br />
19&Lon DO NOT include minivans, pickups, or sport utility vehicles.<br />
Year<br />
Table 7.1<br />
Summary Statistics <strong>for</strong> Passenger Cars, 1970-98<br />
Registrations” Vehicle travel<br />
(thousands) (million miles)<br />
Fuel use<br />
(million gallons)<br />
Fuel economy”<br />
(miles per gallon)<br />
1970<br />
89,244<br />
916,700 67,8<strong>20</strong> 13.5<br />
1971<br />
92,718<br />
966,330 71,346 13.5<br />
1972<br />
97,082<br />
,021,365 75,937 13.5<br />
1973<br />
101,985<br />
,045,981 78,233 13.4<br />
1974<br />
104,856<br />
,007,25 1 74,229 13.6<br />
1975<br />
106,706<br />
,033,950 74,140 13.9<br />
1976<br />
110,189<br />
,078,215 78,297 13.8<br />
1977<br />
112,288<br />
,109,243 79,060 14.0<br />
1978<br />
116,573<br />
,146,508 80,652 14.2<br />
1979<br />
118,429<br />
,113,640 76,588 14.5<br />
1980<br />
121,601<br />
,111,596 69,98 1 15.9<br />
1981 123,098<br />
1,133,332<br />
69,112 16.4<br />
1982<br />
123,702<br />
1,161,713<br />
69,116 16.8<br />
1983<br />
126,444<br />
1,195,054<br />
70,322 17.0<br />
1984<br />
128,158<br />
1,227,043<br />
70,663 17.4<br />
1985”<br />
127,885<br />
1,246,798<br />
71,518 17.4<br />
1986<br />
130,004<br />
1,270,167<br />
73,174 17.4<br />
1987<br />
131,482<br />
1,315,982<br />
73,308 18.0<br />
1988<br />
133,836<br />
1,370,271<br />
73,345 18.7<br />
1989 134,559<br />
1,401,221<br />
73,913 19.0<br />
1990 133,700<br />
1,408,266<br />
69,568 <strong>20</strong>.2<br />
1991 128,300<br />
1,358,185<br />
64,3 18 21.1<br />
1992 126,581<br />
,371,569 65,436<br />
21.0<br />
1993 127,327<br />
,374,709 67,047<br />
<strong>20</strong>.5<br />
1994 127,883<br />
,406,089 67,874<br />
<strong>20</strong>.7<br />
1995 128,387<br />
,438,294 68,072<br />
21.1<br />
1996 129,728<br />
,469,854 69,22 1<br />
21.2<br />
1997 129,749<br />
,502,556 69,892<br />
21.5<br />
1998 131,839 1,545,830 72,<strong>20</strong>9 21.4<br />
Average annual percentage change<br />
1970-98 1.4% 1.9% 0.2% 1.7%<br />
1988-98<br />
Source:<br />
-0.2% 1.2% -0.2% 1.4%<br />
U.S. Department of Transportation, Federal Highway Administration, Highway Statistics 1998, Washington,<br />
DC, 1999, Table VM-1, p. V-74, and annual.<br />
(Additional resources: www.fhwa.dot.gov)<br />
a This number differs from R.L. Polk’s estimates of “number of automobiles in use.” See Table 6.3.<br />
’ Fuel economy <strong>for</strong> automobile population.<br />
c Beginning in this year the data were revised to exclude minivans, pickups and sport utility vehicles which<br />
may have been previously included.<br />
<strong>TRANSPORTATION</strong> <strong>ENERGY</strong> <strong>DATA</strong> <strong>BOOK</strong>: <strong>EDITION</strong> <strong>20</strong>-<strong>20</strong>00
The Federal Highway Administration releasedrevised historical data back to I985 which better reflected two-axle,<br />
four-tire trucks. The definition of this category includes vans, pickup trucks, and sport utility vehicles.<br />
/<br />
Year<br />
Table 7.2<br />
Summary Statistics <strong>for</strong> Two-Axle, Four-Tire Trucks, 1970-98<br />
Registrations Vehicle travel Fuel use Fuel economy<br />
(thousands) (million miles) (million gallons) (miles per gallon)<br />
1970<br />
14,211 123,286 12,313 10.0<br />
1971<br />
15,181 137,870 13,484 10.2<br />
1972<br />
16,428 156,622 15,150 10.3<br />
1973 18,083 176,833 16,828<br />
0.5<br />
1974 19,335 182,757 16,657<br />
1.0<br />
1975 <strong>20</strong>,418 <strong>20</strong>0,700 19,081<br />
0.5<br />
1976 22,301 225,834 <strong>20</strong>,828<br />
0.8<br />
1977 23,624 250,591 22,383<br />
1.2<br />
1978 25,476 279,4 14 24,162 11.6<br />
1979 27,022 291,905 24,445 11.9<br />
1980 27,876 290,935 23,796 12.2<br />
1981 28,928 296,343 23,697 12.5<br />
1982 29,792 306,141 22,702 13.5<br />
1983 31,214 327,643 23,945 13.7<br />
1984 32,106 358,006 25,604 14.0<br />
1985” 37,214 390,96 1 27,363 14.3<br />
1986 39,382 423,915 29,074 14.6<br />
1987 41,107 456,870 30,598 14.9<br />
1988 43,805 502,<strong>20</strong>7 32,653 15.4<br />
1989 45,945 536,475 33,271<br />
6.1<br />
1990 48,275 574,571 35,611<br />
6.1<br />
1991 53,033 649,394 38,217<br />
7.0<br />
1992 57,09 1 706,863 40,929<br />
7.3<br />
1993 59,994 745,750 42,85 1<br />
7.4<br />
1994 62,904<br />
764,634 44,112<br />
17.3<br />
1995 65,738<br />
790,029 45,605<br />
17.3<br />
1996 69,134<br />
8 16,540 47,354<br />
17.2<br />
1997 70,224<br />
850,739 49,389<br />
17.2<br />
1998 71,818<br />
866,228 50,579<br />
17.1<br />
Average annualpercentage change<br />
1970-98 6.0%<br />
7.2% 5.2%<br />
1.9%<br />
1988-98 5.1%<br />
5.6% 4.5%<br />
1.1%<br />
Source:<br />
U.S. Department of Transportation, Federal Highway Administration, Highway Statistics 1998, Washington,<br />
DC, 1999, Table VM-1, p. V-74, and annual.<br />
(Additional resources: www.fhwa.dot.gov)<br />
n Beginning in this year the data were revised to include all vans (including mini-vans), pickups and sport<br />
utility vehicles.<br />
<strong>TRANSPORTATION</strong><strong>ENERGY</strong><strong>DATA</strong>BOOIC <strong>EDITION</strong>~O-<strong>20</strong>00<br />
7-3
7-4<br />
Calendar<br />
year<br />
em<br />
Table 7.3<br />
New Retail Automobile Sales in the United States, 1970-98<br />
Domestic” Impor@<br />
(thousands)<br />
Total<br />
1970 7,119 1,285 8,404 15.3%<br />
1971 8,681 1,568 10,249 15.3%<br />
1972 9,327 1,623 10,950 14.8%<br />
1973 9,676 1,763 11,439 15.4%<br />
1974 7,454 1,399 8,853 15.8%<br />
1975 7,053 1,571 8,624 18.2%<br />
1976 8,611 1,499 10,110 14.8%<br />
1977 9,109 2,074 11,183 18.5%<br />
1978 9,312 2,002 11,314 17.7%<br />
1979 8,341 2,332 10,673 21.8%<br />
1980 6,581 2,398 8,979 26.7%<br />
1981 6,<strong>20</strong>9 2,327 8,536 27.3%<br />
1982 5,759 2,223 7,982 27.9%<br />
1983 6,795 2,387 9,182 26.0%<br />
1984 7,952 2,439 10,391 23.5%<br />
1985 8,<strong>20</strong>5 2,838 11,043 25.7%<br />
1986 8,215 3,238 11,453 28.3%<br />
1987 7,081 3,197 10,278 31.1%<br />
1988 ’ 7,526 3,099 10,626 29.2%<br />
1989 7,073 2,825 9,898 28.5%<br />
1990 6,897 2,404 9,301 25.8%<br />
1991 6,137 2,038 8,175 24.9%<br />
1992 6,277 1,937 8,213 23.6%<br />
1993 6,742 1,776 8,518 <strong>20</strong>.9%<br />
1994 7,255 1,735 8,990 19.3%<br />
1995 7,129 1,506 8,635 17.4%<br />
1996 7,254 1,273 8,527 14.9%<br />
1997 6,917 1,355 8,272 164%<br />
1998 6,761 1,378 8,139 16.9%<br />
Percentage<br />
transplantsc Percentage<br />
Percentage on model imports and Percentage<br />
imports year basis transplants diesel<br />
0.0%<br />
0.0%<br />
0.0%<br />
1.3%<br />
2.1%<br />
1.8%<br />
1.4%<br />
1.3%<br />
2.0%<br />
2.2%<br />
2.8%<br />
5.2%<br />
5.8%<br />
7.3%<br />
11.2%<br />
13.7%<br />
14.1%<br />
14.9%<br />
16.5%<br />
18.9%<br />
d<br />
d<br />
d<br />
14.8%<br />
18.5%<br />
17.7%<br />
23.1%<br />
28.8%<br />
29.1%<br />
29.3%<br />
27.3%<br />
25.5%<br />
27.9%<br />
31.1%<br />
36.3%<br />
35.0%<br />
35.8%<br />
37.0%<br />
38.6%<br />
37.7%<br />
35.8%<br />
35.8%<br />
36.3%<br />
d<br />
d<br />
d<br />
d<br />
0.06%<br />
0.05%<br />
0.06%<br />
0.<strong>20</strong>%<br />
0.31%<br />
0.22%<br />
0.34%<br />
1.02%<br />
2.54%<br />
4.31%<br />
6.10%<br />
4.44%<br />
2.09%<br />
1.45%<br />
0.82%<br />
0.37%<br />
0.16%<br />
0.02%<br />
0.13%<br />
0.08%<br />
0.10%<br />
0.06%<br />
0.03%<br />
0.04%<br />
0.04%<br />
0.10%<br />
0.09%<br />
0.13%<br />
1970-98 -0.2% 0.2%<br />
Average annual percentage change<br />
-0.1%<br />
1988-98<br />
Source:<br />
-1.1% -7.8% -2.6%<br />
Domestic and import data - 1970-97: American Automobile Manufacturers Association, Motor Vehicle Facts and<br />
Figures 1998, Detroit, MI, 1998, p. 15, and annual. 1997 data from Economic Indicators, 4th Quarter 1997.<br />
1998: Ward’s Communication, Ward’s Automotive Yearbook, Detroit, MI, 1999, p. 243.<br />
Diesel data - Ward’s Communications, Ward’s Automotive Yearbook, Detroit, MI, 1999, p. 64, and annual.<br />
Transplant data - Oak Ridge National Laboratory, Light Vehicle MPG and Market Shares Data System, Oak Ridge,<br />
TN, 1996. (Additional resources: www.aama.com, www.wardsauto.com)<br />
a North American built.<br />
’ Does not include import tourist deliveries.<br />
’ A transplant is an automobile which was built in the U.S. by a <strong>for</strong>eign firm. Also included are joint ventures<br />
which are built in the U.S.<br />
d Data are not available.<br />
<strong>TRANSPORTATION</strong> <strong>ENERGY</strong> <strong>DATA</strong> <strong>BOOK</strong>: <strong>EDITION</strong> <strong>20</strong>-<strong>20</strong>00
Table 7.4<br />
New Retail Sales of Trucks 10,000 Pounds GVW and Less in the United States, 1970-98<br />
Percentages<br />
Light truck Four-wheel drive Light trucks of Light trucks<br />
Calendar sales” of domestic light-duty of total<br />
year (thousands) ImporP Transplants” Dieseld light trucksd vehicle Sal& truck sales<br />
1970<br />
1971<br />
1972<br />
1973<br />
1974<br />
1975<br />
1976<br />
1977<br />
1978<br />
1979<br />
1980<br />
1981<br />
1982<br />
1983<br />
1984<br />
1985<br />
1986<br />
1987<br />
1988<br />
1989<br />
1990<br />
1991<br />
1992<br />
1993<br />
1994<br />
1995<br />
1996<br />
1997<br />
1998<br />
1970-9s<br />
1988-98<br />
1,463<br />
1,757<br />
2,239<br />
2,745<br />
2,338<br />
2,281<br />
2,956<br />
3,430<br />
3,808<br />
3,311<br />
2,440<br />
2,189<br />
2,470<br />
2,984<br />
3,863<br />
4,458<br />
4,594<br />
4,610<br />
4,800<br />
4,610<br />
4,548<br />
4,123<br />
4,629<br />
5,351<br />
6,033<br />
6,053<br />
6,519<br />
6,797<br />
7,299<br />
5.9%<br />
4.3%<br />
4.5%<br />
4.8%<br />
6.4%<br />
8.5%<br />
7.5%<br />
10.0%<br />
8.0%<br />
9.4%<br />
8.8%<br />
14.1%<br />
19.7%<br />
<strong>20</strong>.3%<br />
16.5%<br />
15.6%<br />
15.7%<br />
17.2%<br />
<strong>20</strong>.1%<br />
17.9%<br />
12.6%<br />
10.9%<br />
13.2%<br />
12.8%<br />
8.6%<br />
6.8%<br />
6.5%<br />
6.5%<br />
6.6%<br />
8.4%<br />
8.9%<br />
f<br />
0.0%<br />
0.0%<br />
0.0%<br />
0.0%<br />
0.9%<br />
0.0%<br />
0.0%<br />
0.0%<br />
2.0%<br />
2.6%<br />
2.3%<br />
1.7%<br />
2.4%<br />
2.6%<br />
3.4%<br />
4.5%<br />
5.5%<br />
7.1%<br />
8.1%<br />
7.5f%<br />
f<br />
f<br />
1.0%<br />
1.2%<br />
3.6%<br />
3.1%<br />
8.5%<br />
6.7%<br />
4.8%<br />
3.8%<br />
3.7%<br />
2.3%<br />
2.3%<br />
2.9%<br />
3.1%<br />
3.2%<br />
3.3%<br />
3.7%<br />
3.9%<br />
4.1%<br />
3.7%<br />
4.8%<br />
1.7%<br />
18.0%<br />
23.4%<br />
23.8%<br />
24.6%<br />
28.5%<br />
29.4%<br />
<strong>20</strong>.7%<br />
18.6%<br />
16.8%<br />
28.5%<br />
27.0%<br />
29.1%<br />
27.0%<br />
32.0%<br />
32.1%<br />
3 1.4%<br />
31.6%<br />
34.4%<br />
31.6%<br />
32.6%<br />
34.4%<br />
39.1%<br />
35.7%<br />
39.6%<br />
43.8%<br />
Average annual percentage change<br />
14.8%<br />
14.6%<br />
17.0%<br />
19.4%<br />
<strong>20</strong>.9%<br />
<strong>20</strong>.9%<br />
22.6%<br />
23.5%<br />
25.2%<br />
23.7%<br />
21.4%<br />
<strong>20</strong>.4%<br />
23.6%<br />
24.5%<br />
27.1%<br />
28.8%<br />
28.6%<br />
31.0%<br />
31.1%<br />
31.8%<br />
32.8%<br />
33.5%<br />
36.0%<br />
38.6%<br />
40.2%<br />
41.2%<br />
43.3%<br />
466%<br />
47.3%<br />
80.4%<br />
83.4%<br />
83.3%<br />
84.2%<br />
84.2%<br />
87.9%<br />
89.8%<br />
89.7%<br />
89.2%<br />
88.7%<br />
88.9%<br />
89.8%<br />
92.8%<br />
93.6%<br />
93.0%<br />
93.6%<br />
94.3%<br />
93.9%<br />
93.2%<br />
93.3%<br />
93.9%<br />
94.5%<br />
94.4%<br />
94.2%<br />
94.0%<br />
93.4%<br />
94.1%<br />
94.1%<br />
93.3%<br />
Source:<br />
Four-wheel drive - 1970-88: Ward’s Communications, Ward’s Automotive Yearbook, Detroit, MI, 1989, p. 168, and annual.<br />
1989-97: Ward’s Communications, Ward’s Automotive Yearbook, Factory Installation Reports, Detroit, MI, 1998, p. 300,<br />
and annual.<br />
Transplants - Oak Ridge National Laboratory, Light-Duty Vehicle MPG and Market Shares System, Oak Ridge, TN, 1996.<br />
All other - 1970-97: American Automobile Manufacturers Association, Motor Vehicle Facts and Figures 1998, Detroit, MI;<br />
1998, pp. 8, 15,24, and annual. 1998: Ward’s Communications, Ward’s Automotive Yearbook, Detroit, Ml<br />
(Additional resources: www.aama.com, www.wardsauto.com)<br />
” Includes all trucks of 10,000 pounds gross vehicle weight and less sold in the U.S.<br />
b Excluding transplants.<br />
’ Based on mode1 year data. A transplant is a light truck which was built in the U.S. by a <strong>for</strong>eign firm. Also included<br />
are joint ventures built in the U.S.<br />
dBased on mode1 year factory installations. Column was revised.<br />
e Light-duty vehicles include automobiles and light trucks.<br />
f Data are not available.<br />
g Indicates less than 1 percent.<br />
<strong>TRANSPORTATION</strong><strong>ENERGY</strong><strong>DATA</strong> <strong>BOOK</strong>: <strong>EDITION</strong>~O-<strong>20</strong>00<br />
7-5
Table 7.5<br />
Period Sales, Market Shares, and Sales-Weighted Fuel Economies<br />
of New Domestic and Import Automobiles, Selected Sales Periods” 1976-99<br />
Sales Period 1976 1980 1984 1988 1990 1993 1994 1995 1996 1997 1998 1999<br />
MINICOMPACT<br />
Total sales, units<br />
Market share, %<br />
Fuel economy, mpg<br />
SUBCOMPACT<br />
Total sales, units<br />
Market share, %<br />
Fuel economy, mpg<br />
COMPACT<br />
Total sales, units<br />
Market share, %<br />
Fuel economy, mpg<br />
MIDSIZE<br />
Total sales, units<br />
Market share, %<br />
Fuel economy, mpg<br />
LARGE<br />
Total sales, units<br />
Market share, %<br />
Fuel economy, mpg<br />
TWO SEATER<br />
Total sales, units<br />
Market share, %<br />
Fuel economy, mpg<br />
TOTAL<br />
Total sales, units<br />
Market share, %<br />
428,346 41,368 84,186 76,698 84,345 57,198 44,752 34,234 39,519 12,159 12,903<br />
4.7 0.4 0.8 0.8 1.0 0.6 0.5 0.4 0.5 0.2 0.1<br />
29.4 29.0 37.8 26.4 29.9 27.8 27.0 27.2 26.3 23.9 24.8<br />
2,625,929 3,441,480 2,5 10,929 1,983,353 2,030,226 1,944,892 2,015,280 1,518,<strong>20</strong>9 1,315,281 1,510,050 1,491,233 1,622,483<br />
27.1 37.8 24.6 19.1 22.0 23.2 22.6 17.4 15.2 18.3 18.5 18.8<br />
23.5 27.3 30.5 31.7 31.3 31.9 31.3 31.7 32.1 32.6 31.3 31.0<br />
2,839,603 599,423 2,768,056 4,199,638 3,156,481 2,655,378 3,077,<strong>20</strong>3 3,289,735 3,492,957 2,937,064 2,309,330 2,367,048<br />
29.3 6.6 27.1 40.5 34.2 31.7 34.5 37.7 40.4 35.6 28.6 27.4<br />
17.1 22.3 30.6 29.8 28.9 29.3 29.8 30.2 30.4 30.0 30.8 30.2<br />
l,Sl-5,505 3,073,103 3,059,647 2,550,964 2,511,503 2,445,842 2,359,898 2,498,521 2,487,880 2,531,196 3,106,787 3,359,492<br />
18.7 33.8 30.0 24.6 27.2 29.2 26.5 28.6 28.8 30.6 38.5 38.9<br />
15.3 21.3 24.1 26.9 25.9 25.7 25.6 25.9 26.4 26.3 26.9 26.9<br />
2,<strong>20</strong>6,102 1,336,190 1,502,097 1,368,717 1,279,092 1,186,991 1,339,863 1,3<strong>20</strong>,608 1,259,266 1,162,290 1,050,405 1,180,739<br />
22.8 14.7 14.7 13.2 13.9 14.2 15.0 15.1 14.6 14.1 13.0 13.7<br />
13.9 19.3 <strong>20</strong>.2 24.2 23.5 24.0 24.2 24.1 24.2 24.5 24.6 24.4<br />
199,716 215,964 328,968 186,127 170,465 70,480 67,0<strong>20</strong> 53,045 62,23 1 80,921 101,023 103,248<br />
2.1 2.4 3.2 1.8 1.8 0.8 0.8 0.6 0.7 1.0 1.3 1.2<br />
<strong>20</strong>.1 21.0 26.5 27.3 28.0 24.8 23.9 24.7 25.4 26.3 25.4 25.3<br />
9,686,855 9,094,506 lo,21 1,06 10,372,98 9,224,465 8,387,928 8,9 16,462 8,724,870 8,65 1,849 8,261,040 8,070,937 8,645,913<br />
100 100 100 100 100 100 100 100 100 100 100 100<br />
Fuel economy, mpg 17.2 23.2 26.3 28.5 27.6 27.8 27.8 28.0 28.3 28.3 28.3 28.0<br />
Source:<br />
Oak Ridge National Laboratoiy, Light Vehicle MPG and Market Shares System, Oak Ridge, TN, <strong>20</strong>00. (Additional resources: www-cta.ornl.gov)<br />
a “Sales period” is October 1 of the current year through September 30 of the next year. These figures represent only those sales that could be matched<br />
to corresponding EPA fuel economy values.
Table 7.6<br />
Period Sales, Market Shares, and Sales-Weighted Fuel Economies<br />
of New Domestic and Import Light Trucks, Selected Sales Periods” 1976-99<br />
Sales Period 1976 1980 1984 1988 1990 1993 1994 1995 1996 1997 1998 1999<br />
SMALL PICKUP<br />
Total sales, units<br />
Market share, %<br />
Fuel economy, mpg<br />
LARGE PICKUP<br />
Total sales, units<br />
Market share, %<br />
Fuel economy, mpg<br />
SMALL VAN<br />
Total sales, units<br />
Market share, %<br />
Fuel economy, mpg<br />
LARGE VAN<br />
Total sales, units<br />
Market share, %<br />
Fuel economy, mpg<br />
SMALL SUV<br />
Total sales, units<br />
Market share, %<br />
Fuel economy, mpg<br />
LARGE SUV<br />
Total sales, units<br />
Market share, %<br />
Fuel economy, mpg<br />
170,351 516,412 1,012,298 1,026,551 678,488 332,470 365,322 356,856 574,930t 5<strong>20</strong>,834 460,097 302,426<br />
7.1 23.3 28.0 21.6 15.0 6.6 6.4 6.0 9.2 8.0 6.4 3.8<br />
23.9 25.5 27.2 26.1 25.2 24.9 25.3 25.6 25.6 24.6 24.5 24.8<br />
1,586,0<strong>20</strong> 1,115,248 1,218,972 1,453,255 1,573,729 1,877,806 2,199,224 2,183,793 2,042,179 2,051,144 2,377,916 2,830,271<br />
66.4 50.3 33.7 30.6 34.9 37.1 38.4 36.8 32.7 31.4 33.3 35.4<br />
15.1 17 17.5 18.5 18.9 19.6 <strong>20</strong>.1 19.4 18.9 19.4 19.1 19.3<br />
18,651 13,649 222,798 851,384 932,693 1,129,459 1,263,933 1,257,116 1,229,650 1,215,776 1,223,670 1,319,398<br />
0.8 0.6 6.2 18.0 <strong>20</strong>.7 22.3 22.1 21.2 19.7 18.6 17.1 16.5<br />
19.5 19.6 25.0 22.9 23.1 22.9 22.1 22.8 22.8 22.9 23.3 23.0<br />
574,745 328,065 545,595 486,981 398,877 388,435 407,737 401,056 370,126 386,563 380,829 416,813<br />
24.1 14.8 15.1 10.3 8.8 7.7 7.1 6.8 5.9 5.9 5.3 5.2<br />
15.4 16.3 16.3 17.0 16.9 17.3 17.4 17.1 17.2 17.8 18.2 17.8<br />
16,632 85,286 442,062 67 1,497 553,286 733,253 816,409 902,92 1 637,287 782,104 762,490 942,298<br />
0.7 3.8 12.2 14.2 12.3 14.5 14.3 15.2 10.2 12.0 10.7 11.8<br />
15.5 16.6 21.7 22.3 21.5 21.0 <strong>20</strong>.4 <strong>20</strong>.4 21.7 21.5 22.9 23.0<br />
<strong>20</strong>,511 157,877 168,727 253,332 377,552 594,254 671,776 832,124 1,382,689 1,570,295 1,932,648 2,190,549<br />
0.9 7.1 4.7 5.3 8.4 11.8 11.7 14.0 22.2 24.1 27.1 27.4<br />
14.3 14.6 16.0 16.8 18.9 18.9 19.0 18.8 19.5 18.3 18.9 18.8<br />
TOTAL<br />
Total sales, units 2,386,910 2,216,537 3,612,934 4,743,ooo 4,514,625 5,055,677 5,724,401 5,933,866 6,236,861 6,526,716 7,137,650 8,001,755<br />
Market share, % 100.0 100.0 100.0 100.0 100.0 100.0 100.0 100.0 100.0 100.0 100.0 100.0<br />
Fuel economy, mpg 15.6 18.1 <strong>20</strong>.0 <strong>20</strong>.7 <strong>20</strong>.5 <strong>20</strong>.5 <strong>20</strong>.4 <strong>20</strong>.2 <strong>20</strong>.4 <strong>20</strong>.1 <strong>20</strong>.3 <strong>20</strong>.1<br />
Source:<br />
Oak Ridge National Laboratory, Light Vehicle MPG and Market Shares System, Oak Ridge, TN, <strong>20</strong>00. (Additional resources: www-cta.ornl.gov)<br />
a “Sales period” is October 1 of the current year through September 30 of the next year These figures represent only those sales that could be matched to<br />
corresponding EPA fuel economy values.<br />
b Some four-wheel drive pickups previously classified as large pickups were correctly reclassified as small pickups.
Table 7.7<br />
Light Vehicle Market Shares by Size Class, Sales Periods” 1976-99<br />
Sales perioda 1976 1977 1978 1979 1980 1981 1982 1983 1984 1985 1986 1987<br />
Minicomnact 0.0% 6.5% 6.7% 4.3% 3.8% 3.9% 2.7% 2.1% 0.3% 0.3% 1.2% 1 .O%<br />
Subcompact<br />
21.7% 15.5% 15.0% 24.4% 30.4% 31.2% 26.6% 23.2% 18.2% 15.7% 15.9% 13.6%<br />
Compact<br />
23.5% 21.8% 12.0% 6.7% 5.3% 5.4% 10.8% 12.6% <strong>20</strong>.0% 23.2% 23.6% 27.1%<br />
Midsize<br />
15.0% 15.6% 26.1% 26.9% 27.2% 27.9% 28.3% 24.5% 22.1% <strong>20</strong>.5% 19.1% 16.9%<br />
Large<br />
18.3% <strong>20</strong>.0% 17.6% 15.4% 11.8% 12.1% 10.1% 9.6% 10.9% 10.0% 9.4% 9.3%<br />
Two seater<br />
1.7% 1.7% 1.5% 1.7% 1.9% 2.0% 2.2% 2.0% 2.4% 2.5% 1.8% 1.6%<br />
Small pickup<br />
1.4% 2.1% 2.2% 3.3% 4.6% 4.3% 5.3% 8.6% 7.3% 7.5% 7.8% 7.7%<br />
Large pickup<br />
13.1% 13.2% 13.4% 12.0% 9.9% 8.8% 9.1% 9.3% 8.8% 9.3% 8.5% 8.8%<br />
Small van<br />
0.2% 0.2% 0.2% 0.1% 0.1% 0.1% 0.1% 0.1% 1.6% 2.9% 4.1% 4.9%<br />
Large van<br />
4.8% 3.2% 4.8% 4.3% 2.9% 3.0% 3.4% 4.7% 3.9% 3.5% 3.3% 3.2%<br />
Small utility<br />
0.1% 0.1% 0.1% 0.0% 0.8% 0.4% 0.3% 1.6% 3.2% 2.9% 3.8% 4.6%<br />
Large utility 0.2% 0.2% 0.3% 0.8% 1.4% 1.1% 1.2% 1.6% 1.2% 1.8% 1.5% 1.4%<br />
Total light vehicles sold 12,073,765 13,045,310 14,037,378 13,589,4<strong>20</strong> 11,311,043 11,029,922 11.012,704 10,345,470 13,823,999 15,<strong>20</strong>3,880 15.633,934 15,014,173<br />
Cars 80.2% 81.0% 79.0% 79.4% 80.4% 82.5% 80.6% 74.0% 73.9% 72.1% 71.0% 69.5%<br />
Light trucks 19.8% 19.0% 21.0% <strong>20</strong>.6% 19.6% 17.5% 19.4% 26.0% 26.1% 27.9% 29.0% 30.5%<br />
Sales period 1988 1989 1990 1991 1992 1993 1994 1995 1996 1997 1998 1999<br />
Minicompact 0.6% 0.1% 0.6% 0.6% 0.9% 0.6% 0.4% 0.3% 0.2% 0.3% 0.1% 0.1%<br />
Subcompact 13.1% 13.1% 14.8% 17.5% 16.6% 14.5% 13.8% 10.4% 8.8% 10.2% 9.8% 9.7%<br />
Compact 27.8% 24.7% 23.0% 19.8% 19.6% 19.8% 21.0% 22.4% 23.5% 19.9% 15.2% 14.2%<br />
Midsize 16.9% 19.7% 18.3% 18.8% 18.0% 18.2% 16.1% 17.0% 16.7% 17.1% <strong>20</strong>.4% <strong>20</strong>.2%<br />
Large 9.1% 9.4% 9.3% 9.4% 9.1% 8.8% 9.2% 9.0% 8.5% 7.9% 6.9% 7.1%<br />
Two seater 1.2% 1.1% 1.2% 1.1% 0.7% 0.5% 0.5% 0.4% 0.4% 0.5% 0.7% 0.6%<br />
Small pickup 6.8% 5.9% 4.9% 4.9% 4.7% 2.5% 2.5% 2.4% 3.9% 3.5% 3.0% 1.8%<br />
Large pickup 9.6% 10.6% 11.5% 11.0% 11.6% 14.0% 15.0% 14.9% 13.7% 13.9% 15.6% 17.0%<br />
Small van 5.6% 5.8% 6.8% 7.1% 7.7% 8.4% 8.6% 8.6% 8.3% 8.2% 8.0% 7.9%<br />
Large van 3.2% 3.2% 2.9% 2.5% 2.8% 2.9% 2.8% 2.7% 2.5% 2.6% 2.5% 2.5%<br />
Small utility 4.4% 3.5% 4.0% 5.1% 5.5% 5.5% 5.6% 6.2% 4.3% 5.3% 5.0% 5.7%<br />
Large utility 1.7% 3.1% 2.7% 2.2% 2.8% 4.4% 4.6% 5.7% 9.3% 10.6% 12.7% 13.2%<br />
Total light vehicles sold 15,115,985 14,939,837 13,739,090 12,422,881 12,499,454 13,443.605 14,640,863 14,658,736 14,888,710 14,787,756 15,<strong>20</strong>8,587 16,647,668<br />
cars 68.6% 68.1% 67.1% 67.1% 64.9% 62.4% 60.9% 59.5% 58.1% 55.9% 53.1% 51.9%<br />
Light trucks 31.4% 31.9% 32.9% 32.9% 35.1% 37.6% 39.1% 40.5% 41.9% 44.1% 46.9% 48.1%<br />
Source:<br />
Oak Ridge National Laboratory, Light Vehicle MPG and Market Shares System, Oak Ridge, TN, <strong>20</strong>00. (Additional resources: m-cta.oml.gov)<br />
a “Sales period” is October 1 of the current year through September 30 of the next year.
Table 7.8<br />
Sales-Weighted Engine Size of New Domestic and Import Automobiles by Size Class,<br />
Sales Periods” 1976-99<br />
( liters”)<br />
Sales period” Minicompact Subcompact Compact Midsize Large Two seater Fleet<br />
1976<br />
c<br />
2.67 5.00 5.85 6.79 2.89 4.89<br />
1977<br />
1978<br />
1979<br />
1980<br />
1981<br />
1982<br />
1983<br />
1984<br />
1985<br />
1986<br />
1987<br />
1988<br />
1989<br />
1990<br />
1991<br />
1992<br />
1993<br />
1994<br />
1995<br />
1996<br />
1997<br />
1998<br />
1999<br />
1.98<br />
2.06<br />
1.86<br />
1.90<br />
1.57<br />
1.53<br />
1.60<br />
2.17<br />
1.95<br />
1.45<br />
1.48<br />
1.52<br />
2.54<br />
2.42<br />
2.17<br />
1.89<br />
1.96<br />
2.21<br />
2.42<br />
2.49<br />
2.62<br />
3.15<br />
2.86<br />
1976-99 1.7%d<br />
2.73 4.79 5.47 6.02<br />
2.67 3.95 4.89 6.17<br />
2.39 3.74 4.41 5.56<br />
2.10 3.03 3.90 5.12<br />
2.04 2.<strong>20</strong> 3.63 5.00<br />
2.08 2.12 3.47 4.73<br />
2.19 2.<strong>20</strong> 3.45 4.95<br />
2.22 2.21 3.40 4.87<br />
2.29 2.27 3.37 4.65<br />
2.19 2.21 3.19 4.38<br />
2.19 2.<strong>20</strong> 2.99 4.36<br />
2.05 2.21 3.00 4.32<br />
2.08 2.11 3.01 4.31<br />
1.96 2.25 3.13 4.33<br />
1.97 2.23 3.16 4.40<br />
2.01 2.33 3.16 4.34<br />
2.07 2.28 3.16 4.27<br />
2.27 2.23 3.15 4.17<br />
2.26 2.23 3.12 4.12<br />
2.23 2.19 2.98 4.09<br />
2.13 2.28 3.02 4.03<br />
2.29 2.17 2.94 3.98<br />
2.31 2.25 2.91 3.91<br />
Average annualpercentage change<br />
-0.6% -3.4% -3.0% -2.4%<br />
2.81 4.56<br />
3.01 4.33<br />
2.77 3.78<br />
2.79 3.22<br />
2.49 2.98<br />
2.41 2.89<br />
2.52 2.98<br />
2.50 2.97<br />
2.47 2.92<br />
2.83 2.76<br />
2.57 2.68<br />
2.75 2.66<br />
2.81 2.68<br />
2.57 2.72<br />
2.67 2.72<br />
3.01 2.76<br />
3.47 2.78<br />
3.82 2.79<br />
3.76 2.79<br />
3.67 2.71<br />
3.08 2.74<br />
3.51 2.75<br />
3.62 2.76<br />
1.0% -2.5%<br />
1989-99 1.2% 1.1% 0.6% -0.3% -1.0% 2.6% 0.3%<br />
Source:<br />
Oak Ridge National Laboratory, Light Vehicle MPG and Market Shares System, Oak Ridge, TN, <strong>20</strong>00.<br />
(Additional resources: www-cta.ornl.gov)<br />
’ “Sales period” is October 1 of the current year through September 30 of the next year.<br />
a 1 liter = 61.02. cubic inches.<br />
‘There were no minicompact automobiles sold in 1976.<br />
d Average annual percentage change begins with 1977.<br />
<strong>TRANSPORTATION</strong><strong>ENERGY</strong><strong>DATA</strong>BOOIC <strong>EDITION</strong>~O-<strong>20</strong>00<br />
7-9
7-10<br />
Table 7.9<br />
Sales-Weighted Engine Size of New Domestic and Import Light Trucks by Size Class<br />
Sales Periods” 1976-99<br />
(liters” )<br />
Sales Small Large Small Large Small Large<br />
period” pickup pickup van van utility utility<br />
1976 1.91 5.57 1.97 5.39 5.39 4.97<br />
1977 2.01<br />
1978 2.03<br />
1979 2.05<br />
1980 2.05<br />
1981 2.14<br />
1982 2.34<br />
1983 2.35<br />
1984 2.38<br />
1985 2.38<br />
1986 2.43<br />
1987 2.44<br />
1988 2.56<br />
1989 2.64<br />
1990 2.90<br />
1991 2.91<br />
1992 3.07<br />
1993 3.25<br />
1994 3.10<br />
1995 2.95<br />
1996 2.83<br />
1997 2.90<br />
1998 2.84<br />
1999 2.92<br />
1976-99 1.9%<br />
1989-99 1 .O%<br />
5.48 1.97 5.32 5.46<br />
5.45 1.97 5.29 5.09<br />
5.15 1.97 5.13 4.52<br />
5.05 1.97 5.03 4.29<br />
4.82 1.97 4.84 3.94<br />
4.99 1.79 4.92 3.88<br />
4.97 1.87 5.06 3.05<br />
4.95 2.23 5.06 2.81<br />
4.77 2.65 5.12 2.83<br />
4.68 2.78 5.13 2.78<br />
4.69 2.96 5.21 2.80<br />
4.68 3.15 5.21 3.14<br />
4.70 3.11 5.22 3.50<br />
4.49 3.29 5.21 3.38<br />
4.57 3.29 5.23 3.62<br />
4.57 3.32 5.28 3.69<br />
4.32 3.30 5.21 3.80<br />
4.45 3.48 5.31 3.77<br />
4.44 3.40 5.15 3.75<br />
4.72 3.41 5.21 3.68<br />
4.62 3.36 5.04 3.98<br />
4.64 3.37 5.02 2.83<br />
4.94 3.44 4.99 2.84<br />
Average annualpercentage change<br />
-0.5% 2.5% -0.3% -2.7%<br />
0.5% 1 .O% -0.4% -2.1%<br />
Fleet<br />
5.23<br />
4.95 5.03<br />
5.40 5.02<br />
5.30 4.62<br />
5.39 4.33<br />
5.15 4.15<br />
5.27 4.24<br />
5.34 4.00<br />
5.39 3.87<br />
5.37 3.77<br />
5.55 3.65<br />
5.42 3.65<br />
5.51 3.82<br />
5.45 3.93<br />
5.48 3.93<br />
5.40 3.94<br />
5.47 4.00<br />
5.58 4.02<br />
5.54 4.10<br />
5.49 4.06<br />
5.11 4.12<br />
4.97 4.14<br />
4.74 4.16<br />
4.73 4.15<br />
-0.2%<br />
-1.4%<br />
-1.0%<br />
0.5%<br />
Source:<br />
Oak Ridge National Laboratory, Light Vehicle MPG and Market Shares System, Oak Ridge, TN, <strong>20</strong>00.<br />
(Additional resources: www-cta.oml.gov)<br />
a “Sales period” is October 1 of the current year through September 30 of the next year.<br />
a 1 liter = 6 1.02 cubic inches.<br />
TRANSEORTATIONENERCY<strong>DATA</strong><strong>BOOK</strong>: <strong>EDITION</strong>~O-<strong>20</strong>00
Sales<br />
period”<br />
1976<br />
1977<br />
1978<br />
1979<br />
1980<br />
1981<br />
1982<br />
1983<br />
1984<br />
1985<br />
1986<br />
1987<br />
1988<br />
1989<br />
1990<br />
1991<br />
1992<br />
1993<br />
1994<br />
1995<br />
1996<br />
1997<br />
1998<br />
1999<br />
1976-99<br />
Table 7.10<br />
Sales-Weighted Curb Weight of New Domestic and Import Automobiles by Size Class,<br />
Sales Periods” 1976-99<br />
(pounds)<br />
Minicompact Subcompact Compact Midsize Large<br />
Two<br />
seater Fleet<br />
b<br />
2,577 3,609 4,046 4,562 2,624 3,608<br />
2,228<br />
2,<strong>20</strong>0<br />
2,1<strong>20</strong><br />
2,154<br />
1,9<strong>20</strong><br />
2,002<br />
2,072<br />
2,376<br />
2,211<br />
2,1<strong>20</strong><br />
1,960<br />
1,933<br />
2,576<br />
2,65 1<br />
2,584<br />
2,395<br />
2,449<br />
2,719<br />
2,83 1<br />
2,847<br />
2,997<br />
3,004<br />
2,835<br />
1.1%”<br />
2,586<br />
2,444<br />
2,367<br />
2,270<br />
2,370<br />
2,302<br />
2,334<br />
2,380<br />
2,392<br />
2,415<br />
2,423<br />
2,346<br />
2,357<br />
2,368<br />
2,406<br />
2,444<br />
2,478<br />
2,571<br />
2,552<br />
2,533<br />
2,489<br />
2,584<br />
2,626<br />
3,550<br />
3,138<br />
3,048<br />
2,813<br />
2,382<br />
2,422<br />
2,44 1<br />
2,454<br />
2,464<br />
2,432<br />
2,474<br />
2,558<br />
2,517<br />
2,637<br />
2,652<br />
2,674<br />
2,659<br />
2,639<br />
2,647<br />
2,667<br />
2,737<br />
2,703<br />
2,755<br />
3,900<br />
3,427<br />
3,287<br />
3,081<br />
2,996<br />
2,992<br />
3,027<br />
2,990<br />
2,954<br />
2,857<br />
2,857<br />
2,880<br />
2,985<br />
3,065<br />
3,085<br />
3,131<br />
3,142<br />
3,171<br />
3,179<br />
3,<strong>20</strong>3<br />
3,241<br />
3,198<br />
3,198<br />
Average annual percentage change<br />
4,026<br />
3,956<br />
3,763<br />
3,667<br />
3,672<br />
3,703<br />
3,779<br />
3,734<br />
3,575<br />
3,451<br />
3,483<br />
3,487<br />
3,496<br />
3,594<br />
3,650<br />
3,670<br />
3,615<br />
3,657<br />
3,648<br />
3,671<br />
3,653<br />
3,675<br />
3,689<br />
2,608<br />
2,763<br />
2,699<br />
2,790<br />
2,744<br />
2,525<br />
2,663<br />
2,559<br />
2,539<br />
2,575<br />
2,602<br />
2,693<br />
2,735<br />
2,656<br />
2,707<br />
2,770<br />
2,967<br />
3,035<br />
2,947<br />
2,985<br />
2,863<br />
2,956<br />
3,007<br />
3,424<br />
3,197<br />
3,000<br />
2,790<br />
2,744<br />
2,730<br />
2,788<br />
2,788<br />
2,743<br />
2,675<br />
2,689<br />
2,717<br />
2,760<br />
2,828<br />
2,848<br />
2,879<br />
2,894<br />
2,921<br />
2,937<br />
2,950<br />
2,977<br />
3,002<br />
3,034<br />
0.1% -1.2% -1.0% -0.9% 0.6% -0.8%<br />
1989-99 1.0% 1.1% 0.9% 0.7% 0.5% 1.0% 1.0%<br />
Source:<br />
Oak Ridge National Laboratory, Light Vehicle MPG and Market Shares System, Oak Ridge, TN, <strong>20</strong>00.<br />
(Additional resources: www-cta.ornl.gov)<br />
a “Sales period” is October 1 of the current year through September 30 of the next year.<br />
’ There were no minicompact automobiles sold in 1976.<br />
’ Average annual percentage change begins with 1977.<br />
<strong>TRANSPORTATION</strong><strong>ENERGY</strong><strong>DATA</strong>BOOIC <strong>EDITION</strong>~O-<strong>20</strong>00<br />
7-11
7-12<br />
matwe<br />
Table 7.11<br />
Sales-Weighted Interior Space of New Domestic and Import Automobiles by Size Cl;~ss,<br />
Sales Periods” 1976-99<br />
(cubic feet)<br />
Sales Minicompact Subcompact Compact Midsize Large<br />
period” ( < 85) (85-99) (100-109) (110-119) (> 1<strong>20</strong>) Fleet”<br />
1977 78.8 89.8 107.1<br />
1978 79.4 89.8 105.3<br />
1979 80.0 90.2 105.8<br />
1980 82.4 89.9 105.4<br />
1981 83.3 90.2 103.6<br />
1982 83.1 91.3 102.9<br />
1983 82.7 93.3 103.0<br />
1984 77.0 93.8 103.0<br />
1985 77.8 94.1 103.1<br />
1986 80.1 94.5 102.8<br />
1987 81.6 93.1 103.0<br />
1988 81.0 93.5 103.3<br />
1989 75.0 93.3 102.7<br />
1990 79.9 93.9 103.2<br />
1991 79.6 94.4 103.2<br />
1992 79.1 94.0 104.2<br />
1993 79.2 94.5 104.0<br />
1994 79.4 94.4 103.8<br />
1995 78.5 93.8 103.9<br />
1996 76.7 94.9 103.4<br />
1997 77.2 95.6 103.2<br />
1998 66.9 97.0 102.2<br />
1999 76.3 96.7 103.3<br />
1977-99 -0.1%<br />
113.0<br />
112.9<br />
113.4<br />
113.5<br />
113.7<br />
113.9<br />
113.1<br />
113.3<br />
113.5<br />
113.8<br />
113.9<br />
113.6<br />
113.8<br />
113.8<br />
113.8<br />
114.0<br />
114.0<br />
113.8<br />
114.3<br />
114.2<br />
114.6<br />
114.4<br />
114.1<br />
Average annualpel*centage change<br />
0.3% -0.2% 0.0%<br />
128.0<br />
128.5<br />
130.1<br />
130.8<br />
130.6<br />
130.4<br />
131.3<br />
130.4<br />
129.7<br />
127.6<br />
127.5<br />
127.2<br />
127.4<br />
127.8<br />
128.3<br />
129.2<br />
128.9<br />
128.8<br />
128.1<br />
128.0<br />
128.0<br />
127.7<br />
127.1<br />
0.0%<br />
107.9<br />
107.9<br />
106.9<br />
104.9<br />
105.5<br />
106.0<br />
107.3<br />
08.0<br />
07.9<br />
07.0<br />
06.9<br />
07.0<br />
107.5<br />
107.3<br />
107.1<br />
107.5<br />
108.0<br />
108.0<br />
108.7<br />
108.8<br />
108.7<br />
109.2<br />
109.5<br />
0.1%<br />
1989-99 0.2% 0.4% 0.1% 0.0% 0.0% 0.2%<br />
Source:<br />
Oak Ridge National Laboratory, Light Vehicle MPG and Market Shares System, Oak Ridge, TN, <strong>20</strong>00.<br />
(Additional resources: www-cta.ornl.gov)<br />
a “Sales period” is October 1 of the current year through September 30 of the next year,<br />
’ Interior volumes of two-seaters are not reported to EPA.<br />
<strong>TRANSPORTATION</strong><strong>ENERGY</strong><strong>DATA</strong>BOOIC <strong>EDITION</strong>~O-<strong>20</strong>00
0.8<br />
F 0 0.6<br />
u'<br />
2<br />
s<br />
= 0.4<br />
0.2<br />
Figure 7.1. Engine Size, Curb Weight, and Interior Space of New Domestic and Import Automobiles, 1976-99<br />
0.0<br />
I I I I I I I I I I I I I I I I I I I I I I<br />
1976 1978 1980 1982 1984 1986 1988 1990 1992 1994 1996 1998<br />
Source: See Tables 7.8, 7.10, and 7.11.<br />
Sales period
7-14<br />
e9awteF<br />
Table 7.12<br />
Sales-Weighted Wheelbase of New<br />
Automobiles and Light Trucks, Sales Periods” 1976-99<br />
(inches)<br />
Sales Light<br />
Automobiles and<br />
light trucks<br />
period” Automobiles trucks combined<br />
1976 110.78 118.87 112.03<br />
1977 109.75 117.79 111.05<br />
1978 107.67 116.23 108.65<br />
1979 105.77 116.27 107.93<br />
1980 103.61 114.54 105.76<br />
1981 102.97 114.86 105.10<br />
1982 103.01 114.87 105.60<br />
1983 103.76 113.73 106.10<br />
1984 103.50 113.87 106.21<br />
1985 102.96 113.98 106.02<br />
1986 102.27 113.40 105.48<br />
1987 102.11 113.27 105.52<br />
1988 102.21 111.79 105.21<br />
1989 102.66 112.23 105.71<br />
1990 103.13 111.41 105.85<br />
1991 103.27 111.09 105.82<br />
1992 103.60 112.68 106.78<br />
1993 104.03 112.57 107.21<br />
1994 104.31 113.23 107.75<br />
1995 104.95 113.37 108.3 1<br />
1996 105.04 113.36 108.53<br />
1997 105.36 113.36 108.89<br />
1998 105.55 114.53 109.76<br />
1999 105.77 114.70 110.06<br />
Average annual percentage change<br />
1976-99 -0.2% -0.2% -0.1%<br />
1989-99 0.3% 0.2% 0.4%<br />
Source:<br />
Oak Ridge National Laboratory, Light Vehicle MPG and<br />
Market Shares System, Oak Ridge, TN, <strong>20</strong>00.<br />
(Additional resources: www-cta.ornl.gov)<br />
il “Sales period” is October 1 of the current year through September 30 of the next year.<br />
<strong>TRANSPORTATION</strong> <strong>ENERGY</strong> <strong>DATA</strong> <strong>BOOK</strong>: <strong>EDITION</strong> <strong>20</strong>-<strong>20</strong>00
I<br />
The average auto lost over 300pounds from 1978 to 1985, but gained a few pounds back since then. Much of the<br />
weight reduction was due to the declining use of conventional steel and iron and the increasing use of aluminum<br />
and plastics. Conventional steel, however, remained the predominant component of automobiles in 1999 with a<br />
43% share of total materials. As conventional steel use has been decreasing, use of high-strength steel has<br />
increased.<br />
Material<br />
Conventional steel” l&30.0<br />
High-strength steel 127.5<br />
Stainless steel 25.0<br />
Other steels 56.0<br />
Iron 503.0<br />
Aluminum 112.0<br />
Rubber 141.5<br />
Plastics/composites 176.0<br />
Glass 88.0<br />
Copper 39.5<br />
Zinc die castings 28.0<br />
Powder metal parts 16.0<br />
Fluids & lubricants 189.0<br />
Other materials 112.5<br />
Table 7.13<br />
Average Material Consumption <strong>for</strong> a Domestic Automobile,<br />
1978,1985, and 1999<br />
1978 1985 1999<br />
Pounds Percentage Pounds Percentage Pounds Percentage<br />
53.8% 1,481.5<br />
3.6% 217.5<br />
0.7% 29.0<br />
1.6% 54.5<br />
14.4% 468.0<br />
3.2% 138.0<br />
4.1% 136.0<br />
5.0% 211.5<br />
2.5% 85.0<br />
1.1% 44.0<br />
0.8% 18.0<br />
0.5% 19.0<br />
5.4% 184.0<br />
3.2% 101.5<br />
46.5%<br />
6.8%<br />
0.9%<br />
1.7%<br />
14.7%<br />
4.3%<br />
4.3%<br />
6.6%<br />
2.7%<br />
1.4%<br />
0.5%<br />
0.6%<br />
5.8%<br />
3.2%<br />
1,399.0 42.7%<br />
328.0 10.0%<br />
50.5 1.5%<br />
25.0 0.8%<br />
355.0 10.8%<br />
236.0 7.2%<br />
142.0 4.3%<br />
245.0 7.5%<br />
97.0 3.0%<br />
45.5 1.4%<br />
12.0 0.4%<br />
35.0 1.1%<br />
194.0 5.9%<br />
110.0 3.4%<br />
Total 3,494.0 100.0% 3,187.5 100.0% 3,274.0 100.0%<br />
Source:<br />
American Metal Market, www.amm.com/ref/carmat98.htm, New York, NY, <strong>20</strong>00.<br />
(Additional resources: www.amm.com)<br />
a Includes cold-rolled and pre-coated steel.<br />
<strong>TRANSPORTATION</strong><strong>ENERGY</strong><strong>DATA</strong><strong>BOOK</strong>: <strong>EDITION</strong>~O-<strong>20</strong>00<br />
7-15<br />
m@weF
7-16<br />
em<br />
The number offrunchised dealerships which sell new light-duty vehicles (cars and light trucks) has declined 27%<br />
since 1970, though new vehicle sales have increased. The average number of vehicles soldper dealer in 1998 was<br />
683 vehicles per dealer - more than double the 1970 number.<br />
Table 7.14<br />
New Light Vehicle Dealerships and Sales, 1970-98<br />
Number of New<br />
franchised new light vehicle Light vehicle<br />
Calendar light vehicle sales sales<br />
year dealerships” (thousands) per dealer<br />
1970 30,800 9,867 3<strong>20</strong><br />
1971 30,300 12,006 396<br />
1972 30,100 13,189 438<br />
1973 30,100 14,184 471<br />
1974 30,000 11,191 373<br />
1975 29,600 10,905 368<br />
1976 29,300 13,066 446<br />
1977 29,100 14,613 502<br />
197x 29,000 15,122 521<br />
1979 28,500 13,984 491<br />
1980 27,900 11,419 409<br />
1981 26,350 10,725 407<br />
1982 25,700 10,452 407<br />
1983 24,725 12,166 492<br />
1984 24,725 14,254 577<br />
1985 24,725 15,501 627<br />
1986 24,825 16,047 646<br />
1987 25,150 14,888 592<br />
1988 25,025 15,426 616<br />
1989 25,000 14,508 580<br />
1990 24,825 13,849 558<br />
1991 24,<strong>20</strong>0 12,298 508<br />
1992 23,500 12,842 546<br />
1993 22,950 13,869 604<br />
1994 22,850 15,023 657<br />
1995 22,800 14,688 644<br />
1996 22,750 15,046 661<br />
1997 22,700 15,069 664<br />
1998 22,600 15,438 683<br />
Average annualpercentage change<br />
1970-98 -1.1% 1.6% 2.7%<br />
1988-98<br />
Source:<br />
-1.0% 0.0% 1.0%<br />
Number of dealers - National Automobile Dealers Association, Automotive<br />
Executive Magazine, 1999. (Additional resources: www.nada.org/)<br />
Light-duty vehicle sales - See tables 7.3 and 7.4.<br />
“As of the beginning of the year.<br />
<strong>TRANSPORTATION</strong> <strong>ENERGY</strong> <strong>DATA</strong> <strong>BOOK</strong>: <strong>EDITION</strong> <strong>20</strong>-<strong>20</strong>00
I<br />
The number of conventional refuelingstations has declinedsince 1970 while the number of vehicle,fueling at those<br />
stations continues to rise. In 1996, there were less than 0.5 conventionalfueling stations per thousand vehicles.<br />
Data <strong>for</strong> alternativefuel vehicles in 1999 indicate that there was an average of 15 stationsper thousand vehicles.<br />
Calendar<br />
year<br />
Table 7.15<br />
Conventional and Alternative Fuel Refueling Stations<br />
Refueling<br />
stations”<br />
1970 146,616<br />
1975 147,576<br />
1980 116,900<br />
1985 105,787<br />
1988 108,107<br />
1989 105,767<br />
1990 104,801<br />
1991 101,894<br />
1992 100,078<br />
1993 101,383<br />
1994 99,250<br />
1995 97,448<br />
1996 96,236<br />
1997 95,847<br />
Vehicles<br />
in operation Stations per<br />
(thousands) thousand vehicles<br />
Conventional fuels<br />
98,136<br />
1<strong>20</strong>,054<br />
139,832<br />
157,048<br />
171,741<br />
175,960<br />
179,299<br />
181,438<br />
181,519<br />
186,315<br />
188,714<br />
193,441<br />
198,294<br />
<strong>20</strong>1,071<br />
Alternative fuels, 1999”<br />
1.49<br />
1.23<br />
0.84<br />
0.67<br />
0.63<br />
0.60<br />
0.58<br />
0.56<br />
0.55<br />
0.54<br />
0.53<br />
0.50<br />
0.49<br />
0.48<br />
LPG 4,153 268 1,549.63<br />
CNG 1,267 90 14.08<br />
Electricity 490 6 84.13<br />
M85/MlOO 51 <strong>20</strong> 2.55<br />
LNG 46 1 33.87<br />
E85/E95 49 22 2.23<br />
Total 6,056 407 14.87<br />
Source:<br />
Refueling stations - Conventional: U.S. Department of Commerce, Bureau of the Census, County<br />
Business Patterns <strong>for</strong> the United States, www.census.gov/epcdlcbp/view/cbpview.html and<br />
electronic communication with the County Business Pattern Office, 1998. Alternative Fuel:<br />
Alternative Fuels Data <strong>Center</strong>, www.afdc.doe.gov.<br />
Vehicles - Conventional: The Polk Company, Detroit, MI. FURTHER REPRODUCTION<br />
PROHIBITED. Alternative Fuel: Alternative Fuels Data <strong>Center</strong>, www.afdc.doe.gov.<br />
a Includes convenience stores/refueling stations and truck stops which have gasoline sales of at least 50%<br />
of total establishment sales.<br />
IJ Additional data on alternative fuel vehicles and refueling stations are in Chapter 9.<br />
<strong>TRANSPORTATION</strong><strong>ENERGY</strong><strong>DATA</strong><strong>BOOK</strong>: <strong>EDITION</strong>~O-<strong>20</strong>00<br />
7-17
Table 7.16<br />
Corporate Average Fuel Economy (CAFE)<br />
Standards versus Sales-Weighted Fuel Economy Estimates<br />
<strong>for</strong> Automobiles and Light Trucks, 1978-99”<br />
(miles per gallon)<br />
Automobiles Light trucksc CAFE estimates<br />
Model CAFE<br />
CAFE estimatesd CAFE<br />
CAFE estimatesd<br />
Autos and light<br />
yetub<br />
1978<br />
standards<br />
18.0<br />
Domestic<br />
18.7<br />
Import<br />
27.3<br />
Combined<br />
19.9<br />
standards Domestic<br />
f<br />
Import<br />
f<br />
Combined trucks combined<br />
19.9<br />
1979 19.0 19.3 26.1 <strong>20</strong>.3<br />
17.7 <strong>20</strong>.8 18.2<br />
<strong>20</strong>.1<br />
1980 <strong>20</strong>.0 22.6 29.6 24.3<br />
16.8 24.3<br />
18.5<br />
23.1<br />
1981 22.0 24.2 31.5 25.9<br />
18.3 27.4<br />
<strong>20</strong>.1<br />
24.6<br />
1982 24.0 25.0 31.1 26.6<br />
17.5<br />
19.2 27.0 <strong>20</strong>.5<br />
25.1<br />
1983 26.0 24.4 32.4 26.4<br />
19.0<br />
19.6 27.1 <strong>20</strong>.7<br />
24.8<br />
1984 27.0 25.5 32.0 26.9<br />
<strong>20</strong>.0<br />
19.3 26.7 <strong>20</strong>.6<br />
25.0<br />
198.5 27.5 26.3 31.5 27.6<br />
19.5<br />
19.6 26.5 <strong>20</strong>.7<br />
25.4<br />
1986 26.0 26.9 31.6 28.2<br />
<strong>20</strong>.0<br />
<strong>20</strong>.0 25.9 21.5<br />
25.9<br />
1987 26.0 27.0 31.2 28.4<br />
<strong>20</strong>.5<br />
<strong>20</strong>.5 25.2 21.7<br />
26.2<br />
1988 26.0 27.4 31.5 28.0<br />
<strong>20</strong>.5<br />
<strong>20</strong>.6 24.6 21.3<br />
26.0<br />
1989 26.5 27.2 30.8 28.4<br />
<strong>20</strong>.5<br />
<strong>20</strong>.4 23.5 21.0<br />
25.6<br />
1990 27.5 26.9 29.9 27.9<br />
<strong>20</strong>.0<br />
<strong>20</strong>.3 23.0 <strong>20</strong>.8<br />
25.4<br />
1991 27.5 27.3 30.1 28.4<br />
<strong>20</strong>.2<br />
<strong>20</strong>.9 23.0 21.3<br />
25.6<br />
1992 27.5 27.0 29.2 27.9<br />
<strong>20</strong>.2<br />
<strong>20</strong>.5 22.7 <strong>20</strong>.8<br />
25.1<br />
1993 27.5 27.8 29.6 28.4<br />
<strong>20</strong>.4<br />
<strong>20</strong>.7 22.8 21.0<br />
25.2<br />
1994 27.5 27.5 29.7 28.3<br />
<strong>20</strong>.5<br />
<strong>20</strong>.5 22.0 <strong>20</strong>.8<br />
24.7<br />
1995 27.5 27.7 30.3 28.6<br />
<strong>20</strong>.6<br />
<strong>20</strong>.3 21.5 <strong>20</strong>.5<br />
24.9<br />
1996 27.5 28.1 29.6 28.5<br />
<strong>20</strong>.7<br />
<strong>20</strong>.5 22.1 <strong>20</strong>.8<br />
24.9<br />
1997 27.5 27.8 30.1 28.7<br />
<strong>20</strong>.7<br />
<strong>20</strong>.1 22.1 <strong>20</strong>.6<br />
24.6<br />
1998 27.5 28.1 30.0 28.7<br />
<strong>20</strong>.7<br />
2q.4 23r.0 <strong>20</strong>.9<br />
24.6<br />
1999<br />
Source:<br />
27.5 28.2 28.4 28.3 <strong>20</strong>.7 <strong>20</strong>.7 24.5<br />
U.S. Department of Transportation, NHTSA, “Summary of Fuel Economy Per<strong>for</strong>mance,” Washington, DC, October 1999. (Additional resources: www.nhtsa.dot.gov)<br />
“Only vehicles with at least 75 percent domestic content can be counted in the average domestic fuel economy <strong>for</strong> a manufacturer.<br />
bModel year as determined by the manufacturer on a vehicle by vehicle basis.<br />
‘Represents two- and four-wheel drive trucks combined. Gross vehicle weight of O-6,000 pounds <strong>for</strong> model year 1978-1979 and O-8,500 pounds <strong>for</strong> subsequent years.<br />
dAll CAFE calculations are sales-weighted.<br />
“Standards were set <strong>for</strong> two-wheel drive and four-wheel drive light trucks separately, but no combined standard was set in this year.<br />
fData are not available.
Table 7.17<br />
Corporate Average Fuel Economy (CAFE) Fines Collected, 1983-98”<br />
(thousands)<br />
Model Current 1998 constant<br />
year dollars dollarsb<br />
1983 58 95<br />
1984 5,958 9,352<br />
1985 15,565 23,589<br />
19% 29,872 44,417<br />
1987 31,261 44,844<br />
1988 44,519 61,357<br />
1989 47,381 G2,3 11<br />
1990 48,449 60,444<br />
1991 42,243 50,557<br />
1992 38,287 44,48 1<br />
1993 28,688 32,374<br />
1994 31,478 34,619<br />
1995 40,788 43,6<strong>20</strong><br />
1996 19,302 <strong>20</strong>,058<br />
1997 36,<strong>20</strong>4 36,769<br />
1998 17,677 17,677<br />
Source:<br />
U.S. Department of Transportation, National Highway Traffic Safety<br />
Administration, Office of Vehicle Safety Compliance,<br />
Washington, DC, March, <strong>20</strong>00.<br />
(Additional resources: www.nhtsa.dot.gov)<br />
Table 7.18<br />
Tax Receipts from the Sale of Gas Guzzlers, 1980-98<br />
(thousands1<br />
Fiscal Current 1998 constant<br />
year dollars dollar$<br />
1980<br />
1981<br />
1982<br />
1983<br />
1984<br />
1985<br />
1986<br />
1987<br />
1988<br />
1989<br />
1990<br />
1991<br />
1992<br />
1993<br />
1994<br />
1995<br />
1996<br />
1997<br />
1998<br />
740 1,464<br />
780 1,398<br />
1,7<strong>20</strong> 2,905<br />
4,0<strong>20</strong> 6,578<br />
8,8<strong>20</strong> 13,844<br />
39,790 60,302<br />
147,660 219,557<br />
145,900 <strong>20</strong>9,292<br />
116,780 160,947<br />
109,640 144,189<br />
103,<strong>20</strong>0 128,750<br />
1 18,400 141,703<br />
1, 44,<strong>20</strong>0 167,530<br />
1 11,600 125,940<br />
64,100 70,496<br />
73,500 78,603<br />
52,600 54,660<br />
48,<strong>20</strong>0 48,952<br />
47,700 47,700<br />
Source:<br />
Internal Revenue Service, Statistics of Income Bulletin, Summer 1999,<br />
Washington, DC, 1999, p. 2<strong>20</strong>. (Additional resources: www.irs.gov/tax-stats).<br />
a These are fines which are actually collected. Fines which are assessed in a certain year may not<br />
have been collected in that year.<br />
b Adjusted using the Consumer Price Inflation Index.<br />
<strong>TRANSPORTATION</strong> <strong>ENERGY</strong> <strong>DATA</strong> <strong>BOOK</strong>: <strong>EDITION</strong> <strong>20</strong>-<strong>20</strong>00<br />
7-19
7-<strong>20</strong><br />
I<br />
Consumers mustpuy the Gas Guzzler Tax whenpurchasingan automobile thnthas an EnvironmentalProtection<br />
Agency (EPA) fuel economy rating less than that stipulated in the table below.. The Gas Guzzler Tax doubled<br />
in 1991 after remaining constantfrom 1986 to 1990. The tax has not changedsince 1991.<br />
Table 7.19<br />
The Gas Guzzler Tax on New Cars<br />
(dollars per vehicle)<br />
Vehicle<br />
fuel<br />
economy 1986-9 1991<br />
(mpg> 1980 1981 1982 1983 1984 1985 0 +<br />
Over 22.5 0 0 0 0 0 0 0 0<br />
22.0-22.5 0 0 0 0 0 0 500 1,000<br />
21.5-22.0 0 0 0 0 0 0 500 1,000<br />
21.0-21.5 0 0 0 0 0 0 650 1,300<br />
<strong>20</strong>.5-21 .O 0 0 0 0 0 500 650 1,300<br />
<strong>20</strong>.0-<strong>20</strong>.5 0 0 0 0 0 500 850 1,700<br />
19.5-<strong>20</strong>.0 0 0 0 0 0 600 850 1,700<br />
19.0-19.5 0 0 0 0 450 600 1,050 2,100<br />
18.5-19.0 0 0 0 350 450 800 1,050 2,100<br />
18.0-18.5 0 0 <strong>20</strong>0 350 600 800 1,300 2,600<br />
17.5-18.0 0 0 <strong>20</strong>0 500 600 1,oo 1,300 2,600<br />
17.0-17.5 0 0 350 500 750 1,oo 1,500 3,000<br />
16.5-17.0 0 <strong>20</strong>0 350 650 750 1,<strong>20</strong> 1,500 3,000<br />
16.0-16.5 0 <strong>20</strong>0 450 650 950 1,<strong>20</strong> 1,850 3,700<br />
15.5-16.0 0 350 450 800 950 1,50 1,850 3,700<br />
15.0-15.5 0 350 600 800 1,150 1,50 2,250 4,500<br />
14.5-15.0 <strong>20</strong>0 450 600 1,000 1,150 1,80 2,250 4,500<br />
14.0-14.5 <strong>20</strong>0 450 750 1,000 1,450 1,80 2,700 5,400<br />
13.5-14.0 300 550 750 1,250 1,450 2,<strong>20</strong> 2,700 5,400<br />
13.0-13.5 300 550 950 1,250 1,750 2,<strong>20</strong> 3,<strong>20</strong>0 6,400<br />
12.5-13.0 550 650 950 1,550 1,750 2,65 3,<strong>20</strong>0 6,400<br />
Under 12.5 550 650 1,<strong>20</strong>0 1,550 2,150 2,65 3,850 7,700<br />
Source:<br />
Internal Revenue Service, Form 6197, (Rev. 1-9 l), “Gas Guzzler Tax.”<br />
(Additional resources: www.irs.ustreas.gov)<br />
<strong>TRANSPORTATION</strong> <strong>ENERGY</strong> <strong>DATA</strong> <strong>BOOK</strong>: <strong>EDITION</strong> <strong>20</strong>-<strong>20</strong>00
Fuel Economy by Vehicle Speed<br />
ORNL has developed fuel consumption and emissions lookup tables <strong>for</strong> the Federal Highway<br />
Administration, <strong>for</strong> use in their TRAF series of traffic models (NETSIM, CORSIM, FRESIM),<br />
although more generic uses are also possible. To develop the data-based models, vehicles are tested<br />
both on-road and on a chassis dynamometer. Engine parameters are measured on-road under real-<br />
world driving conditions that cover the vehicle’s entire operating envelope. Emissions and fuel<br />
consumption are then measured on the chassis dynamometer as functions of engine conditions. The<br />
two data sets are merged to produce the final three-dimensional maps as functions of vehicle speed<br />
and acceleration. Eight well-functioning, late-model vehicles, and one 1997 model vehicle, have<br />
been tested thus far in fully warmed-up conditions.<br />
Similar continuing work is planned <strong>for</strong> the Department of Energy as well as FHWA, which will<br />
include more well-functioning, late-model vehicles, pre-control (1960’s) vehicles, malfunctioning<br />
high-emitter vehicles, light-duty diesel vehicles (cars and pickup trucks), alternative fuel vehicles,<br />
and possibly heavy-duty diesel vehicles. ORNL will also be developing cold-start algorithms to<br />
enhance the existing models, since emissions and fuel economy generally improve as vehicles warm<br />
up to normal operating temperatures.<br />
For further in<strong>for</strong>mation regarding this study please contact:<br />
Scott Sluder<br />
Fuels, Combustion, and Engine Technology<br />
P.O. Box <strong>20</strong>09, Building 9108<br />
Oak Ridge, TN 3783 l-8087<br />
Phone: 865-241-9133<br />
Fax: 865-241-1747<br />
email: sluders@oml.gov<br />
<strong>TRANSPORTATION</strong><strong>ENERGY</strong><strong>DATA</strong>BOOIC: <strong>EDITION</strong>~O-<strong>20</strong>00<br />
7-2 1
7-22<br />
wafw!eP<br />
Vehicle<br />
198 8 Chevrolet Corsica 2,665<br />
1994 Olds Cutlass Supreme 3,290<br />
1994 Oldsmobile 88 3,433<br />
1994 Mercury Villager 4,0<strong>20</strong><br />
1995 Geo Prizm 2,359<br />
1994 Jeep Grand Cherokee 3,8<strong>20</strong><br />
1994 Chevrolet Pickup 4,0<strong>20</strong><br />
1993 Subaru Legacy 2,800<br />
1997 Toyota Celica 2,395<br />
Table 7.<strong>20</strong><br />
Vehicle Specifications <strong>for</strong> Tested Vehicles<br />
Curb<br />
weight Engine<br />
2.8 liter V6<br />
3.4 liter V6<br />
3.8 literV6<br />
3 .O liter V6<br />
1.6 liter I-4<br />
4.0 liter I-6<br />
5.7 liter V8<br />
2.2 liter H4<br />
1.8 liter 14<br />
Fuel<br />
delivery<br />
system”<br />
PFI<br />
PFI<br />
PFI<br />
PFI<br />
PFI<br />
PFI<br />
TBI<br />
PFI<br />
PFI<br />
Transmission<br />
M5<br />
L4<br />
L4<br />
L4<br />
L3<br />
L4<br />
L4<br />
L4<br />
L4<br />
EPA fuel economy<br />
City Highway<br />
Source:<br />
West, B.H., R.N. McGill, J.W. Hodgson, S.S. Sluder, and D.E. Smith, Development and Ver$cation oflight-Duty<br />
Modal Emissions and Fuel Consumption Vulues <strong>for</strong> Traffic Models, Washington, DC, April 1997 and<br />
additional project data, April 1998.<br />
a PFI = port fuel injection. TBI = throttle- body fuel injection.<br />
<strong>TRANSPORTATION</strong><strong>ENERGY</strong><strong>DATA</strong>BOOIC <strong>EDITION</strong>~O-<strong>20</strong>00<br />
19<br />
17<br />
19<br />
17<br />
26<br />
15<br />
14<br />
22<br />
27<br />
29<br />
26<br />
29<br />
23<br />
30<br />
<strong>20</strong><br />
18<br />
29<br />
34
I<br />
The two earlier studies by the Federal Highway Administration (FHWA) indicate maximum fuel efficiency was<br />
achieved at speeds of 35 to 40 mph. The recent FHWA study indicates greater fuel efficiency at higher speeds.<br />
Note that the 1973 study did not include light trucks.<br />
Table 7.21<br />
Fuel Economy by Speed, 1973,1984, and 1997<br />
(miles per gallon)<br />
Speed 1973” 1984” 1997’<br />
(miles per hour) (13 vehicles) (15 vehicles) (9 vehicles)<br />
15<br />
<strong>20</strong><br />
25<br />
30<br />
35<br />
40<br />
45<br />
50<br />
55<br />
60<br />
65<br />
70<br />
75<br />
55-65 mph 12.4%<br />
65-70 mph 8.0%<br />
55-70 mph 19.5%<br />
d<br />
d<br />
d<br />
21.1<br />
21.1<br />
21.1<br />
<strong>20</strong>.3<br />
19.5<br />
18.5<br />
17.5<br />
16.2<br />
14.9<br />
d<br />
21.1<br />
25.5<br />
30.0<br />
31.8<br />
33.6<br />
33.6<br />
33.5<br />
31.9<br />
30.3<br />
27.6<br />
24.9<br />
22.5<br />
<strong>20</strong>.0<br />
Fuel economy loss<br />
17.8%<br />
9.6%<br />
25.7%<br />
24.4<br />
27.9<br />
30.5<br />
31.7<br />
31.2<br />
31.0<br />
31.6<br />
32.4<br />
32.4<br />
31.4<br />
29.2<br />
26.8<br />
24.8<br />
9.7%<br />
8.2%<br />
17.1%<br />
Source:<br />
1973- U.S. Department of Transportation, Federal Highway Administration, Office of<br />
Highway Planning, The Effect of Speed on Automobile Gasoline Consumption Rates,<br />
Washington, DC, October 1973.<br />
1984 -U.S. Department of Transportation, Federal Highway Administration, Fuel Consumption and<br />
Emission Values <strong>for</strong> Traffic Models, Washington, DC, May 1985.<br />
1997 - West, B.H., R.N. McGill, J.W. Hodgson, S.S. Sluder, and D.E. Smith, Development and<br />
Verification ofLight-Duty ModalEmissions andFuel Consumption Values<strong>for</strong> Traffic Models,<br />
FHWA Report (in press), Washington, DC, April 1997, and additional project data, April<br />
1998.<br />
(Additional resources: wwwfhwa-tsiscom)<br />
“Model years 1970 and earlier automobiles.<br />
“Model years 1981-84 automobiles and light trucks.<br />
‘Model years 1988-97 automobiles and light trucks.<br />
dData are not available.<br />
TRANSPORTATJON<strong>ENERGY</strong><strong>DATA</strong>BOOIC <strong>EDITION</strong>~O-<strong>20</strong>00<br />
7-23
35<br />
30<br />
15 <strong>20</strong> 25 30 35<br />
Source: See Table 7.21.<br />
Figure 7.2. Fuel Economy by Speed, 1973,1984, and 1997<br />
40 45 50<br />
Speed (miles per hour)<br />
55 60 65 70 75
Speed<br />
(mph)<br />
1988 1993<br />
Chevrolet Subaru<br />
Corsica Legacy<br />
5 10.0 14.5<br />
10 16.8 24.7<br />
15 17.7 31.9<br />
<strong>20</strong> 21.7 34.4<br />
25 23.9 37.4<br />
30 28.7 39.7<br />
35 28.6 38.0<br />
40 29.2 37.0<br />
45 28.8 33.7<br />
50 31.2 33.7<br />
55 29.1 37.7<br />
60 28.2 35.9<br />
65 28.7 33.4<br />
70 26.1 31.0<br />
75 23.7 28.8<br />
1994<br />
Oldsmobile<br />
Olds 88<br />
10.5<br />
14.9<br />
22.2<br />
26.3<br />
28.3<br />
29.0<br />
30.9<br />
33.2<br />
32.4<br />
34.2<br />
34.6<br />
32.5<br />
30.0<br />
26.7<br />
24.0<br />
Table 7.22<br />
Steady Speed Fuel Economy <strong>for</strong> Tested Vehicles<br />
(miles per gallon)<br />
1994<br />
Oldsmobile<br />
Cutlass<br />
1994<br />
Chevrolet<br />
Pickup<br />
1994 Jeep<br />
Grand<br />
Cherokee<br />
1994<br />
Mercury<br />
Villager<br />
1995<br />
Geo<br />
Prizm<br />
1997<br />
Toyota<br />
Celica<br />
5.1 7.9 8.2 12.3 18.1 19.1<br />
7.9 16.0 11.2 19.0 23.1 34.1<br />
11.4 16.3 17.5 22.4 38.9 41.7<br />
12.5 19.9 24.7 25.8 39.4 46.0<br />
15.6 22.7 21.8 30.8 41.7 52.6<br />
19.0 26.3 21.6 30.3 40.0 50.8<br />
21.2 24.3 25.0 26.1 39.1 47.6<br />
23.0 26.7 25.5 29.0 38.9 36.2<br />
23.0 27.3 25.4 27.8 42.3 44.1<br />
27.3 26.3 24.8 30.1 39.1 44.8<br />
29.1 25.1 24.0 31.7 37.7 42.5<br />
28.2 22.6 23.2 27.3 36.7 48.4<br />
25.0 21.8 21.3 25.3 34.1 43.5<br />
22.9 <strong>20</strong>.1 <strong>20</strong>.0 23.9 31.7 39.2<br />
21.6 18.1 19.1 22.4 28.3 36.8<br />
Fuel economy loss<br />
55-65 mph 1.4% 11.4% 13.3%<br />
14.1% 13.1% 11.3% <strong>20</strong>.2% 9.5% -2.4%<br />
65-75 mph 17.4% 13.8% <strong>20</strong>.0%<br />
13.6% 17.0% 10.3% 11.5% 17.0% 15.4%<br />
55-75 mph<br />
Source:<br />
18.6% 23.6% 30.6% 25.8% 27.9% <strong>20</strong>.4% 29.3% 24.9% 13.4%<br />
B.H. West, R.N. McGill, J.W. Hodgson, S.S. Sluder, D.E. Smith, Development and Verification of Light-Du@ Modal Emissions and Fuel<br />
Consumption Values <strong>for</strong> Trafic Models, Washington, DC, April 1997, and additional project data, April 1998.<br />
(Additional resources: www.fhwa-tsis.com)<br />
Note:<br />
For specifications of the tested vehicles, please see Table 7.<strong>20</strong>.
7-26<br />
The Environmental Protection Agency (EPA) tests new vehicles to determine fuel economy ratings. The city and<br />
highway fuel economies that are posted on the windows of new vehicles are determined by testing the vehicle during<br />
these driving cycles. The driving cycles simulate the per<strong>for</strong>mance of an engine while driving in the city and on the<br />
highway. Once the urban cycle is completed, the engine is stopped, then started again <strong>for</strong> the 8.5 minute hot start cycle.<br />
80<br />
70<br />
2 40<br />
E<br />
i 30<br />
2<br />
v) <strong>20</strong><br />
IO<br />
0<br />
0<br />
Figure 7.3. Urban Driving Cycle<br />
<strong>20</strong>0 400 600 800 1000 1<strong>20</strong>0<br />
Seconds<br />
Figure 7.4. Highway Driving Cycle<br />
0 ' 1<br />
0 100 <strong>20</strong>0 300 400 500 600 700<br />
Seconds<br />
Source:<br />
Code of Federal Regulations, 40CFR, “Subpart B - Fuel Economy Regulations <strong>for</strong> 1978 and Later Model<br />
Automobiles - Test Procedures,” July 1, 1988 edition, p. 676.<br />
<strong>TRANSPORTATION</strong><strong>ENERGY</strong><strong>DATA</strong>BOOIC ED~TION~O-<strong>20</strong>00<br />
Year
I<br />
The New York Test Cycle was developed in the 1970’s in order to simulate driving in downtown congested areas. The<br />
Representative Number Five Test Cycle was developed recently to better represent actual on-road driving by combining<br />
modern urban andfreeway driving.<br />
80 -<br />
70 -<br />
L 60 -<br />
ii<br />
f 50 -<br />
d<br />
B40 -<br />
E<br />
p 30 -<br />
8.<br />
tn <strong>20</strong> -<br />
10 -<br />
80<br />
70<br />
60<br />
5<br />
2<br />
L 50<br />
$<br />
2 40<br />
E<br />
$ 30<br />
x<br />
* <strong>20</strong><br />
10<br />
0<br />
Figure 7.5. New York City Driving Cycle<br />
0 100 <strong>20</strong>0 300<br />
Seconds<br />
Figure 7.6. Representative Number Five Driving Cycle<br />
400 500 600<br />
0 <strong>20</strong>0 400 600 800 1000 1<strong>20</strong>0<br />
Seconds<br />
Source:<br />
Data obtained from Michael Wang, Argonne National Laboratory, Argonne, IL, 1997.<br />
TRANWORTATION<strong>ENERGY</strong><strong>DATA</strong><strong>BOOK</strong>: <strong>EDITION</strong>~O-<strong>20</strong>00<br />
I<br />
7-27
7-28<br />
I<br />
The US06 driving cycle was developed as a supplement to the Federal Test Procedure. It is a<br />
short-duration cycle (600 seconds) which represents hard-acceleration driving. I<br />
80<br />
& 30<br />
iii.<br />
v) <strong>20</strong><br />
10<br />
0<br />
0 100<br />
Figure 7.7. US06 Driving Cycle<br />
<strong>20</strong>0 300<br />
Seconds<br />
400 500 600<br />
Source:<br />
Data obtained from Michael Wang, Argonne National Laboratory, Argonne, IL, 1997.<br />
<strong>TRANSPORTATION</strong><strong>ENERGY</strong><strong>DATA</strong>BOOIC <strong>EDITION</strong>~O-<strong>20</strong>00
Table 7.23<br />
Occupant Fatalities by Vehicle Type and Nonoccupant Fatalities, 1975-98<br />
Vehicle occupant fatalities by<br />
vehicle type<br />
Passenger car<br />
1975 1980 1985 1990 1995 1996 1997 1998<br />
Subcompact 3,834 7,299 7,993 8,309 6,791 6,618 6,2<strong>20</strong> ’<br />
Compact 614 927 2,635 5,310 6,899 7,288 7,195 n<br />
Intermediate 1,869 3,878 4,391 4,849 4,666 4,670 4,794 a<br />
Full 10,800 11,580 6,586 4,635 3,413 3,417 3,481<br />
a<br />
Unknown 8,812 3,765 1,607 989 654 512 509 n<br />
Total 25,929 27,449 23,212 24,092 22,423 22,505 22,199 21,164<br />
Truck<br />
Light<br />
Large<br />
4,856 7,486 6.689 8,601 9,568 9,932 10,249 10,647<br />
961 1,262 977 705 648 621 723 728<br />
Total 5,817 8,748 7,666 9,306 10,216 10,553 10,972 11,375<br />
Other Vehicles<br />
Motorcycle<br />
Bus<br />
Other/unknown<br />
vehicle type<br />
3,189 5,144 4,564 3,244 2,227 2,161 2,116 2,284<br />
53 46 57 32 33 21 18 36<br />
R937 540 544 460 392 455 4<strong>20</strong> 500<br />
Total R4,179 5,730 5,165 3,736 2,652 2,637 2,554 2,8<strong>20</strong><br />
TOTAL vehicle<br />
occupant fatalities 35,925 41,927 36,043 37,134 35,291 35,695 34,725 35,369<br />
Nonoccupant fatalities<br />
Pedestrian 7,516 8,070 6,808 6,482 5,584 5,449 5,321 5,2<strong>20</strong><br />
Pedalcyclist 1,003 965 890 859 833 765 814 761<br />
Other 81 129 84 124 109 154 153 131<br />
Total 8,600 9,164 7,782 7,465 6,526 6,368 6,288 6,112<br />
TOTAL traffic<br />
fatalities<br />
44,525 51,091 43,825 44,599 41,817 42,065” 42,013 41,471<br />
Source:<br />
U.S. Department of Transportation, Bureau of Transportation Statistics, National Transportation Statistics<br />
1999, Washington, DC 1999, p. 232. [Original source: U.S. DOT, National Highway Traffic Safety<br />
Administration, Fatal Accident Reporting System.] (Additional resources: www.nhtsa.dot.gov)<br />
“Data are not available.<br />
“Includes 2 fatalities that could not be assigned to a category above.<br />
<strong>TRANSPORTATION</strong> <strong>ENERGY</strong><strong>DATA</strong><strong>BOOK</strong>: <strong>EDITION</strong>~O-<strong>20</strong>00<br />
7-29
Fatalities<br />
Injuries<br />
Crashes<br />
Vehicle-miles (billions)b<br />
Table 7.24<br />
Light Vehicle Occupant Safety Data, 1975-98<br />
1975 1980 1985 1990 1995 1996 1997 1998<br />
Passenger cars<br />
25,929 27,449 23,212 24,092 22,423 22,505 22,199 21,164<br />
a a a<br />
2,376,OOO 2,469,OOO 2,458,OOO 2,341,OOO 2,<strong>20</strong>1,OOO<br />
a a a<br />
5,560,OOO 5,523,OOO 5,599,OOO 5,537,OOO a<br />
1,030 1,107 1,249 1,427 1,478 1,499 1,528 a<br />
Rates per 100 million vehicle miles<br />
Fatalities<br />
2.5 2.5 1.9 1.7 1.5 1.5 1.4 a<br />
Fatalities<br />
Injuries<br />
Crashes<br />
Injuries<br />
Crashes<br />
Vehicle-miles (billions)b<br />
a a a 167 167 164 R153 a<br />
a a a 390 374 374 R355 a<br />
Light trucks (10,000 lbs. or less)<br />
4,856 7,486 6,689 8,601 9,568 9,932 10,249 10,647<br />
a a a<br />
505,000 722,000 761,000 755,000 763,000<br />
a a a<br />
2,152,OOO 2,709,OOO 2,881,OOO 2,901,OOO a<br />
<strong>20</strong>4 295 389 556 750 787 824 a<br />
Rates per 100 million vehicle-miles<br />
Fatalities 2.4 2.5 1.7 1.5 1.3 1.3 1.2 a<br />
Injuries<br />
Crashes<br />
a a a 91 96 98 93 a<br />
a a a 387 361 366 352 a<br />
Source:<br />
U.S. Department of Transportation, Bureau of Transportation Statistics, National Transportation Statistics 1999, Washington, DC 1999,<br />
pp. 233, 235. [Original source: U.S. DOT, National Highway Traffic Safety Administration, Fatal Accident Reporting System.]<br />
(Additional resources: www.nhtsa.dot.gov)<br />
aData are not available.<br />
“Vehicle-miles are estimated by the National Highway Traffic Safety Administration and do not match Federal Highway data.
B0<br />
P<br />
I In<br />
1998, nearly 40% of all passenger car and light truckfatal crashes were single-vehicle crashes. Because there are so many passenger cars on<br />
the roads compared to the other vehicle qpes, total passenger car crashes are nearly double all other vehicle types combined.<br />
Table 7.25<br />
Crashes by Crash Severity, Crash Type, and Vehicle Type, 1998<br />
Fatal Inj m-y Property damage only<br />
Single- Multiple- Single- Multiple- Single- Multiplevehicle<br />
vehicle vehicle vehicle vehicle vehicle Total<br />
Vehicle type crash crash crash crash crash crash crashes<br />
Passenger cars 10,785 18,<strong>20</strong>7 362,000 725,000 725,000 4,171,ooo 7,470,ooo<br />
Light trucks 7,540 11,677 163,000 896,000 365,000 1,950,000 3,393,ooo<br />
Large trucks 808 4,127 14,000 75,000 73,000 245,000 412,000<br />
Buses 106 179 2,000 11,000 8,000 32,000 53,000<br />
Motorcycles 1,045 1,279 22,000 23,000 2,000 6,000 55,000<br />
Source:<br />
U.S. Department of Transportation, National Highway Traffic Safety Administration, Tvafjc Safety Facts 1998, Washington, DC,<br />
October 1999, pp. 72, 74, 76, 80, 82.<br />
Note:<br />
Multiple-vehicle crashes cannot be totaled over vehicle type due to duplication of accidents between vehicle types.<br />
4<br />
LJ<br />
e
40.0<br />
0.0<br />
Figure 7.8. Percent Rollover Occurrence by Vehicle Type and Crash Severity<br />
Crash Severity:<br />
I Fatal Injury Property damage only I<br />
24.5<br />
36.0<br />
<strong>20</strong>.3<br />
3.8<br />
..^^^<br />
. ^ ^<br />
12.6<br />
Passenger car Pickup suv Van Other light trk<br />
Source:<br />
U.S. Department of Transportation, National Highway Traffic Safety Administration, Traffic Safety Facts 1998, Washington, DC,<br />
October 1999, p. 64.
Source<br />
Table 8.1<br />
Table 8.1<br />
Table 8.7<br />
Table 8.12<br />
Table 8.13<br />
Chapter 8<br />
Heavy Vehicles and Characteristics<br />
Summary Statistics from Tables in this Chapter<br />
Heavy single-unit trucks, 1998<br />
Registration (thousands)<br />
Vehicle miles (millions)<br />
Fuel economy (miles per gallon)<br />
Combination trucks, 1998<br />
Registration (thousands)<br />
Vehicle miles (millions)<br />
Fuel economy (miles per gallon)<br />
Trucks by size, 1997 Trucl~ Inventory & Use Survey<br />
Light (O-l 0,000 lbs)<br />
Medium (lO, OOl-26,000 lbs)<br />
Heavy (26,001 lbs and over)<br />
Freight Shipments, 1997 Commodity Flow Survey<br />
Value (billion dollars)<br />
Tons (millions)<br />
Ton-miles (billions)<br />
Bus passenger miles, 1998<br />
Transit<br />
In tercity<br />
TFUNSPORTATION<strong>ENERGY</strong><strong>DATA</strong>BOOIC <strong>EDITION</strong>~O-<strong>20</strong>00<br />
5,414<br />
67,894<br />
7.0<br />
1,831<br />
128,159<br />
6.1<br />
93.5%<br />
3.0%<br />
3.5%<br />
8,567<br />
14,800<br />
3,851<br />
(millions)<br />
<strong>20</strong>,602<br />
31,700<br />
8-1
0<br />
8 Table 8.1<br />
P<br />
Summary Statistics <strong>for</strong> Other Single-Unit and Combination Trucks, 1970-98”<br />
Year<br />
1970<br />
1971<br />
1972<br />
1973<br />
1974<br />
1975<br />
% 1976<br />
0<br />
E 1977<br />
P 1978<br />
=! 2 1979<br />
1980<br />
Y 1981<br />
YJ 1982<br />
2 1983<br />
Y 1984<br />
2 1985<br />
E 1986 1987<br />
F 1988<br />
g 1989<br />
7 1990<br />
z 1991<br />
z<br />
% 1992<br />
1993<br />
z 1994<br />
8 1995<br />
1996<br />
1997<br />
1998<br />
Other single-unit trucksb<br />
Combination trucks’<br />
Registrations Vehicle travel Fuel use Fuel economy Registrations Vehicle travel Fuel use<br />
(thousands) (million miles) (million gallons) (miles per gallon) (thousands) (million miles) (million gallons)<br />
3,681 27,08 1 3,968<br />
6.8<br />
905<br />
35,134 7,348<br />
3,770 28,985 4,217<br />
6.9 919<br />
37,217 7,595 4.9<br />
3,918 31,414 4,844<br />
6.5 961<br />
40,706 8,1<strong>20</strong> 5.0<br />
4,131 33,661 5,294<br />
6.4 1,029<br />
45,649 9,026 5.1<br />
4,211 33,441 5,261<br />
6.4 1,085<br />
45,966 9,080 5.1<br />
4,232 34,606 5,4<strong>20</strong><br />
6.4 1,131<br />
46,724 9,177 5.1<br />
4,350 36,390 5,706<br />
6.4 1,225<br />
49,680 9,703 5.1<br />
4,450 39,339 6,268<br />
6.3 1,240<br />
55,682 10,814 5.1<br />
4,518 42,747 6,955<br />
6.1 1,342<br />
62,992 12,165 5.2<br />
4,505 42,012 7,050<br />
6.0 1,386<br />
66,992 12,864 5.2<br />
4,374 39,813 6,923<br />
5.8 1,417<br />
68,678 13,037 5.3<br />
4,455 39,568 6,867<br />
5.8 1,261<br />
69,134 13,509 5.1<br />
4,325 40,658 6,803<br />
6.0 1,265<br />
70,765 13,583 5.2<br />
4,<strong>20</strong>4 42,546 6,965<br />
6.1 1,304<br />
73,586 13,796 5.3<br />
4,061 44,419 7,240<br />
6.1 1,340<br />
77,377 14,188 5.5<br />
4,593 45,441 7,399<br />
6.1 1,403<br />
78,063 14,005 5.6<br />
4,313 45,637 7,386<br />
6.2 1,408<br />
81,038 14,475 5.6<br />
4,188 48,022 7,523<br />
6.4 1,530<br />
85,495 14,990 5.7<br />
4,470 49,434 7,701<br />
6.4 1,667<br />
88,55 1 15,224 5.8<br />
4,519 50,870 7,779<br />
6.5 1,707<br />
91,879 15,733 5.8<br />
4,487 51,901 8,357<br />
6.2 1,709<br />
94,341 16,133 5.8<br />
4,48 1 52,898 8,172<br />
6.5 1,691<br />
96,645 16,809 5.7<br />
4,370 53,874 8,237<br />
6.5 1,675<br />
99,510 17,216 5.8<br />
4,408 56,772 8,488<br />
6.7 1,680<br />
103,116 17,748 5.8<br />
4,906 61,284 9,032<br />
6,8 1,681<br />
108,932 18,653 5.8<br />
5,024 62,705 9,216<br />
6.8 1,696<br />
115,451 19,777 5.8<br />
5,266 64,072 9,409<br />
6.8 1,747<br />
118,899 <strong>20</strong>,192 5.9<br />
5,293 66,893 9,576<br />
7.0 1,790<br />
124,584 <strong>20</strong>,302 6.1<br />
5,414 67,894 9,741<br />
7.0 1,831<br />
128,159 21,100 6.1<br />
Average annualpevcentage change<br />
1970-98 1.4% 3.3% 3.3% 0.1% 2.5%<br />
4.7% 3.8% 0.9%<br />
1988-98<br />
Source:<br />
1.9% 3.2% 2.4% 0.9% 1.6% 3.8% 3.3%<br />
0.5%<br />
U. S. Department of Transportation, Federal Highway Administration, Highway Statistics 1998, Washington, DC, 1999, Table VMl and annual.<br />
(Additional resources: www.fhwa.dot.gov)<br />
a The Federal Highway Administration changed the combination truck travel methodology in 1993.<br />
b Other single-unit trucks are defined as all single-unit trucks with more than two axles or more than four tires.<br />
’ The fuel economy <strong>for</strong> combination trucks is not the same as the fuel economy <strong>for</strong> Class 8 trucks. Fuel economy <strong>for</strong> Class 8 trucks is shown in Table 8.5.<br />
Fuel economy<br />
(miles per gallon)<br />
4.8
Table 8.2<br />
New Retail Truck Sales by Gross Vehicle Weight, 1970-98”<br />
(thousands)<br />
Class 1 Class 2 Class 3 Class 4 Class 5 Class 6 Class 7 Class 8<br />
6,000 lbs. 6,001- lO,OOl- 14,001- 16,001- 19,501- 26,001- 33,001 lbs.<br />
Calendar year or less 10,000 lbs. 14,000 Ibs. 16,000 lbs. 19,500 lbs. 26,000 Ibs. 33,000 lbs. and over Total<br />
Domestic sales (import data are not available)<br />
1970b 1,049 408 6 12 58 133 36 89 1,791<br />
1971 1,185 488 G 15 46 140 34 99 2,013<br />
1972 1,498 599 55 11 29 182 35 126 2,535<br />
1973 1,754 758 50 3 16 236 37 155 3,009<br />
1974 1,467 696 21 3 14 <strong>20</strong>7 31 148 2,587<br />
1975 1,101 952 23 1 9 159 23 83 2,35 1<br />
1976 1,318 1,401 43 c 9 153 22 97 3,043<br />
1977 1,306 1,803 36 3 5 163 28 141 3,485<br />
1978 1,334 2,140 73 6 3 156 41 162 3,915<br />
1979 1,271 1,574 15 3 3 146 50 174 3,236<br />
1980 985 975 4 c 2 90 58 117 2,23 1<br />
1981 896 850 1 c 2 72 51 100 1,972<br />
1982 1,102 961 1 c 1 44 62 76 2,248<br />
1983 1,314 1,<strong>20</strong>7 c c 1 47 59 82 2,710<br />
1984 2,03 1 1,224 G c 5 55 78 138 3,538<br />
1985 2,408 1,280 11 c 5 48 97 134 3,983<br />
Domestic and import sales<br />
1986 3,380 1,214 12 c 6 45 101 113 4,870<br />
1987 3,435 1,175 14 2 8 44 103 131 4,912<br />
1988 3,467 1,333 14 21 8 54 103 148 5,149<br />
1989 3,313 1,297 19 27 7 39 93 145 4,942<br />
1990 3,451 1,097 21 27 5 38 85 121 4,846<br />
1991 3,246 876 21 24 3 22 73 99 4,365<br />
1992 3,608 1,021 26 26 4 28 73 119 4,903<br />
1993 4,119 1,232 27 33 4 27 81 158 5,681<br />
1994 4,527 1,506 35 44 4 <strong>20</strong> 98 186 6,421<br />
1995 4,422 1,631 40 53 4 23 106 <strong>20</strong>1 6,481<br />
1996 4,829 1,690 52 59 7 19 104 170 6,930<br />
1997 5,085 1,712 53 57 9 18 114 178 7,226<br />
1998 5,263 2,036 102 43 25 32 115 <strong>20</strong>9 7,825<br />
Average annualpercentage change<br />
1970-85 5.7% 7.9% 4.1% -15.1% -6.6% 6.8% 2.8% 5.5%<br />
1986-98 3.8% 4.4% 19.5% 12.6% -2.8% 1.1% 5.3% 4.0%<br />
Source:<br />
1970-97: American Automobile Manufacturers Association, Motor Vehicle Facts arzd Figures 1998, Detroit, MI, 1998, p. 24, and annual. 1998: Ward’s Communications, Ward’s<br />
Automotive Yearbook, Southfield, MI, p. 260. (Additional resources: www.wardsauto.com)<br />
a Sales include domestic-sponsored imports.<br />
b Data <strong>for</strong> 1970 is based on new truck registrations.<br />
c Less than 500 trucks.
8-4<br />
Vehicle Inventory and Use Survey<br />
The Vehicle Inventory and Use Survey (VIUS), which was <strong>for</strong>merly the Truck Inventory and Use<br />
Survey, provides data on the physical and operational characteristics of the Nation’s truck population. It is<br />
based on a probability sample of private and commercial trucks registered (or licensed) in each state. The<br />
name of the 1997 survey was changed to the Vehicle Inventory and Use Survey due to future possibilities<br />
of including additional vehicle types. Data <strong>for</strong> 1997 have been released in a report, as well as on CD-ROM.<br />
Copies may be obtained by contacting the U.S. Bureau of the Census, Transportation Characteristics Surveys<br />
Branch (301) 457-2797. Internet site www. census.gov/svsd/www/tiusview.html is the location of the<br />
VIUS on-line.<br />
Since 1987 the survey has includedminivans, vans, station wagons on truck chassis, and sport utility<br />
vehicles in addition to the bigger trucks. The 1977 and 1982 surveys did not include those vehicle types.<br />
The estimated number of trucks that were within the scope of the 1997 VIUS and registered in the U.S. as<br />
of July 1, 1997, was 72.8 million. These trucks were estimated to have been driven a total of 1,044 billion<br />
miles during 1997, an increase of 32.8% from 1992. The average annual miles traveled per truck was<br />
estimated at 14,300 miles.<br />
In the 1997 VIUS, there are several ways to classify a truck by weight. The survey respondent was<br />
asked the average weight of the vehicle or vehicle-trailer combination when carrying a typical payload; the<br />
empty weight (truck minus cargo) of the vehicle as it was usually operated; and the maximum gross weight<br />
at which the vehicle or vehicle-trailer combination was operated. The Census Bureau also collected<br />
in<strong>for</strong>mation on the Gross Vehicle Weight Class of the vehicles (decoded from the vehicle identification<br />
number) and the registered weight of the vehicles from the State registration files. Some of these weights<br />
are only provided in categories, while others are exact weights. Since all these weights could be quite<br />
different <strong>for</strong> a single truck, the tabulations by weight can be quite confusing. For illustration of this, see<br />
Tables 8.3 and 8.4. The first set of data are based on the Gross Vehicle Weight Class of the vehicle when<br />
it was manufactured; the data on Table 8.5 are based on the average weight as reported by the respondent.<br />
There is a 24% difference in the number of Class 1 trucl~s (6,000 lbs. and less). In most tables, the Gross<br />
Vehicle Weight Class was used. However, on the tables comparing different survey estimates, average<br />
weight must be used, as the older surveys did not include data on the Gross Vehicle Weight rating.<br />
<strong>TRANSPORTATION</strong><strong>ENERGY</strong><strong>DATA</strong>BOOIC <strong>EDITION</strong>~O-<strong>20</strong>00
I<br />
These tables illustrate the difference between two weight variables in the Vehicle Inventory and Use Survey. The<br />
manufacturer’s gross vehicle weight class is likely to be more accurate than the average weightprovided by the<br />
respondent.<br />
Table 8.3<br />
Truck Statistics by Gross Vehicle Weight Class, 1997<br />
Manufacturer’s Average Average Gallons of<br />
gross vehicle weight Number of Percentage of annual miles fuel fuel used Percentage<br />
class trucks trucks per truck economy (millions) of fuel use<br />
6,000 lbs and less 45,240,632<br />
6,001 - 10,000 lbs 22,373,167<br />
10,001 - 14,000 lbs 5 10,476<br />
14,001 - 16,000 lbs 194,95 1<br />
16,001 - 19,500 lbs 178,111<br />
19,501 - 26,000 lbs l&34,246<br />
26,001 - 33,000 lbs <strong>20</strong>7,386<br />
33,001 lbs and up 2,211,283<br />
Total 72,800,252<br />
62.14% 13,328<br />
30.73% 12,952<br />
0.70% 15,650<br />
0.27% 16,390<br />
0.24% 6,016<br />
2.59% 13,637<br />
0.28% 35,588<br />
3.04% 48,095<br />
100.00% 14,347<br />
17.82 35,184 44.34%<br />
14.11 21,226 26.75%<br />
10.83 771 0.97%<br />
10.11 3<strong>20</strong> 0.40%<br />
8.69 117 0.15%<br />
8.21 3,<strong>20</strong>2 4.04%<br />
7.07 1,096 1.38%<br />
6.69 ‘17,427 21.96%<br />
16.02 79,344 100.00%<br />
Source:<br />
U.S. Department of Commerce, Bureau of the Census, 1997 Vehicle Inventory and Use Survey, Microdata File on CD,<br />
<strong>20</strong>00. (Additional resources: www.census.gov/svsdlwww.tiusview.html)<br />
Average weight as<br />
reported by respondent<br />
Table 8.4<br />
Percentage of Trucks by Size Class, 1977,1982,1987,1992, and 1997<br />
(percentage)<br />
1977 1982 1987 1992 1997<br />
TIUS TIUS TIUS TIUS VIUS<br />
6,000 lbs and less 66.0% 77.8% 85.4% 85.4% 86.3%<br />
6,001-10,000 lbs<br />
lO,OOO-14,000 lbs<br />
14,001-16,000 lbs<br />
16,001-19,500 lbs<br />
19,501-26,000 lbs<br />
26,001-33,000 lbs<br />
33,001 lbs and over<br />
17.9% 11.6% 6.5% 7.9% 7.3%<br />
3.1% 1.6% 1.2% 1.2% 1.1%<br />
1.3% 0.9% 0.5% 0.5% 0.4%<br />
2.1% 1.0% 0.6% 0.5% 0.4%<br />
3.4% 2.4% 1.7% 1.2% 1 .O%<br />
1.5% 1.0% 0.8% 0.7% 0.6%<br />
4.6% 3.8% 3.3% 2.8% 2.9%<br />
Source:<br />
Estimates are based on data provided on the following public use files: U.S. Department of Commerce, Bureau of the<br />
Census, Census of Transportation, Washington, DC, 1977 Truck Inventory and Use Survey, 1980; 1982 Truck<br />
Inventory and UseSurvey, 1985; 1987 Trucklnventoryand UseSurvey, 1990; 1992 Trucklnventoryand UseSurvey,<br />
1995; 1997 Vehicle Inventory and Use Survey, <strong>20</strong>00.<br />
(Additional resources: www.census.gov/svsdJwww/tiusview.html)<br />
<strong>TRANSPORTATION</strong> <strong>ENERGY</strong> <strong>DATA</strong> <strong>BOOK</strong>: <strong>EDITION</strong> <strong>20</strong>-<strong>20</strong>00<br />
8-5
8-G<br />
I<br />
Though diesel engines are generally more ejicient than gasoline engines, variations in patterns of use and weight<br />
distributions within a weight category can cause the,fuel economies to be more similar. Data in the Total row give<br />
a good indication that the gasoline trucks are mainly lighter vehicles and diesels are used in heavier applications.<br />
Table 8.5<br />
Truck Fuel Economy by Fuel Type and Size Class, 1997<br />
(miles per gallon)<br />
Average weight as Gasoline<br />
reported by the respondent trucks<br />
6,000 lbs and less 16.8<br />
6,001-10,000 lbs 13.7<br />
lO,OOl-14,000 lbs 10.4<br />
14,001-16,000 lbs 8.9<br />
lG,OOl-19,500 lbs 8.6<br />
19,501-26,000 lbs 7.5<br />
26,001-33,000 lbs 7.0<br />
33,001 lbs and up 6.5<br />
Diesel<br />
trucks<br />
16.6<br />
13.7<br />
11.8<br />
10.3<br />
Weighted average 16.4 10.3<br />
Source:<br />
U.S. Department of Commerce, Bureau of the Census, 1997 Vehicle Inventory and Use Survey,<br />
Microdata File on CD, <strong>20</strong>00. (Additional resources: www.census.gov/svsd/www/tiusview.html)<br />
Average weight as<br />
reported by respondent<br />
Table 8.6<br />
Truck Fuel Economy by Size Class, 1977,1982,1987,1992, and 1997<br />
(miles per gallon)<br />
1977 1982 1987 1992 1997<br />
TIUS TIUS TIUS TIUS VIUS<br />
6,000 lbs and less 13.2 14.2 15.0 16.1 16.8<br />
6,001-10,000 lbs 11.5 11.1 10.9 12.2 13.6<br />
lO,OOO-14,000 lbs 9.4 8.1 8.1 9.2 10.8<br />
14,001-16,000 lbs 6.9 7.5 7.5 8.5 9.5<br />
lG,OOl-19,500 lbs 7.6 7.2 7.1 8.1 8.9<br />
19,501-26,000 lbs 6.1 6.9 6.4 7.2 7.9<br />
26,001-33,000 lbs 5.3 6.2 6.1 6.8 7.4<br />
33,001 lbs and over 4.8 5.2 5.3 5.5 6.0<br />
Source:<br />
Estimates are based on data provided on the following public use files: U.S. Department of Commerce, Bureau of<br />
the Census, Census of Transportation, Washington, DC, 1977 Truck Inventory and Use Survey, 1980; (982<br />
Truck Inventory and Use Survey, 1985; 1987 Truck Inventory and Use Survey, 1990; 1992 Truck Inventory<br />
and Use Survey, 1995; 1997 Vehicle Inventory and Use Survey, <strong>20</strong>00.<br />
(Additional resources: www.census.gov/svsdJwww/tiusview.html)<br />
<strong>TRANSPORTATION</strong> <strong>ENERGY</strong> <strong>DATA</strong> <strong>BOOK</strong>: <strong>EDITION</strong> <strong>20</strong>-<strong>20</strong>00<br />
9.3<br />
8.3<br />
7.5<br />
5.9
Trucks<br />
Trucks (%)<br />
Miles per truck<br />
Total miles (%)<br />
Fuel use (%)<br />
Fuel economy (mpg)<br />
Under 50 miles<br />
51-100 miles<br />
10 l-<strong>20</strong>0 miles<br />
<strong>20</strong>1-500 miles<br />
Over 500 miles<br />
Off-road<br />
Total<br />
Central company-owned 14.55%<br />
Single off-site contract 4.27%<br />
Pubic station 77.71%<br />
Other 3.47%<br />
Total 100%<br />
Table 8.7<br />
Truck Statistics by Size, 1997<br />
Manufacturer’s gross vehicle weight class<br />
Medium<br />
Light (lO,OOl- Heavy<br />
(< 10,000 lbs) 26,000 lbs) (> 26,000 lbs)<br />
G&099,912 2,164,791 2,535,549<br />
93.54% 2.97% 3.48%<br />
13,165 13,837 46,5 13<br />
85.84% 2.87% 11.29%<br />
71.61% 3.99% 24.40%<br />
16.55 9.37 6.<strong>20</strong><br />
Range of operation<br />
75.15% 62.50% 39.55%<br />
12.84% 16.60% 16.73%<br />
3.85% 5.60% 10.82%<br />
2.05% 5.74% 12.18%<br />
2.28% <strong>20</strong>.04% 16.00%<br />
3.83% 7.52% 4.74%<br />
100% 100% 100%<br />
Primary refueling facility<br />
24.68% 39.13%<br />
6.11% 6.89%<br />
64.62% 49.83%<br />
4.59% 4.16%<br />
100% 100%<br />
Total<br />
72,800,252<br />
100%<br />
14,347<br />
100%<br />
100%<br />
16.02<br />
73.53%<br />
13.09%<br />
4.15%<br />
2.52%<br />
2.75%<br />
3.97%<br />
100%<br />
29.<strong>20</strong>%<br />
6.08%<br />
60.56%<br />
4.16%<br />
100%<br />
Source:<br />
U.S. Department of Commerce, Bureau of the Census, 1997 Vehicle Inventory and Use Survey, Microdata<br />
File on CD, <strong>20</strong>00. (Additional resources: www.census.gov/svsdlwww/tiusview.html)<br />
<strong>TRANSPORTATION</strong> <strong>ENERGY</strong> <strong>DATA</strong> <strong>BOOK</strong>: <strong>EDITION</strong> <strong>20</strong>-<strong>20</strong>00<br />
8-7
8-8<br />
Rank<br />
1<br />
2<br />
3<br />
4<br />
5<br />
6<br />
7<br />
8<br />
9<br />
10<br />
11<br />
12<br />
13<br />
14<br />
15<br />
Table 8.8<br />
Percentage of Trucks by Size Ranked by Major Use, 1997<br />
Light Medium Heavy<br />
(< 10,000 lbs) (10,001 - 26,000 lbs) (> 26,000 lbs)<br />
Personal Agriculture For Hire<br />
74.56% 19.54% 31.48%<br />
Construction Construction Construction<br />
7.56% <strong>20</strong>.19% 17.56%<br />
Services” Servicesa Agriculture<br />
5.57% 11.64% 14.01%<br />
Agriculture Retail Wholesale<br />
3.82% 9.28% 7.81%<br />
Retail Utilities Retail<br />
2.79% 4.40% 5.67%<br />
Not in Use Wholesale Personal<br />
1.61% 7.31% 0.31%<br />
Wholesale For Hire Services”<br />
1.33% 5.47% 7.39%<br />
Manufacturing Personal Manufacturing<br />
0.74% 7.00% 5.61%<br />
Utilities Manufacturing Not in Use<br />
0.75% 3.72% 1.11%<br />
Daily Rental Not in Use Utilities<br />
0.53% 3.21% 2.18%<br />
Forestry Daily Rental Forestry<br />
0.26% 4.21% 2.56%<br />
Mining Forestry Daily Rental<br />
0.25% 1.64% 2.11%<br />
For Hire Mining Mining<br />
0.21% 1.14% 2.18%<br />
One-Way Rental One-Way Rental One-Way Rental<br />
0.01% 1.24% 0.01%<br />
Other Other Other<br />
0.00% 0.00% 0.00%<br />
Source:<br />
U.S. Department of Commerce, Bureau of the Census, 1997 Vehicle Inventory and Use Survey, Micro data<br />
File on CD, <strong>20</strong>00. (Additional resources: www.census.gov/svsd/www/tiusview.l~tml)<br />
B Business and personal services.<br />
<strong>TRANSPORTATION</strong> ENERCY<strong>DATA</strong><strong>BOOK</strong>: <strong>EDITION</strong>~O-<strong>20</strong>00
I Nearly<br />
1<br />
GO% of all truckfleets use public fueling stations as their primary refueling facility. As expected, larger<br />
fleets use central company-ownedfacilities more than smaller.fleets. Mid-sizeJleets (lo-500 vehicles) use ojfsite<br />
contractfacilities more than the smaller or largerfleets.<br />
2-5<br />
6-9<br />
1 O-24<br />
25-99<br />
Truck<br />
fleet size<br />
100499<br />
5 0 0 - 9 9 9<br />
1 ,ooo-4,999<br />
5,000-9,999<br />
10,000 8.5 up<br />
Table 8.9<br />
Percentage of Trucks by Fleet Size and Primary Refueling Facility, 1997<br />
Central<br />
company-owned<br />
fueling facility<br />
5.94%<br />
13.80%<br />
25.77%<br />
37.08%<br />
48.48%<br />
Primary refueling facility<br />
Single contract fueling<br />
facility Public fueling<br />
located off-site stations<br />
2.70% 87.26%<br />
4.56% 76.12%<br />
7.32% 62.02%<br />
10.43% 49.70%<br />
9.65% 39.29%<br />
48.76% 10.62% 38.40% 2.22%<br />
46.39% 7.46% 44.38% 1.77%<br />
45.24% 4.93% 45.94% 3.89%<br />
35.77% 6.01% 53.36% 4.87%<br />
71.72% 2.56%’ 19.27% 6.45%<br />
Other Total<br />
4.09% 100%<br />
5.52% 100%<br />
4.88% 100%<br />
2.79% 100%<br />
2.59% 100%<br />
Total 30.08% 6.39% 59.37% 4.16% 100%<br />
Source:<br />
U.S. Department of Commerce, Bureau of the Census, 1997 Vehicle Inventory and Use Survey, Microdata<br />
File on CD, <strong>20</strong>00. (Additional resources: www.census.govlsvsdlwwwltiusview.html)<br />
<strong>TRANSPORTATION</strong> <strong>ENERGY</strong> <strong>DATA</strong> <strong>BOOK</strong>: <strong>EDITION</strong> <strong>20</strong>-<strong>20</strong>00<br />
00%<br />
00%<br />
00%<br />
00%<br />
00%<br />
8-9
Major Use<br />
Agricultural services<br />
Forestry or lumbering activities<br />
Construction work<br />
Contractor activities or special trades<br />
Manufacturing, refining or processing activities<br />
Wholesale trade<br />
Retail trade<br />
Business and personal services<br />
Utilities<br />
Mining or quarrying activities<br />
Daily rental<br />
Not in use<br />
For-hire transportation<br />
One-way rental<br />
Personal transportation<br />
Total<br />
Table 8.10<br />
Percentage of Trucks by Major Use and Primary Refueling Facility, 1997<br />
Central<br />
company-owned<br />
fueling facilitv<br />
32.09%<br />
22.49%<br />
33.40%<br />
12.09%<br />
35.47%<br />
32.56%<br />
28.21%<br />
26.40%<br />
40.56%<br />
43.82%<br />
39.42%<br />
10.56%<br />
32.87%<br />
48.47%<br />
2.02%<br />
29.<strong>20</strong>%<br />
Primary refueling facilitv<br />
Single contract<br />
fueling facility Public fueling<br />
located off-site stations<br />
2.99% 53.92%<br />
4.50% 70.33%<br />
5.39% 58.79%<br />
4.38% 81.18%<br />
9.48% 53.69%<br />
11.90% 53.62%<br />
10.25% 59.41%<br />
6.33% 65.42%<br />
5.09% 52.25%<br />
9.32% 44.44%<br />
13.29% 45.12%<br />
2.37% 53.12%<br />
4.90% 59.53%<br />
3.10% 48.43%<br />
0.56% 94.46%<br />
6.08% 60.56%<br />
Source:<br />
U.S. Department of Commerce, Bureau of the Census, 1997 Vehicle Inventory and Use Survey, Microdata File on CD, <strong>20</strong>00.<br />
(Additional resources: www.census.govlsvsdiusview.html)<br />
Other Total<br />
11.00% 100%<br />
2.68% 100%<br />
2.42% 100%<br />
2.36% 100%<br />
1.36% 100%<br />
1.92% 100%<br />
2.12% 100%<br />
1.85% 100%<br />
2.09% 100%<br />
2.42% 100%<br />
2.17% 100%<br />
33.94% 100%<br />
2.70% 100%<br />
0.00% 100%<br />
2.96% 100%<br />
4.16% 100%
Commodity Flow Survey<br />
The Commodity Flow Survey (CFS) is designed to provide data on the flow of goods and<br />
materials by mode of transport. The 1993 and 1997 CFS are a continuation of statistics collected<br />
in the Commodity Transportation Survey from 1963 through 1977, and includes major<br />
improvements in methodology, sample size, and scope. In 1997, a sample of 100,000 domestic<br />
establishments randomly selected from a universe of about 800,000 establishments engaged in<br />
mining, manufacturing, wholesale, auxiliary establishments (warehouses) ofmulti-establishment<br />
companies, and some selected activities in retail and service was used. Each selected<br />
establishmentreported a sample of approximately 25 outbound shipments <strong>for</strong> a one-week period<br />
in each of the four calendar quarters of 1997. This produced a total sample of over 5 million<br />
shipments. For each sampled shipment, zip codes of origin and destination, 5-digit Standard<br />
Classification of Transported Goods (SCTG) code, weight, value, and modes of transport, were<br />
provided. Establishments were also asked to indicate whether the shipment was containerized,<br />
a hazardous material, or an export.<br />
The 1993 and 1997 CFS differ from previous surveys in their greatly expanded coverage of<br />
intermodalism. Earlier surveys reported only the principal mode. The 1993 and 1997 surveys<br />
report all modes used <strong>for</strong> the shipment (<strong>for</strong>-hire truck, private truck, rail, inland water, deep sea<br />
water, pipeline, air, parcel delivery or U.S. Postal Service, other mode, unknown). Route<br />
distance <strong>for</strong> each mode <strong>for</strong> each shipment as imputed from a mode-distance table developed by<br />
Oak Ridge National Laboratory. Distance, in turn, was used to compute ton-mileage by mode<br />
of transport.<br />
For more in<strong>for</strong>mation about the CFS, contact the Commodity Flow Survey Branch,<br />
Department of Commerce, Bureau of the Census, Services Division at (301) 457-2108, or visit<br />
the following Internet site: www.bts.gov/cfs .<br />
<strong>TRANSPORTATION</strong><strong>ENERGY</strong><strong>DATA</strong>BOOIC: <strong>EDITION</strong>~O~~OOO<br />
8-l 1
Mode of Transportation<br />
All modes<br />
Single modes<br />
Truck<br />
For-hire truck<br />
Private truck<br />
Rail<br />
Water<br />
Shallow draft<br />
Great Lakes<br />
Deep draft<br />
Air (includes truck and air)<br />
Pipelineb<br />
Multiple modes<br />
Parcel, U.S. Postal Service<br />
or courier<br />
Truck and rail<br />
Truck and water<br />
Rail and water<br />
Other multiple modes<br />
Table 8.11<br />
Growth of Freight Activity in the United States: Comparison of the 1997 and 1993 Commodity Flow Surveys<br />
(Detail may not add to total because of rounding)<br />
Value Tons Ton-miles<br />
Average miles per<br />
shipment<br />
1997<br />
(billion<br />
1997<br />
1993<br />
(billion<br />
1997<br />
Percent<br />
change<br />
1997 1993<br />
(millions) (millions)<br />
Percent<br />
change<br />
1997<br />
(billions)<br />
1993<br />
(billions)<br />
Percent<br />
change<br />
1997 1993<br />
Percent<br />
change<br />
dollars) dollars)<br />
6,944.0<br />
5:719.6<br />
4981.5<br />
2901.3<br />
<strong>20</strong>36.5<br />
319.6<br />
75.8<br />
53.9<br />
1.5<br />
<strong>20</strong>.4<br />
229.1<br />
113.5<br />
945.9<br />
6,360.g 9.2%<br />
5,376.3 6.4%<br />
4791.0 4.0%<br />
2856.1 1.6%<br />
1910.4 6.6%<br />
269.2 18.7%<br />
67.1 13.1%<br />
44.3 21.7%<br />
c c<br />
21.5 -4.9%<br />
151.3 51.4%<br />
97.8 16.1%<br />
7<strong>20</strong>.9 31.2%<br />
11,089.7 9,688.5<br />
10,436.5 8,922.3<br />
7700.7 6385.9<br />
3402.6 2808.3<br />
4137.3 3543.5<br />
1,549x 1,544.1<br />
563.4 505.4<br />
414.8 362.5<br />
38.4 33.0<br />
110.2 109.9<br />
4.5 3.1<br />
618.2 483.6<br />
216.7 225.7<br />
14.5%<br />
17.0%<br />
<strong>20</strong>.6%<br />
21.2%<br />
16.8%<br />
0.4%<br />
11.5%<br />
14.4%<br />
c<br />
0.2%<br />
42.6%<br />
27.8%<br />
-4.0%<br />
855.9 612.8 39.7% 23.7 18.9 25.4% 18.0<br />
75.7 90.4 -16.3% 54.2 40.6 33.5% 55.6<br />
8.2 10.2 -19.4% 33.2 68.0 -51.2% 34.8<br />
1.8 4.0 -55.2% 79.3 79.2 0.1% 77.6<br />
4.3 3.5 22.0% 26.2 18.9 38.6% 18.6<br />
2,661.4 2,4<strong>20</strong>.g 9.9% 472<br />
2,383.5 2,136.g 11.5% 184<br />
1023.5 869.5 17.7% 144<br />
741.1 629.0 17.8% 485<br />
268.6 235.9 13.9% 53<br />
1,022.5 942.6 8.5% 769<br />
261.7 272.0 -3.8% 482<br />
189.3 164.4 15.2% 177<br />
13.4 12.4 8.2% <strong>20</strong>4<br />
59.0 95.2 -38.0% 1,024<br />
6.2 4.0 55.5% 1,380<br />
c c c c<br />
<strong>20</strong>4.5 191.5 6.8% 813<br />
13.2 36.8% 813<br />
37.7 47.5% 1,347<br />
40.6 -14.4% 1,265<br />
72.2 lo.>% 1,09?<br />
424 11.4%<br />
197 -6.4%<br />
144 -0.1%<br />
472 2.9%<br />
52 2.1%<br />
766 3.0%<br />
c c<br />
c c<br />
534 -61.8%<br />
1,861 -45.0%<br />
1,415 -2.5%<br />
c c<br />
736 10.5%<br />
734 10.7%<br />
1,403 -3.9%<br />
1,417 -10.7%<br />
627 74.J%<br />
1,082<br />
Other and unknown modes 278.6 263.6 5.7% 436.5 540.5 -19.2% 73.4 92.6 -<strong>20</strong>.7% 122 229 -46.9%<br />
Source:<br />
U.S. Department of Transportation, Bureau of Transportation Statistics, Freight USA, Washington, DC, <strong>20</strong>00. (Additional resources: www.bts.gov/cfs)<br />
’ “Truck” as a single mode includes shipments which went by private truck only, <strong>for</strong>-hire truck only, or a combination of private truck and <strong>for</strong>-hire truck.<br />
b CFS data <strong>for</strong> pipeline lack most shipments of crude oil.<br />
’ Denotes data do not meet publication standards because of high sampling variability or other reasons. Some unpublished estimates can be derived from other data published in this<br />
table. However, figures obtained in this manner are subject to these same limitations.<br />
- - -
Some,freight activities, such as pipeline shipments, were not within the scope qf the Commodity Flow Survey (CFS). Data <strong>for</strong> the<br />
out-of-scope freight activities are estimated here and added to the CFS data to give a more complete picture of total freight activity.<br />
Table 8.12<br />
Commodity Flow Survey Freight Activity, 1997<br />
Value Value per Value per<br />
(billion Tons Ton miles Value Tons Ton miles ton pound Ton miles<br />
Mode dollars) (millions) (billions) (percent) (percent) (percent) (dollars) (dollars) per ton a<br />
CFS 1997:<br />
Parcel, postal, courier service $856 24 18 10.0 0.2 0.5 35,667 $17.83 750<br />
Truck’(<strong>for</strong>-hire, private, both) $4,982 7,70 1 1,024 58.2 52.0 26.6 647 $0.32 133<br />
Air (including truck and air) $229 4 6 2.7 0.0 0.2 57,250 $28.63 1,500<br />
Rail $3<strong>20</strong> 1,550 1,023 3.7 10.5 26.6 <strong>20</strong>6 $0.10 660<br />
Water $76 563 262 0.9 3.8 6.8 135 $0.07 465<br />
Pipeline ’ $113 618 244 1.3 4.2 6.3 183 $0.09 395<br />
Truck and rail $76 54 56 0.9 0.4 1.5 1,407 $0.70 1,037<br />
Other intermodal combinations’ $14 139 131 0.2 0.9 3.4 101 $0.05 942<br />
Other and unknown modes $279 437 73 3.3 3.0 1.9 638 $0.32 167<br />
CFS 1997 Subtotal $6,945 11,090 2,837 81.1 74.9 73.7 626 $0.31 256<br />
Estimates of Out-of-scope Components:<br />
Truck<br />
Farm based truck shipments $197<br />
Imports from Canada $100<br />
Imports from Mexico $57<br />
Pipeline<br />
Crude oil $81<br />
Petroleum products d $37<br />
Water e<br />
Imports $403<br />
Exports $222<br />
Other $61<br />
Rail<br />
Imports from Canada and Mexico $40<br />
Non-commodity<br />
Air<br />
Imports $213<br />
Exports $211<br />
US Mail f<br />
Out-of-scope Estimates Subtotal $1,622<br />
1,050 39 2.3 7.1 1.0 188 $0.09 37<br />
67 32 1.2 0.5 0.8 1,493 $0.75 478<br />
18 14 0.7 0.1 0.4 3,167 $1.58 778<br />
740 377 0.9 5.0 9.8 109 $0.05 509<br />
90 35 0.4 0.6 0.9 411 $0.21 389<br />
765<br />
411<br />
481<br />
62<br />
10<br />
3<br />
3<br />
10<br />
3,710<br />
58<br />
48<br />
358<br />
43<br />
10<br />
4.7 5.2<br />
2.6 2.8<br />
0.7 3.3<br />
0.5 0.4<br />
0.1<br />
2.5<br />
2.5<br />
1,014 18.9<br />
1.5<br />
1.2<br />
9.3<br />
1.1<br />
0.3<br />
0.0<br />
0.0<br />
0.1<br />
25.1 26.3<br />
527 $0.26<br />
540 $0.27<br />
127 $0.06<br />
645 $0.32<br />
71,000<br />
70,333<br />
CFS + Out-of-scope Estimates: $8,567 14,800 3,851 100.0 100.0 100.0 580<br />
Intermodal Total (excluding air)” $946 217 <strong>20</strong>5 11.0 1.5 5.3 4,359<br />
lntermodal Total (including air) $1,175 221 211 13.7 1.5 5.5 5,317<br />
Source:<br />
U.S. Department of Transportation, Bureau of Transportation Statistics, Freight USA, Washington, DC, <strong>20</strong>00.<br />
(Additional resources: www.bts.gov/cfs)<br />
437<br />
$35.50<br />
$35.17<br />
76<br />
117<br />
744<br />
694<br />
1,000<br />
$0.22 273<br />
$0.29 272<br />
$2.18 945<br />
$2.66 1,047<br />
” Tonnage <strong>for</strong> CFS pipeline and U.S. Mail was not included in the total tonnage <strong>for</strong> the calculation of ton-miles/ton.<br />
’ The pipeline ton-miles shown here are not a CFS estimate, but were calculated using data from the Assn. of Oil Pipe Lines.<br />
’ This includes truck and water, rail and water, and other combinations.<br />
d These numbers are the differences between the FERC totals and CFS estimates.<br />
e Ton-miles <strong>for</strong> water imports & exports include only the portion of ton-miles within the U.S. Waterways to or from the U.S. port.<br />
f U.S. Mail tonnage includes all mail except class B standard mail, and international parcel post <strong>for</strong> surface and air mail.<br />
% Intermodal total is a combination of parcel, postal, courier; truck and rail; truclc and water; rail and water; and other intermodal. It<br />
excludes truck and air which is added to air transportation.<br />
<strong>TRANSPORTATION</strong><strong>ENERGY</strong><strong>DATA</strong><strong>BOOK</strong>: <strong>EDITION</strong>~O-<strong>20</strong>00<br />
8-13
8-14<br />
Table 8.13<br />
Summary Statistics on Buses by Type, 1970-98<br />
Yeai Transit motor bus” Intercity bus School bus<br />
1970 49,700<br />
1975 50,811<br />
1980 59,411<br />
1985 64,258<br />
1990 58,714<br />
1995 67,107<br />
1996 71,678<br />
1997 72,770<br />
1998 74,641<br />
Number in operation<br />
22,000<br />
<strong>20</strong>,500<br />
21,400<br />
<strong>20</strong>,<strong>20</strong>0<br />
<strong>20</strong>,680<br />
<strong>20</strong>,138<br />
<strong>20</strong>,649<br />
<strong>20</strong>,910<br />
19,173<br />
Vehicle-miles (millions)<br />
288,700<br />
368,300<br />
418,255<br />
480,400<br />
508,261<br />
560,447<br />
569,395<br />
568,113<br />
582,470<br />
1970 1,409 1,<strong>20</strong>9 2,100<br />
1975 1,526 1,126 2,500<br />
1980 1,677 1,162 2,900<br />
1985 1,863 933 3,448<br />
1990 2,123 991 3,800<br />
1995 2,184 1,194 5,000<br />
1996 2,221 1,2<strong>20</strong> 5,000<br />
1997 2,245 1,319 4,400<br />
1998<br />
1970<br />
1975<br />
1980<br />
1985<br />
1990<br />
1995<br />
1996<br />
1997<br />
1998<br />
2,291 1,366 4,300<br />
Passenger-miles (millions)<br />
18,210 25,300 b<br />
18,300 25,400 b<br />
21,790 27,400 b<br />
21,161 23,800 b<br />
<strong>20</strong>,981 23,000 74,<strong>20</strong>0<br />
18,818 28,100 95,000<br />
19,096 28,800 99,000<br />
19,604 30,600 82,900<br />
<strong>20</strong>,602 31,700 b<br />
Energy use (trillion Btu)<br />
1970 44.8 26.6 37.5<br />
1975 51.5 24.8 42.6<br />
1980 61.3 29.3 47.5<br />
1985 72.4 31.5 57.0<br />
1990 78.9 21.7 64.8”<br />
1995 87.5 c 22.6 83.9<br />
1996 89.3 22.6 84.7<br />
1997 93.0 22.2 83.9<br />
1998 87.3 22.6 84.7<br />
Source:<br />
See Appendix A <strong>for</strong> Table 8.13.<br />
(Additional resources: www.apta.com, www.fhwa.dot.gov, www.schoolbusfleet.com)<br />
a Data <strong>for</strong> transit buses after 1983 are not comparable with prior data. Data <strong>for</strong> prior years were provided<br />
voluntarily and statistically expanded; in 1984 reporting became mandatory.<br />
’ Data are not available.<br />
’ Beginning in 1992, data became available on alternative fuel use by transit buses.<br />
d Assumptions about fuel type changed in this year. See Appendix A <strong>for</strong> details.<br />
TRANSPOKTATION<strong>ENERGY</strong><strong>DATA</strong>BOOIC <strong>EDITION</strong>~O-<strong>20</strong>00
Chapter 9<br />
Alternative Fuel Vehicles and Characteristics<br />
Source<br />
Summary Statistics from Tables in this Chapter<br />
Table 9.1 Light alternative fuel vehicles, 1998 313,258<br />
LPG 212,000<br />
CNG 63,739<br />
LNG 118<br />
M85 19,627<br />
E85 12,778<br />
Electric 4,996<br />
Table 9.2’ Heavy alternative fuel vehicles, 1998 70,589<br />
LPG 54,000<br />
CNG 15,043<br />
LNG 1,054<br />
M85/MlOO 221<br />
E85/E95 24<br />
Electric 247<br />
Table 9.5 Number of alternative fuel refuel sites, 1999 6,058<br />
LPG 4,153<br />
CNG 1,267<br />
LNG 490<br />
M85 51<br />
E85 49<br />
Electric 46<br />
Fuel type abbreviations are used throughout this chapter.<br />
LPG = liquijiedpetroleum gas<br />
CNG = compressed natural gas<br />
A4-8.5 = 85% methanol, 15% gasoline<br />
E-85 = 85% ethanol, 15% gasoline<br />
M-100 = 100% methanol<br />
E-95 = 95% ethanol, 5% gasoline<br />
LNG = 1iquiJied natural gas<br />
<strong>TRANSPORTATION</strong><strong>ENERGY</strong><strong>DATA</strong><strong>BOOK</strong>: <strong>EDITION</strong>~O-<strong>20</strong>00 Iii b<br />
9-l
9-2<br />
P b<br />
Alternative Fuels<br />
The U.S. Department of Energy (DOE) defines alternative fuels as fuels which are<br />
substantially non-petroleum and yield energy security and environmental benefits. DOE<br />
currently recognizes the following as alternative fuels:<br />
0 methanol and denatured ethanol as alcohol fuels (alcohol mixtures that contain<br />
no less than 70 % of the alcohol fuel),<br />
natural gas (compressed or liquefied),<br />
liquefied petroleum gas,<br />
hydrogen,<br />
coal-derived liquid fuels<br />
fuels derived from biological materials, and<br />
electricity (including solar energy).<br />
DOE has established the Alternative Fuels Data <strong>Center</strong> (AFDC) in support of its work<br />
aimed at fulfilling the Alternative Motor Fuels Act (AMFA) directives. The AFDC is<br />
operated and managed by the National Renewable Energy Laboratory (NREL) in<br />
Golden, Colorado.<br />
The purposes of the AFDC are:<br />
to gather and analyze in<strong>for</strong>mation on the fuel consumption, emissions, operation,<br />
and durability of alternative fuel vehicles, and<br />
to provide unbiased, accurate in<strong>for</strong>mation on alternative fuels and alternative fuel<br />
vehicles to government agencies, private industry, research institutions, and<br />
other interested organizations.<br />
The data are collected <strong>for</strong> three specific vehicle types: (1) light vehicles, including<br />
automobiles, light trucks, and mini-vans; (2) heavy vehicles such as tractor-trailers and<br />
garbage trucks; and (3) urban transit buses. Much of the AFDC data can be obtained<br />
through their web site: www.afdc.doe.gov. Several tables and graphs in this chapter<br />
contain statistics which were generated by the AFDC.<br />
DOE is sponsoring the National Alternative Fuels Hotline <strong>for</strong> Transportation<br />
Technologies in order to assist the general public and interested organizations in<br />
improving their understanding of alternative transportation fuels. The Hotline can be<br />
reached by dialing l-SOO-423-lDOE, or on the Internet at<br />
www.afdc.doe.gov/hotline.html.<br />
<strong>TRANSPORTATION</strong> <strong>ENERGY</strong> <strong>DATA</strong> <strong>BOOK</strong>: <strong>EDITION</strong> <strong>20</strong>-<strong>20</strong>00
I<br />
There are more LPG vehicles in use than any other alternative fuel vehicle. The population of E8.5 vehicles, however,<br />
has grown the most since 1992. For details on alternative fuel use by fuel type, see Table 2.10<br />
Table 9.1<br />
Estimates of Alternative Fuel Vehicles in Use, 1992-<strong>20</strong>00<br />
Average annual<br />
percentage<br />
change<br />
Fuel type 1992 1993 1994 1995 1996 1997 1998 1999” <strong>20</strong>00” 1992-<strong>20</strong>00<br />
LPG 22 1,000 269,000 264,000 259,000 263,000 263,000 266,000 268,000 270,000 2.5%<br />
CNG 23,191 32,714 41,227 50,218 60,144 68,571 78,782 89,633 101,991 <strong>20</strong>.3%<br />
LNG 90 299 484 603 663 813 1,172 1,422 1,682 44.2%<br />
M85 4,850 10,263 15,484 18,319 <strong>20</strong>,265 21,040 19,648 19,497 18,725 18.4%<br />
Ml00 404 414 415 386 172 172 <strong>20</strong>0 <strong>20</strong>0 <strong>20</strong>0 -8.4%<br />
E8gb 172 441 605 1,527 4,536 9,130 12,788 22,359 30,017 90.6%<br />
E95 38 27 33 136 361 347 14 14 14 -11.7%<br />
Electricity 1,607 1,690 2,224 2,860 3,280 4,453 5,243 6,417 7,590 21.4%<br />
Total 251,352 314,848 324,472 333,049 352,421 369,526 383,847 407,542 430,219 6.9%<br />
Source:<br />
U. S. Department of Energy, Energy In<strong>for</strong>mation Administration, Alternatives to Traditional Transportation<br />
Fuels,1998, Washington, DC, 1999, web site www.eia.doe.gov/cneaf/solar.renewables/alt_trans~fuel98/table1.html.<br />
(Additional resources: www.eia.doe.gov)<br />
“Based on plans or projections.<br />
bDoes not include flex-fuel vehicles.
:: LPG 167,000<br />
1 =! CNG 25,0<strong>20</strong><br />
2 !? LNG 10<br />
$cl M-85 6,633<br />
G5 M-100 0<br />
b E-85 793<br />
E E-95 0<br />
. .<br />
gT Electricity 2,45 1<br />
Table 9.2<br />
Estimates of Light Alternative Fuel Vehicles, 1996,1998, and <strong>20</strong>00<br />
Private State and local government Federal Government<br />
Fuel type 1996 1998 <strong>20</strong>00” 1996 1998 <strong>20</strong>00” 1996 1998 <strong>20</strong>00”<br />
170,000 170,000<br />
35,357 47,400<br />
75 75<br />
10,773 10,111<br />
0 0<br />
2,595 4,944<br />
0 0<br />
8,219 4,307<br />
43,000<br />
11,305<br />
45<br />
5,958<br />
0<br />
1,995<br />
0<br />
487<br />
42,000<br />
15,913<br />
43<br />
8,313<br />
0<br />
5,906<br />
0<br />
1,432<br />
42,000<br />
21,415<br />
43<br />
8,252<br />
0<br />
8,786<br />
0<br />
2,083<br />
193<br />
13,945<br />
72<br />
7,668<br />
0<br />
1,748<br />
0<br />
188<br />
159<br />
12,469<br />
0<br />
541<br />
0<br />
4,277<br />
0<br />
146<br />
839<br />
13,569<br />
0<br />
341<br />
0<br />
16,277<br />
Total <strong>20</strong>1,907 222,218 236,837 62,790 73,607 82,579 23,814 17,592 31,872<br />
Source:<br />
U. S. Department of Energy, Energy In<strong>for</strong>mation Administration, Alternatives to Traditional Transportation Fuels, 1998,<br />
Washington, DC, 1999, web site www.eia.doe.gov/cneaf/solar.renewables/ael9S~atfl-l3~99.html.<br />
(Additional resources: www.eia.doe.gov)<br />
Note: Light vehicles are less than or equal to 8,500 lbs. gross vehicle weight<br />
aBased on plans or projections.<br />
0<br />
846
Table 9.3<br />
Estimates of Heavy Alternative Fuel Vehicles, 1996, 1998, and <strong>20</strong>00<br />
Private State and local government Federal government<br />
Fuel type 1996 1998 <strong>20</strong>00” 1996 1998 <strong>20</strong>00” 1996 1998 <strong>20</strong>00”<br />
LPG 43,000 43,000 45,000 10,000 11,000 12,000<br />
CNG 5,485 7,972 10,396 4,389 6,378 8,318<br />
LNG 77 <strong>20</strong>4 280 453 836 1,144<br />
M85 0 0 0 6 19 19<br />
Ml00 0 0 0 172 <strong>20</strong>0 <strong>20</strong>0<br />
E85 0 0 0 0 0 0<br />
E95 4 0 0 357 14 14<br />
Electricity 32 43 43 113 189 296<br />
16 16<br />
693 893<br />
Total 48,598 51,219 55,719 15,490 18,636 21,991 17 734 1,076<br />
Source:<br />
U. S. Department of Energy, Energy In<strong>for</strong>mation Administration, Altbnatives to Traditional Transportation Fuels, 1998,<br />
Washington, DC, 1999, web site www.eia.doe.gov/cneaf/solar.renewables/alt~~ans~fue198/atfl-13~99.htl.<br />
(Additional resources: www.eia.doe.gov)<br />
Note: Heavy vehicles are above 8,500 lbs. gross vehicle weight.<br />
aBased on plans or projections.<br />
14<br />
2<br />
0<br />
10<br />
0<br />
15<br />
140<br />
2<br />
0<br />
10<br />
0<br />
15
9-6<br />
P b<br />
Table 9.4<br />
Alternative Fuel Vehicles Available by Manufacturer, Model Year <strong>20</strong>00<br />
Model Fuel Type Emission class<br />
Daimler Chrysler: l-SOO-999-FLEET<br />
EPIC (CA, NY-lease only) Electric-lead acid or NiMH<br />
Minivan E-85<br />
Ram Wagon CNG dedicated<br />
Ram Van CNG dedicated<br />
Ford: l-877-ALT-FUEL<br />
Ranger<br />
Ranger<br />
Contour (QVM)<br />
Crown Victoria<br />
Econoline<br />
Electric-lead acid<br />
E-85 flex-fuel<br />
CNG bi-fuel<br />
CNG dedicated<br />
CNG dedicated<br />
F-Series CNG dedicated or<br />
CNG/LPG bi-fuel<br />
Minivan<br />
Minivan<br />
Large van<br />
Large van<br />
Standard pickup<br />
Standard pickup<br />
Compact<br />
Large car<br />
Full-size van<br />
Taurus E-85 flex-fuel Large car<br />
Th!nk (select markets) Electric-NiCd Two-seater<br />
General Motors: l-SOO-25Electriq 313-556-7723 or l-88%GM-AFT-4U (CNG)<br />
EVl (CA and AZ only) Electric-lead acid or NiMH Two-seater<br />
Chevrolet S-l 0 Electric-lead acid or NiMH Small pickup<br />
Chevrolet S-10 E85 flex-fuel Small pickup<br />
Chevrolet Cavalier CNG bi-fuel Subcompact<br />
Honda: l-88%CCHonda<br />
ZEV<br />
N/A<br />
ULEVIILEVISULEV<br />
ULEV/ILEV/SULEV<br />
ZEV<br />
TLEV<br />
TLEV<br />
ULEV/ILEV<br />
ULEVIILEVISULEV<br />
Standard pickup LEVIULEVIILEVI<br />
SULEV<br />
TLEV<br />
ZEV<br />
ZEV<br />
ILEVIZEV<br />
Insight Hybrid EV-NiMH Two-seater LEVIULEV<br />
Civic GX (CA, NY fleets only) CNG dedicated Subcompact ILEVKJLEV<br />
Mazda: l-800-222-5500<br />
B3000 E85 flex fuel Standard pickup LEVITLEV<br />
Nissan: l-310-771-3422<br />
Altra EV (CA fleets only) Electric lithium-ion Mid-size wagon ZEV<br />
Solectria Corporation: l-508-658-2231<br />
Flash Electric-lead acid Small pickup truck ZEV<br />
Force Electric-lead acid, NiMH, NiCd Compact ZEV<br />
Toyota: l-800-331-4331 (Press 3 <strong>for</strong> Alternative Fuel In<strong>for</strong>mation) (Fleet sales only)<br />
RAV4-EV (select markets) Electric-lead acid, NiMH Sports utility vehicle ZEV<br />
Camry CNG dedicated Compact N/A<br />
Prius (Summer <strong>20</strong>00) Hybrid EV Compact SULEV<br />
Source:<br />
U.S. Department of Energy, National Alternative Fuels Data <strong>Center</strong>, web site, www.afdc.doe.gov/pdfs/myOO.pdf, November<br />
1999.<br />
(Additional resources: www.afdc.nrel.gov)<br />
Note:<br />
LEV=low emission vehicle. ILEV=inherently low emission vehicle. ULEV=ultra low emission vehicle. ZEV=zero emission<br />
vehicle. TLEV=transitional low emission vehicle.<br />
<strong>TRANSPORTATION</strong> <strong>ENERGY</strong> <strong>DATA</strong> <strong>BOOK</strong>: <strong>EDITION</strong><br />
LEV<br />
LEV
This list includes public and private refuel sites; them<strong>for</strong>e, not all of these sites are available to the public.<br />
State<br />
Alabama<br />
Alaska<br />
Arizona<br />
Arkansas<br />
Cali<strong>for</strong>nia<br />
Table 9.5<br />
Number of Alternative Refuel Sites by State and Fuel Type, 1999<br />
M85 CNG E85 LPG J,NG Electric<br />
sites sites sites sites sites sites<br />
0 16 0 151 2 0<br />
0 0 0 12 0 0<br />
1 28 0 81 3 46<br />
0 6 0 133 0 0<br />
36 <strong>20</strong>8 0 517 9 336<br />
Total<br />
169<br />
12<br />
1.59<br />
139<br />
1106<br />
Colorado 0 44 I 93 2 0 140<br />
Connecticut 0 27 0 48 0 1 76<br />
Delaware 0 6 0 2 0 0 8<br />
District of Columbia 0 4 0 0 0 1 5<br />
Florida 1 43 0 109 1 5 159<br />
Georgia 0 70 0 80 2 29 181<br />
Hawaii 0 0 0 24 0 3 28<br />
Idaho 0 7 I 29 0 1 38<br />
Illinois 0 24 5 65 0 2 96<br />
Indiana 0 38 1 46 3 1 89<br />
Iowa 0 5 5 69 0 1 80<br />
Kansas 0 6 1 123 1 0 131<br />
Kentucky 0 9 2 24 0 0 35<br />
Louisiana 0 15 0 25 0 0 40<br />
Maine 0 1 0 57 0 0 58<br />
Maryland 0 27 0 18 2 1 48<br />
Massachusetts 0 17 0 69 0 4 90<br />
Michigan 0 32 2 267 1 7 309<br />
Minnesota 0 15 11 82 1 0 109<br />
Mississippi 0 3 0 63 0 0 66<br />
MISSOURI 0 10 4 295 0 0 309<br />
Montana 0 11 1 56 1 0 69<br />
Nebraska 0 6 6 44 0 0 57<br />
Nevada 0 I8 0 56 0 0 74<br />
New Hampshire 0 2 0 68 0 1 71<br />
New Jersey 0 22 0 25 0 0 47<br />
New Mexico 0 14 0 243 1 0 258<br />
New York 12 57 0 98 0 6 173<br />
N. Carolina 0 9 0 94 0 7 110<br />
N. Dakota 0 4 2 14 0 0 <strong>20</strong><br />
Ohio 0 49 0 57 1 1 108<br />
Oklahoma 0 61 0 34 0 0 95<br />
Oregon 0 9 0 30 1 0 40<br />
Pennsylvania 0 59 0 100 1 1 161<br />
Rhode Island 0 4 0 9 0 0 13<br />
S. Carolina 0 4 0 74 0 1 79<br />
S. Dakota 0 ,4 6 29 0 0 39<br />
Tennessee 0 5 0 36 0 2 43<br />
Texas 0 73 0 231 8 2 314<br />
Utah 0 62 0 22 1 0 85<br />
Vermont 0 1 0 62 0 7 70<br />
Virginia 0 27 0 40 3 18 88<br />
Washington 1 28 0 88 1 6 124<br />
W. Virginia 0 39 0 14 0 0 53<br />
Wisconsin 0 <strong>20</strong> 1 112 0 0 133<br />
Wyoming 0 18 0 35 1 0 54<br />
Total 51 1,267 49 4,153 46 490 6,058<br />
Source:<br />
U.S. Department of Energy, Alternative Fuels Data <strong>Center</strong> web site, www.afdc.doe.gov/refuel/state-totshtml, January <strong>20</strong>00.<br />
<strong>TRANSPORTATION</strong> <strong>ENERGY</strong> <strong>DATA</strong> <strong>BOOK</strong>: <strong>EDITION</strong> <strong>20</strong>-<strong>20</strong>00 Iii b<br />
9-7
9-8<br />
P b<br />
I Clean<br />
Cities is a locally-basedgovernment/industrypartnership, coordinated by the U.S. Department ofEnergy<br />
to expand the use of alternatives to gasoline and dieselfuel. By combiriing the decision-making with voluntary<br />
action by partners, the “grass-roots” approach of Clean Cities departs from traditional “top-down” Federal<br />
programs. It establishes a plan, carried out at the local level, <strong>for</strong> creating a sustainable, nationwide alternative<br />
fuels market.<br />
1. Atlanta, GA - 918193<br />
2. Denver, CO - 9/13/93<br />
3. Philadelphia, PA - 9122193<br />
4. State of Delaware - 10/12/93<br />
5. Las Vegas, NV - 10/18/93<br />
6. Washington, DC - 10/21/93<br />
7. Boston, MA - 3/l Xl94<br />
8. Austin, TX - 4/l 8194<br />
9. Florida Gold Coast - 513194<br />
10. Chicago, IL - 5113194<br />
11. Land of Enchantment, NM - 6/l/94<br />
12. Wisconsin - SE Area - 6130194<br />
13. Colorado Springs, CO - 7/13/94<br />
14. Long Beach, CA - X/31/94<br />
15. Lancaster, CA - 9122194<br />
16. Salt Lake City, UT - 10/3/94<br />
17. White Plains, NY - 1014194<br />
18. Baltimore, MD - 10/7/94<br />
19. State of WV - 10/18/94<br />
<strong>20</strong>. Commonwealth CC Partnership, KY -<br />
1 O/l 8194<br />
21. Rogue Valley, OR - 1 l/10/94<br />
22. San Francisco, CA - 10/21/94<br />
23. Sacramento, CA - 10/21/94<br />
24. South Bay (San Jose), CA - 10/21/94<br />
25. East Bay, CA - 10/21/94<br />
26. San Joaquin Valley, CA - 10/21/94<br />
27. Western New York - 1 l/4/94<br />
28. Columbia-Willamette, OR - 1 l/10/94<br />
29. St. Louis, MO - 1 l/18/94<br />
30. Waterbury, CT - 1 l/21/94<br />
3 1. Connecticut Southwestern Area, - 1 l/21/94<br />
32. Norwich, CT - 1 l/22/94<br />
33. New London, CT - 11122194<br />
34. Peoria, IL - 1 l/22/94<br />
35. Kansas - SW Area - 3130195<br />
36. Central New York - 611.5195<br />
37. Dallas/Ft. Worth, TX - 7125195<br />
38. Honolulu, HI - S/29/95<br />
39. Missoula, MT - 9121195<br />
Table 9.6<br />
List of Clean Cities as of 12/l/99 by Designation<br />
40.<br />
41.<br />
42.<br />
43.<br />
44.<br />
45.<br />
46.<br />
47.<br />
48.<br />
49.<br />
50.<br />
51.<br />
52.<br />
53.<br />
54.<br />
55.<br />
56.<br />
57.<br />
58.<br />
59.<br />
60.<br />
61.<br />
62.<br />
63.<br />
64.<br />
65.<br />
66.<br />
67.<br />
68.<br />
69.<br />
70.<br />
71.<br />
72.<br />
73.<br />
74.<br />
75.<br />
76.<br />
77.<br />
New Haven, CT - 10/5/95<br />
Central Arkansas - 10125195<br />
Paso Del Norte - 1 l/l 7/95<br />
Pittsburgh, PA - 1215195<br />
S. Cali<strong>for</strong>nia Assn. Gov. - 3/l/96<br />
Los Angeles, CA - 3122196<br />
Coachella Valley, CA - 4122196<br />
WeldlLarimerlRocky Mountain<br />
National Park - 5/2 l/96<br />
Central Oklahoma - 5129196<br />
Hampton Roads, VA - 1014196<br />
San Diego, CA 12112196<br />
Long Island, NY -10/l 8/96<br />
Detroit, MI/Toronto, ON -12/18/96<br />
Cincinnati, OH - l/29/97<br />
Evansville, IN - l/30/97<br />
Houston-Galveston, TX - 914197<br />
Portland, ME - 914197<br />
Tulsa, OK - 9/22/97<br />
Maricopa Assn. of Govts. - 1018197<br />
Riverside, CA - 10124197<br />
North Jersey, NJ - 10/3 l/97<br />
Texas Coastal (Corpus Christi), TX - 3/30/98<br />
Genesee Region (Rochester), NY - 5128198<br />
Red River Valley/Grand Forks, ND - S/10/98<br />
Puget Sound, WA - g/13/98<br />
RI - Ocean States - 9/14/98<br />
Omaha, NE - 9/l 8/98<br />
Kansas City, KS/MO - 1 l/l S/98<br />
Cential Indiana CC Alliance, IN - 3/4/99<br />
Ann Arbor, MI - 4/l 9199<br />
Capital pistrict (Albany), NY - 4/26/99<br />
South Shore, IN - 6115199<br />
Capital Clean Cities of CT - 6/21/99<br />
Tuscan, AX - 8124199<br />
NE Clean Ftiels Coalition (Cleveland) - 9/14/99<br />
Florida Space Coast - 10/l/99<br />
Manhattan Area, KS - 1 O/4//99<br />
The Alamo Area (San Antonio) - 1 l/10/99<br />
For more in<strong>for</strong>mation, contact the Clean Cities Hotline at (800) CCITIES, or write to: U.S. Department of<br />
Energy, EE-33, Clean Cities Program, 1000 Independence Avenue SW, Washington, DC <strong>20</strong>585.<br />
Source:<br />
U.S. Department of Energy, Alternative Fuel In<strong>for</strong>mation, Clean Cities: Guide to Alternative Fuel Vehicle<br />
Incentives & Laws, Washington, DC, November 1996, and updates from web site, February <strong>20</strong>00.<br />
(Additionalre~~~~sP~~~~~~~~~~~~~~~~ <strong>BOOK</strong>: <strong>EDITION</strong>~O-<strong>20</strong>00
Figure 9.1 Map of Clean Cities as of 12/l/99<br />
I n<br />
Source:<br />
U.S. Department of Energy, Alternative Fuel In<strong>for</strong>mation, Clean Cities: Guide to Alternative Fuel Vehicle Incentives & Laws, Washington, DC, November<br />
1996, and updates from the web site, February <strong>20</strong>00. (Additional resources: www.ccities.doe.gov)
9-10<br />
P b<br />
Electric and hybrid-electric vehicles are required to be sold in Cali<strong>for</strong>nia under the Cali<strong>for</strong>nia Low-<br />
Emission Vehicle (LEV) program. Other states, such as New York, Texas, and Massachusetts, have<br />
indicated that they will also en<strong>for</strong>ce the LEVprogram. The U. S. Advanced Battery Consortium (USABC)<br />
was established in January 1991 to concentrate ef<strong>for</strong>ts on battery development<strong>for</strong>future electric vehicles.<br />
The USABC consists of the Big Three U.S. auto manufacturers (Daimler-Chrysler, Ford, General<br />
Motors), the Electric Power Research Institute, and the U.S. Department sf Energy.<br />
Table 9.7<br />
U.S. Advanced Battery Consortium Goals <strong>for</strong> Electric Vehicle Batteries<br />
Power density” W/L<br />
Primary criteria<br />
Specific power” W/kg (80% DOD/30 xc)<br />
Energy density” Wh/L (C/3 discharge rate)<br />
Specific energy” Wh/kg (C/3 discharge rate)<br />
Life (years)<br />
Cycle life” (cycles) (80% DOD)<br />
Power and capacity degradationb (% of rated spec)<br />
Ultimate priceC ($/kWh) (10,000 units @ 40 kWh)<br />
Operating environment<br />
Recharge time”<br />
Continuous discharge in 1 hour (no failure)<br />
Secondarv criteria<br />
Efficiency (C/3 discharge & C/3 charge)”<br />
Self dischargeb<br />
Maintenance<br />
Thermal lossb<br />
Abuse resistance”<br />
Long-term goals”<br />
(<strong>20</strong>00)<br />
460<br />
300<br />
230<br />
150<br />
10<br />
1000<br />
1800 (@ 50% DOD)<br />
2670 (@ 30% DOD)<br />
<strong>20</strong>%<br />
< $150 (desired to7.5)<br />
-30 to 65°C<br />
< 6 hours<br />
75% (of rated energy capacity)<br />
80%<br />
< <strong>20</strong>% in 12 days<br />
No maintenance. Service by<br />
qualified personnel only.<br />
Covered by self discharge<br />
Tolerant<br />
Minimized by on-board controls<br />
Source:<br />
U.S. Department of Energy, Office of Transportation Technologies, Washington, DC, February, 1998.<br />
Note:<br />
W=watt; kg=kilogram; L=liter; DOD=dcpth of discharge; Wh=watt-hour; kWh=kilowatt-hour.<br />
Additional in<strong>for</strong>mation about USABC is available at: www.uscar.org/techno/store.htm.<br />
“For interim commercialization (Reflects USABC revisions of September 1996).<br />
bSpecifics on criteria can be found in “USABC Electric Vehicle Battery Test Procedures Manual Revision 2”<br />
DOE/ID-10479, Rev. 2, January 1996.<br />
‘Cost to the Original Equipment Manufacturers.<br />
dRoundtrip charge/discharge efficiency.<br />
<strong>TRANSPORTATION</strong> <strong>ENERGY</strong> <strong>DATA</strong> <strong>BOOK</strong>: <strong>EDITION</strong> <strong>20</strong>-<strong>20</strong>00
The Partnership <strong>for</strong> a New Generation of Vehicles (PNGV) is an historic public/privatepartnership between the U.S.-federal government (led<br />
by the Technology Administration at the Department of Commerce, and including 7 agencies and 19 federal laboratories) and DaimlerChtysler,<br />
Ford, and General Motors that aims to strengthen America? competitiveness by developing technologies <strong>for</strong> a new generation of vehicles.<br />
PNGV’s long term goal is to develop an environmentally friendly car with up to triple the fuel efficiency of today’s midsize cars-- without<br />
sacrificing af<strong>for</strong>dability, per<strong>for</strong>mance, or safety. Two other PNGV goals are to significantly improve national competitiveness in automotive<br />
manufacturing and to apply commercially viable innovation to conventional vehicles.<br />
Table 9. 8<br />
PNGV Goals and Specifications of Hybrid-Electric Vehicles<br />
PNGV Concept Vehicles<br />
Parameter PNGV Goals Dodge ESX3 Ford Prodigy GM Precept Toyota Prius Honda Insight<br />
Fuel economy up to 80 mpg 72 mpg gas equiv. 72 mpg gas equiv. 80 mpg gas equiv. 56 mpg gas 64 mpg gas<br />
(3x current mpg) 80 mpg diesel 80 mpg diesela 90 mpg diesel<br />
Range 380 miles 400 miles 660 miles 3 80 miles 550 miles 600 miles<br />
Acceleration (O-60 mnh) 12.0 seconds<br />
Emissions<br />
Areodynamics<br />
Curb weight<br />
Passenger capacity<br />
Dimensions: Length<br />
Width<br />
Cargo Capacity<br />
Default Tier 2<br />
0.<strong>20</strong> Cd<br />
1,980 lbs.<br />
Upto<br />
16.8 ftj<br />
11 .O seconds<br />
12.0 seconds<br />
11.5 seconds<br />
14.1 seconds<br />
12.0 seconds<br />
Target is Tier 2 Target is Tier 2 Target is Tier 2 SULEV ULEV<br />
0.22 Cd<br />
2,250 lbs.<br />
5<br />
192.8 in.<br />
74.2 in.<br />
16.0 fi?<br />
0.199 Cd<br />
2,387 lbs.<br />
5<br />
186.9 in.<br />
69.1 in.<br />
14.6 ft3<br />
0.163 Cd<br />
2,592 lbs.<br />
5<br />
193.2 in.<br />
67.9 in.<br />
4.4 ft3<br />
0.30 Cd<br />
2,734 lbs.<br />
5<br />
168.3 in.<br />
66.7 in.<br />
10.0 ft?<br />
0.25 Cd<br />
1,856 lbs.<br />
2<br />
155.1 in.<br />
66.7 in.<br />
Meet FMVSSb Meet FMVSSb Meet FMVSSb Meet FMVSSb Meet FMVSSb Meet FMVSSb<br />
Source:<br />
Partnership <strong>for</strong> a New Generation of Vehicles, Media In<strong>for</strong>mation, <strong>20</strong>00. (Additional resources: www.ta.doc.gov/pngv/cover/pngvcover.htm)<br />
“Fuel economy <strong>for</strong> Dodge using “Designer” diesel (0 ppm sulfur); Ford using Swedish clean diesel (~10 ppm sulfur); GM using<br />
Cali<strong>for</strong>nia low-sulfur diesel (~30 ppm sulfur).<br />
bFederal Motor Vehicle Safety Standards.<br />
7.0 ftj
Source<br />
Figure 10.1<br />
Figure 10.1<br />
Chapter 10<br />
Fleet Vehicles and Characteristics<br />
Summary Statistics from Tables/Figures in this Chapter<br />
Fleet automobiles, 1999 4,629,OOO<br />
Fleet Class l-5 Trucks, 1999 4,018,000<br />
Table 10.4 Average annual miles per automobile<br />
Business fleets 29,<strong>20</strong>0<br />
Utility fleets 14,500<br />
GovernmentJleets 13,700<br />
Table 10.5 Federal Government vehicles, FY 1997 548,978<br />
Automobiles 113,460<br />
Buses 6,048<br />
Light trucks 381,674<br />
Medium trucks 29,817<br />
Heavy trucks 17,979<br />
<strong>TRANSPORTATION</strong><strong>ENERGY</strong><strong>DATA</strong>BOOIC <strong>EDITION</strong>~O-<strong>20</strong>00
. mm . . .<br />
SigniJicant changes have been made in recent years to fleet vehicle estimations. Newly available data<br />
improve the accuracy ofjleet vehicle estimates but, at the same time, make it impossible to compare the data<br />
historically. There<strong>for</strong>e, only the 1999 data arepresented here.<br />
Figure 10.1. Fleet Vehicles in Service as of January 1,1999<br />
4,629,OOO<br />
Government (22%)<br />
Utility (8%)<br />
Automobiles<br />
in Fleets of<br />
25 or more<br />
4,018,OOO<br />
Government (50%)<br />
Utility (1 1%)<br />
Trucks (Classes 1-5)<br />
in Fleets of<br />
25 or more<br />
Source:<br />
Bobit Publishing Company, Automotive Fleet Research Department, Automotive Fleet Factbook 1999,<br />
Redondo Beach, CA, 1999. (Additional resources: www.fleet-central.com)<br />
Note:<br />
Truck classes l-5 are 19,500 lbs. and less.<br />
Taxi category includes vans.<br />
“Rental category includes vans and sports utility vehicles under automobiles, not trucks.<br />
<strong>TRANSPORTATION</strong><strong>ENERGY</strong><strong>DATA</strong><strong>BOOK</strong>: <strong>EDITION</strong>~O-<strong>20</strong>00
These are the top ten states in terms offleets andfleet vehicles, according to Dwight’s Energydata, Denver, CO.<br />
Autos and light trucks make up the largest share offleet vehicles in each of the states. The average number of<br />
vehiclesperfleet is the highest in Florida and Cali<strong>for</strong>nia.<br />
Table 10.1<br />
Top Ten States with Fleets of Ten Vehicles or More, 1999<br />
Fleets of ten Fleet vehicles Average<br />
vehicles or Trucks Trucks Trucks vehicles per<br />
States<br />
more Autos (class 1-2) (class 3-5) (class 6-8) Total fleet’<br />
Cali<strong>for</strong>nia 12,005 474,627 443,869 <strong>20</strong>5,883 321,332 1,457,716 121<br />
Texas 8,85 1 260,885 262,270 107,599 247,960 887,565 100<br />
New York 6,706 227,144 191,415 78,215 82,015 685,495 102<br />
Pennsylvania 5,973 166,880 148,086 52,840 79,086 552,865 93<br />
Florida 5,986 233,<strong>20</strong>9 <strong>20</strong>8,919 88,230 99,408 735,752 123<br />
Illinois 5,653 178,939 149,886 76,441 79,770 590,689 104<br />
Ohio 5,418 177,830 130,846 60,350 63,627 538,071 99<br />
Michigan 3,945 149,536 103,684 53,670 104,373 415,<strong>20</strong>8 105<br />
New Jersey 3,919 139,327 121,717 35,172 119,839 419,974 107<br />
North Carolina 3,821 102,047 109,667 38,342 142,354 396,23 1 104<br />
Source:<br />
Bobit Publishing Company, Automotive Fleet Industry Statistics web site:<br />
www.fleet-central.com /AF/Resources/Stats/chart3.htm. Original data source: Dwight’s Energydata,<br />
Denver, CO. (Additional resources: www.fleet-central.com/AF)<br />
<strong>TRANSPORTATION</strong><strong>ENERGY</strong><strong>DATA</strong><strong>BOOK</strong>: <strong>EDITION</strong>~O-<strong>20</strong>00
1 o-4<br />
ama<br />
. . . .I .<br />
I<br />
TheseJleet data, which were generatedfrom a 1991-92 ORNL study, are still the latest<br />
available data of this kind.<br />
Fleet type<br />
Business<br />
Utility<br />
Government<br />
Vehicle type<br />
Cars<br />
Light trucks”<br />
Medium trucksb<br />
Heavy trucksc<br />
Table 10.2<br />
Fleet Vehicle Composition by Vehicle Type, 1991<br />
(percent)<br />
Light trucks? Medium Heavy<br />
Cars and vans trucks” trucksc Total<br />
24.2% 21.1% 45.8% 8.9% 100%<br />
22.6% 39.0% 15.0% 23.4% 100%<br />
48.5% 42.8% 6.8% 1.8% 100%<br />
Table 10.3<br />
Average Length of Time Fleet Vehicles are Kept Be<strong>for</strong>e Sold to Others, 1991<br />
(months)<br />
Cars<br />
Light trucksg<br />
Medium trucks”<br />
Heavy trucksc<br />
Business Utility<br />
35 68<br />
56 60<br />
83 86<br />
103 132<br />
Government<br />
81<br />
82<br />
96<br />
117<br />
Table 10.4<br />
Average Annual and Daily Vehicle-Miles of Travel <strong>for</strong> Fleet Vehicles, 1991<br />
Business Utility Government<br />
Miles/day Miles/day Miles/day<br />
Miles/year @250 Miles/year @250 Miles/year @250<br />
(thousands) days/year (thousands) days/year (thousands) days/year<br />
29.2 117 14.5 58 13.7 55<br />
26.6 106 17.5 70 13.9 56<br />
17.5 70 11.8 47 11.9 48<br />
64.4 258 13.8. 55 10.7 43<br />
Source:<br />
Miaou, S. P., et. al., Fleet Vehicles in the United States: Composition, Operating Characteristics, and Fueling<br />
Practices, (ORNL-6717) Oak Ridge National Laboratory, Oak Ridge, TN, May 1992.<br />
(Additional resources: www-cta.ornl.gov)<br />
“In this study, light trucks are ~8,500 lbs gross vehicle weight.<br />
“In this study, medium trucks are between 8,500-26,000 lbs gross vehicle weight.<br />
“In this study, heavy trucks are >26,000 lbs gross vehicle weight.<br />
<strong>TRANSPORTATION</strong><strong>ENERGY</strong><strong>DATA</strong><strong>BOOK</strong>: <strong>EDITION</strong>~O-<strong>20</strong>00
600<br />
Figure 10.2. Worldwide Federal Inventory, 1992-97<br />
584,765<br />
I/,-,,,4<br />
I993 I994 I995 I996 I997<br />
Leased<br />
Federally-owned:<br />
Foreign<br />
pJD omestic<br />
Source:<br />
U.S. General Services Administration, Federal Vehicle Policy Division, FY 1997 Federal Fleet Report ,<br />
Washington, DC, 1999, Tables 1 and 12.<br />
(Additional resources: policyworks.gov/org/main/mt/homepage/mtv/mtvhp.htm)<br />
Figure 10.3. Average Miles per Federal Vehicle by Vehicle Type, 1997<br />
0 2,000 4,000 6,000 8,000 I0,000 12,000<br />
Average Miles per Vehicle<br />
Source:<br />
U.S. General Services Administrations, Federal Vehicle Policy Division, FY 1997 Federal Fleet Report,<br />
Washington, DC, 1999, Table 5.<br />
(Additional resources: policyworl~s.gov/org/main/mt/homepage/mtv/mtvhp.htm)<br />
<strong>TRANSPORTATION</strong><strong>ENERGY</strong><strong>DATA</strong>BOOIC <strong>EDITION</strong>~O-<strong>20</strong>00<br />
1 o-5
1 O-G<br />
@Ea6Ll<br />
I VW . . I<br />
Department or Agency<br />
Department of Agriculture<br />
Department of Commerce<br />
Department of Education<br />
Department of Energy<br />
Department of Health & Human<br />
Department of Housing & Urban Dev.<br />
Department of Justice<br />
Department of Labor<br />
Department of State<br />
Department of Interior<br />
Department of Treasury<br />
Department of Transportation<br />
Department of Veterans Affairs<br />
Environmental Protection Agency<br />
Federal Communications Comm<br />
Federal Emergency Mgmt Agency<br />
General Services Administration”<br />
Nat1 Aeronautics & Space Admin.<br />
Small Business Administration<br />
Tennessee Valley Authority<br />
Others<br />
CIVILIAN AGENCIES<br />
Table 10.5<br />
Federal Government Vehicles by Agency, Fiscal Year 1997<br />
Autos<br />
3,273<br />
144<br />
1<br />
784<br />
89<br />
3<br />
25,190<br />
19<br />
103<br />
1,374<br />
10,960<br />
30<br />
470<br />
57<br />
55<br />
28<br />
54,263<br />
103<br />
115<br />
427<br />
94<br />
97,582<br />
Buses<br />
42<br />
2<br />
0<br />
164<br />
7<br />
0<br />
314<br />
1<br />
0<br />
80<br />
18<br />
16<br />
1<strong>20</strong><br />
0<br />
0<br />
6<br />
2,932<br />
43<br />
0<br />
0<br />
19<br />
3,764<br />
Light Medium Heavy<br />
trucks” trucksc trucksd Total<br />
24,614 5,247 602 33,778<br />
416 228 12 802<br />
2 0 0<br />
3<br />
3,606 919 794 6,267<br />
326 147 58 627<br />
1<br />
0 0<br />
4<br />
12,742 976 271 39,493<br />
144 14 3 181<br />
84 0 11 198<br />
9,160 3,506 1,4<strong>20</strong> 15,540<br />
3,760 307 96 15,141<br />
411 96 67 6<strong>20</strong><br />
1,036 243 115 1,984<br />
233 70 15 375<br />
63<br />
2 0 1<strong>20</strong><br />
253 25 0 312<br />
88,808 3,636 3,707 153,346<br />
806 326 75 1,353<br />
0<br />
0 0 115<br />
1,012 999 226 2,664<br />
396 37 50 596<br />
147,873 16,778 7,522 273,519<br />
U.S. POSTAL SERVICE 9,342 6 180,346 9,293 4,927 <strong>20</strong>3,914<br />
Department of the Air Force<br />
Department of the Army<br />
Department of the Navy<br />
Other Defense Agencies<br />
Corps of Engineers<br />
U.S. Marine Corps<br />
MILITARY AGENCIES<br />
2,591 1,191 22,679 970<br />
124 26 247 163<br />
2,845 677 22,756 1,379<br />
283 25 1,988 110<br />
223 4 2,410 575<br />
470 355 3,375 549<br />
6,536 2,278 53,455 3,746<br />
2,348<br />
122<br />
2,340<br />
116<br />
311<br />
293<br />
5,530<br />
29,779<br />
682<br />
29,997<br />
2,522<br />
3,523<br />
5,042<br />
71,545<br />
TOTAL 113,460 6,048 381,674 29,817 17,979 548,978<br />
Source:<br />
U.S. General Services Administration, Federal Supply Service, FY 1997 Federal Fleet Report, Washington, DC, 1999,<br />
Table 14. (Additional resources: policyworks.gov/org/main/mt/homepage/mtv/mtvhp.htm)<br />
a Federally-owned and commercially-leased vehicles.<br />
’ Less than 8,500 lbs GVWR. Includes ambulances.<br />
’ 8,501-23,999 lbs GVWR.<br />
d 24,000 lbs. Or more GVWR.<br />
e GSA Fleet vehicles.<br />
<strong>TRANSPORTATION</strong><strong>ENERGY</strong><strong>DATA</strong><strong>BOOK</strong>: <strong>EDITION</strong>~O-<strong>20</strong>00
Table 10.6<br />
Federal Fleet Vehicle Acquisitions<br />
by Fuel Type, FY 1997”<br />
Gasoline<br />
Diesel<br />
Natural gas<br />
E-85<br />
Electricity<br />
Other<br />
M-85<br />
LPG<br />
Biodiesel<br />
Hydrogen<br />
Total<br />
Vehicle acquisitions<br />
14,097<br />
489<br />
172<br />
160<br />
139<br />
12<br />
9<br />
1<br />
0<br />
0<br />
15,079”<br />
Source:<br />
U.S. General Services Administrations, Federal Vehicle Policy Division,FY 1997 Federal Fleet Report,<br />
Washington, DC, 1999, Table 18.<br />
(Additional resources: policyworks.gov/org/main/mt/homepage/mtv/mtvhp.htm)<br />
Table 10.7<br />
Fuel Consumed by Federal Government Fleets, FY 1997”<br />
Gasoline<br />
Thousand gasoline<br />
equivalent gallons<br />
280,05 1<br />
Diesel 64,834<br />
NG 4,076<br />
Electricity 287<br />
Biodiesel 186<br />
Methanol 151<br />
M-85 137<br />
LPG 37<br />
Ethanol 19<br />
Total 349.780”<br />
Source:<br />
U.S. General Services Administrations, Federal Vehicle Policy Division, FY 1997 Federal Fleet Report,<br />
Washington, DC, 1999, Table 6.<br />
(Additional resources: policyworl~s.gov/org/main/mt/homepage/mtv/mtvhp.htm)<br />
“These data are reported under new requirements <strong>for</strong> FY 1997. Data <strong>for</strong> some agencies may be missing<br />
or incomplete.<br />
<strong>TRANSPORTATION</strong> <strong>ENERGY</strong> <strong>DATA</strong> <strong>BOOK</strong>: <strong>EDITION</strong> <strong>20</strong>-<strong>20</strong>00<br />
1 o-7
10-8<br />
I<br />
The Energy Policy Act of 1992 (EPACT) set alternative fuel vehicle acquisition requirements <strong>for</strong> Federal<br />
and State Governments, fuel proviclers and the private sector. Additional rule malzing has adjusted the<br />
original purchase requirements. State government and fuel providers requirements began in 1997.<br />
Table 10.8<br />
Energy Policy Act Purchase Requirements of Light Alternative Fuel Vehicles<br />
Year Federal State<br />
1993 5,000<br />
1994 7,500<br />
1995 10,000<br />
1996 25%<br />
1997 33%<br />
1998 50%<br />
1999 75%<br />
<strong>20</strong>00 75%<br />
<strong>20</strong>01 75%<br />
<strong>20</strong>02 75%<br />
<strong>20</strong>03 75%<br />
<strong>20</strong>04 75%<br />
<strong>20</strong>05 75%<br />
10%<br />
15%<br />
25%<br />
50%<br />
75%<br />
75%<br />
75%<br />
75%<br />
75%<br />
Fuel<br />
-providers Private”<br />
30%<br />
50%<br />
70%<br />
90%<br />
90%<br />
90% <strong>20</strong>%<br />
90% 40%<br />
90% 60%<br />
90% 70%<br />
<strong>20</strong>06-on 75% 75% 90% 70%<br />
Source:<br />
Final rule <strong>for</strong> the alternative fuels transportation programs, Federal Register, Vol. 61, p. 10622,<br />
March 14, 1996.<br />
Private alternative fueled vehicle acquisition requirements <strong>for</strong> private and local government<br />
fleets, Federal Register, vol. 62, p. 19701, April 23, 1997.<br />
Note:<br />
The Department of Energy has provided an Alternative Fuel Vehicles Acquisitions and Credits<br />
Database on the Internet to provide fleet managers with a convenient way to report their<br />
compliance with this mandate. (www.ott.doe.gov/credits)<br />
“The Department of Energy is presently considering implementation of private and municipal fleet rule making.<br />
<strong>TRANSPORTATION</strong> <strong>ENERGY</strong> <strong>DATA</strong> <strong>BOOK</strong>: <strong>EDITION</strong> <strong>20</strong>-<strong>20</strong>00
Source<br />
Table 11.1<br />
Table 11.2<br />
Table 11.8<br />
Table 11.12<br />
Figure 11.1<br />
Table 11.13<br />
Figure 11.3<br />
Chapter 11<br />
Household Vehicles and Characteristics<br />
Summary Statistics from Tables/Figures in this Chapter<br />
Vehicles per licensed driver, 1998<br />
Average household transportation expense, 1998<br />
Share of households owning 3 or more vehicles<br />
1960<br />
1970<br />
1980<br />
1990<br />
Average annual miles per household vehicle, 1995<br />
Average occupancy rates by vehicle type, 1995<br />
Automobile<br />
Pickup truck<br />
Sports Utility<br />
Van<br />
Share of workers who car pooled, 1990<br />
Long-distance trips in the U.S., 1995<br />
Trips<br />
Person-miles<br />
1.11<br />
18.2%<br />
2.5%<br />
5.5%<br />
17.5%<br />
17.3%<br />
11,800<br />
1.6<br />
1.4<br />
1.7<br />
2.1<br />
13.4%<br />
1,001 million<br />
82 7 billion<br />
11-l<br />
f.3 . .<br />
TFCANSPORTATION<strong>ENERGY</strong><strong>DATA</strong><strong>BOOK</strong>: <strong>EDITION</strong>~O-<strong>20</strong>00
.<br />
D.<br />
Year<br />
1950<br />
1955<br />
1960<br />
1965<br />
1970<br />
1975<br />
1980<br />
1981<br />
1982<br />
1983<br />
1984<br />
1985<br />
1986<br />
1987<br />
1988<br />
1989<br />
1990<br />
1991<br />
1992<br />
1993<br />
1994<br />
1995<br />
1996<br />
1997<br />
1998<br />
Resident<br />
population”<br />
(thousands)<br />
151,868<br />
165,069<br />
179,979<br />
193,526<br />
<strong>20</strong>3,984<br />
215,465<br />
227,225<br />
229,466<br />
231,664<br />
233,792<br />
235,825<br />
237,924<br />
240,133<br />
242,289<br />
244,499<br />
246,819<br />
249,439<br />
252,127<br />
254,995<br />
257,746<br />
260,289<br />
262,765<br />
265,190<br />
267,744<br />
270,299<br />
Total<br />
households<br />
(thousands)<br />
43,554<br />
47,874<br />
52,799<br />
57,251<br />
63,401<br />
71,1<strong>20</strong><br />
80,776<br />
82,368<br />
83,527<br />
83,918<br />
85,407<br />
86,789<br />
88,458<br />
89,479<br />
91,061<br />
92,830<br />
93,347<br />
94,3 12<br />
95,689<br />
96,391<br />
97,107<br />
98,990<br />
99,627<br />
101,018<br />
102,528<br />
Number of<br />
vehicles in<br />
operation<br />
(thousands)<br />
43,256<br />
55,804<br />
66,582<br />
82,067<br />
98,136<br />
1<strong>20</strong>,054<br />
139,832<br />
141,908<br />
143,854<br />
147,104<br />
152,162<br />
157,048<br />
162,094<br />
167,193<br />
171,741<br />
175,960<br />
179,299<br />
181,438<br />
181,519<br />
186,315<br />
188,714<br />
193,441<br />
198,294<br />
<strong>20</strong>1,071<br />
<strong>20</strong>5,043<br />
Table 11.1<br />
Population and Vehicle Profile, 1950-98<br />
Total<br />
vehicle-miles<br />
(millions)<br />
458,246<br />
605,646<br />
718,762<br />
887,812<br />
1,109,724<br />
1,327,664<br />
1,527,295<br />
1,555,308<br />
1,595,OlO<br />
1,652,788<br />
1,7<strong>20</strong>,269<br />
1,774,826<br />
1,834,872<br />
1,92 1,<strong>20</strong>4<br />
2,025,962<br />
2,096,487<br />
2,144,362<br />
2,172,050<br />
2,247,151<br />
2,296,378<br />
2,357,588<br />
2,422,696<br />
2,485,848<br />
2,561,695<br />
2,625,367<br />
Number of<br />
licensed<br />
drivers<br />
(thousands)<br />
62,194<br />
Number of<br />
civilian<br />
employed<br />
persons<br />
(thousands)<br />
58,918<br />
74,686 62,170<br />
87,253 65,778<br />
98,502 71,088<br />
111,543 78,678<br />
129,791 85,846<br />
145,295 99,303<br />
147,075 100,397<br />
150,234 99,526<br />
154,389 100,834<br />
155,424 105,005<br />
156,868 107,150<br />
159,487 109,597<br />
161,975 112,440<br />
162,853 114,968<br />
165,555 117,342<br />
167,015 118,793<br />
168,995 117,718<br />
173,125 118,492<br />
173,149 1<strong>20</strong>,259<br />
175,403 123,060b<br />
176,628 124,900b<br />
179,539 126,708”<br />
182,709 129,558b<br />
184,980 131,463<br />
Average annual percentage change<br />
2.3% 1.7%<br />
Vehicles<br />
per<br />
capita<br />
0.28<br />
Vehicle- Licensed<br />
miles drivers<br />
per<br />
capita<br />
per<br />
household<br />
3,929 1.43<br />
Vehicles<br />
Per<br />
licensed<br />
driver<br />
0.70<br />
Vehicles<br />
per<br />
civilian<br />
employed<br />
persons<br />
0.73<br />
0.34 3,656 1.56 0.75 0.90<br />
0.37 3,994 1.65 0.76 1.01<br />
0.42 4,587 1.72 0.83 1.15<br />
0.48 5,440 1.76 0.88 1.25<br />
0.56 6,162 1.82 0.92 1.40<br />
0.62 6,722 1.80 0.96 1.41<br />
0.62 6,778 1.79 0.96 1.41<br />
0.62 6,885 1.80 0.96 1.45<br />
0.63 7,069 1.84 0.95 1.46<br />
0.65 7,295 1.82 0.98 1.45<br />
0.66 7,460 1.81 1 .oo 1.47<br />
0.68 7,641 1.80 1.02 1.48<br />
0.69 7,929 1.81 1.03 1.49<br />
0.70 8,286 1.79 1.05 1.49<br />
0.71 8,494 1.78 1.06 1.50<br />
0.72 8,597 1.79 1.07 1.51<br />
0.72 8,615 1.79 1.07 1.54<br />
0.71 8,782 1.81 1.05 1.53<br />
0.72 8,909 1.80 1.08 1.55<br />
0.73 9,057 1.81 1.08 1.53<br />
0.74 9,2<strong>20</strong> 1.78 1.10 1.55<br />
0.75 9,374 1.80 1.10 1.56<br />
0.75 9,567 1.81 1.10 1.55<br />
0.76 9,713 1.80 1.11 1.56<br />
1950-98 1.2%<br />
1.8% 3.3% 3.7% 2.1% 2.5% 0.5% 1 .O% 1.6%<br />
1988-98<br />
1 .O% 1.2% 1.8% 2.6% 1.3% 1.3% 0.8% 1.6% 0.1% 0.6% 0.5%<br />
Source:<br />
Resident population, total households, and civilian employed persons - U.S. Department of Commerce, Bureau of the Census, Statistical Abstvuct ofthe United States-1999, 119th<br />
edition, Washington, DC, 1999, pp. 8, 60,412, and annual. (Additional resources: www.census.gov)<br />
Vehicles in operation - The Polk Company. FURTHER REPRODUCTION PROHIBITED. (Additional resources: www.polk.com)<br />
Licensed drivers and vehicle-miles - U.S. Department of Transportation, Federal Highway Administration, Highway Sfatistics 1998, Tables DL-<strong>20</strong> and VM-1, and annual.<br />
(Additional resources: www.fhwa.dot.gov)<br />
“Estimates as of July 1, Includes Armed Forces stationed in the United States.<br />
bData are not comparable to earlier years due to changes in definitions and methodology. See original source <strong>for</strong> more details.
.<br />
D.<br />
I Transportation<br />
(18.2%) is second only to housing (31.8%) as the largest expenditure <strong>for</strong> the average household. In 1998, approximately 15% of<br />
transportation expenditures were <strong>for</strong> purchasing gasoline and motor oil. There is an average of two vehicles per household.<br />
Table 11.2<br />
Average Annual Expenditures of Households by Income, 199P<br />
Income be<strong>for</strong>e taxes<br />
All Less than $5,000- $10,000- $15,000- $<strong>20</strong>,000- $30,000- $40,000- $50,000- $70,000<br />
households $5,000 $9999 $14999 $19,999 $29,999 $39,999 $49,999 $69,999 and over<br />
Total expenditures $37,260 $17,502 $14,838 $19,958 $22,810 $27,941 $33,616 $39,934 $49,376 $73,786<br />
Percentage of total expenditures”<br />
Food’ 14.4% 18.1% 18.5% 15.4% 16.3% 15.5% 15.3% 14.8% 14.0% 12.5%<br />
Housing 31.8% 34.8% 39.0% 36.8% 34.8% 33.3% 32.2% 30.0% 29.4% 30.6%<br />
Apparel and services 4.7% 6.4% 4.7% 4.1% 4.0% 4.8% 5.2% 5.1% 4.3% 4.7%<br />
Transportation 18.2% 16.4% 13.7% 17.9% 18.4% 19.1% 18.6% 18.8% 19.9% 17.4%<br />
Vehicle purchases (net outlay) 8.2% 6.8% 5.6% 8.6% 8.2% 8.6% 7.7% 8.2% 9.4% 7.8%<br />
Gasoline and motor oil 2.8% 3.2% 2.9% 3.0% 3.2% 3.2% 3.1% 3.1% 2.8% 2.2%<br />
Other vehicle expenditures<br />
6.1% 5.2% 4.1% 5.3% 5.9% 6.2% 6.7% 6.5% 6.7% 5.9%<br />
Public transportation 1.1% 1.2% 1.1% 1.0% 1.0% 1.0% 1.0% 1.0% 0.9% 1.5%<br />
Health care 5.3% 4.9% 7.9% 8.3% 9.4% 6.6% 5.5% 5.2% 4.4% 3.9%<br />
Entertainment 4.9% 5.2% 3.8% 4.5% 3.9% 4.3% 4.3% 4.9% 5.3% 5.4%<br />
Personal Insurance & pensions 11.0% 2.7% 2.1% 3.0% 4.4% 6.5% 9.3% 11.7% 13.2% 15.8%<br />
Other@ 9.7% 11.6% 10.3% 10.1% 8.9% 9.9% 9.7% 9.5% 9.4% 9.8%<br />
Households (thousands) 84,115 4,259 8,143 8,469 7,352 12,621 10,123 7,654 11,300 14,193<br />
Percentage of households 100% 5.1% 9.7% 10.1% 8.7% 15.0% 12.0% 9.1% 13.4% 16.9%<br />
Average number of vehicles in HH 2.0 1.0 0 . 9 1.3 1.5 1.9 2.1 2.3 2.6 2.9<br />
Source:<br />
U.S. Department of Labor, Bureau of Labor Statistics, web site: www.bls.gov/csxll998/Standardlincome.pdf., February <strong>20</strong>00. (Additional resources: www.bls.gov)<br />
a Public assistance monies are included in reported income. Data <strong>for</strong> those reporting income.<br />
b Percentages may not sum to totals due to rounding.<br />
’ Includes alcoholic beverages.<br />
d Includes personal care, reading, education, tobacco and smoking supplies, cash contributions, and miscellaneous items.
11-4<br />
I Household<br />
vehicle ownership shows a dramatic increase from 1960 to 1990. In 19G0, nearly 79% of<br />
households owned less than two vehicles; by 1990, it declined to 45%. Census data prior to 1990<br />
indicated that the majority of households owned one vehicle; in 1990 that changed to two vehicles.<br />
Table 11.3<br />
Household Vehicle Ownership, 1960-90 Census<br />
(percentage)<br />
No One<br />
vehicles vehicle<br />
Two<br />
vehicles<br />
Three or<br />
more<br />
vehicles<br />
Total<br />
vehicles”<br />
1960 21.53% 56.94% 19.00% 2.53% 54,766,7 18<br />
1970 17.47% 47.71% 29.32% 5.51% 79,002,052<br />
1980 12.92% 35.53% 34.02% 17.52% 129,747,911<br />
1990 11.53% 33.74% 37.35% 17.33% 152,380,479<br />
Source:<br />
U. S. Department of Transportation, Volpe National Transportation Systems <strong>Center</strong>,Journq-to-<br />
Work Trends in the United States and its Major Metropolitan Area, 1960-1990, Cambridge,<br />
MA, 1994, p. 2-2. (Additional resources: www.census.gov)<br />
“Compiled by the Census Bureau, these data on the total number of vehicles do not match the figures on<br />
Table 4.1. The figures on Table 4.1, from R.L. Polk and Company, are the preferred data.<br />
<strong>TRANSPORTATION</strong><strong>ENERGY</strong><strong>DATA</strong><strong>BOOK</strong>: EDITI~N~O-<strong>20</strong>00
1995 Nationwide Personal Travel Survey<br />
The 1995 Nationwide Personal Travel Survey (NPTS) is a national survey designed to collect data on<br />
the nature and characteristics of personal travel. The definition of a trip in the NPTS is “any one-way travel<br />
from one address to another by private motor vehicle, public transportation, bicycle, or walling.” Excluded ’<br />
from the survey are jogging and walking <strong>for</strong> exercise, as is all bicycling and walking <strong>for</strong> individuals under<br />
5 years of age. The survey collects detailed data on household trips,‘their purposes and the transportation<br />
modes used. The NPTS is sponsored by several agencies of the U.S. Department of Transportation and<br />
is conducted approximately every seven years. Since each of the surveys differ somewhat in terminology,<br />
survey procedure, and target population, one should be cautious when comparing statistics from one survey<br />
to the next. Improved methodologies used in the collection of the trip in<strong>for</strong>mation in the 1995 NPTS make<br />
it impossible to compare these data with past NPTS survey data. Thus, the 1990 NPTS trip data have been<br />
adjusted to make it comparable with the latest survey. Both the original 1990 data and the adjusted 1990<br />
data are shown in tables comparing trip in<strong>for</strong>mation. The 1995 trip data shouldonly be compared to the<br />
adjusted 1990 trip data, and the original trip 1990 data should be compared with previous surveys.<br />
Additional analyses can be done on the 1995 NPTS data through the Internet site: www-cta.ornl.gov/npts.<br />
Table 11.4<br />
Demographic Statistics<br />
1969,1977,1983,1990, and 1995 NPTS<br />
Percent<br />
change<br />
1969 1977 1983 1990 1995 1969-95<br />
Persons per household 3.16 2.83 2.69 2.56 2.63 -17%<br />
Vehicles per household 1.16 1.59 1.68 1.77 1.78 53%<br />
Workers per household 1.21 1.23 1.21 1.27 1.33 10%<br />
Vehicles per worker 0.96 1.29 1.39 1.40 1.34 40%<br />
Average vehicle trip length (miles) 8.89 8.34 7.90 8.98 9.06 2%<br />
Source:<br />
U.S. Department of Transportation, Federal Highway Administration, 1990 Nationwide Personal Transportation<br />
Survey: Summary of Travel Trends, FHWA-PL-92-027, Washington, DC, March 1992, Table 2. Data <strong>for</strong><br />
1995 were generated from the Internet site www-cta.ornl.gov/npts.<br />
(Additional resources: www.fhwa.dot.gov)<br />
Note:<br />
Average vehicle trip length <strong>for</strong> 1990 and 1995 is calculated using only those records with trip mileage in<strong>for</strong>mation<br />
present. The 1969 survey does not include pickups and other light trucks as household vehicles.<br />
1 l-5<br />
tl . .<br />
<strong>TRANSPORTATION</strong><strong>ENERGY</strong><strong>DATA</strong>BOOIC <strong>EDITION</strong>~O-<strong>20</strong>00
1 l-6<br />
e. .<br />
The 1995 NPTS data should be compared only to the 1990 adjusted data due to survey<br />
methodology improvements in collecting trip in<strong>for</strong>mation. The original 1990 data are<br />
comparable to allprevious surveys; however, comparisons should always be made with<br />
caution because of differing survey methodologies.<br />
Table 11.5<br />
Average Annual Vehicle-Miles, Vehicle Trips and<br />
Trip Length per Household<br />
1969,1977,1983,1990, and 1995 NPTS<br />
Journey-to-work” All trips<br />
Average annual vehicle-miles per household<br />
1969 4,183 12,423<br />
1977 3,815 12,036<br />
1983 3,538 11,739<br />
1990 original 4,853 15,100<br />
1990 adjusted 4,853 18,161<br />
1995 6,492 <strong>20</strong>,895<br />
Average annual vehicle trips per household<br />
1969 445 1,396<br />
1977 423 1,442<br />
1983 414 1,486<br />
1990 original 448 1,702<br />
1990 adjusted 448 2,077<br />
1995 553 2,321<br />
Average vehicle trip length (miles)<br />
1969 9.4 8.9<br />
1977 9.0 8.4<br />
1983 8.5 7.9<br />
1990 original 11.0 9.0<br />
1990 adjusted 11.0 8.9<br />
1995 11.8 9.1<br />
Source:<br />
U.S. Department of Transportation, Federal Highway Administration, 1990 Nationwide Personal<br />
Transportation Survey: Summary of Travel Trends, FHWA-PL-92-027, Washington, DC,<br />
March 1992, Table 7. Data <strong>for</strong> 1995 were generated from the Internet site wwwcta.ornl.gov/npts.<br />
1990 adjusted data - Oak Ridge National Laboratory, Oak Ridge, TN,<br />
August 1998. (Additional resources: www.fhwa.dot.gov, www-cta.ornl.gov/npts)<br />
“It is believed that the methodology changes in the 1995 NPTS did not affect journey-to-work trips; there<strong>for</strong>e,<br />
no adjustment is necessary.<br />
<strong>TRANSPORTATION</strong><strong>ENERGY</strong><strong>DATA</strong><strong>BOOK</strong>: <strong>EDITION</strong>~O-<strong>20</strong>00
I<br />
The 1995 NPTS data should be compared only to the 1990 adjusted data due to survey<br />
methodology improvements in collecting trip in<strong>for</strong>mation. The original 1990 data are<br />
comparable to allprevious surveys; however, comparisons should always be made with caution<br />
because of differing survey methodologies.<br />
Table 11.6<br />
Average Annual Person-Miles Traveled (PMT), Person Trips and Trip Length<br />
per Household by Selected Trip Purposes<br />
1983,1990, and 1995 NPTS<br />
Social and<br />
Journey-to-work” Shopping recreational<br />
Average annual PMTper household<br />
All<br />
purposes”<br />
1983 4,586 2,567 8,964 22,802<br />
1990 original 5,637 2,674 8,567 24,803<br />
1990 adjusted 5,637 3,343 11,308 30,316<br />
1995 7,740 4,659 10,571 34.459<br />
Average annual person trips per household<br />
1983 537 474 728 2,628<br />
1990 original 539 504 662 2,673<br />
1990 adjusted 539 630 874 3,262<br />
1995 676 775 953 3,828<br />
Average person trip length (miles)<br />
1983 8.5 5.4 12.3 8.7<br />
1990 original 10.7 5.4 13.2 9.5<br />
1990 adjusted 10.7 5.4 13.2 9.5<br />
1995 11.6 6.1 11.3 9.1<br />
Source:<br />
U.S. Department of Transportation, Federal Highway Administration, Nationwide Personal Transportation<br />
Study, Public Use Tapes, Washington, DC. Data <strong>for</strong> 1995 were generated from the Internet site wwwcta.ornZ.gov/npts.<br />
1990 adjusted data - Oak Ridge National Laboratory, Oak Ridge, TN, August 1998.<br />
(Additional resources: www.fhwa.dot.gov, www-cta.ornl.gov/npts)<br />
Note:<br />
Average person trip length <strong>for</strong> 1990 and 1995 is calculated using only those records with trip mileage<br />
in<strong>for</strong>mation present. “All purposes” includes unreported trip purposes.<br />
“It is believed that the methodology changes in the 1995 NPTS did not affect journey-to-work trips; there<strong>for</strong>e,<br />
no adjustment is necessary.<br />
“Includes trip purposes not shown on this table.<br />
11-7<br />
El . .<br />
TFCANSPORTATION<strong>ENERGY</strong><strong>DATA</strong>BOOIC <strong>EDITION</strong>~O-<strong>20</strong>00
11-8<br />
El . . <strong>TRANSPORTATION</strong><strong>ENERGY</strong><strong>DATA</strong>BOOIC<br />
Table 11.7<br />
Average Number of Vehicles and Vehicle Travel per Household,<br />
1990 and 1995 NPTS<br />
Number of Drivers<br />
1<br />
2<br />
3<br />
4 or more<br />
Household size<br />
1 person<br />
2 persons<br />
3 persons<br />
4 persons<br />
5 persons<br />
6 or more persons<br />
Household urban status<br />
Urban<br />
Rural<br />
Household composition<br />
With children<br />
Average Average<br />
number of vehicles vehicle-miles traveled<br />
ner household uer household<br />
1990 1995 1990 1995<br />
1.5 1.2 15,<strong>20</strong>0 11,000<br />
2.1 2.1 22,900 22,600<br />
2.9 2.8 29,400 30,100<br />
3.8 3.6 40,500 39,600<br />
1.2 1.2 11,400 10,800<br />
1.9 1.9 19,300 19,400<br />
2.2 2.2 23,700 24,800<br />
2.4 2.3 25,300 25,600<br />
2.4 2.3 24,900 27,<strong>20</strong>0<br />
2.7 2.5 29,<strong>20</strong>0 27,900<br />
1.9 1.6 19,000 16,500<br />
2.1 2.0 22,<strong>20</strong>0 22,600<br />
2.2 2.2 24,100 25,000<br />
Without children 1.8 1.8 17,600 17,100<br />
Total 1.8 1.8 18,300 18,700<br />
Source:<br />
Generated from the Department of Transportation, Federal Highway Administration, Nationwide<br />
Personal Transportation Survey Public Use Files, Washington, DC, <strong>20</strong>00. (Additional<br />
resources: www-cta.ornl.gov/npts)<br />
<strong>EDITION</strong>~O-<strong>20</strong>00
Auto<br />
Van<br />
S ports Utility<br />
F‘ickup<br />
truck<br />
Other truck<br />
RV/I\ Jlotor home<br />
Motorcycle<br />
Other<br />
Figure 11.1. Average Vehicle Occupancy by Vehicle Type, 1995 NPTS<br />
Source:<br />
U.S. Department of Transportation, Federal Highway Administration, Nationwide Personal Transportation Survey, Washington, DC, 1997.<br />
(Additional resources: www.fhwa.dot.gov, www-cta.ornl.gov/npts)
oooz-02 NOI.I>Ia~ :>I008 VLVa A!X%N~ NOI.LV.LXOdSNWI~<br />
Persons per vehicle-mile<br />
pzzyi-+<br />
Other family or personal business<br />
Home to work<br />
Shopping ix<br />
Other family or personal business z<br />
Social and recreational<br />
All purposes<br />
1 Home to work<br />
Social and recreational<br />
All purposes<br />
1 Home to work<br />
Kg<br />
Other family or personal business<br />
-L<br />
h)<br />
1
.<br />
D.<br />
Less than 27% of all household vehicle-miles are trips to orj?om work. Errands such as family andpersonal business and shopping (combined) make<br />
up a third of vehicle travel. One quarter of all trips 75 miles or longer (one way) were <strong>for</strong> the pulppose of visitingfiiends or relatives.<br />
Table 11.8<br />
Vehicle-Miles by Trip Purpose, 1995 NPTS<br />
Daily trip vehicle-miles Long trip vehicle-miles” Total trip vehicle-miles<br />
Purpose of trip<br />
(millions) (percent) (millions) (percent) (millions) (percent)<br />
To or from work<br />
642,610 31.1%<br />
16,032 4.2% 658,642 26.8%<br />
Work-related business<br />
137,867 6.7%<br />
56,613 14.7%<br />
194,480 7.9%<br />
Shopping<br />
277,860 13.4%<br />
13,377 3.5% 291,237 11.9%<br />
Other family or personal business<br />
426,330 <strong>20</strong>.6%<br />
54,722 14.2% 481,052 19.6%<br />
School/church<br />
78,313 3.8%<br />
11,874 3.1%<br />
90,187 3.7%<br />
Doctor/dentist<br />
30,613 1.5%<br />
5,016 1.3%<br />
35,629 1.5%<br />
Vacation<br />
<strong>20</strong>,3 18 1.0%<br />
38,765 10.0%<br />
59,083 2.4%<br />
Visit friends or relatives<br />
195,068 9.4%<br />
99,308 25.7% 294,376 12.0%<br />
Other social or recreational<br />
256,169 12.4%<br />
85,989 22.3% 342,158 13.9%<br />
Other<br />
2,797 0.1%<br />
4,28 1 1.1%<br />
7,078 0.3%<br />
Not ascertained 422 0.0% <strong>20</strong> 0.0% 442 0.0%<br />
All 2,068,368 100.0% 385,997 100.0% 2,454,365 100.0%<br />
Source:<br />
U.S. Department of Transportation, Federal Highway Administration, Nationwide Personal Transportation Survey web site: wwwcta.oml.gov/npts.<br />
a Defined as a trip which is 75 miles or longer one way.
11-12<br />
I As<br />
households owned more vehicles, the average annual miles <strong>for</strong> the most frequently driven vehicle<br />
increased. For example, the mostfrequently driven vehicle in five-vehicle households was driven 26% more<br />
per year than the one in two-vehicle households (21,177 miles vs. 16,804 miles).<br />
Table 11.9<br />
Average Annual Miles per Vehicle by Household Vehicle Ownership, 1995 NPTS<br />
Vehicle a<br />
One-vehicle Two-vehicle Three-vehicle Four-vehicle Five-vehicle<br />
household household household household household<br />
#l 12,379 16,804 18,853 <strong>20</strong>,724 21,177<br />
#2 8,322 9,806 11,311 12,880<br />
#3 4,555 6,395 7,319<br />
#4 3,218 4,177<br />
#5 2,321<br />
Average 12,379 12,855 11,604 11,100 10,372<br />
Source:<br />
Generated from the Department of Transportation, Federal Highway Administration, Nationwide<br />
Personal Transportation Survey Public Use Files, Washington, DC, 1998. (Additional resources:<br />
www-cta.oml.gov/npts)<br />
Vehicle”<br />
Table 11.10<br />
Average Age of Vehicles by Household Vehicle Ownership, 1995 NPTS<br />
One-vehicle<br />
household<br />
#l 7.48 6.45<br />
#2 8.54<br />
#3<br />
#4<br />
#5<br />
Average 7.48 7.42<br />
Two-vehicle Three-vehicle Four-vehicle Five-vehicle<br />
household household household household<br />
6.74 7.01 7.35<br />
8.55 8.68 9.54<br />
12.25 11.36 11.89<br />
14.52 14.60<br />
17.81<br />
8.93 10.03 11.62<br />
Source:<br />
Generated from the Department of Transportation, Federal Highway Administration, Nationwide<br />
Personal Transportation Survey Public Use Files, Washington, DC, 1998. (Additional resources:<br />
www-cta.ornl.gov/npts)<br />
“Vehicles are ranked by descending annual miles driven.<br />
<strong>TRANSPORTATION</strong><strong>ENERGY</strong><strong>DATA</strong><strong>BOOK</strong>: <strong>EDITION</strong>~O-<strong>20</strong>00
I Historically,<br />
the data from the Nationwide Personal Transportation Study (NPTS) are based on<br />
estimates reported by survey respondents. For the 1995 survey, odometer data was also collected.<br />
These data indicate that respondents may overestimate the number of miles driven in a year.<br />
Table 11.11<br />
Average Annual Miles Per Household Vehicle by Vehicle Age<br />
Vehicle age 1983 1990 1995 1995<br />
(years) self-reported self-reported self-reported odometer<br />
Under 1 8,<strong>20</strong>0 19,600 15,900 15,600<br />
1 15,<strong>20</strong>0 16,800 12,<strong>20</strong>0 11,<strong>20</strong>0<br />
2 16,800 16,600 12,<strong>20</strong>0 11,300<br />
3 14,500 14,700 12,800 11,600<br />
4 13,000 13,600 13,<strong>20</strong>0 12,400<br />
5 12,100 12,900 13,500 12,700<br />
6 11,300 13,<strong>20</strong>0 14,100 12,900<br />
7 10,000 12,400 14,400 13,800<br />
8 9,800 12,600 15,500 14,800<br />
9 9,000 11,500 16,800 14,500<br />
10 and older<br />
All household<br />
7,300 9,<strong>20</strong>0 8,900 9,000<br />
vehicles<br />
10,400 12,500 12,<strong>20</strong>0 11,800 ’<br />
Source:<br />
Nationwide Personal Transportation Study-1983: D. Klinger and J. Richard<br />
Kuzmyak, COMSIS Corporation, Personal Travel in the United States, Volume<br />
1: 1983-84 Nationwide Personal Travel Studv, prepared <strong>for</strong> the U.S. Department<br />
of Transportation, Washington, DC, August 1986, Table 4-22, p.4-21. 1990:<br />
Generated from the 1990 Nationwide Personal Transportation Study Public Use<br />
Tape, March 1992. 1995: Generated from the Internet site: wwwcta.ornl.gov/npts.<br />
(Additional resources: www.fhwa.dot.gov, www.eia.doe.gov)<br />
Note:<br />
Data include all household vehicles, and have been rounded to the nearest hundred.<br />
11-13<br />
tl . .<br />
<strong>TRANSPORTATION</strong> <strong>ENERGY</strong> <strong>DATA</strong> <strong>BOOK</strong>: <strong>EDITION</strong> <strong>20</strong>-<strong>20</strong>00
11-14<br />
a. .<br />
I<br />
In 1995 the average journey-to-workspeed was faster (miles per hour increased to 34.6), but<br />
the travel time still increased, due to an increase in the average travel distance. Journeys-towork<br />
using public transportation continued to take twice as long as private transportation,<br />
though there is only a slight difference in travel distance.<br />
Year<br />
Table 11.12<br />
Journey-to-Work Statistics<br />
1983,1990, and 1995 NPTS”<br />
Private Public<br />
transportation transportation Other” Total<br />
Average travel time (minutes)’<br />
1983 17.6 39.8 10.6 18.2<br />
1990 19.1 41.1 12.4 19.6<br />
1995 <strong>20</strong>.1 42.0 18.8 <strong>20</strong>.7<br />
1983<br />
1990<br />
1995<br />
Average trip length (miles)<br />
8.9 11.8 1.4 8.5<br />
11.0 12.8 2.2 10.7<br />
11.8 12.9 8.2 11.6<br />
Average speed (miles per hour)<br />
1983 30.2 17.8 7.6 28.2<br />
1990* 34.7 18.2 7.6 33.3<br />
1995d 35.4 19.3 25.9 34.6<br />
Source:<br />
U.S. Department of Transportation, Federal Highway Administration, Nationwide<br />
Personal Transportation Study, Public Use Tapes, Washington, DC. Data <strong>for</strong><br />
1995 were generated from the Internet site www-cta.ornl.gov/npts.<br />
(Additional resources: www.fhwa.dot.gov, www-cta.ornl.gov/npts)<br />
“It is believed that the methodology changes in the 1995 NPTS did not affect journey-to-work trips; there<strong>for</strong>e,<br />
no adjustment is necessary.<br />
“Includes airplane, Amtrak, taxi, bicycle, school bus, moped, walk and other.<br />
‘Does not include time spent waiting <strong>for</strong> transportation.<br />
*Does not include segmented trips.<br />
<strong>TRANSPORTATION</strong><strong>ENERGY</strong><strong>DATA</strong>BOOIC <strong>EDITION</strong>~O-<strong>20</strong>00
I According<br />
to the U.S. Census data, the percentage ofworkers who car pooled has droppedfrom 19.7%<br />
in 1980 to 13.4% in 1990. Thepercent of workers usingpublic transit declinedfrom 6.4% to 5.3% during<br />
the same time period. The average travel time increased by 0.7 minutesfiom 1980 to 1990.<br />
Means of transportation<br />
Private vehicle<br />
Drove alone<br />
Car pooled<br />
Public transportation<br />
Bus or trolley bus”<br />
Streetcar or trolley carR<br />
Subway or elevated<br />
Railroad<br />
Ferryboat<br />
Taxicab<br />
Other means<br />
Motorcycle<br />
Bicycle<br />
Table 11.13<br />
Means of Transportation to Work, 1980 and 1990 Census<br />
1980 Census 1990Census<br />
Number Number<br />
of workers Percentage of workers Percentage<br />
81,258,496 84.1% 99,592,932 86.5%<br />
62,193,449 64.4% 84,215,298 73.2%<br />
19,065,047 19.7% 15,377,634 13.4%<br />
6,175,061 6.4% 6,069,589 5.3%<br />
3,924,787 4.1% 3,445,ooo 3.0%<br />
II b 78,130 0.1%<br />
1,528,852 1.6% 1,755,476 1.5%<br />
554,089 0.6% 574,052 0.5%<br />
b b 37,497 0.0%<br />
167,133 0.2% 179,434 0.2%<br />
703,273 0.7% 808,582 0.7%<br />
419,007 0.4% 237,404 0.2%<br />
468,348 0.5% 466,856 0.4%<br />
Walked only 5,413,248 5.6% 4,488,886 3.9%<br />
Worked at home 2,179,863 2.3% 3,406,025 3.0%<br />
Total workers 96.617.296 100.0% 115.070.274 100.0%<br />
Average travel time (minutes) 21.7 22.4<br />
Source:<br />
Data provided by the Journey-to-Work and Migration Statistics Branch, Population Division, U.S. Bureau of<br />
the Census. (Additional resources: www.census.gov)<br />
“This category was “Bus or streetcar” in 1980.<br />
’ Data are not available.<br />
11-15<br />
el . .<br />
<strong>TRANSPORTATION</strong> <strong>ENERGY</strong> <strong>DATA</strong> <strong>BOOK</strong>: <strong>EDITION</strong> <strong>20</strong>-<strong>20</strong>00
11-16<br />
I3 . .<br />
Table 11.14<br />
National and Metropolitan Area Comparisons of Journey-to-Work Statistics, 1990 Census<br />
Workers per household<br />
Workers per vehicle<br />
Average travel time (minutes)<br />
Commute length (percentage)<br />
Less than 15 minutes<br />
15-29 minutes<br />
3 O-39 minutes<br />
40-59 minutes<br />
60 minutes or more<br />
Mode (percentage)<br />
Drive alone<br />
Percentage car pooled<br />
Public transit<br />
Motorcycle<br />
Walk<br />
Bicycle<br />
Other<br />
Work at home<br />
Time workers leave home (percentage)<br />
5:00 AM-6.59 AM<br />
7:00 AM-g:29 AM<br />
8:30 AM-g:59 AM<br />
All other departures<br />
National Metropolitan areas”<br />
1.25 1.31<br />
0.76 0.82<br />
22.38 25.<strong>20</strong><br />
15.87% 11.45%<br />
51.64% 49.22%<br />
14.66% 17.48%<br />
9.01% 11.77%<br />
5.86% 7.52%<br />
73.19% 70.75%<br />
13.36% 12.69%<br />
5.27% 8.98%<br />
0.21% 0.21%<br />
3.90% 3.76%<br />
0.41% 0.43%<br />
0.70% 0.62%<br />
2.96% 2.57%<br />
26.04% 25.49%<br />
41.87% 42.44%<br />
10.28% 11.57%<br />
18.85% 17.93%<br />
Source:<br />
U. S. Department of Transportation, Volpe National Transportation Systems <strong>Center</strong>, Journey-to- Work<br />
Trends in theUnited States and its Major Metropolitan Area, 1960-1990, FHWA-PL-94-012,<br />
Cambridge, MA, 1994, p. 2-6. (Additional resources: www.census.gov)<br />
“Metropolitan areas over 1 million population. There were 39 such areas in the 1990 Census.<br />
<strong>TRANSPORTATION</strong><strong>ENERGY</strong><strong>DATA</strong>BOOIC EDI'IION~O-<strong>20</strong>00
1995 American Travel Survey<br />
The American Travel Survey (ATS) was conducted by the Bureau of Transportation Statistics to obtain<br />
in<strong>for</strong>mation about the long-distance travel of persons living in the United States. Approximately 80,000<br />
randomly selected households were interviewed <strong>for</strong> the survey, which collected in<strong>for</strong>mation about all trips<br />
of 100 miles or more, one-way, taken by household members in 1995. The ATS data provide detailed<br />
in<strong>for</strong>mation on state-to-state travel, as well as travel to and from metropolitan areas by mode of<br />
transportation.<br />
For additional in<strong>for</strong>mation about the American Travel Survey, contact the Bureau of Transportation<br />
Statistics at (<strong>20</strong>2) 366-3282 or visit the following Internet site: www.bts.gov/ats<br />
212<br />
133<br />
<strong>20</strong>8<br />
Figure 11.3 Long-Distance Trips by Destination, 1995<br />
I .oo I 1 Different state,different 1<br />
Person trips<br />
division, different region<br />
4-l Same state 1-b<br />
827<br />
Billion<br />
Person miles<br />
Source:<br />
U.S. Department of Transportation, Bureau of Transportation Statistics, 1995 American Travel ,S’urvey Profile,<br />
Washington, DC, October 1997, p. 2. (Additional resources: www.bts.gov/ats)<br />
Note:<br />
Definitions of divisions and regions are in Appendix C.<br />
408<br />
11-17<br />
If3 . .<br />
<strong>TRANSPORTATION</strong> <strong>ENERGY</strong> <strong>DATA</strong> <strong>BOOK</strong>: <strong>EDITION</strong> <strong>20</strong>-<strong>20</strong>00
.<br />
D.<br />
Principal means of transportation Business<br />
Table 11.15<br />
Long-Distance Trips” by Mode and Purpose, 1995<br />
Main purpose of trip<br />
Pleasure<br />
Visit friends<br />
or relatives Leisure Total<br />
Person trips (thousands)<br />
Personal<br />
business Total<br />
Personal use vehicle 151,697 283,153 254,186 537,339 124,791 813,858<br />
%<br />
s Commercial airplane 67,083 41,881 31,581 73,462 15,386 155,936<br />
;;’<br />
=! Intercity bus 286 1,830 690 2,519 439 3,244<br />
8 Charter or tour bus 1,281 1,198 9,253 10,451 2,5 14 14,247<br />
!2E Train 1,342 2,004 944 2,948 704 4,994<br />
2 Ship, boat, or ferry - 68 43 483 525 <strong>20</strong> 614<br />
Total 224,835 330,755 299,355 630,110 146,338 1,001,319<br />
Percentage<br />
Personal use vehicle 18.6 34.8 31.2 66.0 15.3 100.0<br />
. .<br />
g Commercial airplane 43.0 26.9 <strong>20</strong>.3 47.1 9.9 100.0<br />
:2 Intercity bus 8.8 56.4 21.3 77.7 13.5 100.0<br />
% Charter or tour bus 9.0 8.4 64.9 73.4 17.6 100.0<br />
Train 26.9 40.1 18.9 59.0 14.1 100.0<br />
8<br />
0”<br />
Ship, boat, or ferry 11.1 7.0 78.7 85.5 3.3 ‘100.0<br />
Total 22.5 33.0 29.9 62.9 14.6 100.0<br />
Source:<br />
U.S. Department of Transportation, Bureau of Transportation Statistics, 1995 American TravelSurvey Profile, Washington, DC, October 1997, p. 13. (Additional<br />
resources: www.bts.govlats)<br />
“A long-distance trip is any trip of 100 miles or more, one way.
.<br />
D.<br />
250<br />
w<br />
.<br />
I50-<br />
.<br />
IOO-<br />
.<br />
50-<br />
.<br />
Less than<br />
300 miles<br />
Figure 11.4. Long-Distance Household Trips by Mode and Trip Distance, 1995<br />
Other<br />
0 Commercial<br />
airplane<br />
8<br />
Personal use<br />
7 Ezi vehicle<br />
300-499 500-999 I ,ooo- 1,999<br />
miles miles miles<br />
Round trip distance<br />
2,000 or<br />
miles<br />
Source:<br />
U.S. Department of Transportation, Bureau of Transportation Statistics, 1995 American Travel Survey Profile, Washington, DC, October 1997, p. 3.<br />
(Additional resources: www.bts.gov/ats)<br />
I
.<br />
D.<br />
90-<br />
IO-<br />
O-<br />
Figure 11.5. Shares of Long-Distance Person Trips by Mode and Household Income, lYY5<br />
36%<br />
Intercity Charter or<br />
bus tour bus<br />
.<br />
29%<br />
j 45%<br />
39%<br />
m<br />
v<br />
&<br />
Personal<br />
-%-.<br />
66% 52%<br />
25%<br />
:,<br />
/IO%/<br />
//////:: ?z<br />
//,,,,/<br />
Train Commercial<br />
use vehicle airplane<br />
Ship, boat,<br />
or ferry<br />
Households<br />
Source:<br />
U.S. Department of Transportation, Bureau OfTransportation Statistics, 1995 American Travel Survey Profile, Washington, DC, October 1997, p. 8.<br />
U.S. Department of Commerce, Bureau of the Census, Statistical Abstract ofthe United States, 117” Edition, Washington, DC, 1997, p. 465.<br />
(Additional resources: www.bts.gov/ats, www.census.gov)<br />
$50,000<br />
or more<br />
$25,000 to<br />
$50,000<br />
Less than<br />
$25,000
Source<br />
Table 12.1<br />
Table 12.2<br />
Table 12.10<br />
Table 12.11<br />
Table 12.4<br />
Table 12.7<br />
Table 12.1<br />
Table 12.2<br />
Table 12.10<br />
Table 12.11<br />
Table 12.4<br />
Table 12.7<br />
Chapter 12<br />
Nonhighway Modes<br />
Summary Statistics from Tables in this Chapter<br />
Passenger-miles, 1998<br />
Domestic and international air carrier<br />
General aviation<br />
Am tralc<br />
Transit rail<br />
Freight ton-miles, 1998<br />
Domestic waterborne commerce<br />
Class I railroad<br />
Passenger energy use, 1998<br />
Domestic and international air carrier<br />
General aviation<br />
Am tralc energy use<br />
Transit rail<br />
Freight energy use, 1998<br />
Domestic waterborne commerce<br />
Class I railroad<br />
<strong>TRANSPORTATION</strong> <strong>ENERGY</strong><strong>DATA</strong>BOOIC <strong>EDITION</strong>~O-<strong>20</strong>00<br />
(millions)<br />
636,410<br />
13,300<br />
5,325<br />
13,402<br />
(millions)<br />
673,000<br />
1,3 76,802<br />
(trillion Btus)<br />
2,550.l<br />
147.4<br />
13.1<br />
43.1<br />
(trillion Btus)<br />
293.1<br />
502.0<br />
12-1
Table 12.1<br />
Summary Statistics <strong>for</strong> U.S. Domestic and International Certificated Route Air Carriers (Combined Totals), 1970-98”<br />
Year<br />
Revenue<br />
aircraft-miles<br />
(millions)<br />
Average<br />
passenger trip<br />
length” (miles)<br />
Revenue<br />
passenger-miles<br />
(millions)<br />
Available<br />
seat-miles<br />
(millions)<br />
Available<br />
seats per<br />
aircraft’<br />
Passenger<br />
load factor<br />
(percentage)d<br />
Revenue cargo<br />
ton-miles<br />
(millions)<br />
Energy use<br />
(trillion Btu)<br />
Percent domestic of<br />
total energy use<br />
(percentage)<br />
1970<br />
1975<br />
1976<br />
1977<br />
1978<br />
1979<br />
1980<br />
1981<br />
1982<br />
1983<br />
1984<br />
1985<br />
1986<br />
1987<br />
1988<br />
1989<br />
1990<br />
1991<br />
1992<br />
1993<br />
1994<br />
1995<br />
1996<br />
1997<br />
1998<br />
2,383<br />
2,241<br />
2,3<strong>20</strong><br />
2,418<br />
2,608<br />
2,859<br />
2,924<br />
2,703<br />
2,804<br />
2,923<br />
3,264<br />
3,462<br />
3,873<br />
4,182<br />
4,355<br />
4,442<br />
4,724<br />
4,661<br />
4,899<br />
5,118<br />
5,360<br />
5,627<br />
5,855<br />
6,025<br />
6,222<br />
678<br />
698<br />
704<br />
704<br />
719<br />
714<br />
736<br />
749<br />
766<br />
765<br />
759<br />
758<br />
767<br />
779<br />
786<br />
792<br />
803<br />
806<br />
806<br />
799<br />
787<br />
791<br />
802<br />
814<br />
813<br />
131,719 r<br />
173,324<br />
191,823<br />
<strong>20</strong>6,082<br />
236,998<br />
269,719<br />
267,722<br />
260,063<br />
272,435<br />
295,144<br />
3 19,504<br />
351,073<br />
378,923<br />
417,830<br />
437,649<br />
447,480<br />
472,236<br />
463,296<br />
493,715<br />
505,996<br />
537,506<br />
558,757<br />
596,164<br />
619,969<br />
636,410<br />
264,904 f<br />
315,823<br />
338,349<br />
361,172<br />
381,113<br />
425,411<br />
448,479<br />
438,778<br />
455,938<br />
480,977<br />
534,104<br />
565,677<br />
623,073<br />
670,871<br />
696,337<br />
703,888<br />
753,211<br />
738,030<br />
772,869<br />
793,959<br />
809,240<br />
845,012<br />
859,7<strong>20</strong><br />
880,607<br />
899,115<br />
111<br />
135<br />
139<br />
143<br />
147<br />
146<br />
148<br />
157<br />
157<br />
159<br />
164<br />
163<br />
161<br />
160<br />
160<br />
158<br />
159<br />
158<br />
158<br />
155<br />
151<br />
150<br />
147<br />
146<br />
145<br />
49.7%’<br />
54.9%<br />
56.7%<br />
57.1%<br />
62.2%<br />
63.4%<br />
59.7%<br />
59.3%<br />
59.8%<br />
61.4%<br />
59.8%<br />
62.1%<br />
60.8%<br />
62.3%<br />
62.9%<br />
63.6%<br />
62.7%<br />
62.8%<br />
63.9%<br />
63.7%<br />
66.4%<br />
66.1%<br />
69.3%<br />
70.4%<br />
70.8%<br />
4,994<br />
5,944<br />
6,222<br />
6,587<br />
7,395<br />
7,580<br />
7,515<br />
7,917<br />
7,807<br />
8,497<br />
9,328<br />
9,048<br />
10,987<br />
13,130<br />
14,633<br />
16,347<br />
16,411<br />
16,149<br />
17,306<br />
19,083<br />
21,773<br />
23,375<br />
24,892<br />
27,610<br />
28,015<br />
1,363.4<br />
1,283.4<br />
1,324.1<br />
1,386.2<br />
1,436.3<br />
1,534.g<br />
1,489.6<br />
1,429.3<br />
1,406.6<br />
1,439.2<br />
1,607.4<br />
1,701.5<br />
1,847.l<br />
1,945.4<br />
2,049.4<br />
2,087.4<br />
2,191.3<br />
2,069.2<br />
2,144.2<br />
2,168.g<br />
2,249.5<br />
2,310.4<br />
2,396.6<br />
2,494.5<br />
2,550.l<br />
P<br />
E<br />
B<br />
e<br />
82.0%<br />
82.5%<br />
82.4%<br />
g<br />
81.1%<br />
84.4%<br />
E<br />
P<br />
81.4%<br />
80.4%<br />
78.5%<br />
77.0%<br />
75.9%<br />
74.5%<br />
74.1%<br />
74.4%<br />
74.3%<br />
74.0%<br />
74.0%<br />
73.4%<br />
72.8%<br />
Average nmunl percentage change<br />
1970-98 3.5% 0.7% 5.8% 4.5% 1 .O% 6.4% 2.3%<br />
1988-98<br />
Source:<br />
3.6% 0.3% 3.8% 2.6% -1.0% 6.7% 2.2%<br />
U.S. Department of Transportation, Bureau of Transportation Statistics, Air Carrier Trnffic Statistics Monthly, December 19980997, Washington, DC, pp. l-2, and annual.<br />
1970-81 Ener,7 Use - Department of Transportation, Civil Aeronautics Board, Fuel Cost and Consumption, Washington, DC, 1981, and annual.<br />
1982-98 Energy Use - Department of Transportation, Research and Special Programs Administration, “Fuel Cost and Consumption Tables,” Washington, DC, monthly. Annual totals are derived<br />
by summing monthly totals <strong>for</strong> domestic and international air carriers. (Additional resources: wvw.bts.gov, www.faa.gov)<br />
aData are <strong>for</strong> all U.S. air carriers reporting on Form 41.<br />
‘Scheduled services of domestic operations only. The average passenger trip length <strong>for</strong> international operations is more than three and a half times longer than <strong>for</strong> domestic operations.<br />
‘Available seats per aircraft is calculated as the ratio of available seat-miles to revenue aircraft-miles.<br />
dPassenger load factor is calculated as the ratio of revenue passenger-miles to available seat-miles <strong>for</strong> scheduled and nonscheduled services.<br />
‘Energy use includes fuel purchased abroad <strong>for</strong> international flights.<br />
Scheduled services only.<br />
‘Data are not available.
Calendar year<br />
1970<br />
1971<br />
1972<br />
1973<br />
1974<br />
1975<br />
1976<br />
1977<br />
1978<br />
1979<br />
1980<br />
1981<br />
1982<br />
1983<br />
1984<br />
1985<br />
1986<br />
1987<br />
1988<br />
1989<br />
1990<br />
1991<br />
1992<br />
1993<br />
1994<br />
1995<br />
1996<br />
1997<br />
1998<br />
1970-98<br />
1988-98<br />
Table 12.2<br />
Summary Statistics <strong>for</strong> General Aviation, 1970-98<br />
Total number Hours flown Intercity passenger travel Energy use<br />
of aircraft (thousands) (billion passenger-miles) (trillion btu)<br />
131,700” 26,030” 9.1<br />
131,100” 25,512” 9.2<br />
145,000” 26,974” 10.0<br />
148,000” 28,599 10.7<br />
161,502 29,758 11.2<br />
168,475 30,298 11.4<br />
177,964 31,950 12.1<br />
184,294 33,679 12.8<br />
199,178 36,844 14.1<br />
210,339 40,432 15.5<br />
211,045 41,016 14.7<br />
213,226 40,704 14.6<br />
<strong>20</strong>9,779 36,457 13.1<br />
213,293 35,249 12.7<br />
2<strong>20</strong>,943 36,119 13.0<br />
196,500 31,456 12.3<br />
<strong>20</strong>5,300 31,782 12.4<br />
<strong>20</strong>2,700 30,883 12.1<br />
196,<strong>20</strong>0 31,114 12.6<br />
<strong>20</strong>5,000 32,332 13.1<br />
198,000 32,096 13.0<br />
196,874 30,490 12.1<br />
185,650 27,47 1 10.8<br />
177,1<strong>20</strong> 24,45 5 9.9<br />
172,935 24,092 9.8<br />
188,089 26,612 10.4<br />
191,129 26,909 10.6<br />
192,414 27,713 12.5<br />
<strong>20</strong>4,710 28,100 13.3<br />
Average annualpercentage change<br />
1.6% 0.3% 1.4%<br />
0.4% -1.0% 0.5%<br />
94.4<br />
91.6<br />
103.4<br />
90.4<br />
101.4<br />
121.5<br />
130.3<br />
149.7<br />
159.4<br />
167.2<br />
169.0<br />
162.4<br />
170.5<br />
143.9<br />
148.9<br />
144.0<br />
148.0<br />
139.1<br />
148.6<br />
134.0<br />
131.9<br />
1<strong>20</strong>.4<br />
104.7<br />
97.5<br />
95.3<br />
106.6<br />
111.1<br />
121.1<br />
147.4<br />
1.6%<br />
-0.1%<br />
Sources:<br />
Intercity passenger-miles - Eno Foundation <strong>for</strong> Transportation, Transportation in America 1999,<br />
Sixteenth edition, Lansdowne, VA, <strong>20</strong>00, p. 47, and annual.<br />
All other- U.S. Department of Transportation, Federal Aviation Administration, General Aviation<br />
Activity and Avionics Survey: Calendar Year 1998, pp. 1-7, 1-16, 5-2, 5-3, 5-4, and annual.<br />
(Additional resources: www.faa.gov)<br />
‘Active fixed-wing general aviation aircraft only.<br />
bInclude rotocraft.<br />
<strong>TRANSPORTATION</strong><strong>ENERGY</strong><strong>DATA</strong>BOOIC <strong>EDITION</strong>~O-<strong>20</strong>00<br />
12-3
124<br />
In the early seventies, domestic waterborne commerce accounted<strong>for</strong> over GO’% of total tonnage, but<br />
by 1994 <strong>for</strong>eign tonnagegrew to more than halfof all waterborne tonnage and has continued to grow<br />
each year since.<br />
Table 12.3<br />
Tonnage Statistics <strong>for</strong> Domestic and<br />
International Waterborne Commerce, 1970-98<br />
(million tons shipped)<br />
Foreign and Percent domestic<br />
Year domestic total Foreign total” Domestic totalb of total<br />
1970 1,532 581 951 62.1%<br />
1971 1,513 566 947 62.6%<br />
1972 1,617 630 987 61.0%<br />
1973 1,762 767 994 56.4%<br />
1974 1,747 764 983 56.3%<br />
1975 1,695 749 946 55.8%<br />
1976 1,835 856 979 53.4%<br />
1977 1,908 935 973 51.0%<br />
1978 2,021 946 1,075 53.2%<br />
1979 2,073 993 1,080 52.1%<br />
1980 1,999 921 1,077 53.9%<br />
1981 1,942 887 1,054 54.3%<br />
1982 1,777 8<strong>20</strong> 957 53.9%<br />
1983 1,708 751 957 56.0%<br />
1984 1,836 803 1,033 56.3%<br />
1985 1,788 774 1,014 56.7%<br />
1986 1,874 837 1,037 55.3%<br />
1987 1,967 891 1,076 54.7%<br />
1988 2,088 976 1,112 53.3%<br />
1989 2,140 1,038 1,103 51.5%<br />
1990 2,164 1,042 1,122 51.8%<br />
1991 2,092 1,014 1,079 51.6%<br />
1992 2,132 1,037 1,095 51.4%<br />
1993 2,128 1,060 1,068 50.2%<br />
1994 2,215 1,116 1,099 49.6%<br />
1995 2,240 1,147 1,093 48.8%<br />
1996 2,284 1,183 1,101 48.2%<br />
1997 2,334 1,221 1,113 47.7%<br />
1998 2,339 1,245 1,094 46.8%<br />
Average annual percentage change<br />
1970-98 1.5% 2.8% 0.5%<br />
1988-98 1.1% 2.5% -0.2%<br />
Source:<br />
U.S. Department of the Army, Corps of Engineers, Waterborne Commerce of the United States,<br />
CaZendar Year 1998, Part 5: ,National Summaries, New Orleans, Louisiana, <strong>20</strong>00, Table l-l,<br />
p. 1-3, and annual. (Additional resources: www.wrc-ndc.usace.army.mil/ndc)<br />
"All movements between the U.S. and <strong>for</strong>eign countries and between Puerto Rico and the Virgin Islands<br />
and <strong>for</strong>eign countries are classified as <strong>for</strong>eign trade.<br />
“All movements between U.S. ports, continental and noncontiguous, and on the inland rivers, canals,<br />
and connecting channels of the U.S., Puerto Rico, and the Virgin Islands, excluding the Panama Canal.<br />
Beginning in 1996, fish was excluded <strong>for</strong> internal and intra port domestic traffic.<br />
<strong>TRANSPORTATION</strong><strong>ENERGY</strong><strong>DATA</strong><strong>BOOK</strong>: <strong>EDITION</strong>~O-<strong>20</strong>00
Table 12.4<br />
Summary Statistics <strong>for</strong> Domestic Waterborne Commerce, 1970-98<br />
Ton-<br />
Average<br />
length of Energy<br />
Number of miles Tons shipped” haul intensity Energy use<br />
Year vessels” (billions) (millions) (miles) (Btu/ton-mile) (trillion Btu)<br />
1970 25,832 596 949 628.2 545 324.8<br />
1971 26,063 593 944 628.1<br />
506 300.0<br />
1972 27,347 604 985 612.8<br />
522 315.1<br />
1973 28,43 1 585 990 590.7<br />
576 337.0<br />
1974 29,328 586 979 599.1<br />
483 283.3<br />
1975 31,666 566 944 599.9<br />
549 311.0<br />
1976 33,<strong>20</strong>4 592 976 606.3<br />
468 277.3<br />
1977 35,333 599 969 618.0<br />
458 274.3<br />
1978 35,723 827 1,072 771.6<br />
383 316.6<br />
1979 36,264 829 1,076 770.0<br />
457 378.7<br />
1980 38,792 922 1,074 856.4<br />
358 329.8<br />
1981 42,079 9 2 9 1,051 884.0<br />
360 334.5<br />
1982 42,079 886 954 929.0<br />
310 274.9<br />
1983 41,784 9<strong>20</strong> 953 964.6<br />
319 293.7<br />
1984 41,784 888 1,029 862.5<br />
346 307.3<br />
1985 41,672 893 1,011 883.5 446 398.6<br />
1986 40,308 873 1,033 845.3<br />
463 404.0<br />
1987 40,000 895 1,072 835.0<br />
402 370.7<br />
1988 39,192 890 1,106 804.3<br />
361 321.3<br />
1989 39,<strong>20</strong>9 816 1,097 743.2<br />
403 328.6<br />
1990 39,233 834 1,118 745.7<br />
388 323.2<br />
1991 39,233 848 1,074 789.9<br />
386 327.5<br />
1992 39,210 857 1,090 785.7<br />
398 341.0<br />
1993 39,064 790 1,063 742.7<br />
389 307.0<br />
1994 39,064 815 1,093 745.5<br />
369 300.7<br />
1995 39,641 808 1,086 743.6<br />
374 302.2<br />
1996 41,104 765 1,093 699.4<br />
412 314.9<br />
1997 41,419 707 1,106 639.5<br />
415 293.2<br />
1998 42,032 673 1,087 619.0<br />
436 293.1<br />
Average annual percentage change<br />
1970-98 1.8% 0.4% 0.5% -0.1% -0.8% -0.4%<br />
1988-98<br />
Source:<br />
0.7% -2.8% -0.2% -2.6% 1.9% -0.9%<br />
Number of vessels -<br />
1970-92, 1995-98 - U.S. Department of the Army, Corps of Engineers, “Summary of U.S. Flag<br />
Passenger and cargo vessels, 1998,” New Orleans, LA, <strong>20</strong>00, and annual.<br />
1993-94 - U.S. Dept of the Army, Corps of Engineers, The U.S. Waterway System-Facts,<br />
Navigation Data <strong>Center</strong>, New Orleans, Louisiana, January 1996.<br />
Ton-miles, tons shipped, average length of haul - U.S. Department of the Army, Corps of Engineers,<br />
Waterborne Commerce qf the United States, Calendur Year 1998 Part 5: National Summaries,<br />
New Orleans, LA, <strong>20</strong>00, Table 1-4, pp. 1-6, 1-7, and annual.<br />
Energy use - See Appendix A <strong>for</strong> Table 2.5.<br />
(Additional resources: www.wrc-ndc.usace.army.millndc)<br />
“Grand total <strong>for</strong> self-propelled and non-self-propelled.<br />
“These figures are not consistent with the figures on Table 6.4 because intra-territory tons are not<br />
included in this table. Intra-territory traffic is traffic between ports in Puerto Rico and the Virgin Islands.<br />
<strong>TRANSPORTATION</strong><strong>ENERGY</strong><strong>DATA</strong>BOOIC <strong>EDITION</strong>~O-<strong>20</strong>00<br />
12-5
Fifty-six percent of all domestic marine cargo in I998 were ener,ay-relatedproducts (petroleum, coal, coke). The majority ofthe ener&-relatedproducts were<br />
shipped internally and locally (64O%). Barge traffic accounted<strong>for</strong> 96% of all internal and local waterborne commerce.<br />
Commodity class<br />
Petroleum and products<br />
Chemicals and related products<br />
Crude materials<br />
Coal and coke<br />
Primary manufactured goods<br />
Food and farm products<br />
Manufactured equipment<br />
Waste and scrap<br />
Unknown<br />
Total<br />
Barge traffic (million tons)<br />
Table 12.5<br />
Breakdown of Domestic Marine Cargo by Commodity Class, 1998<br />
Coastwise<br />
Tons Average<br />
shipped haulb<br />
(millions) (miles)<br />
177<br />
15<br />
19<br />
15<br />
7<br />
7<br />
9<br />
c<br />
250<br />
115<br />
1,300<br />
2,064<br />
618<br />
659<br />
680<br />
1,696<br />
1,655<br />
667<br />
2,133<br />
1,261<br />
Lakewise<br />
Tons Average<br />
shipped haulb<br />
(millions) (miles)<br />
2<br />
c<br />
94<br />
22<br />
3<br />
c<br />
c<br />
122<br />
14<br />
291<br />
322<br />
511<br />
5 2 5<br />
295<br />
929<br />
c<br />
0 0<br />
c<br />
504<br />
Internal and local<br />
Tons Average<br />
shipped haulb<br />
(millions) (miles)<br />
196<br />
62<br />
133<br />
192<br />
30<br />
84<br />
12<br />
5<br />
<strong>20</strong>0<br />
492<br />
34%<br />
365<br />
865<br />
993<br />
93<br />
68<br />
c<br />
416<br />
Total domestic?<br />
Tons Average<br />
shipped haulb<br />
(millions) Percentage (miles)<br />
Percentage by barge 46.0% 11.1% 95.7% 74.8%<br />
Source:<br />
U.S. Department of the Army, Corps of Engineers, Wuterborne Commerce of the United States, Calendar Year 1998, Part 5: National Summaries, New Orleans,<br />
Louisiana, <strong>20</strong>00, Tables 2-1,2-2, and 2-3, pp. 2-l-2-8, and annual.<br />
(Additional resources: www.wrc-ndc.usace.army.milindc)<br />
Note:<br />
Coastwise applies to domestic traffic receiving a carriage over the ocean or between the Great Lakes ports and seacoast ports when having a carriage over the<br />
ocean. Lakewise applies to traffic between United States ports on the Great Lakes. Internal applies to traffic between ports or landings wherein the entire<br />
movement takes place on inland waterways. Local applies to movements of freight within the confines of a port.<br />
“Does not include ii-ma-territory tons.<br />
bCalculated as ton-miles divided by tons shipped<br />
CNegligible.<br />
715<br />
684<br />
376<br />
78<br />
246<br />
229<br />
41<br />
92<br />
21<br />
1,087<br />
813<br />
34.6%<br />
7.1%<br />
22.6%<br />
21.1%<br />
3.8%<br />
8.4%<br />
1.9%<br />
0.5%<br />
0.0%<br />
100.0%<br />
7<strong>20</strong><br />
800<br />
431<br />
400<br />
784<br />
1,047<br />
738<br />
68<br />
1,684<br />
6<strong>20</strong>
I<br />
The Interstate Commerce Commission designates Class I railroads on the basis of annual gross<br />
revenues. In 1998, nine railroads were given this classification.<br />
Railroad<br />
Table 12.6<br />
Class I Railroad Freight Systems in the United States<br />
Ranked by Revenue Ton-Miles, 1998<br />
Revenue ton-miles<br />
(billions) Percent<br />
Burlington Northern and Sante Fe Railway Company 469 34.1%<br />
Union Pacific Railroad Company 432 31.4%<br />
CSX Transportation 166 12.1%<br />
Norfolk Southern Corporation 133 9.7%<br />
Consolidated Rail Corporation (Conrail) 101 7.3%<br />
Illinois Central Railroad Company 23 1.7%<br />
Kansas City Southern Railway Company 22 1.6%<br />
Soo Line Railroad Company <strong>20</strong> 1.5%<br />
Grand Trunk Western Railroad Inc. 9 0.7%<br />
Total<br />
1,375 100.0%<br />
Source:<br />
Association of American Railroads, Railroad Facts, 1999 Edition, Washington, DC, October 1999,<br />
p. 66. (Additional resources: www.aar.org)<br />
<strong>TRANSPORTATION</strong><strong>ENERGY</strong><strong>DATA</strong>BOOIC: EINTION~O-<strong>20</strong>00<br />
I<br />
12-7
Table 12.7<br />
Summary’Statistics <strong>for</strong> Class I Freight Railroads, 1970-98<br />
Number of Number of Tons Average Revenue Enerm --<br />
locomotives freight cars Train-miles Car-miles originated’ length ofhaul ton-miles intensity Energy use<br />
Year i n servicea (thousands)b (millions) (millions) (millions) (miles) (millions) (Btiton-mile) (trillion Btu)<br />
1970 27.077d 1,424 427<br />
29,890 1,485 515<br />
764,809<br />
691 528.1<br />
1971 27;160d 1,422 430 29,181 1,391 507<br />
739,723<br />
717 530.2<br />
1972 27,044 1,411 451 30,309 1,448<br />
511<br />
776,746<br />
714 554.4<br />
1973 27,438 1,395 469 31,248 1,532<br />
531<br />
851,809<br />
677 577.1<br />
1974 27,627 1,375 469 30,719 1,531 527<br />
850,961<br />
681 579.1<br />
1975 27,855 1,359 403 27,656 1,395<br />
541<br />
754,252<br />
687 518.3<br />
1976 27,233 1,332 425 28,530 1,407 540<br />
794,059<br />
680 540.3<br />
1977 27,298 1,287 428 28,749 1,395 549<br />
826,292<br />
669 552.7<br />
1978 26,959 1,226 433 29,076 1,390 617<br />
858,105<br />
641 550.4<br />
1979 27,660 1,217 438 29,436 1,502<br />
611<br />
913,669<br />
618 564.8<br />
1980 28,094 l,lG8 428 29,277 1,492 616<br />
918,621<br />
597 548.7<br />
1981 27,421 1,111 408 27,968 1,453 626<br />
910,169<br />
572 521.0<br />
1982 26,795 1,039 345 23,952 1,269 629<br />
797,759<br />
553 440.8<br />
1983 25,448 1,007 346 24,358 1,293<br />
641<br />
828,275<br />
525 435.1<br />
1984 24,117 948 369 26,409 1,429<br />
645<br />
921,542<br />
510 470.0<br />
1985 22,548 867 347 24,9<strong>20</strong> 1,3<strong>20</strong> 664<br />
876,984<br />
497 436.1<br />
1986 <strong>20</strong>,790 799 347 24,414 1,306 664<br />
867,722<br />
486 421.5<br />
1987 19,647 749 361 25,627 1,372 688<br />
943,747<br />
456 430.3<br />
1988 19,364 725 379 26,339 1,430 697<br />
996,182<br />
443 441.4<br />
1989 19,015 682 383 26,196 1,403<br />
723 1,013,841<br />
437 442.6<br />
1990 18,835 659 380 26,159 1,425 726 1,033,969<br />
4<strong>20</strong> 434.7<br />
1991 18,344 633 375 25,628 1,383<br />
751 1,038,875<br />
391 405.8<br />
1992 18,004 605 390 26,128 1,399<br />
763 1,066,781<br />
393 419.2<br />
1993 18,161 587 405 26,883 1,397 794 1,109,309<br />
389 * 431.6<br />
1994 18,505 591 441 28,485 1,470 817 1,<strong>20</strong>0,701<br />
388 465.4<br />
1995 18,812 583 458 30,383 1,550<br />
843 1,305,688<br />
372 485.9<br />
1996 19,269 571 469 31,715 1,611 842 1,355,975<br />
368 499.4<br />
1997 19,684 568 475 31,660 1,585<br />
851 1,348,926<br />
370 499.7<br />
1998 <strong>20</strong>,26 1 576 475 32,657 1,649<br />
835 1,376,802<br />
365 502.0<br />
Average annualpercentage change<br />
1970-98 -1.0% -3.2% 0.4%<br />
0.3% 0.4% 1.7% 2.1% -2.3% -0.2%<br />
1988-98<br />
Source:<br />
0.5% -2.3% 2.3% 2.2% 1.4% 1.8% 3.3% -1.9%<br />
1.3%<br />
Association of American Railroads, Railroad Facts, 1999 Edition, Washington, DC, October 1999, pp. 27,28,33, 34,36,48, 50, 60.<br />
(Additional resources: www.aar.org)<br />
aDoes not include self-powered units. From 1972 to 1979, the number of locomotives used in Amtrak passenger operations are subtracted from the total locomotives used<br />
in passenger and freight service to calculate the number of Class I locomotives in service.<br />
bDoes not include private or shipper-owned cars.<br />
‘Tons originated is a more accurate representation of total tonnage than revenue tons. Revenue tons often produces double-counting of loads switched between rail companies.<br />
dData represent total locomotives used in freight and passenger service. Separate estimates are not available.
I<br />
The “other” category, which consists primarily of intermodal trufjc, has grown 126% in carloacls from<br />
1974 to 1998. Coal now accounts <strong>for</strong> one quarter of all carloacls.<br />
Table 12.8<br />
Railroad Revenue Carloads by Commodity Group, 1974 and 1998<br />
Carloads<br />
(thousands) Percent distribution per~~~~%ge<br />
Commodity group 1974 1998 1974 1998 1974198<br />
Coal 4,544 7,027<br />
Farm products 3,021 1,404<br />
Chemicals and allied products 1,464 1,680<br />
Nonmetallic minerals 821 1,256<br />
Food and kindred products 1,777 1,282<br />
Lumber and wood products 1,930 645<br />
Metallic ores 1,910 311<br />
Stone, clay and glass 2,428 475<br />
Pulp, paper, and allied products 1,180 547<br />
Petroleum products 877 483<br />
Primary metal products 1,366 671<br />
Waste and scrap material 889 581<br />
Transportation equipment 1,126 1,546<br />
Others 3,451 7,797<br />
17.0%<br />
11.3%<br />
5.5%<br />
3.1%<br />
6.6%<br />
7.2%<br />
7.1%<br />
9.1%<br />
4.4%<br />
3.3%<br />
5.1%<br />
3.3%<br />
4.2%<br />
12.9%<br />
27.3%<br />
5.5%<br />
6.5%<br />
4.9%<br />
5.0%<br />
2.5%<br />
1.2%<br />
1.8%<br />
2.1%<br />
1.9%<br />
2.6%<br />
2.3%<br />
6.0%<br />
30.3%<br />
54.6%<br />
-53.5%<br />
14.8%<br />
53.0%<br />
-27.9%<br />
-66.6%<br />
-83.7%<br />
-80.4%<br />
-53.6%<br />
-44.9%<br />
-50.9%<br />
-34.6%<br />
37.3%<br />
125.9%<br />
Total 26,784 25,705 100.0% 100.0% -4.0%<br />
Source:<br />
1974 - Association of American Railroads, Railroad Facts, 1976 Edition, Washington, DC, 1975, p. 26.<br />
1997 - Association of American Railroads, Railroad Facts, 1999 Edition, Washington, DC,<br />
October 1999, p. 25.<br />
(Additional resources: www.aar.org)<br />
<strong>TRANSPORTATION</strong><strong>ENERGY</strong><strong>DATA</strong>BOOIC <strong>EDITION</strong>~O-<strong>20</strong>00<br />
12-9
12-10<br />
The number of trailers and containers moved by r&roads has increased more than four-fold<br />
from 1965 to 1998. Containerization has increased in recent years, evidenced by the 135%<br />
increase in the number qf containers from 1988 to 1997. According to the 1997 Commodity<br />
Flow Survey, 5% of all freight ton-miles are rail intermodal shipments (trucldrail or<br />
rail/water). See Table 8. I1 <strong>for</strong> details.<br />
Year<br />
1965<br />
1970<br />
1975<br />
1980<br />
1981<br />
1982<br />
1983<br />
1984<br />
1985<br />
1986<br />
1987<br />
1988<br />
1989<br />
1990<br />
1991<br />
1992<br />
1993<br />
1994<br />
1995<br />
1996”<br />
1997”<br />
1998”<br />
Table 12.9<br />
Intermodal Rail Traffic, 1965-98<br />
Trailers &<br />
containers Trailers Containers<br />
1,664,929 a<br />
a<br />
2,363,<strong>20</strong>0 a<br />
1<br />
2,238,117 a n<br />
3,059,402 a a<br />
3,150,522 3 a<br />
3,396,973 a n<br />
4,090,07X n a<br />
4,565,743 n n<br />
4,590,952 a a<br />
4,997,229 a a<br />
5,503,819 n a<br />
5,779,547 3,481,0<strong>20</strong> 2,298,527<br />
5,987,355 3,496,262 2,491,093<br />
6,<strong>20</strong>6,782 3,451,953 2,754,829<br />
6,246,134 3,<strong>20</strong>1,560 3,044,574<br />
6,627,841 3,264,597 3,363,244<br />
7,156,628 3,464,126 3,692,502<br />
8,128,228 3,752,502 4,375,726<br />
8,070,309 3,519,664 4,550,645<br />
8,153,942 3,3<strong>20</strong>,312 4,833,630<br />
8,695,860 3,453,081 5,242,779<br />
8,772,663 3,353,032 5,419,631<br />
Average annualpercentage change<br />
1965-98 5.2% a 7<br />
1988-98 4.3% -0.4% 9.0%<br />
Source:<br />
Association of American Railroads, Railroad Facts,<br />
1999 edition, Washington, DC, October 1999 p.26.<br />
(Additional resources: www.aar.org)<br />
a Data are not available.<br />
’ The Grand Trunk Western Railroad and the Soo Line Railroad Company data are<br />
excluded.<br />
<strong>TRANSPORTATION</strong> <strong>ENERGY</strong> <strong>DATA</strong> <strong>BOOK</strong>: <strong>EDITION</strong> <strong>20</strong>-<strong>20</strong>00
Year<br />
Number of<br />
locomotives<br />
in service<br />
Table 12.10<br />
Summary Statistics <strong>for</strong> the National Railroad Passenger Corporation (Amtrak), 1971-98<br />
Revenue Energy intensity<br />
Number of Train-miles Car-miles passenger-miles Average trip length (Btu per revenue<br />
passenger cars (thousands) (thousands) (millions) (miles) passenger-mile)<br />
Ener,7 use<br />
(trillion Btu)<br />
1971<br />
1972<br />
285<br />
1,165<br />
1,571<br />
16,537<br />
26,302<br />
140,147<br />
213,261<br />
1,993<br />
3,039<br />
188<br />
183<br />
a<br />
1973<br />
352<br />
1,777 27,151<br />
239,775 3,807<br />
224<br />
3,756 14.3<br />
1974<br />
457<br />
1,848 29,538<br />
260,060 4,259<br />
233<br />
3,240 13.8<br />
1975<br />
355<br />
1,913 30,166<br />
253,898 3,753<br />
224<br />
3,677 13.8<br />
1976<br />
379<br />
2,062 30,885<br />
263,589 4,268<br />
229<br />
3,397 14.5<br />
1977<br />
369<br />
2,154 33,<strong>20</strong>0<br />
261,325 4,<strong>20</strong>4<br />
221<br />
3,568 15.0<br />
1978<br />
441<br />
2,084 32,45 1<br />
255,214 4,154<br />
217<br />
3,683 15.3<br />
1979<br />
437<br />
2,026 31,379<br />
255,129 4,867<br />
226<br />
3,472 16.9<br />
1980<br />
448<br />
2,128 29,487<br />
235,235 4,503<br />
217<br />
3,176 14.3<br />
1981<br />
398<br />
1,830 30,380<br />
222,753 4,397<br />
226<br />
2,979 13.1<br />
1982<br />
396<br />
1,929 28,833<br />
217,385 3,993<br />
2<strong>20</strong><br />
3,156 12.6<br />
1983<br />
388<br />
1,880 28,805<br />
223,509 4,227<br />
223<br />
2,957 12.5<br />
1984<br />
387<br />
1,844 29,133<br />
234,557 4,427<br />
227<br />
3,027 13.4<br />
1985<br />
382<br />
1,818 30,038<br />
250,642 4,785<br />
238<br />
2,800 13.4<br />
1986<br />
369<br />
1,793 28,604<br />
249,665 5,011<br />
249<br />
2,574 12.9<br />
1987<br />
381<br />
1,850 29,515<br />
261,054 5,361<br />
259<br />
2,537 13.6<br />
1988<br />
391<br />
1,845 30,22 1<br />
277,774 5,686<br />
265<br />
2,462 14.0<br />
1989<br />
312<br />
1,742 3 1,000<br />
285,255 5,859<br />
274<br />
2,73 1 16.0<br />
1990<br />
318<br />
1,863 33,000<br />
300,996 6,057<br />
273<br />
2,609 15.8<br />
1991<br />
316<br />
1,786 34,000<br />
312,484 6,273<br />
285<br />
2,503 15.7<br />
1992<br />
336<br />
1,796 34,000<br />
307,282 6,091<br />
286<br />
2,610 15.9<br />
1993<br />
360<br />
1,853 34,936<br />
302,739 6,199<br />
280<br />
2,646 16.4<br />
1994<br />
411<br />
1,874 34,940<br />
305,600 5,869<br />
276<br />
2,351 13.8b<br />
1995<br />
422<br />
1,907 3 1,579<br />
282,579 5,401<br />
266<br />
2,314 12.5’<br />
1996<br />
348<br />
1,501 30,542<br />
277,750 5,066<br />
257<br />
2,389 12.1’<br />
1997<br />
292<br />
1,572 32,000<br />
287,760 5,166<br />
255<br />
2,458 12.7’<br />
1998<br />
362<br />
1.347 32.926<br />
315,823 5,325<br />
251<br />
2,460 13.0”<br />
Average annual percentage change<br />
1971-98 0.9%d 0.5% 2.6%<br />
3.1% 3.7%<br />
1.1%<br />
-1 .7%d<br />
-o.3%d<br />
1988-98<br />
Source:<br />
-0.8% -3.1% 0.9% 1.3% -0.7% -0.5% 0.0% -0.7%<br />
1971~83- Association of American Railroads, Economics and Finance Department, Statistics of Class IRailroads, Washington, DC, and annual.<br />
1984-S Association of American Railroads, Railroad Facts, 1988 Edition, Washington, DC, December 1989, p. 61, and annual.<br />
1989-93- Personal communication with the Corporate Accounting Office of Amtrak, Washington, D.C.<br />
1994-98- Number of locomotives in service, number of passenger cars, train-miles, car-miles, revenue passenger-miles, and average trip length - Association of<br />
American Railroads, Railroad Facts, 1999 Edition, Washington, DC, 1999, p. 77.<br />
Energy use - Personal communication with the Amtrak, Washington, DC, and estimates thereafter based on train-miles.<br />
(Additional resources: www.amtrak.com, www.aar.org)<br />
a Data are not available.<br />
b Ener,? use <strong>for</strong> 1994 on is not directly comparable to earlier years. Some commuter rail energy use may have been inadvertently included in earlier years.<br />
’ Estimated using train-miles.<br />
d Average annual percentage change is from earliest year available to 1998.
Table 12.11<br />
Summary Statistics <strong>for</strong> Rail Transit Operations, 1970-98”<br />
Number of Vehicle-miles Passenger trips Estimated passenger-miles Average trip length Energy-intensity Energy use<br />
Year passenger vehicles (millions) (millions)” (millions) (miles)d (Btu/passenger-mile) (trillion Btu)<br />
1970<br />
1971<br />
1972<br />
1973<br />
1974<br />
1975<br />
1976<br />
10,548<br />
10,550<br />
10,599<br />
10,510<br />
10,471<br />
10,617<br />
10,625<br />
440.8<br />
440.4<br />
417.8<br />
438.5<br />
458.8<br />
446.9<br />
428.1<br />
2,116<br />
2,000<br />
1,942<br />
1,921<br />
1,876<br />
1,797<br />
1,744<br />
12,273<br />
11,600<br />
11,264<br />
11,142<br />
10,881<br />
10,423<br />
10,115<br />
f<br />
f<br />
f<br />
r<br />
I<br />
f<br />
I<br />
2,453<br />
2,595<br />
2,540<br />
2,460<br />
2,840<br />
2,962<br />
2,971<br />
30.1<br />
30.1<br />
28.6<br />
27.4<br />
30.9<br />
31.1<br />
30.3<br />
1977 10,579 381.7 1,713 10,071 5.8 2,691 27.1<br />
1978 10,459 383.0 1,810 10,722 5.9 2,210 23.7<br />
1979 10,429 399.6 1,884 11,167 5.9 2,794 31.2<br />
1980 10,654 402.2 2,241 10,939 4.9 3,008 32.9<br />
1981 10,824 436.6 2,217 10,590 4.8 2,946 31.2<br />
1982 10,831 445.2 2,<strong>20</strong>1 10,428 4.6 3,069 32.0<br />
1983 10,904 423.5 2,304 10,741 4.7 3,212 34.5<br />
1984 10,848 452.7 2,388 10,531 4.4 3,732 39.3<br />
1985 11,109 467.8 2,422 10,777 4.4 3,461 37.3<br />
1986 11,083 492.8 2,467 11,018 4.5 3,531 38.9<br />
1987 10,934 508.6 2,535 11,603 4.6 3,534 41.0<br />
1988 11,370 538.3 2,462 11,836 4.8 3,565 42.2<br />
1989 11,261 553.4 2,704 12,539 4.6 3,397 42.6<br />
1990 11,332 560.9 2,521 12,046 4.8 3,453 41.6<br />
1991 11,426 554.8 2,356 11,190 4.7 3,727 41.7<br />
1992 11,303 554.1 2,396 11,441 4.8 3,575 40.9<br />
1993 11,286 549.8 2,234 10,936 4.9 3,687 42.2<br />
1994 11,192 565.8 2,453 11,501 4.8 3,828 44.0<br />
1995 11,156 571.8 2,284 11,419 5.0 3,818 43.6<br />
1996 11,341 580.7 2,417 12,484 5.2 3,444 43.0<br />
1997 11,471 598.9 2,692 13,091 4.9 3,253 42.6<br />
1998 11,506 609.1 2,668 13,402 5.0 3,216 43.1<br />
1970-9s 0.3% 1.2% 0.8%<br />
Average annualpercentage change<br />
0.3% -0.7%E 1.0% 1.3%<br />
1988-98<br />
Source:<br />
0.1% 1.2% 0.8% 1.3% 0.4% -1 .O% 0.2%<br />
American Public Transit Association, <strong>20</strong>00 Transit Fact Book, Washington, DC, March <strong>20</strong>00, pp. 69,70, 78, 83. (Additional resources: www.apta.com)<br />
Energy use - See Appendix A <strong>for</strong> Table 2.5.<br />
“Heavy rail and light rail. Series not continuous between 1983 and 1984 because of a change in data source by the American Public Transit Association (APTA). Beginning in 1984,<br />
data provided by APTA are taken from mandatory reports filed with the Urban Mass Transit Administration (UMTA). Data <strong>for</strong> prior years were provided on a voluntary basis by APTA<br />
members and expanded statistically.<br />
b1970-79 data represents total passenger rides; after 1979, data represents unlinked passenger trips.<br />
‘Estimated <strong>for</strong> years 1970-76 based on an average trip length of 5.8 miles.<br />
dCalculated as the ratio of passenger-miles to passenger trips.<br />
eLarge system-to-system variations exist within this category.<br />
‘Data are not available.<br />
aAverage annual percentage change is calculated <strong>for</strong> years 1977-98.<br />
F<br />
iz
APPENDIX A<br />
SOURCES<br />
This appendix contains documentation of the estimation procedures used by OWL. The<br />
reader can examine the methodology behind the estimates and <strong>for</strong>m an opinion as to their utility.<br />
The appendix is arranged by table number and subject heading. Only tables which contain<br />
ORNL estimations are documented in Appendix A; all other tables have sources listed at the bottom<br />
of the table. Since abbreviations are used throughout the appendix, a list of abbreviations is also<br />
included.<br />
<strong>TRANSPORTATION</strong><strong>ENERGY</strong><strong>DATA</strong>BOOIC <strong>EDITION</strong>~O-<strong>20</strong>00<br />
A-l
A-2<br />
AAMA<br />
APTA<br />
Amtrak<br />
Btu<br />
DOC<br />
DOE<br />
DOT<br />
EIA<br />
EPA<br />
FAA<br />
FHWA<br />
gw<br />
lpg<br />
mpg<br />
NHTSA<br />
NPTS<br />
ORNL<br />
Pmt<br />
RECS<br />
RTECS<br />
TIUS<br />
TSC<br />
VISJS<br />
vmt<br />
List of Abbreviations Used in Appendix A<br />
American Automobile Manufacturers Association<br />
Association of American Railroads<br />
American Public Transit Association<br />
National Railroad Passenger Corporation<br />
British thermal unit<br />
Department of Commerce<br />
Department of Energy<br />
Department of Transportation<br />
Energy In<strong>for</strong>mation Administration<br />
Environmental Protection Agency<br />
Federal Aviation Administration<br />
Federal Highway Administration<br />
gross vehicle weight<br />
liquefied petroleum gas<br />
miles per gallon<br />
National Highway Traffic Safety Administration<br />
Nationwide Personal Transportation Study<br />
Oak Ridge National Laboratory<br />
passenger-miles traveled<br />
Residential Energy Consumption Survey<br />
Residential Transportation Energy Consumption Survey<br />
Truck Inventory and Use Survey<br />
Transportation Systems <strong>Center</strong><br />
Vehicle Inventory and Use Survey<br />
vehicle-miles traveled
Table 2.5<br />
Domestic Consumption of Transportation Energy by Mode<br />
and Fuel Type, 1998<br />
Most of the source data were given in gallons. Fuel use was converted to Btu using the conversion factors<br />
in Appendix B.<br />
Highway<br />
Automobiles<br />
Motorcycles<br />
Buses<br />
Total gallons of fuel taken from DOT, FHWA, Highway Statistics 1998, Table VM-1. These<br />
were distributed as follows: 97.% gasoline, 1 .O% gasohol, and 1.3% diesel.<br />
Percentages were derived from the DOE, EIA, Office of Markets and End Use, Energy<br />
End Use Division, Household Vehicles Energy Consumption 1994, August 1997, p. 46.<br />
Natural gas data are from the DOE, EIA Natural Gas Annual 1998, Table 1; transit bus<br />
natural gas was subtracted from the total and the remainder was assumed to be light<br />
vehicle use. Automobiles were assumed to use 25% of light vehicle natural gas use.<br />
Methanol use was estimated using data from DOE, EIA, Alternatives to Traditional<br />
Transportation Fuels 1998, Washington, DC, 1999, Table 12.<br />
DOT, FHWA, Highway Statistics 1998, Table VM-1. For conversion purposes, fuel <strong>for</strong> all<br />
motorcycles was assumed to be gasoline.<br />
Transit:<br />
APTA, <strong>20</strong>00 Transit Fact Book, <strong>20</strong>00, Washington, DC.<br />
Non-diesel fossil fuel consumption was assumed to be used by motor buses,<br />
In twcity:<br />
Eno Transportation Foundation, Transportation in America 1999, Seventeenth Edition,<br />
<strong>20</strong>00, Lansdowne, VA, p. 56. For conversion purposes, fuel <strong>for</strong> all intercity buses<br />
was assumed to be diesel fuel.<br />
School:<br />
Gasoline andDiesel - Eno Transportation Foundation, Transportation in America 1999,<br />
Seventeenth Edition, <strong>20</strong>00, Lansdowne, VA, p. 56. For conversion purposes, fuel<br />
<strong>for</strong> school buses was assumed to be 90% diesel fuel and 10% gasoline based on<br />
estimates from the National Association of State Directors of Pupil Transportation<br />
Services.<br />
<strong>TRANSPORTATION</strong><strong>ENERGY</strong><strong>DATA</strong><strong>BOOK</strong>: <strong>EDITION</strong>~O-<strong>20</strong>00<br />
A-3
A-4<br />
Trucks<br />
Off-Highway<br />
Nonhighwav<br />
Air<br />
Total:<br />
Sum of light trucks and other trucks.<br />
Light Truclcs:<br />
DOT, FHWA, Highway Statistics 1998, Table VM-1, <strong>for</strong> single-unit, 2-axle, 4-tire<br />
trucks. 96.3% of fuel assumed to be gasoline, 3.4% diesel, 0.2% lpg; percentages<br />
were generated from the 1997 VIUS Public Use CD. Natural gas data are from the<br />
DOE, EIA Natural Gas Annual 1998, Table 1; transit bus natural gas was<br />
subtracted from the total and the remainder was assumed to be light vehicle use.<br />
Light trucks were assumed to use 75% of light vehicle natural gas use.<br />
Other Truchx<br />
DOT, FHWA, Highway Statistics 1998, Table VM- 1. Total gallons <strong>for</strong> other trucks<br />
was the difference between total and 2-axle, 4-tire trucks. These gallons were<br />
distributed as follows based on data from the 1997 VIUS Public Use CD: 12.4%<br />
of fuel assumed to be gasoline, 87.1% diesel, and 0.5% lpg.<br />
Diesel:<br />
Data supplied by Marianne Mintz, Argonne National Laboratory, from the Public Use<br />
Data Base, National Energy Accounts, DOC, OBA-NEA- 10, August 1988.<br />
Gasoline:<br />
DOT, FHWA, Highway Statistics 1999, Table MF-24. Agriculture and Construction<br />
totals.<br />
General Aviation:<br />
DOT, FAA, General Aviation Activity and Avionics Survey: Annual Sumnzar*y Report<br />
Calendar Year 1998, Table 5.1. Jet fuel was converted from gallons to Btu using<br />
135,000 Btu/gallon (kerosene-type jet fuel).<br />
Domestic and International Air Carrier:<br />
DOT, Bureau OfTransportation Statistics, “Fuel Cost and Consumption Tables;” annual<br />
figures were obtained by summing monthly totals. Because the data <strong>for</strong> international<br />
included fuel purchased abroad, the international total was divided in half to estimate<br />
domestic fuel use <strong>for</strong> international flights.<br />
<strong>TRANSPORTATION</strong><strong>ENERGY</strong><strong>DATA</strong>BOOIC <strong>EDITION</strong>~O-<strong>20</strong>00
Water<br />
Freight:<br />
Total - DOE, EIA, Fuel Oil and Kerosene Sales 1998, Table 23. Adjusted sales of<br />
distillate and residual fuel oil <strong>for</strong> vessel bunkering. (This may include some<br />
amounts of bunker fuels used <strong>for</strong> recreational purposes.)<br />
Recreational Boating:<br />
Fuel use by recreational boating was calculated using the methodology developed by<br />
D. L. Greene in the report, Off-Highway Use qf Gasoline in the United States (DOT,<br />
FHWA, July 1986, p. 3-22). Results from Model 1 in the report indicated an average<br />
annual consumption of <strong>20</strong>5 gallons per boat. Total consumption in gallons was then<br />
calculatedusing the following equation: Total = 0.95 (Gal/boat) (number ofboats). An<br />
estimate of number of recreational boats in operation is from the U.S. Coast Guard<br />
(numbered boats).<br />
Pipeline<br />
The sum of natural gas, crude petroleum and petroleum product, and coal slurry and water.<br />
Natural Gas.<br />
The amount of natural gas used to transport natural gas was defined as “pipeline fuel”<br />
as reported in DOE, EIA, Natural Gas Annual 1998, Table 1. Cubic feet were<br />
converted to Btu using 1,03 1 Btu/ft3. Electricity use was estimated using the following<br />
procedure as reported on p. 5-110 of J. N. Hooker et al., End Use Energy Consumption<br />
DataBase: Transportation Sector. The energy consumption of a natural gas pipeline<br />
was taken to be the energy content of the fuel used to drive the pumps. Some 94% of<br />
the installed pumping horsepower was supplied by natural gas. The remaining 6% of<br />
the horse power was generated more efficiently, mostly by electric motors. The energy<br />
consumed by natural gas pipeline pumps that were electrically powered was not known.<br />
In order to estimate the electricity consumed, the Btu of natural gas pipeline fuel<br />
consumed was multiplied by a factor of 0.015. From this computed value, electricity<br />
efficiency and generation loss must be taken into account. The electricity energy use<br />
in Btu must be converted to lWhr, using the conversion factor 29.305 x 10d5 lWhr/Btu.<br />
Electricity generation and distribution efficiency was 29%. When generation and<br />
distribution efficiency are taken into account, 1 1Whr equals 11,765 Btu.<br />
Crude petroleum and petroleum product.<br />
J. N. Hooker, Oil Pipeline Energy Consumption and Efficiency, ORNL-5697, ORNL,<br />
Oak Ridge, TN, 198 1. (Latest available data.)<br />
Coal slurry and water:<br />
W. F. Banks, Systems, Science and Software, Energy Consumption in the Pipeline<br />
Industry, LaJolla, CA, October 1977. (Latest available data.)<br />
<strong>TRANSPORTATION</strong><strong>ENERGY</strong><strong>DATA</strong>BOOIC <strong>EDITION</strong>~O-<strong>20</strong>00<br />
A-5
A-6<br />
Rail<br />
Total:<br />
Sum of freight and passenger rail.<br />
Freight:<br />
AAR, Railroad Facts, 1999 Edition, Washington, DC, 1999.<br />
Passenger:<br />
Transit and Commuter - APTA, <strong>20</strong>00 Transit Fact Book, Washington, DC, <strong>20</strong>00.<br />
Transit was defined as the sum of “heavy rail,” “light rail,” and “other.”<br />
Intercity - Personal communication with Amtrak, Washington, DC. (1998 data were<br />
estimated using train-mile in<strong>for</strong>mation.)<br />
<strong>TRANSPORTATION</strong> <strong>ENERGY</strong> <strong>DATA</strong> <strong>BOOK</strong>: <strong>EDITION</strong> <strong>20</strong>-<strong>20</strong>00
Highway<br />
Automobiles<br />
Motorcycles<br />
Table 2.7<br />
Transportation Energy Consumption by Mode, 1970-98<br />
Total gallons of fuel <strong>for</strong> automobiles was taken from DOT, FHWA, Highway Statistics<br />
Summary to 1995, Table VM-<strong>20</strong> 1 A; and Table VM- 1 in the 1996-l 998 annual editions.<br />
Fuel <strong>for</strong> automobiles was distributed between fuel types <strong>for</strong> conversion into Btu’s as<br />
follows:<br />
1970-80 - 94.7% gasoline, 5.3% diesel as reported in the DOE, EIA, Office of Energy<br />
Markets and End Use, Residential Energy Consumption Survey: Consumption<br />
Patterns ofHousehold Vehicles, June 1979 to December 1980, p. 10.<br />
1981-82 - 94.1% gasoline, 5.9% diesel as reported in the DOE, EIA, Office of Energy<br />
Markets and End Use, Residential Energy Consumption Survey: Consumption<br />
Patterns of Household Vehicles, Supplement: January I981 to September 1981,<br />
pp. 11, 13.<br />
1983-84 - 97.5% gasoline, 2.5% diesel as reported in the DOE, EIA, Office of Markets<br />
and End Use, Energy End Use Division, Residential Transportation Energy<br />
Consumption Survey: Consumption Patterns of Household Vehicles, 1983, Jan.,<br />
1985, pp. 7, 9.<br />
1985-87 - 98.5% gasoline, 1.5% diesel as reported in the DOE, EIA, Office of Energy<br />
Markets and End Use, Residential Transportation Energy Consumption Survey:<br />
Consumption Patterns ofHousehold Vehicles 1985, April 1987, pp. 25, 27.<br />
1988-90 - 98.8% gasoline and 1.2% diesel as reported in the DOE, EIA, Office of<br />
Markets and End Use, Energy End Use Division, Household Vehicles Energy<br />
Consumption 1988, March 1990, p. 65.<br />
1991-93 - 97.8% gasoline, 1 .O% gasohol, and 1.2% diesel as reported in the DOE, EIA,<br />
Office of Markets and End Use, Energy End Use Division, Household Vehicles<br />
Energy Consumption 1991, December 1993, p. 46.<br />
1994-98 - 97.7% gasoline, 1.0% gasohol, 1.3% diesel as reported in the DOE, EIA,<br />
Office of Energy Markets and End Use, Household Vehicles Energy Consumption,<br />
1994, Washington, DC, August 1997, p. 46.<br />
1993-98 - Natural gas data are from the DOE, EIA Natural Gas Annual f998, Table 1;<br />
transit bus natural gas was subtracted from the total and the remainder was<br />
assumed to be light vehicle use. Automobiles were assumed to use 25% of light<br />
vehicle natural gas use.<br />
Department of Transportation, Federal Highway AdministratioqHighway Statistics Summary<br />
to 1995, Table VM-<strong>20</strong>1A; and Table VM-1 in the 1996-98 annual editions. For<br />
conversion purposes, fLle1 <strong>for</strong> all motorcycles was assumed to be gasoline.<br />
<strong>TRANSPORTATION</strong><strong>ENERGY</strong><strong>DATA</strong><strong>BOOK</strong>: EUITION~O-<strong>20</strong>00<br />
A-7
A-8<br />
Buses<br />
Trucks<br />
Sum of transit, intercity and school.<br />
Transit:<br />
APTA, <strong>20</strong>00 Transit Fact Book, <strong>20</strong>00, Washington, DC, and annual.<br />
Non-diesel fossil fuel consumption was assumed to be used by motor buses. For the<br />
years 1988-92, motor bus gasoline use was estimated as 5% of “other” fuels,<br />
based on personal communication with the APTA Research and Statistics<br />
Department.<br />
Intercity:<br />
1970-84 - American Bus Association, Annual Report, Washington, DC, annual.<br />
1985-98- Eno Transportation Foundation, Transportation in America 1999,<br />
Seventeenth Edition, <strong>20</strong>00, Lansdowne, VA, p. 56. For conversion purposes, fuel<br />
<strong>for</strong> all intercity buses was assumed to be diesel fuel.<br />
School:<br />
1970-84 - DOT, FHWA, Highway Statistics 1984, Washington, DC, Table VM-1, and<br />
annual.<br />
1985-86 - DOT, Research and Special Programs Administration, National<br />
Transportation Statistics, Figure 2, p. 5, and annual.<br />
1987-98- Eno Transportation Foundation, Transportation in America 1999 ,<br />
SeventeenthEdition, 1999, Lansdowne, VA, p. 56. For conversion purposes, fLle1<br />
<strong>for</strong> school buses was assumed to be 90% diesel fuel and 10% gasoline based on<br />
estimates from the National Association of State Directors of Pupil Transportation<br />
Services.<br />
Light Trucks:<br />
Defined as 2-axle, 4-tire trucks. Total gallons of fuel was taken from DOT, FHWA,<br />
Highway Statistics Summary to 1995, Table VM-<strong>20</strong>1A, and Table VM-1 of the<br />
1996-98 annual editions. Based on data from the 1982 TIUS Public Use Tape, fuel<br />
use <strong>for</strong> 1970-87 was distributed among fuel types as follows: 95.3% gasoline; 3.5%<br />
diesel; and 1.2% lpg. Fuel use <strong>for</strong> 1988-93 was distributed based on the 1987 TIUS:<br />
96.6% gasoline; 3.3% diesel; and 0.1% lpg. Fuel use <strong>for</strong> 1994-97 was distributed<br />
based on the 1992 TIUS: 96.4% gasoline; 3.3% diesel; 0.3% lpg. Fuel use <strong>for</strong> 1998<br />
was based on the 1997 VIUS: 96.3% gasoline, 3.4% diesel, 0.2% lpg. Natural gas<br />
data are from the DOE, EIA Natural Gas Annual 1998, Table 1; transit bus natural<br />
gas was subtracted from the total and the remainder was assumed to be light vehicle<br />
use. Light trucks were assumed to use 75% of light vehicle natural gas use.<br />
<strong>TRANSPORTATION</strong><strong>ENERGY</strong><strong>DATA</strong><strong>BOOK</strong>: <strong>EDITION</strong>~O-<strong>20</strong>00
Total Highway<br />
Nonhighway<br />
Air<br />
Water<br />
Other Trucks:<br />
Defined as the difference between total trucks and 2-axle, 4-tire trucl~s. Total gallons of<br />
fuel was taken fromDOT, FHWA, Highway StatisticsSummary to 1995, Table VM-<br />
<strong>20</strong>1A, and Table VM-1 of the 1996-98 annual editions. Based on data from the<br />
1982 TIUS Public Use Tape, fuel use <strong>for</strong> 1970-87 was distributed among fuel types<br />
as follows: 39.6% gasoline; 59.4% diesel; and 1.0% lpg. Fuel use <strong>for</strong> 1988-93 was<br />
distributed based on the 1987 TIUS: 19.4% gasoline; 80.4% diesel; and 0.2% lpg.<br />
Fuel use <strong>for</strong> 1994-96 was distributed based on the 1992 TIUS: 16.2% gasoline;<br />
83.3% diesel; and 0.5% lpg. Fuel use <strong>for</strong> 1997-98 was distributed as follows based<br />
on data from the 1997 VIUS Public Use CD: 12.4% of fuel assumed to be gasoline,<br />
87.1% diesel, and 0.5% lpg.<br />
Sum of autos, motorcycles, buses, light trucks, and other trucks.<br />
Sum of fuel use by General Aviation and Certificated Route Air Carrier.<br />
General Aviation:<br />
1970-74 - DOT, TSC, National Transportation Statistics, Cambridge, MA, 198 1.<br />
1975-85 - DOT, FAA, FAA Aviation Forecasts, Washington, DC, annual.<br />
1985-97 - DOT, FAA, General Aviation Activity and Avionics Survey: Annual Summary<br />
Report, Calendar Year 1998, Table 5.1. Jet fuel was converted from gallons to Btu<br />
using 135,000 Btu/gallon (kerosene-type jet fuel).<br />
Certificated Route Air Carrier:<br />
I970-81- DOT, Civil Aeronautics Board, Fuel Cost and Consumption, Washington, DC,<br />
annual.<br />
1982-98- DOT, Bureau of Transportation Statistics, “Fuel Cost and Consumption<br />
Tables;” annual figures were obtained by summing monthly totals. These data are<br />
<strong>for</strong> domestic carriers, but include the international operations of those domestic<br />
carriers. The international operations total was divided in half to estimate domestic<br />
fuel use <strong>for</strong> international flights.<br />
Sum of vessel bunkering fuel (i.e., freight) and fuel used by recreational boats.<br />
Freight:<br />
Total - DOE, EIA, Fuel Oil and Kerosene Sales 1998, Table 23. Adjusted sales of<br />
distillateandresidual fuel oil <strong>for</strong> vessel bunkering. (This may include some amounts<br />
of bunltei- fuels used <strong>for</strong> recreational purposes.)<br />
<strong>TRANSPORTATION</strong> <strong>ENERGY</strong> DA.~A <strong>BOOK</strong>: <strong>EDITION</strong> <strong>20</strong>-<strong>20</strong>00<br />
A-9
A-10<br />
Pipeline<br />
Rail<br />
Recreational Boating:<br />
1970-84 - DOT, FHWA, Highway Statistics, Washington, DC, Table MF-24, annual.<br />
1985-98 - Fuel use by recreational boating was calculated using the methodology<br />
developed by D. L. Greene in the report, Off-Highway Use of Gasoline in the United<br />
States (DOT, FHWA, July 1986, p. 3-22). Results from Model 1 in the report<br />
indicated an average annual consumption of <strong>20</strong>5 gallons per boat. Total<br />
consumption in gallons was then calculated using the following equation: Total =<br />
0.95 (Gal/boat) (number of boats). An estimate ofnumber of recreational boats in<br />
operation is from the U.S. Coast Guard (numbered boats).<br />
The sum of natural gas, crude petroleum and petroleum product, and coal slurry and water.<br />
Natural Gas.<br />
The amount of natural gas used to transport natural gas was defined as “pipeline fuel” as<br />
reported in DOE, EIA, Natural Gas Annual 1998, Table 1. Cubic feet were<br />
converted to Btu using 1,031 Btu/ft”. Electricity use was estimated using the<br />
following procedure as reported on p. 5-l 10 of J. N. Hooker et al., End Use Energy<br />
Consumption DataBase: Transportation Sector. The energy consumption of a<br />
natural gas pipeline was taken to be the energy content of the fuel used to drive the<br />
pumps. Some 94% of the installed pumping horsepower was supplied by natural<br />
gas. The remaining 6% of the horse power was generated more efficiently, mostly<br />
by electric motors. The energy consumed by natural gas pipeline pumps that were<br />
electrically powered was not known. In order to estimate the electricity consumed,<br />
the Btu of natural gas pipeline fuel consumed was multiplied by a factor of 0.0 15.<br />
From this computed value, electricity efficiency and generation loss must be taken<br />
into account. The electricity energy use in Btu must be converted to lWhr, using the I<br />
conversion factor 29.305 x 1O-5 lWhr/Btu. Electricity generation and distribution<br />
efficiency was 29%. When generation and distribution efficiency are taken into<br />
account, 1 1Whr equals 11,765 Btu.<br />
Crude petroleum and petroleum product.<br />
J. N. Hooker, OilPipelineEnergy Consumption andEf$ciency, ORNL-5697, ORNL, Oak<br />
Ridge, Tennessee, 198 1. (Latest available data.)<br />
CoaLslurry and water:<br />
W. F. Banks, Systems, Science and Software, Energy Consumption in the Pipeline<br />
Industry, LaJolla, Cali<strong>for</strong>nia, October 1977. (Latest available data.)<br />
Total:<br />
Sum of freight and passenger rail.<br />
Freight:<br />
AAR, Railroad Facts, 1999 Edition, Washington, DC.<br />
<strong>TRANSPORTATION</strong><strong>ENERGY</strong><strong>DATA</strong>BOOIC <strong>EDITION</strong>~O-<strong>20</strong>00
Passenger:<br />
Transit and Commutev - APTA, <strong>20</strong>00 Transit Fact Book, <strong>20</strong>00, Washington, DC , annual.<br />
Transit was defined as the sum of “heavy rail,” “light rail,” and “other.”<br />
Intercity - Personal communication with Amtrak, Washington, DC. (1995-98 data were<br />
estimated using train-mile in<strong>for</strong>mation.)<br />
<strong>TRANSPORTATION</strong> <strong>ENERGY</strong> <strong>DATA</strong> <strong>BOOK</strong>: EDJTION <strong>20</strong>-<strong>20</strong>00<br />
A-11
A-12<br />
Highway<br />
Automobiles<br />
Personal Trucks<br />
Table 2.11<br />
Passenger Travel and Energy Use in the United States, 1998<br />
Number of Vehicles - DOT, FHWA, Highway Statistics I998 Table VM- 1.<br />
Vmt - DOT, FHWA, Highway Statistics 1998, Table VM- 1.<br />
Pmt - Calculated by ORNL (load factor times vmt).<br />
Load Factor - DOT, FHWA, Office of Highway In<strong>for</strong>mation Management, 1995 NPTS, Public<br />
Use Tape, 1997.<br />
Energy Use - Total gallons of fuel taken from DOT, FHWA, Highway Statistics 1998, Table<br />
VM-1. These were distributed as follows: 97.8% gasoline, 1.0% gasohol, and 1.2%<br />
diesel. Percentages were derived from the DOE, EIA, Office of Markets and End Use,<br />
Energy End Use Division, Household Vehicles Energy Consumption 1991, December<br />
1993, p. 46. Natural gas data are from the DOE, EIA Natural Gas Annual 1998, Table<br />
1; transit bus natural gas was subtracted from the total and the remainder was assumed to<br />
be light vehicle use. Automobiles were assumed to use 25% of light vehicle natural gas<br />
use.<br />
Number of Vehicles - Based on the 1997 TIUS, 75.2% of total 2-axle, 4-tire trucks and 16.9%<br />
of total other trucks were <strong>for</strong> personal use. There<strong>for</strong>e, 75.2% of total 2-axle, 4-tire trucks<br />
(as reported by DOT, FHWA in Highway Statistics 1998, Table VM- 1) and 16.9% of total<br />
other trucks were estimated to be <strong>for</strong> personal use.<br />
Vmt - 70.7% of total vehicle miles traveled by 2-axle, 4-tire trucks (as reported by DOT, FHWA<br />
in Highway Statistics 1998, Table VM- 1) and 7.1% of total vehicle miles traveled by other<br />
trucks were <strong>for</strong> personal use. The percentages were derived by ORNL from the 1997<br />
VIUS Micro Data File on CD.<br />
Pmt - Calculated by ORNL as vmt multiplied by load factor.<br />
Load Factor - DOT, FHWA, Office of Highway In<strong>for</strong>mation Management, 1995 NPTS, Public<br />
Use Tape, 1997.<br />
Energy Use- Assuming that there is no difference in fuel economy (measured in miles per<br />
gallon) between personal-use trucks and non-personal use trucks, 68.5% of total fuel<br />
consumption by 2-axle, 4-tire trucks (as reported by DOT, FHWA in Highway Statistics<br />
1998, Table VM- 1) and 3.7% of total other truck fuel consumption was <strong>for</strong> personal use.<br />
These percentages were derived by ORNL from the 1997 VIUS Public Use tape. Total<br />
truck energy use was the sum of light truck and other truck energy use.<br />
Light Trucks: DOT, FHWA, Highway Statistics 1998, Table VM-1, <strong>for</strong> single-unit, 2axle,<br />
4-tire trucks. 96.3% of fuel assumed to be gasoline, 3.4% diesel, 0.2% lpg;<br />
percentages were generated from the 1997 VIUS Public Use CD. Natural gas data<br />
are from the DOE, EIA Natural Gas Annual 1998, Table 1; transit bus natural gas<br />
was subtracted from the total and the remainder was assumed to be light vehicle use.<br />
Light trucks were assumed to use 75% of light vehicle natural gas use.<br />
<strong>TRANSPORTATION</strong><strong>ENERGY</strong><strong>DATA</strong><strong>BOOK</strong>: <strong>EDITION</strong>~O-<strong>20</strong>00
Motorcycles<br />
Buses<br />
Other Trucks: DOT, FHWA, Highway Statistics 1998, Table VM-1. Total gallons <strong>for</strong><br />
other trucks was the difference between total and 2-axle, 4-tire trucks. These gallons<br />
were distributed as follows based on data from the 1997 VIUS Public Use CD:<br />
12.4% of fuel assumed to be gasoline, 87.1% diesel, and 0.5% lpg.<br />
Number of Vehicles and Vmt - DOT, FHWA, Highway Statistics 1998, Table VM-1.<br />
Pmt - Calculated by ORNL as vmt multiplied by load factor.<br />
Load Factor - DOT, FHWA, Office of Highway In<strong>for</strong>mation Management, 1995 NPTS, Public<br />
Use Tape, 1997.<br />
Energy Use - DOT, FHWA, Highway Statistics 1998, Table VM-1. For conversion purposes,<br />
fuel <strong>for</strong> all motorcycles was assumed to be gasoline.<br />
Transit:<br />
Number of Vehicles, Vmt, Pmt, and Energy Use - Motor bus only. APTA, <strong>20</strong>00 Transit<br />
Fact Book, <strong>20</strong>00, Washington, DC.<br />
Load Factor - Calculated by ORNL as pmt/vmt.<br />
In tercity:<br />
Number of Vehicles - Estimatedby ORNL as 18% of commercial bus registrations, DOT,<br />
FHWA, Highway Statistics 1998, Table MV- 10.<br />
Pmt - Eno Transportation Foundation, Transportation in America, 1999, Seventeenth<br />
Edition, Lansdowne, VA, <strong>20</strong>00, p. 47.<br />
Vmt - Estimated using passenger travel and an average load factor of 23.2<br />
persons/vehicle.<br />
Load Factor -Estimated as 23.2 based on historical data.<br />
Energy Use - Eno Transportation Foundation, Transportation in America 1999,<br />
Seventeenth Edition, <strong>20</strong>00, Lansdowne, VA, p. 56. For conversion purposes, fuel<br />
<strong>for</strong> all intercity buses was assumed to be diesel fuel.<br />
School:<br />
Number of Vehicles - School and other nonrevenue as reported in DOT,<br />
FHWA, Highway Statistics 1998, Table MV-10.<br />
Vmt, Pmt - National Safety Council, Accident Facts, 1999Edition Chicago, IL.<br />
Load Factor - Calculated by ORNL as pmt/vmt.<br />
Energy Use - Eno TransportationFoundation, Transportation in America 1999, Sixteenth<br />
Edition, <strong>20</strong>00, Lansdowne, VA, p. 56. For conversion purposes, fuel <strong>for</strong> school<br />
buses was assumed to be 90% diesel fuel and 10% gasoline based on estimates from<br />
the National Association of State Directors of Pupil Transportation Services.<br />
<strong>TRANSPORTATION</strong> <strong>ENERGY</strong> <strong>DATA</strong> <strong>BOOK</strong>: <strong>EDITION</strong> <strong>20</strong>-<strong>20</strong>00<br />
A-13
A-14<br />
Nonhighway<br />
Air<br />
Recreational Boating<br />
Rail<br />
Large Certified Route Air Carriers:<br />
Vmt, Pmt - DOT, Bureau of Transportation Statistics, Air Carrier Traffic Statistics<br />
Monthly, December 1998X999, Washington, DC, p.2.<br />
Load Factor - Calculated by ORNL as pmt/vmt.<br />
Energy Use - DOT, Bureau of Transportation Statistics, “Fuel Cost and Consumption<br />
Tables;” annual figures were obtained by summing monthly totals <strong>for</strong> domestic only.<br />
General Aviation:<br />
Number of Vehicles, Vmt, Energy Use - DOT, FAA, General Aviation Activity and<br />
Avionics, Survey: Calendar Year 1998, pp. l-7, 3-l 1, 5-3.<br />
Pmt - Eno Transportation Foundation, Transportation in America 1999, Seventeenth<br />
Edition, Lansdowne, VA, <strong>20</strong>00, p. 47.<br />
Load Factor - Calculated by ORNL as pmt/vmt.<br />
Number of Vehicles - U.S. Coast Guard, Office of Boating Safety, Washington, DC, May<br />
<strong>20</strong>00.<br />
Energy Use - Fuel use by recreational boating was calculated using the methodology<br />
developed by D. L. Greene in the report, Off-Highway Use of Gasoline in the United<br />
States (DOT, FHWA, July 1986, p. 3-22). Results from Model 1 in the report<br />
indicated an average annual consumption of <strong>20</strong>5 gallons per boat. Total<br />
consumption in gallons was then calculated using the following equation: Total =<br />
0.95 (Gal/boat) (number of boats). An estimate of number of recreational boats in<br />
operation is from the U.S. Coast Guard (numbered boats).<br />
Intercity:<br />
Number of Vehicles, Vmt and Pmt -AAR, Railroad Facts, 1999 Edition, Washington, DC,<br />
p. 78.<br />
Load Factor - Calculated by ORNL as pmt/vmt.<br />
Energy Use - Personal communication with Amtrak, Washington, DC. (1998 data<br />
estimated using train-mile in<strong>for</strong>mation.)<br />
Transit and Commuter:<br />
Number of Vehicles, Vmt and Pmt - APTA, <strong>20</strong>00 Transit Fact Book, Washington, DC,<br />
2 0 0 0 .<br />
Load Factor - Calculated by ORNL as pmt/vmt.<br />
Energy Use - APTA, <strong>20</strong>00 Transit Fact Book, <strong>20</strong>00,Washington, DC. Transit was defined<br />
as the sum of “heavy rail,” “light rail,” and “other.”<br />
<strong>TRANSPORTATION</strong> <strong>ENERGY</strong> <strong>DATA</strong> <strong>BOOK</strong>: <strong>EDITION</strong> <strong>20</strong>-<strong>20</strong>00
Highway<br />
Trucks<br />
Nonhighway<br />
Waterborne Commerce<br />
Table 2.13<br />
Intercity Freight Movement and Energy Use in the<br />
United States, 1998<br />
Vehicles - 0.4% of total 2-axle, 4-tire trucks (as reported by DOT, FHWA in Highway Statistics<br />
1998, Table VM-1) and 29% of total other trucks were engaged in intercity freight<br />
movement. These percentages were derived by ORNL from the 1997 VIUS Micro Data<br />
File on CD. Intercity freight trucks were defined as any truck whose:<br />
- greatest share of miles were traveled more than 50 miles away from the<br />
vehicle’s home base; and<br />
- principal use was not personal or passenger transportation; and<br />
- body type was not pickup, minivan, or utility vehicle.<br />
Vmt - 0.7% of total vehicle miles traveled by 2-axle, 4-tire trucks (as reported by DOT, FHWA<br />
in Highway Statistics 1998, Table VM-1) and 65.2% of total vehicle miles traveled by<br />
other trucks were used in intercity freight movement. These percentages were derived by<br />
ORNL from the 1997 VIUS Micro Data File on CD.<br />
Ton Miles, Tons Shipped and Average Length of Haul - Eno Transportation Foundation,<br />
Transportation in America 1999, Seventeenth Edition, Lansdowne, VA, <strong>20</strong>00, pp. 44,46,<br />
71.<br />
Energy Intensity - Energy use divided by ton-miles.<br />
Energy Use - 1.0% of total fuel consumption by 2-axle, 4-tire trucks (as reported by DOT,<br />
FHWA in Highway Statistics 1998, Table VM-1) and 71.3% of total other truck fuel<br />
consumption were used in intercity freight movement. These percentages were derived<br />
by ORNL from the 1997 VIUS Micro Data File on CD.<br />
Vehicles - U.S. Department of the Army, Army Corps of Engineers, “Summary of U.S. Flag<br />
Passenger and Cargo Vessels, 1998,” New Orleans, LA, <strong>20</strong>00.<br />
Ton Miles, Tons Shipped, and Average Length of Haul - U.S. Department of the Army, Corps<br />
of Engineers, Waterborne Commerce of the United States, Calendar Year 1998, Part 5:<br />
National Summaries, New Orleans, LA, <strong>20</strong>00, pp. l-6, l-7.<br />
Energy Intensity - Energy use divided by ton miles.<br />
Energy Use - DOE, EIA, Fuel Oil and Kerosene Sales 1998 Table 23. Adjusted sales of<br />
distillate and residual fuel oil <strong>for</strong> vessel bunkering. (This may include some amounts of<br />
bunker fuels used <strong>for</strong> recreational purposes.)<br />
Domestic freight energy use was calculated as:<br />
Distillate fuel - 77.5% domestic<br />
Residual fuel - 9.3% domestic.<br />
Percentages were derived from the DOC, U.S. Foreign Trade, Bunker Fuels, “Oil and<br />
Coal Laden in the U.S. on Vessels Engaged in Foreign Trade,” 1988.<br />
<strong>TRANSPORTATION</strong> <strong>ENERGY</strong> <strong>DATA</strong> <strong>BOOK</strong>: <strong>EDITION</strong> <strong>20</strong>-<strong>20</strong>00<br />
A-15
A-16<br />
Pipeline<br />
Rail<br />
Natural Gas:<br />
Tons shipped - DOE, EIA, Natural Gas Annual 1998, Washington, DC, 1999, Table 1. Total<br />
natural gas disposition divided by 44,870 ft3/ton.<br />
Energy use - The amount of natural gas used to transport natural gas was defined as “pipeline<br />
fuel” as reported in DOE, EIA, Natural Gas Annual 1998, Table 1. Cubic feet were<br />
converted to Btu using 1,03 1 Btu/ft3. Electricity use was estimated using the following<br />
procedure as reported on p. 5-110 of J. N. Hooker et al., End Use Energy Consumption<br />
DataBase: Transportation Sector. The energy consumption of a natural gas pipeline was<br />
taken to be the energy content of the fuel used to drive the pumps. Some 94% of the<br />
installed pumping horsepower was supplied by natural gas. The remaining 6% of the<br />
horse power was generated more efficiently, mostly by electric motors. The energy<br />
consumed by natural gas pipeline pumps that were electrically powered was not known.<br />
In order to estimate the electricity consumed, the Btu of natural gas pipeline fuel<br />
consumed was multiplied by a factor of 0.015. From this computed value, electricity<br />
efficiency and generation loss must be taken into account. The electricity energy use in<br />
Btu must be converted to IWhr, using the conversion factor 29.305 x 10e5 lWhr/Btu.<br />
Electricity generation and distribution efficiency was 29%. When generation and<br />
distribution efficiency are taken into account, 1 1Whr equals 11,765 Btu.<br />
Crude Oil and Petroleum Product:<br />
Ton Miles and Tons Shipped - Eno Transportation Foundation, Transportation in America<br />
1999, Seventeenth Edition, Lansdowne, VA, <strong>20</strong>00, pp. 44,46.<br />
Energy Use - W. F. Banks, Systems, Science, and Software, Inc., Energy Consumption<br />
in the Pipeline Industry, LaJolla, CA, 1977.<br />
Vehicles, Vmt, Tons, Ton Miles, Average Length of Haul and Energy Use - AAR, Railroad<br />
Facts, 1999 Edition, Washington, DC, 1999.<br />
<strong>TRANSPORTATION</strong><strong>ENERGY</strong><strong>DATA</strong>BOOIC <strong>EDITION</strong>~O-<strong>20</strong>00
Highway<br />
Automobiles<br />
Table 2.12<br />
Energy Intensities of Passenger Modes, 1970-98<br />
In reference to transportation, the energy intensity of a mode is the ratio of the energy inputs to<br />
a process to a measure of the useful outputs from that process; <strong>for</strong> example, Btu per pmt or Btu<br />
per ton-mile. The energy intensity ratios were calculated <strong>for</strong> each passenger mode using the<br />
following data sources:<br />
Vmt - DOT, FHWA, Highway Statistics Summary to 1995, Table VM-<strong>20</strong>1A, and Table VM-1<br />
of the 1996-98 editions.<br />
Pmt - vmt multiplied by the load factor.<br />
Energy Use - Total gallons of fuel <strong>for</strong> automobiles was taken from DOT, FHWA,<br />
Highway Statistics Summary to 1995, Table VM-<strong>20</strong> 1A; and Table VM- 1 in the 1996-98<br />
annual editions. Fuel <strong>for</strong> automobiles was distributed between fuel types <strong>for</strong> conversion<br />
into Btu’s as follows:<br />
1970-80 - 94.7% gasoline, 5.3% diesel as reported in the DOE, EIA, Office of Energy<br />
Markets and End Use, Residential Energy Consumption Survey: Consumption<br />
Patterns of Household Vehicles, June 1979 to December 1980, p. 10.<br />
1981-82 - 94.1% gasoline, 5.9% diesel as reported in the DOE, EIA, Office of Energy<br />
Markets and End Use, Residential Energy Consumption Survey: Consumption<br />
Patterns ofHousehold Vehicles, Supplement: January I981 to September 1981, pp.<br />
11, 13.<br />
1983-84 - 97.5% gasoline, 2.5% diesel as reported in the DOE, EIA, Office of Markets<br />
and End Use, Energy End Use Division, Residential Transportation Energy<br />
Consumption Survey: Consumption Patterns of Household Vehicles, 1983, Jan.,<br />
1985, pp. 7, 9.<br />
1985-87 - 98.5% gasoline, 1.5% diesel as reported in the DOE, EIA, Office of Energy<br />
Markets and End Use, Residential Transportation Energy Consumption Survey.<br />
Consumption Patterns of Household Vehicles 1985, April 1987, pp. 25,27.<br />
1988-90 - 98.8% gasoline and 1.2% diesel as reported in the DOE, EIA, Office of<br />
Markets and End Use, Energy End Use Division, Household Vehicles Energy<br />
Consumption 1988, March 1990, p. 65.<br />
1991-93 - 97.8% gasoline, 1 .O% gasohol, and I .2% diesel as reported in the DOE, EIA,<br />
Office of Markets and End Use, Energy End Use Division, Household Vehicles<br />
Energy Consumption 1991, December 1993, p. 46.<br />
1994-98 - 97.7% gasoline, 1.0% gasohol, 1.3% diesel as reported in the DOE, EIA,<br />
Office of Energy Markets and End Use, Household Vehicles Energy Consumption<br />
1994, Washington, DC, August 1997, p. 46.<br />
1993-98 - Methanol use was estimated using data from DOE, EIA, Alternatives to<br />
Traditional Transportation Fuels 1999, Washington, DC, 1998, Table 12.<br />
1993-98 - Natural gas data are from the DOE, EIA Natural Gas Annual 1998, Table 1;<br />
transit bus natural gas was subtracted from the total and the remainder was assumed<br />
to be light vehicle use. Automobiles were assumed to use 25% of light vehicle<br />
natural gas use.<br />
<strong>TRANSPORTATION</strong> <strong>ENERGY</strong> <strong>DATA</strong> <strong>BOOK</strong>: <strong>EDITION</strong> <strong>20</strong>-<strong>20</strong>00<br />
A-17
A-18<br />
Light Trucks<br />
Buses<br />
Vmt - DOT, FHWA, Highway Statistics Summary to 1995, Table VM-<strong>20</strong> 1 A, and Table VM- 1<br />
of the 1996-98 editions. Light trucks were defined as 2-axle, 4-tire trucks.<br />
Energy Use - Defined as 2-axle, 4-tire trucks. Total gallons of fuel was taken from DOT,<br />
FHWA, Highway Statistics Summary to 1995, Table VM-<strong>20</strong> 1 A, and Table VM- 1 of the<br />
1996-98 annual editions. Based on data from the 1982 TIUS Public Use Tape, fuel use<br />
<strong>for</strong> 1970-87 was distributed among fuel types as follows: 95.3% gasoline; 3.5% diesel;<br />
and 1.2% lpg. .Fuel use <strong>for</strong> 1988-93 was distributed based on the 1987 TIUS: 96.6%<br />
gasoline; 3.3% diesel; and 0.1% lpg. Fuel use <strong>for</strong> 1994-96 was distributed based on the<br />
1992 TIUS: 96.4% gasoline; 3.3% diesel; 0.3% Ipg. Fuel use <strong>for</strong> 1997-98 was based on<br />
the 1997 VIUS: 96.3% gasoline, 3.4% diesel, 0.2% lpg. Natural gas data are fl-om the<br />
DOE, EIA Natural Gas Annual 1998, Table 1; transit bus natural gas was subtracted from<br />
the total and the remainder was assumed to be light vehicle use. Light trucks were<br />
assumed to use 75% of light vehicle natural gas use.<br />
Transit:<br />
Vmt, Pmt, Energy Use - APTA, <strong>20</strong>00 Transit Fact Book, Washington, DC, <strong>20</strong>00, and annual.<br />
Non-diesel fossil fuel consumption was assumed to be used by motor buses. For the<br />
years 1988-94, motor bus gasoline use was estimated as 5% of “other” fuels, based<br />
on personal communication with the APTA Research and Statistics Department.<br />
In &city:<br />
Pmt - 1970-84 - American Bus Association, Annual Report, Washington, DC,<br />
annual.<br />
1985-98 - Eno Transportation Foundation, Transportation in America 1999,<br />
Seventeenth Edition, Lansdowne, VA, <strong>20</strong>00, p. 47.<br />
Vmt - 1990-98 - Estimated using passenger travel and an average load factor of 23.2.<br />
Energy Use - 1970-84 - American Bus Association, Annual Report, Washington,<br />
DC, annual.<br />
1985-98 - Eno Transportation Foundation, Transportation in America 1999,<br />
Seventeenth Edition, Lansdowne, VA, p. 56, and annual. For conversion purposes,<br />
fuel <strong>for</strong> all intercity buses was assumed to be diesel fuel.<br />
School:<br />
Vmt - 1970-84 - DOT, FHWA, Highway Statistics 1984, Washington, DC, Table<br />
VM-1, p. 175, and annual.<br />
1985-87 - DOT, TSC, National Transportation Statistics, 1989, Figure 2, p. 7, and<br />
annual.<br />
1988-98- National Safety Council, Accident Facts, 1999 Edition, Chicago, IL, and<br />
annual.<br />
Energy Use - 1970-84 - DOT, FHWA, Highway Statistics 1984, Washington,<br />
DC, Table VM- 1, and annual.<br />
1985-86 - DOT, TSC, National TransportationStatistics,Figure 2, p. 5, and annual.<br />
1987-98 - Eno Transportation Foundation, Transportation in America 1999,<br />
Seventeenth Edition, Lansdowne, VA, p. 56, and annual. For conversion purposes,<br />
fuel <strong>for</strong> school buses was assumed to be 90% diesel fuel and 10% gasoline based on<br />
estimates from the National Association of State Directors of Pupil Transportation<br />
Services.<br />
<strong>TRANSPORTATION</strong> <strong>ENERGY</strong> <strong>DATA</strong> <strong>BOOK</strong>: <strong>EDITION</strong> <strong>20</strong>-<strong>20</strong>00
Nonhighway<br />
Air<br />
Rail<br />
Certificated Air Carriers:<br />
Pmt - DOT, Bureau of Transportation Statistics, Air Carrier Traffic Statistics Monthly,<br />
December 1998199, Washington, DC, p. 2.<br />
Energy Use - 1970-81 - DOT, Civil Aeronautics Board, Fuel Cost and Consumption,<br />
Washington, DC, annual.<br />
1982-98 - DOT, Bureau of Transportation Statistics, “Fuel Cost and<br />
Consumption Tables;” annual figures were obtained by summing monthly<br />
totals <strong>for</strong> domestic only.<br />
General Aviation:<br />
Pmt - Eno Transportation Foundation, Transportation In America 1999, Seventeenth<br />
Edition, Washington, DC, 1999, p.47.<br />
Energy Use - 1970-74 - DOT, TSC, National Transportation Statistics, Cambridge,<br />
MA, 1981.<br />
1975-85 - DOT, FAA, FAA Aviation Forecasts, Washington, DC, annual.<br />
1985-98 - DOT, FAA, General Aviation Activity and Avionics Survey: Calendar<br />
Year 1998, Table 5.1. Jet fuel was converted from gallons to Btu using 135,000<br />
Btu/gallon (kerosene-type jet fuel).<br />
Passenger (Am tral):<br />
Pmt - 1971-83 - AAR, Statistics of Class IRailroads, Washington, DC, annual.<br />
1984-88, 1995-96 - AAR, Railroad Facts, 1987 Edition, Washington, DC,<br />
December 1987, p. 78, and annual.<br />
1989-94 - Personal communication with Amtrak.<br />
1995-98 - AAR, Railroad Facts, 1999 Edition, Washington, DC, 1999, p. 77, and<br />
annual.<br />
Energy Use - Personal communication with Amtrak. (1995-98 were estimated using<br />
train-mile in<strong>for</strong>mation.)<br />
Transit:<br />
Pmt and Energy Uke - APTA, <strong>20</strong>00 Transit Fact Book, Washington, DC, <strong>20</strong>00.<br />
Transit was defined as the sum of “heavy rail,” “light rail.”<br />
A-19
A-<strong>20</strong><br />
Highway<br />
Table 2.14<br />
Energy Intensities of Freight Modes, 1970-98<br />
In reference to transportation, the energy intensity of a mode is the ratio of the energy inputs to<br />
a process to a measure of the useful outputs from that process; <strong>for</strong> example, Btu per pmt or Btu<br />
per ton-mile. The energy intensity ratios were calculated <strong>for</strong> each freight mode using the<br />
following data sources:<br />
Heavy Single-Unit and Combination Trucks<br />
Vmt - DOT, FHWA, Highway Statistics Summary to 1995, Table VM-<strong>20</strong>1A, and Table VM-1<br />
of the 1996-98 editions. Heavy single-unit and combination trucks were defined as the<br />
difference between total trucks and 2-axle, 4-tire trucks.<br />
Energy Use - Defined as the difference between total trucks and 2-axle, 4-tire trucks. Total<br />
gallons of fuel was taken from DOT, FHWA, Highway Statistics Summary to f995, Table<br />
VM-<strong>20</strong>1A, and Table VM-1 of the 1996-98 annual editions. Based on data from the<br />
1982 TIUS Public Use Tape, fuel use <strong>for</strong> 1970-87 was distributed among fuel types as<br />
follows: 39.6% gasoline; 59.4% diesel; and 1.0% lpg. Fuel use <strong>for</strong> 1988-93 was<br />
distributed based on the 1987 TIUS: 19.4% gasoline; 80.4% diesel; and 0.2% lpg. Fuel<br />
use <strong>for</strong> 1994-96 was distributed based on the 1992 TIUS: 16.2% gasoline; 83.3O/o diesel;<br />
and 0.5% lpg. Fuel use <strong>for</strong> 1997-98 was distributed as follows based on data from the<br />
1997 VIUS Public Use CD: 12.4% of fuel assumed to be gasoline, 87.1% diesel, and<br />
0.5% lpg.<br />
Nonhighway<br />
Water<br />
Rail<br />
Ton Miles - U.S. Department of the Army, Corps of Engineers, Waterborne Commerce of the<br />
UnitedStates, Calendar Year 1999, Part 5: NationalSummaries, New Orleans, LA, <strong>20</strong>00,<br />
p. l-6, and annual.<br />
Energy Use - Calculated as the difference between total water freight energy use and <strong>for</strong>eign<br />
water freight energy use.<br />
Total - DOE, EIA, Fuel Oil and Kerosene Sales 1998, Table 23. Adjusted sales of<br />
distillateandresidual fuel oil <strong>for</strong> vessel bunkering. (This may include some amounts<br />
of bunker fuels used <strong>for</strong> recreational purposes.)<br />
Freight Car Miles, Ton Miles and Energy Use - AAR, Railroad Facts, 1999 Edition,<br />
Washington, DC, 1999, and annual.<br />
<strong>TRANSPORTATION</strong><strong>ENERGY</strong>DAYABOOIC <strong>EDITION</strong>~O-<strong>20</strong>00
Highway<br />
Automobiles<br />
Motorcycles<br />
Table 6.4<br />
Vehicle Stock and New Sales in the<br />
United States, 1998 Calendar Year<br />
Stock -The number of vehicles in use by EPA size class were derived as follows: Market Shares<br />
by EPA size class <strong>for</strong> new car sales from 1970-75 were taken from the DOT, NHTSA,<br />
Automotive CharacteristicsHistoricalDataBase, Washington, DC. Market shares <strong>for</strong> the<br />
years 1976-90 were found in Linda S. Williams and Patricia S. Hu, Highway Vehicle<br />
MPG and Market Shares Report: Model Year 1990, ORNL-6672, April 1991, and<br />
Table 7 and the ORNL MPG and Market Shares Database, thereafter. These data were<br />
assumed to represent the number of cars registered in each size class <strong>for</strong> each year. These<br />
percentages were applied to the automobiles in operation <strong>for</strong> that year as reported by The<br />
Polk Company (FURTHER REPRODUCTION PROHIBITED) and summed to calculate<br />
the total mix. This method assumed that all vehicles, large and small, were scrapped at<br />
the same rate.<br />
Sales - Domestic, import, and total sales were from Ward’s Motor Vehicle Facts and Figures<br />
1999, p. 15. The domestic sales were distributed by size class according to the following<br />
percentages: Two seater, 0.0%; Minicompact, 18.9%; Subcompact, 27.6%; Compact<br />
37.3%; Midsize, 15.4%; and Large, 0.8%. The import sales were distributed by size class<br />
according to the following percentages: Two-seater, 0.9%; Minicompact, 16.4%;<br />
Subcompact, 33.7%; Compact, 44.2%; Midsize, 1.3%; and Large, 3.5%. These<br />
percentages were derived from the ORNL MPG and Market Shares Database. Domesticsponsored<br />
imports (captive imports) were included in the import figure only.<br />
Business Jleet autos - Bobit Publishing Company, Automotive Fleet Research Department,<br />
Automotive Fleet Factboolc 1999, Redondo Beach, CA, 1999.<br />
Personal autos - Difference between total vehicle stock and business fleet autos.<br />
See Glossary <strong>for</strong> deJinition of Automobile Size Classijkations.<br />
Stock - DOT, FHWA, Highway Statistics 1998, Table VM- 1, 1999.<br />
Recreational Vehicles<br />
Sales - Ward’s Automotive Yearbook 1999, U.S. Recreation Vehicle Shipments by Type,<br />
“Total,” p. 242.<br />
<strong>TRANSPORTATION</strong> <strong>ENERGY</strong> <strong>DATA</strong> <strong>BOOK</strong>: <strong>EDITION</strong> <strong>20</strong>-<strong>20</strong>00<br />
A-2 1
A-22<br />
Trucks<br />
Stock - Vehicles in use by weight class were determined by applying the percentage in use by<br />
weight class as reported in DOC, Bureau of the Census, 1997 VIUS, (O-10,000 lbs,<br />
93.5%; lO,OOl-19,500 lbs, 2.0%; 19,501-26,000 Ibs, 1.0%; 26,001 lbs and over, 3.5%)<br />
to the total number of trucks in use as reported by R. L. Polk and Company (FURTHER<br />
REPRODUCTION PROHIBITED).<br />
Sales -Ward’s Motor Vehicle Facts and Figures 1999, p. 25.<br />
Business Jeet trucks - Bobit Publishing Company, Automotive Fleet Research Department,<br />
Automotive Fleet Factboolc 1998, Redondo Beach, CA, 1998.<br />
Personal trucks - Difference between total stock and business fleet trucks.<br />
<strong>TRANSPORTATION</strong><strong>ENERGY</strong><strong>DATA</strong><strong>BOOK</strong>: <strong>EDITION</strong>~O-<strong>20</strong>00
Number in Operation<br />
Table 8.13<br />
Summary Statistics on Buses by Type, 1970-98<br />
Transit buses:<br />
American Public Transit Association, <strong>20</strong>00 Transit Fact Book, Washington, DC, <strong>20</strong>00,<br />
p. 83, and annual.<br />
Intercity buses:<br />
1970-80 - AmericanBus Association, 1984 Annual Report, Washington, DC, and annual.<br />
1985 - U.S. Department of Transportation, Transportation Systems <strong>Center</strong>, Natiovral<br />
Transportation Statistics, Cambridge, MA, August 1990, Figure 5, p. 8, and annual.<br />
1990-98 - Estimated as 3 8% of commercial buses (less transit motor buses). Commercial<br />
bus total found in Highway Statistics 1998, Table MV-10, and annual.<br />
School buses:<br />
U.S. Department of Transportation, Federal Highway AdministrationJYighway Statistics<br />
1998, Washington, DC, 1999, Table MV- 1 ,O and annual.<br />
Vehicle-miles and Passenger-miles<br />
Transit buses:<br />
American Public Transit Association, <strong>20</strong>00 Transit Fact Book, Washington, DC, <strong>20</strong>00,<br />
pp. 70, 78, and annual.<br />
In tercity buses :<br />
1970-80 - American Bus Association, Annual Report, Washington, DC, annual.<br />
1985-98 - Eno TransportationFoundation, Transportation in America 1999, Seventeenth<br />
edition, Lansdowne, VA, <strong>20</strong>00, p. 47.<br />
1990-98 vehicle travel - Estimated using passenger travel and an average load factor of<br />
23.2.<br />
School buses:<br />
1970-80 - U.S. Department of Transportation, Federal Highway Administration,Highway<br />
Statistics 1984, Washington, DC, Table VM-1, p. 175, and annual.<br />
198.5 - U.S. Department of Transportation, Research and Special Programs<br />
Administration, National Transportation Statistics, 1989, Figure 2, p. 7, and annual.<br />
1990-98 - National Safety Council, Accident Facts, 1999 Edition, Chicago, IL, pp. 94,<br />
and annual. Note: In the 1999 Edition the National Safety Council discontinued<br />
publishing the passenger-miles data. There is currently no other known source <strong>for</strong><br />
these data.<br />
TRANSEORTATION<strong>ENERGY</strong><strong>DATA</strong><strong>BOOK</strong>: <strong>EDITION</strong>~O-<strong>20</strong>00<br />
A-23
A-24<br />
Energy Use<br />
Transit buses:<br />
American Public Transit Association, <strong>20</strong>00 Transit Fact Book, Washington, DC, <strong>20</strong>00,<br />
pp. 112-l 14. Gasoline consumption was assumed to be used by motor buses. For<br />
the years 1988-92, motor bus gasoline use was estimated as 5% of “other” fuels,<br />
based on personal communication with the APTA Research and Statistics<br />
Department.<br />
Intercity buses:<br />
1970-80 - American Bus Association, Annual Report, Washington, DC, annual.<br />
1985-98 - Eno Transportation Foundation, Transportation in America 1999, Seventeenth<br />
edition, Lansdowne, VA, p. 56. For conversion purposes, fuel <strong>for</strong> all intercity buses<br />
was assumed to be diesel fuel.<br />
School buses:<br />
1970-80 - DOT, FHWA, Highway Statistics 1984, Washington, DC, Table VM-1, and<br />
annual.<br />
1985-86 - DOT, Research and Special Programs Administration,National Transportation<br />
Statistics, Figure 2, p. 5, and annual.<br />
1987-98- Eno Transportation Foundation, Transportation in America 1999,Seventeenth<br />
edition, Lansdowne, VA, p. 56. For conversion purposes, fuel <strong>for</strong> school was<br />
assumed to be 90% diesel fuel and 10% gasoline based on estimates from the<br />
National Association of State Directors of Pupil Transportation Services.
APPENDIX B<br />
CONVERSIONS<br />
A Note About Heating Values<br />
The heat content of a fuel is the quantity of energy released by burning a unit amount of<br />
that fuel. However, this value is not absolute and can vary according to several factors. For<br />
example, empirical <strong>for</strong>mulae <strong>for</strong> determining the heating value of liquid fuels depend on the fuels’<br />
American Petroleum Institute (API) gravity. The API gravity varies depending on the percent by<br />
weight of the chemical constituents and impurities in the fuel, both of which are affected by the<br />
combination of raw materials used to produce the fuel and by the type of manufacturing process.<br />
Temperature and climatic conditions are also factors.<br />
Because of these variations, the heating values in Table B. 1 may differ from values in other<br />
publications. The figures in this report are representative or average values, not absolute ones.<br />
The gross heating values used here agree with those used by the Energy In<strong>for</strong>mation<br />
Administration (EIA).<br />
Heating values fall into two categories, gross and net. If the products of fuel combustion<br />
are cooled back to the initial fuel-air or fuel-oxidizer mixture temperature and the water <strong>for</strong>med<br />
during combustion is condensed, the energy released by the process is the higher (gross) heating<br />
value. If the products of combustion are cooled to the initial fuel-air temperature, but the water<br />
is considered to remain as a vapor, the energy released by the process is lower (net) heating value.<br />
Usually the difference between the gross and net heating values <strong>for</strong> fuels used in transportation is<br />
around 5 to 8 percent; however, it is important to be consistent in their use.<br />
<strong>TRANSPORTATION</strong><strong>ENERGY</strong><strong>DATA</strong>BOOIC <strong>EDITION</strong>~O-<strong>20</strong>00<br />
B-l
B-2<br />
Automotive gasoline<br />
Diesel motor fuel<br />
Methanol<br />
Ethanol<br />
Gasohol<br />
Aviation gasoline<br />
Propane<br />
Butane<br />
Jet fuel (naphtha)<br />
Jet fuel (kerosene)<br />
Lubricants<br />
Waxes<br />
Asphalt and road oil<br />
Petroleum coke<br />
Natural gas<br />
Wet<br />
Dry<br />
Compressed<br />
Liquid<br />
Crude petroleum<br />
Fuel Oils<br />
Coal<br />
Residual<br />
Distillate<br />
Table B.l<br />
Approximate Heat Content <strong>for</strong> Various Fuels<br />
Anthracite - Consumption<br />
Bituminous and lignite - Consumption<br />
Production average<br />
Consumption average<br />
125,000 Btu/gal(gross) = 115,400 Btu/gal(net)<br />
138,700 Btu/gal (gross) = 128,700 Btuigal (net)<br />
64,600 Btu/gal (gross) = 56,560 Btu/gal (net)<br />
84,600 Btu/gal (gross) = 75,670 Btu/gal (net)<br />
1<strong>20</strong>,900 Btu/gal (gross) = 112,417 Btu/gal (net)<br />
1<strong>20</strong>,<strong>20</strong>0 Btn/gal (gross) = 112,000 Btu/gal (net)<br />
91,300 Btu/gal (gross) = 83,500 Btu/gal (net)<br />
103,000 Btu/gal (gross) = 93,000 Btu/gal (net)<br />
127,500 B&/gal (gross) = 118,700 Btu/gal (net)<br />
135,000 Btu/gal (gross) = 128,100 Btu/gal (net)<br />
144,400 Btu/gal (gross) = 130,900 Btu/gal (net)<br />
131,800 Btu/gal (gross) = 1<strong>20</strong>,<strong>20</strong>0 Btu/gal (net)<br />
158,000 Btu/gal (gross) = 157,700 Btu/gal (net)<br />
143,400 Btu/gal (gross) = 168,300 Btu/gal (net)<br />
1,109 Btu/ft’<br />
1,027 Btu/ft’<br />
<strong>20</strong>,551 Btulpound<br />
960 Btu/cubic foot<br />
90,800 Btu/gal (gross) = 87,600 Btu/gal (net)<br />
138,100 Btu/gal (gross) = 131,800 Btu/gal (net)<br />
149,700 Btu/gal (gross) = 138,400 Btu/gal (net)<br />
138,700 Btu/gal (gross) = 131,800 Btu/gal (net)<br />
<strong>TRANSPORTATION</strong>ENIXRGY<strong>DATA</strong>BOOIC <strong>EDITION</strong>~O-<strong>20</strong>00<br />
21.711 x lO’Btu/short ton<br />
21.012 x lo6 Btukhort ton<br />
21.352 x lo6 Btu/short ton<br />
21.015 x lo6 Btu/short ton
1 million bbl crude oil/day<br />
1 billion bbl crude oil/year<br />
1 quadrillion Btu/year<br />
1 billion short tons coal/year<br />
1 billion metric tons coal/year<br />
1 trillion ft3 natural gas/year<br />
1 exajoule/year<br />
Table B.2<br />
Fuel Equivalents<br />
= 0.3650 billion bbl crude oil/year<br />
= 2.117 quadrillion Btu/year<br />
= 99.45 million short tons coal/year<br />
= 90.22 million metric tons coal/year<br />
= 2.061 trillion f? natural gas/year<br />
= 2.233 exajoulelyear<br />
= 2.740 million bbl crude oil/day<br />
= 5.800 quadrillion Btn/year<br />
= 272.5 million short tons coal/year<br />
= 247.2 million metric tons coal/year<br />
= 5.648 trillion ft3 natural gas/year<br />
= 6.119 exajoule/year<br />
= 0.4724 million bbl crude oil/day<br />
= 172.4 million bbl crude oil/year<br />
= 46.98 million short tons coal/year<br />
= 42.62 million metric tons coal/year<br />
= 973.7 billion ft3 natural gas/year<br />
= 1.055 X 10m3 exajoule/year<br />
= 0.9072 billion metric tons coal/year<br />
= 10.06 million bbl crude oil/day<br />
= 3.670 billion bbl crude oil/year<br />
= 2 1.29 quadrillion Btu/year<br />
= <strong>20</strong>.73 trillion ft3 natural gas/year<br />
= 22.46 exajoulelyear<br />
= 1.102 billion short tons coal/year<br />
= 9.122 million bbl crude oi l/day<br />
= 3.330 billion bbl crude oil/year<br />
= 19.3 1 quadrillion btu/year<br />
= 18.80 trillion ft3 natural gas/year<br />
= <strong>20</strong>.37 exajouleslyear<br />
= 0.485 1 million bbl crude oil/day<br />
= 0.177 1 billion bbl crude oil/year<br />
= 1.027 quadrillion Btu/year<br />
= 48.25 million short tons coal/year<br />
= 43.77 million metric tons coal/year<br />
= 1.083 X 10m3 exajoules/year<br />
= 0.4477 million bbl crude oil/day<br />
= 0.1634 billion bbl crude oil/year<br />
= 947.9 trillion Btu/year<br />
= 44.53 million short tons coal/year<br />
= 40.40 million metric tons coal/year<br />
= 0.9229 trillion ft3 natural gas/year<br />
<strong>TRANSPORTATION</strong> <strong>ENERGY</strong> <strong>DATA</strong> <strong>BOOK</strong>: <strong>EDITION</strong> <strong>20</strong>-<strong>20</strong>00<br />
B-3
B-4<br />
Table B.3<br />
Energy Unit Conversions<br />
IBtLl = 778.2 f&lb 1 kWhr =3412Btu”<br />
= 107.6 kg-m = 2.655 x lo6 ft-lb<br />
= 1055 J = 3.671 x lO’kg-m<br />
= 39.30 x 1O-5 hp-h = 3.600 x lo6 J<br />
= 39.85 x 10.’ metric hp-h = 1.341 hp-h<br />
= 29.31 x 1O-5 kWhr = 1.360 metric hp-h<br />
1 kg-m = 92.95 x 10e4 Btu 1 Joule = 94.78 x 1O-5 Btu<br />
= 7.233 ft-lb = 0.7376 ft-lb<br />
= 9.806 J = 0.10<strong>20</strong> kg-m<br />
= 36.53 x 1O-7 hp-h = 37.25 x 10.’ hp-h<br />
= 37.04 x 10m7 metric hp-h = 37.77 x 10.’ metric hp-h<br />
= 27.24 x 1O-7 kWhr = 27.78 x 10.’ kWhr<br />
1 hp-h = 2544 Btu 1 metric hp-h = 2510 Btu<br />
= 1.98 x lo6 ft-lb = 1.953 x lo6 ft-lb<br />
= 2.738 x lo6 kgm = 27.00 x lo4 kg-m<br />
= 2.685 x lo6 J = 2.648 x 10” J<br />
= 1 .O 14 metric hp-h = 0.9863 hp-h<br />
= 0.7475 kWhr = 0.7355 kWhr<br />
“This figure does not take into account the fact that electricity generation and distribution efficiency<br />
is approximately 29%. If generation and distribution efficiency are taken into account, 1 kWhr = 11,765<br />
BtLl.<br />
Table B.4<br />
International Energy Conversions<br />
To: TJ Gcal Mtoe Mbtu GWh<br />
From: multiply by:<br />
TJ 1 238.8 2.388 x 10.’ 947.8 0.2778<br />
Gcal 4.1868 x 1O-3 1 1 o-7 3.968 1.163 x 1O-3<br />
Mtoe 4.1868 x lo4 107 1 3.968 x lo7 11,630<br />
Mbtu 1.0551 x IO-3 0.252 2.52 X 1O-8 1 2.931 x 10⁻⁴<br />
Gwh 3.6 860 8.6 x 10⁻⁵ 3412 1<br />
<strong>TRANSPORTATION</strong> <strong>ENERGY</strong> <strong>DATA</strong> <strong>BOOK</strong>: <strong>EDITION</strong> <strong>20</strong>-<strong>20</strong>00
Table B.5<br />
Distance and Velocity Conversions<br />
1 in. = 83.33 x 10” ft 1 ft = 12.0 in.<br />
= 27.78 x 10” yd = 0.33 yd<br />
= 15.78 x 10-O mile = 189.4 x 10U3 mile<br />
= 25.40 x 10e3 m = 0.3048 m<br />
= 0.2540 x 1O-6 km = 0.3048 x 10” km<br />
1 mile = 63360 in. 1 km = 39370 in.<br />
= 5280 ft = 3281 ft<br />
= 1760 yd = 1093.6 yd<br />
= 1609 m = 0.6214 mile<br />
= 1.609 km = 1000 m<br />
1 pound methane, measured in carbon<br />
units (CH,)<br />
1 pound carbon dioxide, measured in<br />
carbon units (CO,-C)<br />
1 ftlsec = 0.3048 m/s = 0.6818 mph = 1.0972 km/h<br />
1 mfsec = 3.281 ftls = 2.237 mph = 3.600 km/h<br />
1 km/h = 0.9114 ftls = 0.2778 m/s = 0.6214 mph<br />
1 mph = 1.467 ftls = 0.4469 mls = 1.609 km/h<br />
Table B.6<br />
Alternative Measures of Greenhouse Gases<br />
= 1.333 pounds methane, measured at full<br />
molecular weight (CH,)<br />
= 3.6667 pounds carbon dioxide, measured at<br />
full molecular weight (CO,)<br />
1 pound carbon monoxide, measured in = 2.333 pounds carbon monoxide, measured at<br />
carbon units (CO-C) full molecular weight (CO)<br />
1 pound nitrous oxide, measured in<br />
nitrogen units (N,O-N)<br />
= 1.571 pounds nitrous oxide, measured at full<br />
molecular weight (N,O)<br />
<strong>TRANSPORTATION</strong> <strong>ENERGY</strong> <strong>DATA</strong> <strong>BOOK</strong>: <strong>EDITION</strong> <strong>20</strong>-<strong>20</strong>00<br />
B-5
B-6<br />
Table B.7<br />
Volume and Flow Rate Conversions”<br />
1 U.S. gal = 231 in.3 1 liter = 61.02 in.3<br />
= 0.1337 ft3 = 3.531 x lo-* ft3<br />
= 3.785 liters = 0.2624 U.S. gal<br />
= 0.8321 imperial gal = 0.2<strong>20</strong>0 imperial gal<br />
= 0.0238 bbl = 6.29 x 10” bbl<br />
= 0.003785 m3 = 0.001 m3<br />
A U.S. gallon of gasoline weighs 6.2 pounds<br />
1 imperial gal = 277.4 in.3 1 bbl = 9702 in.3<br />
= 0.1606 ft3 = 5.615 ft3<br />
= 4.545 liters = 158.97 liters<br />
= 1.<strong>20</strong>1 U.S. gal = 42 U.S. gal<br />
= 0.0286 bbl = 34.97 imperial gal<br />
= 0.004546 m3 = 0.15897 m3<br />
1 U.S. gal/hr = 3.<strong>20</strong>9 ft3/day = 1171 ft3/year<br />
= 90.84 liter/day = 33 157 liter/year<br />
= 19.97 imperial gal/day = 7289 imperial gal/year<br />
= 0.5712 bbl/day = <strong>20</strong>7.92 bbllyear<br />
For Imperial gallons, multiply above values by 1.<strong>20</strong>1<br />
1 literlhr = 0.8474 ft3/day = 309.3 ft3/year<br />
= 6.298 U.S. gal/day = 2299 U.S. gal/year<br />
= 5.28 imperial gal/day = 1927 imperial gal/year<br />
= 0.15 10 bbllday = 55.10 bbllyear<br />
1 bbllhr = 137.8 ft3/year = 49 187 ft3 year<br />
= 1008 U.S. gal/day = 3.679 x 1O’U.S. gal/year<br />
= 839.3 imperial gal/day = 3.063 x lo5 imperial gal/year<br />
= 3 8 15 liter/day = 1.393 x lo6 liter/day<br />
“The conversions <strong>for</strong> flow rates are identical to those <strong>for</strong> volume measures, if the time units are<br />
identical.<br />
<strong>TRANSPORTATION</strong> <strong>ENERGY</strong> <strong>DATA</strong> <strong>BOOK</strong>: <strong>EDITION</strong> <strong>20</strong>-<strong>20</strong>00
FROM<br />
Horsepower<br />
Horsepower Kilowatts<br />
1 0.7457<br />
Table B.8<br />
Power Conversions<br />
Metric<br />
horsepower<br />
1.014<br />
TO<br />
Ft-lb<br />
per set<br />
550<br />
Kilocalories<br />
per set<br />
0.1781<br />
Btu per set<br />
Kilowatts 1.341 1 1.360 737.6 0.239 0.9478<br />
Metric horsepower<br />
Ft-lb set<br />
per<br />
0.7068<br />
0.9863 0.7355 1 542.5 0.1757 0.6971<br />
1.36 x 1O-3 1.356 x 10” 1.84 x 1o-3 1 0.3238 x 10” 1.285 x 1O-3<br />
Kilocalories per set 5.615 4.184 5.692 3088 1 3.968<br />
Btu per set 1.415 1.055 1.434 778.2 0.25<strong>20</strong> 1
FROM Pound Kilogram<br />
Pound 1 0.4536<br />
Kilogram 2.<strong>20</strong>5 1<br />
Short ton <strong>20</strong>00 907.2<br />
Long ton 2240 1016<br />
Metric ton 2<strong>20</strong>5 1000<br />
Table B.9<br />
Mass Conversions<br />
Short ton<br />
5.0 x lOA<br />
1.1023 x 10”<br />
1<br />
1.12<br />
1.102<br />
Long ton Metric ton<br />
4.4643 x lo-’ 4.5362 x 1O-4<br />
9.8425 x 1O-4 1.0 x 10”<br />
0.8929 0.9072<br />
1 1.016<br />
0.9842 1
Table B.10<br />
Fuel Efficiency Conversions”<br />
MPG Miles/liter Kilometers/L L/l 00 kilometers<br />
10 2.64 4.25 23.52<br />
15 3.96 6.38 15.68<br />
<strong>20</strong> 5.28 8.50 11.76<br />
25 6.60 10.63 9.41<br />
30 7.92 12.75 7.84<br />
35 9.25 14.88 6.72<br />
40 10.57 17.00 5.88<br />
45 11.89 19.13 5.23<br />
50 13.21 21.25 4.70<br />
55 14.53 23.38 4.28<br />
60 15.85 25.51 3.92<br />
65 17.17 27.63 3.62<br />
70 18.49 29.76 3.36<br />
75 19.81 31.88 3.14<br />
80 21.13 34.01 2.94<br />
85 22.45 36.13 2.77<br />
90 23.77 38.26 2.61<br />
95 25.09 40.38 2.48<br />
100 26.42 42.51 2.35<br />
105 27.74 44.64 2.24<br />
110 29.06 46.76 2.14<br />
115 30.38 48.89 2.05<br />
1<strong>20</strong> 31.70 51.01 1.96<br />
125 33.02 53.14 1.88<br />
130 34.34 55.26 1.81<br />
135 35.66 57.39 1.74<br />
140 36.98 59.5 1 1.68<br />
145 38.30 61.64 1.62<br />
150 39.62 63.76 1.57<br />
“To convert fuel efficiency from miles per gallon (mpg) to liters per hundred<br />
kilometers, divide mpg into 235.24.<br />
<strong>TRANSPORTATION</strong> <strong>ENERGY</strong> <strong>DATA</strong> <strong>BOOK</strong>: <strong>EDITION</strong> <strong>20</strong>-<strong>20</strong>00<br />
B-9
B-10<br />
One million million millionth<br />
One thousand million millionth<br />
One million millionth<br />
One thousand millionth<br />
One millionth<br />
One thousandth<br />
One hundredth<br />
One tenth<br />
One<br />
Ten<br />
One hundred<br />
One thousand<br />
One million<br />
One billion”<br />
One trillion”<br />
One quadrillion”<br />
One quintillion”<br />
Table B.11<br />
SI Prefixes and Their Values<br />
Value<br />
10-18<br />
lo-‘5<br />
10-12<br />
10-9<br />
10-o<br />
IO-3<br />
IO-2<br />
10-I<br />
100<br />
10’<br />
lo2<br />
103<br />
106<br />
lo9<br />
10’2<br />
10’5<br />
10’8<br />
Prefix<br />
atto<br />
femto<br />
pica<br />
nano<br />
micro<br />
milli<br />
centi<br />
deci<br />
deca<br />
hecto<br />
kilo<br />
mega<br />
giga<br />
tera<br />
peta<br />
exa<br />
Symbol<br />
“Care should be exercised in the use of this nomenclature, especially in <strong>for</strong>eign correspondence, as it<br />
is either unknown or carries a different value in other countries. A “billion,” <strong>for</strong> example, signifies a value of<br />
lo’* in most other countries.<br />
<strong>TRANSPORTATION</strong> <strong>ENERGY</strong> <strong>DATA</strong> <strong>BOOK</strong>: <strong>EDITION</strong> <strong>20</strong>-<strong>20</strong>00<br />
f<br />
P<br />
11<br />
P<br />
m<br />
C<br />
k<br />
M<br />
G<br />
T<br />
P<br />
E
Table B.12<br />
Metric Units and Abbreviations<br />
Quantity Unit name Symbol<br />
Energy<br />
Specific energy<br />
Specific energy consumption<br />
Energy consumption<br />
Energy economy<br />
Power<br />
Specific power<br />
Power density<br />
Speed<br />
Acceleration<br />
Range (distance)<br />
Weight<br />
Torque<br />
Volume<br />
Mass; payload<br />
Length; width<br />
Brake specific fuel consumption<br />
Fuel economy (heat engine)<br />
joule<br />
joule/kilogram<br />
joule/ltilogram*l~ilometer<br />
joule/kilometer<br />
kilometer/kilojoule<br />
kilowatt<br />
watt/kilogram<br />
watt/meter3<br />
kilometer/hour<br />
meter/second*<br />
kilometer<br />
kilogram<br />
newtovmeter<br />
meter 3<br />
kilogram<br />
meter<br />
kilogram/joule<br />
liters/100 km<br />
<strong>TRANSPORTATION</strong><strong>ENERGY</strong><strong>DATA</strong>BOOIC <strong>EDITION</strong>~O-<strong>20</strong>00<br />
J<br />
J/kg<br />
J/(kg*lm)<br />
J/km<br />
km/kJ<br />
Kw<br />
W/kg<br />
W/m”<br />
km/h<br />
m/s*<br />
km<br />
1%<br />
Nom<br />
m3<br />
1%<br />
m<br />
kg/J<br />
L/l 00 km<br />
B-l 1
B-12<br />
Conversion of Constant Dollar Values<br />
Many types of in<strong>for</strong>mation in this data book are expressed in dollars.. Generally, constant<br />
dollars are used--that is, dollars of a fixed value <strong>for</strong> a specific year, such as 1990 dollars.<br />
Converting current dollars to constant dollars, or converting constant dollars <strong>for</strong> one year to<br />
constant dollars <strong>for</strong> another year, requires conversion factors (Table B. 13 and B. 14). Table B. 13<br />
shows conversion factors <strong>for</strong> the Consumer Price Index inflation factors. Table B. 14 shows<br />
conversion factors using the Gross National Product inflation factors.<br />
Due to the size of the tables, the data in Tables B. 13 and B. 14 were changed to two decimal<br />
places starting with Edition 17. However, three decimal places were used to calculate all constant<br />
dollar values.<br />
<strong>TRANSPORTATION</strong> <strong>ENERGY</strong> <strong>DATA</strong> <strong>BOOK</strong>: <strong>EDITION</strong> <strong>20</strong>-<strong>20</strong>00
Table B.13<br />
Consumer Price Inflation (CPI) Index<br />
To<br />
From 1970 1971 1972 1973 1974 1975 1976 1977 1978 1979 1980 1981 1982 1983 1984 1985 1986 1987 1988 1989 1990 1991 1992 1993 1994 1995 1996 1997 1998 1999<br />
1970 1.00 1.04 1.08 1.14 1.27 1.39 1.47 1.56 1.68 1.87 2.12 2.34 2.49 2.57 2.68 2.77 2.82 2.93 3.05 3.19 3.37 3.51 3.61 3.72 3.82 3.93 4.04 4.13 4.<strong>20</strong> 4.29<br />
1971 0.96 1.00 1.03 1.10 1.22 1.33 1.41 1.50 1.61 1.79 2.04 2.25 2.38 2.46 2.56 2.65 2.71 2.81 2.92 3.06 3.23 3.36 3.47 3.57 3.66 3.76 3.87 3.96 4.03 4.11<br />
1972 0.93 0.97 1.00 1.06 1.18 1.29 1.36 1.45 1.56 1.74 1.97 2.17 2.31 2.38 2.48 2.57 2.62 2.72 2.83 2.96 3.12 3.26 3.35 3.45 3.54 3.64 3.75 3.84 3.90 3.98<br />
1973 0.87 0.91 0.94 1.00 1.11 1.21 1.28 1.36 1.47 1.63 1.86 2.05 2.17 2.24 2.34 2.42 2.47 2.56 2.66 2.79 2.94 3.07 3.16 3.25 3.34 3.43 3.53 3.61 3.67 3.75<br />
1974 0.79 0.82 0.85 0.90 1.00 1.09 1.15 1.23 1.32 1.47 1.67 1.84 1.96 2.02 2.11 2.18 2.22 2.31 2.40 2.51 2.65 2.76 2.85 2.93 3.01 3.09 3.18 3.26 3.31 3.38<br />
1975 0.72 0.75 0.78 0.83 0.92 1.00 1.06 1.13 1.21 1.35 1.53 1.69 1.79 1.85 1.93 2.00 2.04 2.11 2.<strong>20</strong> 2.30 2.43 2.53 2.61 2.68 2.75 2.83 2.92 2.98 3.03 3.10<br />
1976 0.68 0.71 0.74 0.78 0.87 0.95 1.00 1.07 1.15 1.28 1.45 1.60 1.70 1.75 1.82 1.89 1.93 2.00 2.08 2.18 2.30 2.39 2.47 2.54 2.60 2.68 2.76 2.82 2.86 2.93<br />
1977 0.64 0.67 0.69 0.73 0.81 0.89 0.94 1.00 1.08 1.<strong>20</strong> 1.36 1.50 1.59 1.65 1.72 1.78 1.81 1.88 1.95 2.05 2.16 2.25 2.32 2.38 2.45 2.52 2.59 2.65 2.69 2.75<br />
1978 0.60 0.62 0.64 0.68 0.76 0.83 0.87 0.93 1.00 1.11 1.27 1.40 1.48 1.53 1.59 1.65 1.68 1.74 1.81 1.90 2.00 2.09 2.15 2.21 2.27 2.34 2.40 2.46 2.50 2.55<br />
1979 0.54 0.56 0.58 0.61 0.68 0.74 0.78 0.84 0.90 1.00 1.14 1.25 1.33 1.37 1.43 1.48 1.51 1.57 1.63 1.71 1.80 1.88 1.93 1.99 2.04 2.10 2.16 2.21 2.25 2.30<br />
1980 0.47 0.49 0.51 0.54 0.60 0.65 0.69 0.74 0.79 0.88 1.00 1.10 1.17 1.21 1.26 1.31 1.33 1.38 1.44 1.50 1.59 1.65 1.70 1.75 1.80 1.85 1.90 1.95 1.98 2.02<br />
1981 0.43 0.45 0.46 0.49 0.54 0.59 0.63 0.67 0.72 0.80 0.91 1.00 1.06 1.10 1.14 1.18 1.21 1.25 1.30 1.36 1.44 1.50 1.54 1.59 1.63 1.68 1.73 1.77 1.79 1.83<br />
1982 0.40 0.42 0.43 0.46 0.51 0.56 0.59 0.63 0.68 0.75 0.85 0.94 1.00 1.03 1.08 1.11 1.14 1.18 1.23 1.28 1.35 1.41 1.45 1.50 1.54 1.58 1.63 1.66 1.69 1.73<br />
1983 0.39 0.41 0.42 0.45 0.50 0.54 0.57 0.61 0.66 0.73 0.83 0.91 0.97 1.00 1.04 1.08 1.10 1.14 1.19 1.24 1.31 1.37 1.41 1.45 1.49 1.53 1.57 1.61 1.64 1.67<br />
1984 0.37 0.39 0.40 0.43 0.48 0.52 0.55 0.58 0.63 0.70 0.79 0.88 0.93 0.96 1.00 1.04 1.06 1.09 1.14 1.19 1.26 1.31 1.35 1.39 1.43 1.47 1.51 1.55 1.57 1.60<br />
1985 0.36 0.38 0.39 0.41 0.46 0.50 0.53 0.56 0.61 0.68 0.77 0.85 0.90 0.93 0.97 1.00 1.02 1.06 1.10 1.15 1.22 1.27 1.30 1.34 1.38 1.42 1.46 1.49 1.52 1.55<br />
1986 0.35 0.37 0.38 0.41 0.45 0.49 0.52 0.55 0.60 0.66 0.75 0.83 0.88 0.91 0.95 0.98 1.00 1.04 1.08 1.13 1.19 1.24 1.28 1.32 1.35 1.39 1.43 1.46 1.49 1.52<br />
1987 0.34 0.36 0.37 0.39 0.43 0.47 0.50 0.53 0.57 0.64 0.73 0.80 0.85 0.88 0.91 0.95 0.96 1.00 1.04 1.09 1.15 1.<strong>20</strong> 1.24 1.27 1.30 1.34 1.38 1.41 1.43 1.47<br />
1988 0.33 0.34 0.35 0.38 0.42 0.46 0.48 0.51 0.55 0.61 0.70 0.77 0.82 0.84 0.88 0.91 0.93 0.96 1.00 1.05 1.11 1.15 1.19 1.22 1.25 1.29 1.33 1.36 1.38 1.41<br />
1989 0.31 0.33 0.34 0.36 0.40 0.43 0.46 0.49 0.53 0.59 0.67 0.73 0.78 0.80 0.84 0.87 0.88 0.92 0.95 1.00 1.05 1.10 1.13 1.17 1.<strong>20</strong> 1.23 1.27 1.29 1.32 1.34<br />
1990 0.30 0.31 0.32 0.34 0.38 0.41 0.44 0.46 0.50 0.56 0.63 0.70 0.74 0.76 0.80 0.82 0.84 0.87 0.91 0.95 1.00 1.04 1.07 1.11 1.13 1.17 1.<strong>20</strong> 1.23 1.25 1.27<br />
1991 0.29 0.30 0.31 0.33 0.36 0.40 0.42 0.45 0.48 0.53 0.61 0.67 0.71 0.73 0.76 0.79 0.81 0.83 0.87 0.91 0.96 1.00 1.03 1.06 1.09 1.12 1.15 1.18 1.<strong>20</strong> 1.22<br />
1992 0.28 0.29 0.30 0.32 0.35 0.38 0.41 0.43 0.47 0.52 0.59 0.65 0.69 0.71 0.74 0.77 0.78 0.81 0.84 0.88 0.93 0.97 1.00 1.03 1.06 1.09 1.12 1.14 1.16 1.19<br />
1993 0.27 0.28 0.29 0.31 0.34 0.37 0.39 0.42 0.45 0.50 0.57 0.63 0.67 0.69 0.72 0.75 0.76 0.79 0.82 0.86 0.91 0.94 0.97 1.00 1.03 1.06 1.09 1.11 1.13 1.15<br />
1994 0.26 0.27 0.28 0.30 0.33 0.36 0.38 0.41 0.44 0.49 0.56 0.61 0.65 0.67 0.70 0.73 0.74 0.77 0.80 0.84 0.88 0.92 0.95 0.98 1.00 1.03 1.06 1.08 1.10 1.12<br />
1995 0.26 0.27 0.27 0.29 0.32 0.35 0.37 0.40 0.43 0.48 0.54 0.60 0.63 0.65 0.68 0.71 0.72 0.75 0.78 0.81 0.86 0.89 0.92 0.95 0.97 1.00 1.03 1.05 1.07 1.09<br />
1996 0.25 0.26 0.27 0.28 0.31 0.34 0.36 0.39 0.42 0.46 0.53 0.58 0.62 0.64 0.66 0.69 0.70 0.72 0.75 0.79 0.83 0.87 0.89 0.92 0.94 0.97 1.00 1.02 1.04 1.06<br />
1997 0.24 0.25 0.26 0.28 0.31 0.34 0.35 0.38 0.41 0.45 0.51 0.57 0.60 0.62 0.65 0.67 0.68 0.71 0.74 0.77 0.81 0.85 0.87 0.90 0.92 0.95 0.98 1.00 1.02 1.04<br />
1998 0.24 0.25 0.26 0.27 0.30 0.33 0.35 0.37 0.40 0.45 0.51 0.56 0.59 0.61 0.64 0.66 0.67 0.70 0.73 0.76 0.80 0.84 0.86 0.89 0.91 0.94 0.96 0.98 1.00 1.02<br />
1999 0.23 0.24 0.25 0.27 0.30 0.32 0.34 0.36 0.39 0.44 0.49 0.55 0.58 0.60 0.62 0.65 0.66 0.68 0.71 0.74 0.78 0.82 0.84 0.87 0.89 0.92 0.94 0.96 0.98 1.00<br />
Source:<br />
Personal contact with the Bureau of Labor Statistics.
Table B.14<br />
Gross National Product (GNP) Implicit Price Deflator<br />
To<br />
From 1970 1971 1972 1973 1974 1975 1976 1977 1978 1979 1980 1981 1982 1983 1984 1985 1986 1987 1988 1989 1990 1991 1992 1993 1994 1995 1996 1997 1998 1999<br />
1970 1.00 1.05 1.10 1.16 1.26 1.38 1.45 1.53 1.65 1.79 1.95 2.14 2.27 2.36 2.45 2.53 2.60 2.67 2.76 2.87 2.99 3.12 3.23 3.29 3.36 3.47 3.54 3.63 3.64 3.71<br />
1971 0.95 1.00 1.04 1.10 1.<strong>20</strong> 1.31 1.38 1.46 1.57 1.70 1.86 2.04 2.16 2.24 2.33 2.41 2.48 2.54 2.63 2.72 2.84 2.97 3.07 3.13 3.19 3.30 3.37 3.45 3.46 3.53<br />
1972 0.91 0.96 1.00 1.06 1.15 1.26 1.32 1.40 1.50 1.63 1.79 1.96 2.07 2.15 2.24 2.32 2.38 2.44 2.52 2.62 2.73 2.85 2.95 3.01 3.07 3.17 3.24 3.31 3.32 3.39<br />
1973 0.86 0.91 0.95 1.00 1.09 1.19 1.25 1.32 1.42 1.54 1.69 1.85 1.96 2.03 2.12 2.19 2.24 2.30 2.38 2.47 2.58 2.69 2.79 2.84 2.90 3.00 3.06 3.13 3.14 3.<strong>20</strong><br />
1974 0.79 0.83 0.87 0.92 1.00 1.09 1.15 1.22 1.31 1.42 1.55 1.70 1.80 1.87 1.95 2.01 2.06 2.12 2.19 2.28 2.37 2.48 2.56 2.61 2.67 2.76 2.81 2.88 2.89 2.95<br />
1975 0.73 0.76 0.80 0.84 0.92 1.00 1.05 1.11 1.<strong>20</strong> 1.30 1.42 1.55 1.65 1.71 1.78 1.84 1.89 1.94 2.01 2.08 2.17 2.27 2.34 2.39 2.44 2.52 2.57 2.63 2.64 2.69<br />
1976 0.69 0.73 0.76 0.80 0.87 0.95 1.00 1.06 1.14 1.24 1.35 1.48 1.57 1.63 1.70 1.75 1.80 1.84 1.91 1.98 2.06 2.15 2.23 2.27 2.32 2.40 2.44 2.50 2.51 2.56<br />
1977 0.65 0.69 0.71 0.76 0.82 0.90 0.95 1.00 1.07 1.17 1.27 1.40 1.48 1.54 1.60 1.65 1.70 1.74 1.80 1.87 1.95 2.03 2.11 2.15 2.19 2.26 2.31 2.37 2.37 2.42<br />
1978 0.61 0.64 0.67 0.70 0.77 0.84 0.88 0.93 1.00 1.09 1.19 1.30 1.38 1.43 1.49 1.54 1.58 1.62 1.68 1.74 1.81 1.89 1.96 2.00 2.04 2.11 2.15 2.<strong>20</strong> 2.21 2.25<br />
1979 0.56 0.59 0.61 0.65 0.70 0.77 0.81 0.86 0.92 1.00 1.09 1.<strong>20</strong> 1.27 1.32 1.37 1.42 1.45 1.49 1.54 1.60 1.67 1.74 1.80 1.84 1.88 1.94 1.98 2.03 2.03 2.07<br />
1980 0.51 0.54 0.56 0.59 0.65 0.71 0.74 0.78 0.84 0.92 1.00 1.10 1.16 1.21 1.26 1.30 1.33 1.36 1.41 1.47 1.53 1.60 1.65 1.68 1.72 1.78 1.81 1.86 1.86 1.90<br />
1981 0.47 0.49 0.51 0.54 0.59 0.64 0.68 0.72 0.77 0.84 0.91 1.00 1.06 1.10 1.15 1.18 1.21 1.25 1.29 1.34 1.40 1.46 1.51 1.54 1.57 1.62 1.66 1.70 1.70 1.74<br />
1982 0.44 0.46 0.48 0.51 0.56 0.61 0.64 0.68 0.73 0.79 0.86 0.94 1.00 1.04 1.08 1.12 1.15 1.18 1.22 1.26 1.32 1.38 1.42 1.45 1.48 1.53 1.56 1.60 1.60 1.64<br />
1983 0.42 0.45 0.46 0.49 0.53 0.58 0.61 0.65 0.70 0.76 0.83 0.91 0.96 1.00 1.04 1.08 1.10 1.13 1.17 1.22 1.27 1.32 1.37 1.40 1.42 1.47 1.50 1.54 1.54 1.57<br />
1984 0.41 0.43 0.45 0.47 0.51 0.56 0.59 0.62 0.67 0.73 0.80 0.87 0.92 0.96 1.00 1.04 1.06 1.08 1.12 1.16 1.21 1.27 1.31 1.34 1.37 1.41 1.44 1.47 1.48 1.51<br />
1985 0.40 0.42 0.43 0.46 0.50 0.54 0.57 0.61 0.65 0.71 0.77 0.85 0.90 0.93 0.94 1.00 1.03 1.05 1.09 1.13 1.18 1.23 1.28 1.30 1.33 1.37 1.40 1.43 1.44 1.47<br />
1986 0.39 0.40 0.42 0.45 0.49 0.53 0.56 0.59 0.63 0.69 0.75 0.82 0.87 0.91 0.94 0.97 1.00 1.03 1.06 1.10 1.15 1.<strong>20</strong> 1.24 1.27 1.29 1.34 1.36 1.40 i.40 1.43<br />
1987 0.38 0.40 0.41 0.44 0.47 0.52 0.54 0.58 0.62 0.67 0.73 0.80 0.85 0.89 0.92 0.95 0.98 1.00 1.04 1.08 1.12 1.17 1.21 1.24 1.26 1.30 1.33 1.36 1.36 1.39<br />
1988 0.36 0.38 0.40 0.42 0.46 0.50 0.53 0.56 0.60 0.65 0.71 0.77 0.82 0.85 0.89 0.92 0.94 0.97 1.00 1.04 1.08 1.13 1.17 1.19 1.22 1.26 1.28 1.31 1.32 1.34<br />
1989 0.35 0.37 0.38 0.40 0.44 0.48 0.51 0.54 0.58 0.62 0.68 0.75 0.79 0.82 0.86 0.88 0.91 0.93 0.96 1.00 1.04 1.09 1.13 1.15 1.17 1.21 1.24 1.27 1.27 1.29<br />
1990 0.34 0.35 0.37 0.39 0.42 0.46 0.49 0.51 0.55 0.60 0.66 0.72 0.76 0.79 0.83 0.85 0.87 0.89 0.93 0.96 1.00 1.05 1.08 1.10 1.13 1.16 1.19 1.22 1.22 1.24<br />
1991 0.32 0.34 0.35 0.37 0.40 0.44 0.47 0.49 0.53 0.57 0.63 0.69 0.73 0.76 0.79 0.81 0.83 0.86 0.89 0.92 0.96 1.00 1.04 1.06 1.08 1.11 1.14 1.16 1.17 1.19<br />
1992 0.31 0.33 0.34 0.36 0.39 0.43 0.45 0.48 0.51 0.55 0.61 0.66 0.70 0.73 0.76 0.78 0.81 0.83 0.86 0.89 0.92 0.97 1.00 1.02 1.04 1.08 1.10 1.12 1.13 1.15<br />
1993 0.30 0.32 0.33 0.35 0.38 0.42 0.44 0.47 0.50 0.54 0.59 0.65 0.69 0.72 0.75 0.77 0.79 0.81 0.84 0.87 0.91 0.95 0.98 1.00 1.02 1.05 1.08 1.10 1.10 1.13<br />
1994 0.30 0.31 0.33 0.35 0.38 0.41 0.43 0.46 0.49 0.53 0.58 0.64 0.68 0.70 0.73 0.75 0.77 0.79 0.82 0.85 0.89 0.93 0.96 0.98 1.00 1.03 1.05 1.08 1.08 1.10<br />
1995 0.29 0.30 0.32 0.33 0.36 0.40 0.42 0.44 0.47 0.52 0.56 0.62 0.65 0.68 0.71 0.73 0.75 0.77 0.80 0.83 0.86 0.90 0.93 0.95 0.97 1.00 1.02 1.05 1.05 1.07<br />
1996 0.28 0.30 0.31 0.33 0.36 0.39 0.41 0.43 0.46 0.51 0.55 0.60 0.64 0.67 0.69 0.71 0.73 0.75 0.78 0.81 0.84 0.88 0.91 0.93 0.95 0.98 1.00 1.02 1.03 1.05<br />
1997 0.26 0.29 0.30 0.32 0.35 0.38 0.40 0.42 0.45 0.49 0.54 0.59 0.63 0.65 0.68 0.70 0.72 0.74 0.76 0.79 0.82 0.86 0.89 0.91 0.93 0.96 0.98 1.00 1.00 1.02<br />
1998 0.27 0.29 0.30 0.32 0.35 0.38 0.40 0.42 0.45 0.49 0.54 0.59 0.62 0.65 0.68 0.70 0.71 0.73 0.76 0.79 0.82 0.86 0.89 0.91 0.92 0.95 0.97 1.00 1.00 1.02<br />
1999 0.27 0.28 0.30 0.31 0.34 0.37 0.39 0.41 0.44 0.48 0.53 0.58 0.61 0.64 0.66 0.68 0.70 0.72 0.74 0.77 0.80 0.84 0.87 0.89 0.91 0.94 0.96 0.98 0.98 1.00<br />
Source:<br />
U.S. Department of Commerce, Bureau of Economic Analysis, Su7vey of Cztwent Business, Washington, DC, monthly.
APPENDIX C<br />
CENSUS DIVISIONS AND REGIONS<br />
C-l
c-2<br />
Table C.l<br />
Census Divisions and Regions<br />
Northeast Division<br />
Mid-Atlantic region New England region<br />
New Jersey Pennsylvania Connecticut New Hampshire<br />
New York Maine Rhode Island<br />
Massachusetts Vermont<br />
South Division<br />
West South Central East South Central South Atlantic<br />
region region region<br />
Arkansas Alabama Delaware South Carolina<br />
Louisiana Kentucky Florida Virginia<br />
Oklahoma Mississippi Georgia Washington, DC<br />
Texas Tennessee Maryland West Virginia<br />
North Carolina<br />
Alaska<br />
Cali<strong>for</strong>nia<br />
Hawaii<br />
West Division<br />
Pacific region Mountain region<br />
West North Central region<br />
Iowa Nebraska<br />
Kansas North Dakota<br />
Minnesota South Dakota<br />
Missouri<br />
Oregon Arizona Nevada<br />
Washington Colorado New Mexico<br />
Idaho Utah<br />
Montana Wyoming<br />
Midwest Division<br />
East North Central region<br />
Illinois Ohio<br />
Indiana Wisconsin<br />
Michigan<br />
<strong>TRANSPORTATION</strong><strong>ENERGY</strong><strong>DATA</strong>BOOIC <strong>EDITION</strong>~O-<strong>20</strong>00
Pacific<br />
region<br />
Census Divisions and Regions<br />
west mvislon<br />
Mountain<br />
I West<br />
S<br />
Central<br />
Midwest Division<br />
West North<br />
Central region<br />
Northeast Division<br />
4*‘-<br />
South Atlantic<br />
region<br />
South Division
GLOSSARY<br />
Acceleration power - Measured in kilowatts. Pulse power obtainable from a battery used to<br />
accelerate a vehicle. This is based on a constant current pulse <strong>for</strong> 30 seconds at no less<br />
than 2/3 of the maximum open-circuit-voltage, at 80% depth-of-discharge relative to the<br />
battery’s rated capacity and at <strong>20</strong>” C ambient temperature.<br />
Air Carrier - The commercial system of air transportation consisting of certificated air carriers,<br />
air taxis (including commuters), supplemental air carriers, commercial operators of large<br />
aircraft, and air travel clubs.<br />
Certificated route air carrier: An air carrier holding a Certificate of Public Convenience<br />
and Necessity issued by the Department of Transportation to conduct scheduled interstate<br />
services. Nonscheduled or charter operations may also be conducted by these carriers.<br />
These carriers operate large aircraft (30 seats or more, or a maximum payload capacity<br />
of 7,500 pounds or more) in accordance with Federal Aviation Regulation part 121.<br />
Domestic air operator: Commercial air transportation within and between the 50 States<br />
and the District of Columbia. Includes operations of certificated route air carriers, Pan<br />
American, local service, helicopter, intra-Alaska, intra-Hawaii, all-cargo carriers and<br />
other carriers. Also included are transborder operations conducted on the domestic route<br />
segments of U.S. air carriers. Domestic operators are classified based on their operating<br />
revenue as follows:<br />
Majors - over $1 billion<br />
Nationals - $100-1 ,000 million<br />
Large Regionals - $10-99.9 million<br />
Medium Regionals - $0-9.99 million<br />
International air operator: Commercial air transportation outside the territory of the<br />
United States, including operations between the U.S. and <strong>for</strong>eign countries and between<br />
the U.S. and its territories and possessions.<br />
Supplemental air carrier: A class of air carriers which hold certificates authorizing them<br />
to per<strong>for</strong>m passenger and cargo charter services supplementing the scheduled service of<br />
the certificated route air carriers. Supplemental air carriers are often referred to as<br />
nonscheduled air carriers or “nonskeds. ”<br />
<strong>TRANSPORTATION</strong> <strong>ENERGY</strong> <strong>DATA</strong> <strong>BOOK</strong>: <strong>EDITION</strong> <strong>20</strong>-<strong>20</strong>00<br />
G-l
G-2<br />
Alcohol - The family name of a group of organic chemical compounds composed of carbon,<br />
hydrogen, and oxygen. The molecules in the series vary in chain length and are composed<br />
of a hydrocarbon plus a hydroxyl group. Alcohol includes methanol and ethanol.<br />
Amtrak - See Rail.<br />
Anthropogenic - Human made. Usually used in the context of emissions that are produced as the<br />
result of human activities.<br />
Automobile size classifications - Size classifications of automobiles are established by the<br />
Environmental Protection Agency (EPA) as follows:<br />
Minicompact - less than 85 cubic feet of passenger and luggage volume.<br />
Subcompact - between 85 to 100 cubic feet of passenger and luggage volume.<br />
Compact - between 100 to 110 cubic feet of passenger and luggage volume.<br />
Midsize - between 110 to 1<strong>20</strong> cubic feet of passenger and luggage volume.<br />
Large - more than 1<strong>20</strong> cubic feet of passenger and luggage volume.<br />
Two seater - automobiles designed primarily to seat only two adults.<br />
Station wagons are included with the size class <strong>for</strong> the sedan of the same name.<br />
Aviation - See General aviation.<br />
Aviation gasoline - All special grades of gasoline <strong>for</strong> use in aviation reciprocating engines,<br />
as given in the American Society <strong>for</strong> Testing and Materials (ASTM) Specification D 910.<br />
Includes all refinery products within the gasoline range that are to be marketed straight or<br />
in blends as aviation gasoline without further processing (any refinery operation except<br />
mechanical blending). Also included are finished components in the gasoline range which<br />
will be used <strong>for</strong> blending or compounding into aviation gasoline.<br />
Barges - Shallow, nonself-propelled vessels used to carry bulk commodities on the rivers and<br />
the Great Lakes.<br />
Battery efficiency - Measured in percentage. Net DC energy delivered on discharge, as a<br />
percentage of the total DC energy required to restore the initial state-of-charge. The<br />
efficiency value must include energy losses resulting from self-discharge, cell equalization,<br />
thermal loss compensation, and all battery-specific auxiliary equipment.<br />
Btu - The amount of energy required to raise the temperature of 1 pound of water 1 degree<br />
Fahrenheit at or near 39.2 degrees Fahrenheit. An average Btu content of fuel is the heat<br />
value per quantity of fuel as determined from tests of fuel samples.<br />
<strong>TRANSPORTATION</strong> <strong>ENERGY</strong> <strong>DATA</strong> <strong>BOOK</strong>: <strong>EDITION</strong> <strong>20</strong>-<strong>20</strong>00
Bunker - A storage tank.<br />
Bunkering fuels - Fuels stored in ship bunkers.<br />
Bus -<br />
Intercity bus: A standard size bus equipped with front doors only, high backed seats,<br />
luggage compartments separate from the passenger compartment and usually with restroom<br />
facilities, <strong>for</strong> high-speed long distance service.<br />
Motor bus: Rubber-tired, self-propelled, manually-steered bus with fuel supply on board<br />
the vehicle. Motor bus types include intercity, school, and transit.<br />
School and other nonrevenue bus: Bus services <strong>for</strong> which passengers are not directly<br />
charged <strong>for</strong> transportation, either on a per passenger or per vehicle basis.<br />
Transit bus: A bus designed <strong>for</strong> frequent stop service with front and center doors,<br />
normally with a rear-mounted diesel engine, low-back seating, and without luggage storage<br />
compartments or restroom facilities. Includes motor bus and trolley coach.<br />
Trolley coach: Rubber-tired electric transit vehicle, manually-steered, propelled by a<br />
motor drawing current, normally through overhead wires, from a central power source not<br />
on board the vehicle.<br />
Calendar year - The period of time between January 1 and December 31 of any given year.<br />
Captive imports - Products produced overseas specifically <strong>for</strong> domestic manufacturers.<br />
Carbon dioxide (CO,) - A colorless, odorless, non-poisonous gas that is a normal part of the<br />
ambient air. Carbon dioxide is a product of fossil fuel combustion.<br />
Carbon monoxide (CO) - A colorless, odorless, highly toxic gas that is a normal by-product of<br />
incomplete fossil fuel combustion. Carbon monoxide, one of the major air pollutants, can<br />
be harmful in small amounts if breathed over a certain period of time.<br />
Car-mile (railroad) - A single railroad car moved a distance of one mile.<br />
Cargo ton-mile - See Ton-mile.<br />
Certificated route air carriers - See Air carriers.<br />
Class I freight railroad - See Rail.<br />
<strong>TRANSPORTATION</strong> <strong>ENERGY</strong> <strong>DATA</strong> <strong>BOOK</strong>: <strong>EDITION</strong> <strong>20</strong>-<strong>20</strong>00<br />
G-3
G-4<br />
Clean Fuel Vehicle - Vehicle meeting the clean fuel vehicle exhaust emissions standards with no<br />
restriction on fuel type.<br />
Coal slurry - Finely crushed coal mixed with sufficient water to <strong>for</strong>m a fluid.<br />
Combination trucks - Consist of a power unit (a truck tractor) and one or more trailing units (a<br />
semi-trailer or trailer). The most frequently used combination is popularly referred to as<br />
a “tractor-semitrailer” or “tractor trailer”.<br />
Commercial sector - See Residential ,and Commercial sector.<br />
Commuter railroad - See Rail.<br />
Compact car - See Automobile size classifications.<br />
Constant dollars - A series of figures is expressed in constant dollars when the effect of change<br />
in the purchasing power of the dollar has been removed. Usually the data are expressed<br />
in terms of dollars of a selected year or the average of a set of years.<br />
Consumer Price Index (CPI) - An index issued by the U.S. Department of Labor, Bureau of<br />
Labor Statistics. The CPI is designed to measure changes in the prices of goods and<br />
services bought by wage earners and clerical workers in urban areas. It represents the cost<br />
of a typical consumption bundle at current prices as a ratio to its cost at a base year.<br />
Continuous discharge capacity - Measured as percent of rated energy capacity. Energy delivered<br />
in a constant power discharge required by an electric vehicle <strong>for</strong> hill climbing and/or high-<br />
speed cruise, specified as the percent of its rated energy capacity delivered in a one hour<br />
constant-power discharge.<br />
Corporate Average Fuel Economy (CAFE) standards - CAFE standards were originally<br />
established by Congress <strong>for</strong> new automobiles, and later <strong>for</strong> light trucks, in Title V of the<br />
Motor Vehicle In<strong>for</strong>mation and Cost Savings Act (15 U.S.C. 1901, et seq.) with subsequent<br />
amendments. Under CAFE, automobile manufacturers are required by law to produce<br />
vehicle fleets with a composite sales-weighted fuel economy which cannot be lower than<br />
the CAFE standards in a given year, or <strong>for</strong> every vehicle which does not meet the<br />
standard, a fine of $5.00 is paid <strong>for</strong> every one-tenth of a mpg below the standard.<br />
Crude oil - A mixture of hydrocarbons that exists in the liquid phase in natural underground<br />
reservoirs and remains liquid at atmospheric pressure after passing through surface<br />
<strong>TRANSPORTATION</strong> <strong>ENERGY</strong> <strong>DATA</strong> <strong>BOOK</strong>: <strong>EDITION</strong> <strong>20</strong>-<strong>20</strong>00
separating facilities. Crude oil production is measured at the wellhead and includes lease<br />
condensate.<br />
Crude oil imports - The volume of crude oil imported into the 50 States and the District of<br />
Columbia, including imports from U.S. territories, but excluding imports of crude oil into<br />
the Hawaiian Foreign Trade Zone.<br />
Curb weight - The weight of a vehicle including all standard equipment, spare tire and wheel, all<br />
fluids and lubricants to capacity, full tank of fuel, and the weight of major optional<br />
accessories normally found on the vehicle.<br />
Current dollars - Represents dollars current at the time designated or at the time of the<br />
transaction. In most contexts, the same meaning would be conveyed by the use of the term<br />
“dollars ” .<br />
Disposable personal income - See Income.<br />
Distillate fuel oil - The lighter fuel oils distilled off during the refining process. Included are<br />
products known as ASTM grades numbers 1 and 2 heating oils, diesel fuels, and number<br />
4 fuel oil. The major uses of distillate fuel oils include heating, fuel <strong>for</strong> on-and off-<br />
highway diesel engines, and railroad diesel fuel.<br />
Domestic air operator - See Air carrier.<br />
Domestic water transportation - See Internal water transportation.<br />
Electric utilities sector - Consists of privately and publicly owned establishments which generate<br />
electricity primarily <strong>for</strong> resale.<br />
Emission standards - Standards <strong>for</strong> the levels of pollutants emitted from automobiles and trucks.<br />
Congress established the first standards in the Clean Air Act of 1963. Currently, standards<br />
are set <strong>for</strong> four vehicle classes - automobiles, light trucks, heavy-duty gasoline trucks, and<br />
heavy-duty diesel trucks.<br />
Energy capacity - Measured in kilowatt hours. The energy delivered by the battery, when tested<br />
at C/3 discharge rate, up to termination of discharge specified by the battery manufacturer.<br />
The required acceleration power must be delivered by the battery at any point up to 80%<br />
of the battery’s energy capacity rating.<br />
Energy efficiency - In reference to transportation, the inverse of energy intensiveness: the ratio<br />
of outputs from a process to the energy inputs; <strong>for</strong> example, miles traveled per gallon of<br />
fuel (mpg).<br />
<strong>TRANSPORTATION</strong><strong>ENERGY</strong> <strong>DATA</strong><strong>BOOK</strong>: <strong>EDITION</strong>~O-<strong>20</strong>00<br />
G-5
G-6<br />
Energy intensity - In reference to transportation, the ratio of energy inputs to a process to the<br />
useful outputs from that process; <strong>for</strong> example, gallons of fuel per passenger-mile or Btu<br />
per ton-mile.<br />
Ethanol (C,H,OH) - Otherwise known as ethyl alcohol, alcohol, or grain-spirit. A clear,<br />
colorless, flammable oxygenated hydrocarbon with a boiling point of 78.5 degrees Celsius<br />
in the anhydrous state. In transportation, ethanol is used as a vehicle fuel by itself (ElOO),<br />
blended with gasoline (E85), or as a gaoline octane enhancer and oxygenate (10%<br />
concentration).<br />
Fixed operating cost - See Operating cost.<br />
Fleet vehicles -<br />
Private fleet vehicles: Ideally, a vehicle could be classified as a member of a fleet if it<br />
is:<br />
a) operated in mass by a corporation or institution,<br />
b) operated under unified control, or<br />
c) used <strong>for</strong> non-personal activities.<br />
However, the definition of a fleet is not consistent throughout the fleet industry. Some<br />
companies make a distinction between cars that were bought in bulk rather than singularly,<br />
or whether they are operated in bulk, as well as the minimum number of vehicles that<br />
constitute a fleet (i.e. 4 or 10).<br />
Government fleet vehicles: Includes vehicles owned by all federal (GSA), state,<br />
county, city, and metro units of government, including toll road operations.<br />
Foreign freight - Movements between the United States and <strong>for</strong>eign countries and between Puerto<br />
Rico, the Virgin Islands, and <strong>for</strong>eign countries. Trade between U.S. territories and<br />
possessions (e.g. Guam, Wake, American Samoa) and <strong>for</strong>eign countries is excluded.<br />
Traffic to or from the Panama Canal Zone is included.<br />
Gas Guzzler Tax - Originates from the 1978 Energy Tax Act (Public Law 95-618). A new car<br />
purchaser is required to pay the tax if the car purchased has a combined city/highway fuel<br />
economy rating that is below the standard <strong>for</strong> that year. For model years 1986 and later,<br />
the standard is 22.5 mpg.<br />
Gasohol - A mixture of 10% anhydrous ethanol and 90% gasoline by volume. There are other<br />
fuels that contain methanol and gasoline, but these fuels are not referred to as gasohol.<br />
Gasoline - See Motor gasoline.<br />
<strong>TRANSPORTATION</strong> <strong>ENERGY</strong> <strong>DATA</strong> <strong>BOOK</strong>: <strong>EDITION</strong> <strong>20</strong>-<strong>20</strong>00
General aviation - That portion of civil aviation which encompasses all facets of aviation except<br />
air carriers. It includes any air taxis, commuter air carriers, and air travel clubs which do<br />
not hold Certificates of Public Convenience and Necessity.<br />
Gross National Product - A measure of monetary value of the goods and services becoming<br />
available to the nation from economic activity. Total value at market prices of all goods<br />
and services produced by the nation’s economy. Calculated quarterly by the Department<br />
of Commerce, the Gross National Product is the broadest available measure of the level<br />
of economic activity.<br />
Gross vehicle weight (gvw) - The weight of the empty vehicle plus the maximum anticipated load<br />
weight.<br />
Heavy-heavy truck - See Truck size class@cations.<br />
Household - Consists of all persons who occupy a housing unit, including the related family<br />
members and all unrelated persons, if any, who share the housing unit.<br />
Housing unit - A house, apartment, a group of rooms, or a single room occupied or intended <strong>for</strong><br />
occupancy as separate living quarters. Separate living quarters are those in which the<br />
occupants do not live and eat with any other persons in the structure and which have either<br />
(1) direct access from the outside of the building or through a common hallway intended<br />
to be. used by the occupants of another unit or by the general public, or (2) complete<br />
kitchen facilities <strong>for</strong> the exclusive use of the occupants. The occupants may be a single<br />
family, one person living alone, two or more families living together, or any other group<br />
of related or unrelated persons who share living arrangements.<br />
Hydrocarbon (HC) - A compound that contains only hydrogen and carbon. The simplest and<br />
Income -<br />
lightest <strong>for</strong>ms of hydrocarbon are gaseous. With greater molecular weights they are<br />
liquid, while the heaviest are solids.<br />
Disposable personal income: Personal income less personal tax and non-tax payments.<br />
National income - The aggregate earnings of labor and property which arise in the<br />
current production of goods and services by the nation’s economy.<br />
Personal income: The current income received by persons from all sources, net of<br />
contributions <strong>for</strong> social insurance.<br />
Industrial sector - Construction, manufacturing, agricultural and mining establishments.<br />
<strong>TRANSPORTATION</strong> <strong>ENERGY</strong> <strong>DATA</strong> BOOIC <strong>EDITION</strong> <strong>20</strong>-<strong>20</strong>00<br />
G-7
G-8<br />
Inertia weight - The curb weight of a vehicle plus 300 pounds.<br />
Intercity bus - See Bus.<br />
Internal water transportation - Includes all local (intraport) traffic and traffic between ports or<br />
landings wherein the entire movement takes place on inland waterways. Also termed<br />
internal are movements involving carriage on both inland waterways and the water of the<br />
Great Lakes, and inland movements that cross short stretches of open water that link inland<br />
systems.<br />
International air operator - See Air carrier.<br />
International freight - See Foreign freight.<br />
Jet fuel - Includes both naphtha-type and kerosene-type fuels meeting standards <strong>for</strong> use in aircraft<br />
turbine engines. Although most jet fuel is used in aircraft, some is used <strong>for</strong> other purposes<br />
such as generating electricity in gas turbines.<br />
Kerosene-type jet fuel: A quality kerosene product with an average gravity of 40.7<br />
degrees API and 10% to 90% distillation temperatures of 217 to 261 degrees centigrade.<br />
Used primarily as fuel <strong>for</strong> commercial turbojet and turboprop aircraft engines. It is a<br />
relatively low freezing point distillate of the kerosene type.<br />
Naphtha-type jet fuel: A fuel in the heavy naphtha boiling range with an average gravity<br />
of 52.8 degrees API and 10% to 90% distillation temperatures of 117 to 233 degrees<br />
centigrade used <strong>for</strong> turbojet and turboprop aircraft engines, primarily by the military.<br />
Excludes ramjet and petroleum.<br />
Kerosene - A petroleum distillate in the 300 to 500 degrees Fahrenheit boiling range and generally<br />
having a flash point higher than 100 degrees Fahrenheit by the American Society of<br />
Testing and Material (ASTM) Method D56, a gravity range from 40 to 46 degrees API,<br />
and a burning point in the range of 150 to 175 degrees Fahrenheit. It is a clean-burning<br />
product suitable <strong>for</strong> use as an illuminant when burned in wick lamps. Includes grades of<br />
kerosene called range oil having properties similar to Number 1 fuel oil, but with a gravity<br />
of about 43 degrees API and an end point of 625 degrees Fahrenheit. Used in space<br />
heaters, cooking stoves, and water heaters.<br />
Kerosene-type jet fuel - See Jet fuel.<br />
Large car - See Automobile size classi@ations.<br />
<strong>TRANSPORTATION</strong> <strong>ENERGY</strong> <strong>DATA</strong> BOOIC <strong>EDITION</strong> <strong>20</strong>-<strong>20</strong>00
Lease Condensate - A liquid recovered from natural gas at the well or at small gas/oil separators<br />
in the field. Consists primarily of pentanes and heavier hydrocarbons (also called field<br />
condensate).<br />
Light duty vehicles - Automobiles and light trucks combined.<br />
Light truck - Unless otherwise noted, light trucks are defined in this publication as two-axle, fourtire<br />
trucks. The U.S. Bureau of Census classifies all trucks with a gross vehicle weight<br />
less than 10,000 pounds as light trucks (See Truck size cZass@cations).<br />
Light-heavy truck - See Truck size classifications.<br />
Liquified petroleum gas (Ipg) - Consists of propane and butane and is usually derived from<br />
natural gas. In locations where there is no natural gas and the gasoline consumption is<br />
low, naphtha is converted to lpg by catalytic re<strong>for</strong>ming.<br />
Load factor - A term relating the potential capacity of a system relative to its actual per<strong>for</strong>mance.<br />
Is often calculated as total passenger miles divided by total vehicle miles.<br />
Low-emission vehicle - A clean fuel vehicle meeting the low-emission vehicle standards.<br />
Medium truck - See Truck size classzfications.<br />
Methanol (CH,OH) - A colorless poisonous liquid with essentially no odor and very little taste.<br />
It is the simplest alcohol and boils at 64.7 degrees Celsius. In transportation, methanol is<br />
used as a vehicle fuel by itself (MlOO), or blended with gasoline (M85).<br />
<strong>TRANSPORTATION</strong><strong>ENERGY</strong><strong>DATA</strong><strong>BOOK</strong>: <strong>EDITION</strong>~O-<strong>20</strong>00<br />
G-9
G-10<br />
Midsize car - See Automobile size classifications.<br />
Minicompact car - See Automobile size classzjications.<br />
Model year - In this publication, model year is referring to the “sales” model year, the period<br />
from October 1 to the next September 3 1.<br />
Motor bus - See Bus.<br />
Motor Gasoline - A mixture of volatile hydrocarbons suitable <strong>for</strong> operation of an internal<br />
combustion engine whose major components are hydrocarbons with boiling points ranging<br />
from 78 to 217 degrees centigrade and whose source is distillation of petroleum and<br />
cracking, polymerization, and other chemical reactions by which the naturally occurring<br />
petroleum hydrocarbons are converted into those that have superior fuel properties.<br />
Naphtha-type jet fuel - See Jetfuel.<br />
National income - See Income.<br />
Nationwide Personal Transportation Study (NPTS) - A nationwide home interview survey of<br />
households that provides in<strong>for</strong>mation on the characteristics and personal travel patterns of<br />
the U.S. population. Surveys were conducted in 1969, 1977, 1983 and 1990 by the U.S.<br />
Bureau of Census <strong>for</strong> the U.S. Department of Transportation.<br />
Natural gas - A mixture of hydrocarbon compounds and small quantities of various nonhydrocarbons<br />
existing in the gaseous phase or in solution with crude oil in natural<br />
underground reservoirs at reservoir conditions.<br />
Natural Gas Plant Liquids - Products obtained from processing natural gas at natural gas<br />
processing plants, including natural gasoline plants, cycling plants, and fractionators.<br />
Products obtained include ethane, liquefied petroleum gases, (propanes, butane, propanebutane<br />
mixtures, and ethane-propane mixtures), isopentane, natural gasoline,<br />
unfractionated streams, plant condensate, and other minor quantities of finished products,<br />
such as motor gasoline, special naphthas, jet fuel, kerosene, and distillate fuel oil.<br />
Nitrogen Oxides (NO,) - A product of combustion of fossil fuels whose production increases with<br />
the temperature of the process. It can become an air pollutant if concentrations are<br />
excessive.<br />
<strong>TRANSPORTATION</strong> <strong>ENERGY</strong> <strong>DATA</strong> <strong>BOOK</strong>: <strong>EDITION</strong> <strong>20</strong>-<strong>20</strong>00
Oil Stocks - Oil stocks include crude oil (including strategic reserves), unfinished oils, natural gas<br />
plant liquids, and refined petroleum products.<br />
Operating cost -<br />
Fixed operating cost: In reference to passenger car operating cost, refers to those<br />
expenditures that are independent of the amount of use of the car, such as insurance costs,<br />
fees <strong>for</strong> license and registration, depreciation and finance charges.<br />
Variable operating cost: In reference to passenger car operating cost, expenditures which<br />
are dependent on the amount of use of the car, such as the cost of gas and oil, tires, and<br />
other maintenance.<br />
Organization <strong>for</strong> Economic Cooperation and Development (OECD) - Consists of Australia,<br />
Austria, Belgium, Canada, Czech Republic, Denmark, Finland, France, Germany,<br />
Greece, Hungary, Iceland, Ireland, Italy, Japan, Luxembourg, Mexico, Netherlands, New<br />
Zealand, Norway, Poland, Portugal, South Korea, Spain, Sweden, Switzerland, Turkey,<br />
United Kingdom, and United States. Total OECD includes the United States Territories<br />
(Guam, Puerto Rico, and the U.S. Virgin Islands). Total OECD excludes data <strong>for</strong> Czech<br />
Republic, Hungary, Mexico, Poland, and South Korea which are not yet available.<br />
OECD Europe: Consists of Austria, Belgium, Czech Republic, Denmark, Finland,<br />
France, Germany, Greece, Hungary, Iceland, Ireland, Italy, Luxembourg, Netherlands,<br />
Norway, Poland, Portugal, Spain, Sweden, Switzerland, Turkey, and United Kingdom.<br />
OECD Europe excludes data <strong>for</strong> Czech Republic, Hungary, and Poland which are not yet<br />
available.<br />
OECD Pacific: Consists of Australia, Japan, and New Zealand.<br />
Organization <strong>for</strong> Petroleum Exporting Countries (OPEC) - Includes Saudi Arabia, Iran,<br />
Venezuela, Libya, Indonesia, United Arab Emirates, Algeria, Nigeria, Ecuador, Gabon,<br />
Iraq, Kuwait, and Qatar. Data <strong>for</strong> Saudi Arabia and Kuwait include their shares from the<br />
Partitioned Zone (<strong>for</strong>merly the Neutral Zone).<br />
Arab OPEC - Consists of Algeria, Iraq, Kuwait, Libya, Qatar, Saudi Arabia and the<br />
United Arab Emirates.<br />
Other single-unit truck - See Single-unit truck.<br />
Oxygenate - A substance which, when added to gasoline, increases the amount of oxygen in that<br />
gasoline blend. Includes fuel ethanol, methanol, and methyl tertiary butyl ether (MTBE).<br />
<strong>TRANSPORTATION</strong><strong>ENERGY</strong><strong>DATA</strong>BOOIC <strong>EDITION</strong>~O-<strong>20</strong>00<br />
G-11
G-12<br />
Particulates - Carbon particles <strong>for</strong>med by partial oxidation and reduction of the hydrocarbon fuel.<br />
Also included are trace quantities of metal oxides and nitrides, originating from engine<br />
wear, component degradation, and inorganic fuel additives. In the transportation sector,<br />
particulates are emitted mainly from diesel engines.<br />
Passenger-miles traveled (PMT) - One person traveling the distance of one mile. Total<br />
passenger-miles traveled, thus, give the total mileage traveled by all persons.<br />
Passenger rail - See Rail, “Amtrak If and “Transit Railroad ‘I.<br />
Persian Gulf countries: Consists of Bahrain, Iran, Iraq, Kuwait, Qatar, Saudi Arabia, and the<br />
United Emirates.<br />
Personal Consumption Expenditures (PCE) - As used in the national accounts, the market value<br />
of purchases of goods and services by individuals and nonprofit institutions and the value<br />
of food, clothing, housing, and financial services received by them as income in kind. It<br />
includes the rental value of owner-occupied houses but excludes purchases of dwellings,<br />
which are classified as capital goods (investment).<br />
Personal income - See Income.<br />
Petroleum - A generic term applied to oil and oil products in all <strong>for</strong>ms, such as crude oil, lease<br />
condensate, unfinished oil, refined petroleum products, natural gas plant liquids, and nonhydrocarbon<br />
compounds blended into finished petroleum products.<br />
Petroleum consumption: A calculated demand <strong>for</strong> petroleum products obtained by<br />
summing domestic production, imports of crude petroleum and natural gas liquids, imports<br />
of petroleum products, and the primary stocks at the beginning of the period and then<br />
subtracting the exports and the primary stocks at the end of the period.<br />
Petroleum exports: Shipments of petroleum products from the 50 States and the District<br />
of Columbia to <strong>for</strong>eign countries, Puerto Rico, the Virgin Islands, and other U.S.<br />
possessions and territories.<br />
Petroleum imports: All imports of crude petroleum, natural gas liquids, and petroleum<br />
products from <strong>for</strong>eign countries and receipts from Guam, Puerto Rico, the Virgin Islands,<br />
and the Hawaiian Trade Zone. The commodities included are crude oil, unfinished oils,<br />
plant condensate, and refined petroleum products.<br />
<strong>TRANSPORTATION</strong> <strong>ENERGY</strong> <strong>DATA</strong> <strong>BOOK</strong>: <strong>EDITION</strong> <strong>20</strong>-<strong>20</strong>00
Petroleum inventories: The amounts of crude oil, unfinished oil, petroleum products, and<br />
natural gas liquids held at refineries, at natural gas processing plants, in pipelines, at bulk<br />
terminals operated by refining and pipeline companies, and at independent bulk terminals.<br />
Crude oil held in storage on leases is also included; these stocks are know as primary<br />
stocks. Secondary stocks - those held by jobbers dealers, service station operators, and<br />
consumers -are excluded. Prior to 1975, stock held at independent bulk terminals were<br />
classified as secondary stocks.<br />
Petroleum products supplied: For each petroleum product, the amount supplied is<br />
calculated by summing production, crude oil burned directly, imports, and net withdrawals<br />
from primary stocks and subtracting exports.<br />
Processing Gain - The amount by which the total volume of refinery output is greater than the<br />
volume of input <strong>for</strong> given period of time. The processing gain arises when crude oil and<br />
other hydrocarbons are processed into products that are, on average, less dense than the<br />
input.<br />
Processing Loss - The amount by which the total volume of refinery output is less than the volume<br />
of input <strong>for</strong> given period of time. The processing loss arises when crude oil and other<br />
hydrocarbons are processed into products that are, on average, more dense than the input.<br />
Proved Reserves of Crude Oil - The estimated quantities of all liquids defined as crude oil, which<br />
geological and engineering data demonstrate with reasonable certainty to be recoverable<br />
in future years from known reservoirs under existing economic and operating conditions.<br />
Quad - Quadrillion, 10”. In this publication, a Quad refers to Quadrillion Btu.<br />
Rail -<br />
Amtrak (American Railroad Tracks): Operated by the National Railroad Passenger<br />
Corporation of Washington, DC. This rail system was created by President Nixon in<br />
1970, and was given the responsibility <strong>for</strong> the operation of intercity, as distinct from<br />
suburban, passenger trains between points designated by the Secretary of Transportation.<br />
Class I freight railroad: Defined by the Interstate Commerce Commission each year<br />
based on annual operating revenue. A railroad is dropped from the Class I list if it fails<br />
to meet the annual earnings threshold <strong>for</strong> three consecutive years.<br />
Commuter railroad: Those portions of mainline railroad (not electric railway)<br />
transportation operations which encompass urban passenger train service <strong>for</strong> local travel<br />
between a central city and adjacent suburbs. Commuter railroad service - using both<br />
locomotive-hauled and self-propelled railroad passenger cars - is characterized by multi-<br />
trip tickets, specific station-to-station fares, and usually only one or two stations in the<br />
central business district. Also known as suburban railroad.<br />
<strong>TRANSPORTATION</strong> <strong>ENERGY</strong> <strong>DATA</strong> <strong>BOOK</strong>: <strong>EDITION</strong> <strong>20</strong>-<strong>20</strong>00<br />
,<br />
G-13
G-14<br />
Transit railroad: Includes “heavy” and “light” transit rail. Heavy transit rail is<br />
characterized by exclusive rights-of-way, multi-car trains, high speed rapid acceleration,<br />
sophisticated signaling, and high plat<strong>for</strong>m loading. Also known as subway, elevated<br />
railway, or metropolitan railway (metro). Light transit rail may be on exclusive or<br />
shared rights-of-way, high or low plat<strong>for</strong>m loading, multi-car trains or single cars,<br />
automated or manually operated. In generic usage, light rail includes streetcars, trolley<br />
cars, and tramways.<br />
Residential and Commercial sector - Consists of housing units, non-manufacturing business<br />
establishments (e.g., wholesale and retail businesses), health and educational institutions,<br />
and government offices.<br />
Residential Transportation Energy Consumption Survey (RTECS) - This survey was designed<br />
by the Energy In<strong>for</strong>mation Administration of the Department of Energy to provide<br />
in<strong>for</strong>mation on how energy is used by households <strong>for</strong> personal vehicles. It has been<br />
conducted five times since 1979, the most recent being 1991.<br />
Residual fuel oil - The heavier oils that remain after the distillate fuel oils and lighter<br />
hydrocarbons are boiled off in refinery operations. Included are products know as ASTM<br />
grade numbers 5 and 6 oil, heavy diesel oil, Navy Special Fuel Oil, Bunker C oil, and acid<br />
sludge and pitch used as refinery fuels. Residual fuel oil is used <strong>for</strong> the production of<br />
electric power, <strong>for</strong> heating, and <strong>for</strong> various industrial purposes.<br />
Rural - Usually refers to areas with population less than 5,000.<br />
Sales period - October 1 of the previous year to September 30 of the given year. Approximately<br />
the same as a model year.<br />
Sales-weighted miles per gallon (mpg) - Calculation of a composite vehicle fuel economy based<br />
on the distribution of vehicle sales.<br />
Scrappage rate - As applied to motor vehicles, it is usually expressed as the percentage of<br />
vehicles of a certain type in a given age class that are retired from use (lacking<br />
registration) in a given year.<br />
School and other nonrevenue bus - See Bus.<br />
<strong>TRANSPORTATION</strong> <strong>ENERGY</strong> <strong>DATA</strong> <strong>BOOK</strong>: <strong>EDITION</strong> <strong>20</strong>-<strong>20</strong>00
Single unit truck - Includes two-axle, four-tire trucks and other single unit trucks.<br />
Two-axle, four tire truck: A motor vehicle consisting primarily of a single motorized<br />
device with two axles and four tires.<br />
Other single-unit truck: A motor vehicle consisting primarily of a single motorized<br />
device with more than two axles or more than four tires.<br />
Special fuels - Consist primarily of diesel fuel with small amount of liquified petroleum gas, as<br />
defined by the Federal Highway Administration.<br />
Specific acceleration power - Measured in watts per kilogram. Acceleration power divided by<br />
the battery system weight. Weight must include the total battery system.<br />
Specific energy - Measured in watt hours per kilogram. The rated energy capacity of the battery<br />
divided by the total battery system weight.<br />
Subcompact car - See Automobile size classijcications.<br />
Supplemental air carrier - See Air carrier.<br />
Test weight - The weight setting at which a vehicle is tested on a dynomometer by the U.S.<br />
Environmental Protection Agency (EPA). This weight is determined by the EPA using the<br />
inertia weight of the vehicle.<br />
Ton-mile - The movement of one ton of freight the distance of one mile. Ton-miles are computed<br />
by multiplying the weight in tons of each shipment transported by the distance hauled.<br />
Transmission types -<br />
A3 - Automatic three speed<br />
A4 - Automatic four speed<br />
A5 - Automatic five speed<br />
L4 - Automatic lockup four speed<br />
M5 - Manual five speed<br />
Transit bus - See Bus.<br />
Transit railroad - See Rail.<br />
<strong>TRANSPORTATION</strong><strong>ENERGY</strong><strong>DATA</strong>BOOIC <strong>EDITION</strong>~O-<strong>20</strong>00<br />
G-15
G-16<br />
Transportation sector - Consists of both private and public passenger and freight transportation,<br />
as well as government transportation, including military operations.<br />
Truck Inventory and Use Survey (TIUS) - Survey designed to collect data on the characteristics<br />
and operational use of the nation’s truck population. It is conducted every five years by<br />
the U.S. Bureau of the Census. Surveys were conducted in 1963, 1967, 1972, 1977,<br />
1982, 1987, and 1992. The 1992 data have not yet been released.<br />
Trolley coach - See Bus.<br />
Truck size classifications - U.S. Bureau of the Census has categorized trucks by gross vehicle<br />
weight (gvw) as follows:<br />
Light - Less than 10,000 pounds gvw (Also see Light Truck.)<br />
Medium - 10,001 to <strong>20</strong>,000 pounds gvw<br />
Light-heavy - <strong>20</strong>,001 to 26,000 pounds gvw<br />
Heavy-heavy - 26,001 pounds gvw or more.<br />
Two-axle, four-tire truck - See Single-unit truck.<br />
Two seater car - See Automobile size classzjications<br />
Ultra-low emission vehicle - A clean fuel vehicle meeting the more stringent Ultra-low emission<br />
standards.<br />
Urban - Usually refers to areas with population of 5,000 or greater.<br />
Variable operating cost - See Operating cost.<br />
Vehicle-miles traveled (vmt) - One vehicle traveling the distance of one mile. Total vehicle<br />
miles, thus, is the total mileage traveled by all vehicles.<br />
Zero-emission vehicle - A clean fuel vehicle meeting even more stringent zero-emission vehicle<br />
standards.<br />
<strong>TRANSPORTATION</strong> <strong>ENERGY</strong> <strong>DATA</strong> <strong>BOOK</strong>: <strong>EDITION</strong> <strong>20</strong>-<strong>20</strong>00
TITLE INDEX<br />
<strong>TRANSPORTATION</strong> <strong>ENERGY</strong> <strong>DATA</strong> BooIc: <strong>EDITION</strong> <strong>20</strong>-<strong>20</strong>00<br />
I-l
I-2<br />
Acquisitions<br />
Act<br />
Federal Fleet Vehicle Acquisitions by Fuel Type, FY 1997 ....................... 1 O-7<br />
Energy Policy Act Purchase Requirements of Light Alternative Fuel Vehicles ........ 10-8<br />
Activity<br />
Growth of Freight Activity in the United States: Comparison of the 1997 and 1993<br />
Commodity Flow Surveys .............................................. 8 12<br />
Commodity Flow Survey Freight Activity, 1997 ............................... 8-13<br />
Advanced<br />
NEAR-TERM Technology: Fuel-Cycle Energy and Greenhouse Gas Emission Changes<br />
of Alternative Transportation Fuels and Advanced Vehicle Technologies ......... 3-l 1<br />
LONG-TERM Technology: Fuel-Cycle Energy and Greenhouse Gas Emission Changes<br />
of Alternative Transportation Fuels and Advanced Vehicle Technologies ......... 3-12<br />
NEAR-TERM Technology: Fuel-Cycle Energy and Criteria Pollutant Emission Changes<br />
of Alternative Transportation Fuels and Advanced Vehicle Technologies ......... 4-17<br />
LONG-TERM Technology: Fuel-Cycle Energy and Greenhouse Gas Emission Changes<br />
of Alternative Transportation Fuels and Advanced Vehicle Technologies ......... 4-19<br />
U.S. Advanced Battery Consortium Goals <strong>for</strong> Electric Vehicle Batteries ............. 9-10<br />
AIF<br />
Average Age of Vehicles by Household Vehicle Ownership, 1995 NPTS ........... 11-12<br />
Average Annual Miles per Household Vehicle by Vehicle Age ................... 1 l- 13<br />
Average Age of Automobiles and Trucks in Use, 1970-98 ........................ 6-l 0<br />
Automobiles in Operation and Vehicle Travel by Age, 1970 and 1998 ............... 6-8<br />
Truclts in Operation and Vehicle Travel by Age, 1970 and 1998 .................... 6-9<br />
Agency<br />
Air<br />
Federal Government Vehicles by Agency, Fiscal Year 1997 ...................... 10-6<br />
Summary Statistics <strong>for</strong> U.S. Domestic and International Certificated Route Air Carriers,<br />
1970-98 ............................................................ 12-2<br />
Total National Emissions of the Criteria Air Pollutants by Sector, 1998 .............. 4-2<br />
Cali<strong>for</strong>nia Air Resources Board Requirements <strong>for</strong> Meeting Emission Standards ....... 4-42<br />
Alternative<br />
Energy Policy Act Purchase Requirements of Light Alternative Fuel Vehicles ........ 10-8<br />
Alternative Vehicle Fuel Consumption, 1992-<strong>20</strong>00 ............................. 2-l 1<br />
NEAR-TERM Technology: Fuel-Cycle Energy and Greenhouse Gas Emission Changes<br />
of Alternative Transportation Fuels and Advanced Vehicle Technologies ......... 3-l 1<br />
LONG-TERM Technology: Fuel-Cycle Energy and Greenhouse Gas Emission Changes<br />
of Alternative Transportation Fuels and Advanced Vehicle Technologies ......... 3-12<br />
TRANSPORTA’UON <strong>ENERGY</strong> <strong>DATA</strong> <strong>BOOK</strong>: <strong>EDITION</strong> <strong>20</strong>-<strong>20</strong>00
Alternative (continued)<br />
NEAR-TERM Technology: Fuel-Cycle Energy and Criteria Pollutant Emission Changes<br />
of Alternative Transportation Fuels and Advanced Vehicle Technologies ......... 4-l 7<br />
LONG-TERM Technology: Fuel-Cycle Energy and Greenhouse Gas Emission Changes<br />
of Alternative Transportation Fuels and Advanced Vehicle Technologies ......... 4-l 9<br />
Conventional and Alternative Fuel Refueling Stations ........................... 7- 17<br />
Estimates of Alternative Fuel Vehicles in Use, 1992-<strong>20</strong>00 ......................... 9-3<br />
Estimates of Light Alternative Fuel Vehicles, 1996, 1998, and <strong>20</strong>00 ................. 9-4<br />
Estimates of Heavy Alternative Fuel Vehicles, 1996, 1998, and <strong>20</strong>00 ................ 9-5<br />
Alternative Fuel Vehicles Available by Manufacturer, Model Year <strong>20</strong>00 ............. 9-6<br />
Number of Alternative Refuel Sites by State and Fuel Type, 1999 ................... 9-7<br />
Amtrak<br />
Annual<br />
Area<br />
Summary Statistics <strong>for</strong> the National Railroad Passenger Corporation (Amtrak),<br />
1971-98 ........................................................... 12-11<br />
Average Annual and Daily Vehicle-Miles of Travel <strong>for</strong> Fleet Vehicles, 1991 ......... 10-4<br />
Average Annual Miles per Vehicle by Household Vehicle Ownership, 1995 NPTS ... 11-12<br />
Average Annual Miles per Household Vehicle by Vehicle Age ................... 1 l-l 3<br />
Average Annual Expenditures of Households by Income, 1998 .................... 1 l-3<br />
Average Annual Vehicle-Miles, Vehicle Trips and Trip Length per Household ....... 1 l-6<br />
Average Annual Person-Miles Traveled (PMT), Person Trips and Trip Length per<br />
Household by Selected Trip Purposes ..................................... 1 l-7<br />
National and Metropolitan Area Comparisons of Journey-to-Work Statistics, 1990<br />
Census ............................................................ 11-16<br />
Automobile<br />
Automobile Operating Cost per Mile, 1975-99 ................................. 5- 15<br />
Fixed Automobile Operating Costs per Year, 1975-99 ........................... 5- 16<br />
Automobile Scrappage and Survival Rates .................................... 6- 11<br />
Automobile Survival Rates ................................................ 6- 12<br />
Automobile Registrations <strong>for</strong> Selected Countries, 1950-96 ........................ 6-2<br />
Average Material Consumption <strong>for</strong> a Domestic Automobile, 1978, 1985, and 1999 .... 7-l 5<br />
New Retail Automobile Sales in the United States, 1970-98 ....................... 7-4<br />
Automobiles<br />
Average Age of Automobiles and Trucks in Use, 1970-98 ........................ 6-l 0<br />
Automobiles and Trucks in Use, 1970-98 ...................................... 6-5<br />
Automobiles in Operation and Vehicle Travel by Age, 1970 and 1998 ............... 6-8<br />
<strong>TRANSPORTATION</strong><strong>ENERGY</strong><strong>DATA</strong>BOOIC <strong>EDITION</strong>~O-<strong>20</strong>00<br />
I-3
I-4<br />
Automobiles (continued)<br />
Sales-Weighted Curb Weight of New Domestic and Import Automobiles by Size Class,<br />
Sales Periods 1976-99 ................................................. 7-l 1<br />
Sales-Weighted Interior Space of New Domestic and Import Automobiles by Size Class,<br />
Sal& Periods 1976-99 ................................................. 7-12<br />
Engine Size, Curb Weight, and Interior Space of New Domestic and Import<br />
Automobiles, 1976-99 ................................................. 7- 13<br />
Sales-Weighted Wheelbase of New Automobiles and Light Trucks, Sales Period<br />
1976-99 ............................................................ 7-14<br />
Corporate Average Fuel Economy (CAFE) Standards versus Sales-Weighted Fuel<br />
Economy Estimates <strong>for</strong> Automobiles and Light Trucks, 1978-99 ............... 7- 18<br />
Period Sales, Market Shares, and Sales-Weighted Fuel Economies of New Domestic and<br />
Import Automobiles, Selected Sales Periods 1976-99 .......................... 7-6<br />
Sales-Weighted Engine Size of New Domestic and Import Automobiles by Size Class,<br />
Available<br />
Sales Periods 1976-99 .................................................. 7-9<br />
Alternative Fuel Vehicles Available by Manufacturer, Model Year <strong>20</strong>00 ............. 9-6<br />
Average<br />
Average Length of Time Fleet Vehicles are Kept Be<strong>for</strong>e Sold to Others, 1991 ........ 10-4<br />
Average Annual and Daily Vehicle-Miles of Travel <strong>for</strong> Fleet Vehicles, 1991 ......... 10-4<br />
Average Miles per Federal Vehicle by Vehicle Type, 1997 ....................... 1 O-5<br />
Average Vehicle Occupancy by Trip Purpose, 1977,1983,1990, and 1995 NPTS .... 1 l-10<br />
Average Annual Miles per Vehicle by Household Vehicle Ownership, 1995 NPTS ... 11-12<br />
Average Age of Vehicles by Household Vehicle Ownership, 1995 NPTS ........... 1 l-12<br />
Average Annual Miles per Household Vehicle by Vehicle Age ................... 1 1 - 13<br />
Average Annual Expenditures of Households by Income, 1998 .................... 1 l-3<br />
Average Annual Vehicle-Miles, Vehicle Trips and Trip Length per Household ....... 1 l-6<br />
Average Annual Person-Miles Traveled (PMT), Person Trips and Trip Length per<br />
Household by Selected Trip Purposes ..................................... 1 l-7<br />
Average Number of Vehicles and Vehicle Travel per Household, 1990 and<br />
1995NPTS .......................................................... 11-8<br />
Average Vehicle Occupancy by Vehicle Type, 1995 NPTS ....................... 1 l-9<br />
Average Price of a New Car, 1970-99 ........................................ 5-13<br />
Average Price of a New Car by Sector, 1970-99 ................................ 5-14<br />
Average Age of Automobiles and Trucks in Use, 1970-98 ........................ 6-l 0<br />
Average Material Consumption <strong>for</strong> a Domestic Automobile, 1978, 1985, and 1999 .... 7-15<br />
Corporate Average Fuel Economy (CAFE) Standards versus Sales-Weighted Fuel<br />
Economy Estimates <strong>for</strong> Automobiles and Light Trucks, 1978-99 ............... 7-l 8<br />
Corporate Average Fuel Economy (CAFE) Fines Collected, 1983-98 ............... 7-19<br />
<strong>TRANSPORTATION</strong> <strong>ENERGY</strong> <strong>DATA</strong> <strong>BOOK</strong>: <strong>EDITION</strong> <strong>20</strong>-<strong>20</strong>00
Aviation<br />
Axle<br />
Barrel<br />
Summary Statistics <strong>for</strong> General Aviation, 1970-98 .............................<br />
Summary Statistics <strong>for</strong> Two-Axle, Four-Tire Trucks, 1970-98 ....................<br />
Refinery Yield of Petroleum Products from a Barrel of Crude Oil, 1978-98 .........<br />
Prices <strong>for</strong> a Barrel of Crude Oil and a Gallon of Gasoline, 1978-99 ................<br />
Batteries<br />
Battery<br />
Board<br />
U.S. Advanced Battery Consortium Goals <strong>for</strong> Electric Vehicle Batteries ............<br />
U.S. Advanced Battery Consortium Goals <strong>for</strong> Electric Vehicle Batteries ............<br />
Cali<strong>for</strong>nia Air Resources Board Requirements <strong>for</strong> Meeting Emission Standards ......<br />
Breakdown<br />
Bus<br />
Buses<br />
CAFE<br />
Breakdown of Domestic Marine Cargo by Commodity Class, 1998 ...............<br />
Truck and Bus Registrations <strong>for</strong> Selected Countries, 1950-96 ....................<br />
Summary Statistics on Buses by Type, 1970-98 ...............................<br />
Corporate Average Fuel Economy (CAFE) Standards versus Sales-Weighted Fuel<br />
Economy Estimates <strong>for</strong> Automobiles and Light Trucks, 1978-99 .. ., ...........<br />
Corporate Average Fuel Economy (CAFE) Fines Collected, 1983-98 ..............<br />
Calendar<br />
Vehicle Stock and New Sales in United States, 1998 Calendar Year ...............<br />
Cali<strong>for</strong>nia<br />
Car<br />
Carbon<br />
Cali<strong>for</strong>nia Passenger Cars and Light Trucks Emission Certification Standards .......<br />
Cali<strong>for</strong>nia Vehicle Emission Reduction <strong>for</strong> Passenger Cars and Light Trucks ........<br />
Cali<strong>for</strong>nia Air Resources Board Requirements <strong>for</strong> Meeting Emission Standards ......<br />
Pollution from a Typical New Car and Light Truck, <strong>20</strong>00 Model Year .............<br />
Average Price of a New Car, 1970-99 .......................................<br />
Average Price of a New Car by Sector, 1970-99 ...............................<br />
International Man-Made Emissions of Carbon Dioxide, 1990-97 ..................<br />
International Man-Made Emissions of Carbon Dioxide by Source Category, 1990 and<br />
1997 ..............................................................<br />
<strong>TRANSPORTATION</strong> <strong>ENERGY</strong> <strong>DATA</strong> <strong>BOOK</strong>: <strong>EDITION</strong> <strong>20</strong>-<strong>20</strong>00<br />
12-3<br />
. 7-3<br />
l-11<br />
. 5-6<br />
9-10<br />
9-10<br />
4-42<br />
12-6<br />
. 6-3<br />
8-14<br />
7-18<br />
7-19<br />
. 6-6<br />
4-40<br />
4-41<br />
4-42<br />
4-32<br />
5-13<br />
5-14<br />
. 3-3<br />
. 3-4<br />
I-5
I-6<br />
Carbon (continued)<br />
U.S. Carbon Dioxide Emissions from Fossil Energy Consumption by End-Use Sector,<br />
1984-98 . . . . . . . . . . . . . . . . . . . . . . . . . . . . . . . . . . . . . . . . . . . . . . . . . . . . . . . . . . . . . 3-6<br />
U.S. Carbon Dioxide Emissions from Energy Use in the Transportation Sector,<br />
1980-98 ............................................................. 3-7<br />
Numerical Estimates of Global Warming Potentials Compared With Carbon Dioxide ... 3-8<br />
Total National Emissions of Carbon Monoxide, 1970-98 .......................... 4-3<br />
Cargo<br />
Emissions of Carbon Monoxide from Highway Vehicles, 1970-98 .................. 4-4<br />
Breakdown of Domestic Marine Cargo by Commodity Class, 1998 ................ 12-6<br />
Carloads<br />
Railroad Revenue Carloads by Commodity Group, 1974 and 1998 ................. 12-9<br />
Carriers<br />
Summary Statistics <strong>for</strong> U.S. Domestic and International Certificated Route Air Carriers,<br />
1970-98 ............................................................ 12-2<br />
Cars<br />
Cali<strong>for</strong>nia Passenger Cars and Light Trucks Emission Certification Standards ........ 4-40<br />
Cali<strong>for</strong>nia Vehicle Emission Reduction <strong>for</strong> Passenger Cars and Light Trucks ......... 4-41<br />
Summary Statistics <strong>for</strong> Passenger Cars, 1970-98 ................................ 7-2<br />
The Gas Guzzler Tax on New Cars .......................................... 7-<strong>20</strong><br />
Category<br />
International Man-Made Emissions of Carbon Dioxide by Source Category, 1990 and<br />
1997 ................................................................ 3-4<br />
Census<br />
Means of Transportation to Work, 1980 and 1990 Census ....................... 11-15<br />
National and Metropolitan Area Comparisons of Journey-to-Work Statistics,<br />
1990Census ........................................................ 11-16<br />
Household Vehicle Ownership, 1960-90 Census ............................... 11-4<br />
Certificated<br />
Summary Statistics <strong>for</strong> U.S. Domestic and International Certificated Route Air Carriers,<br />
1970-98 ............................................................ 12-2<br />
Certification<br />
Federal Exhaust Emission Certification Standards <strong>for</strong> Gasoline- and Diesel-Powered<br />
LightVehicles ....................................................... 4-33<br />
Federal Exhaust Emission Certification Standards <strong>for</strong> Gasoline- and Diesel-Powered<br />
LightTrucks.. ....................................................... 4-34<br />
Federal Exhaust Emission Certification Standards <strong>for</strong> Gasoline- and Diesel-Powered<br />
Light Trucks.. ....................................................... 4-35<br />
<strong>TRANSPORTATION</strong> <strong>ENERGY</strong> <strong>DATA</strong> <strong>BOOK</strong>: <strong>EDITION</strong> <strong>20</strong>-<strong>20</strong>00
Certification (continued)<br />
Cities<br />
City<br />
Class<br />
Clean<br />
Federal Exhaust Emission Certification Standards <strong>for</strong> Gasoline- and Diesel-Powered<br />
Light Trucks . . . . . . . . . . . . . . . . . . . . . . . . . . . . . . . . . . . . . . . . . . . . . . . . . . . . . .<br />
Federal Exhaust Emission Certification Standards <strong>for</strong> Gasoline- and Diesel-Powered<br />
Light Trucks . . . . . . . . . . . . . . . . . . . . . . . . . . . . . . . . . . . . . . . . . . . . . . . . . . . . . .<br />
Federal Exhaust Emission Certification Standards <strong>for</strong> Gasoline- and Diesel-Powered<br />
LightHeavyTrucks . . . . . . . . . . . . . . . . . . . . . . . . . . . . . . . . . . . . . . . . . . . . . . . .<br />
Federal Exhaust Emission Certification Standards <strong>for</strong> Gasoline- and Diesel-Powered<br />
Heavy Heavy Trucks . . . . . . . . . . . . . . . . . . . . . . . . . . . . . . . . . . . . . . . . . . . . . . .<br />
Cali<strong>for</strong>nia Passenger Cars and Light Trucks Emission Certification Standards . . . . .<br />
List of Clean Cities as of 12/l/99 by Designation . . . . . . . . . . . . . . . . . . . . . . . . . . . .<br />
Map of Clean Cities as of 12/l/99 . . . . . . . . . . . . . . . . . . . . . . . . . . . . . . . . . . . . . . . .<br />
. . 4-36<br />
. . 4-37<br />
. . 4-38<br />
. . 4-39<br />
. 4-40<br />
. . * 9-8<br />
. . . 9-9<br />
New York City Driving Cycle .............................................. 7-27<br />
Breakdown of Domestic Marine Cargo by Commodity Class, 1998 ................ 12-6<br />
Class I Railroad Freight Systems in the United States Ranked by Revenue Ton-Miles,<br />
1998 ............................................................... 12-7<br />
Summary Statistics <strong>for</strong> Class I Freight Railroads, 1970-98 ........................ 12-8<br />
Sales-Weighted Engine Size of New Domestic and Import Light Trucks by Size Class,<br />
Sales Periods 1976-99 ................................................. 7-10<br />
Sales-Weighted Curb Weight of New Domestic and Import Automobiles by Size Class,<br />
Sales Periods 1976-99 ................................................. 7- 11<br />
Sales-Weighted Interior Space of New Domestic and Import Automobiles by Size Class,<br />
Sales Periods 1976-99 ................................................. 7-12<br />
Light Vehicle Market Shares by Size Class, Sales Period 1976-99 ................... 7-8<br />
Sales-Weighted Engine Size of New Domestic and Import Automobiles by Size Class,<br />
Sales Periods 1976-99 .................................................. 7-9<br />
Truck Statistics by Gross Vehicle Weight Class, 1997 ............................ 8-5<br />
Percentage of Trucks by Size Class, 1977, 1982, 1987, 1992, and 1997 .............. 8-5<br />
Truck Fuel Economy by Fuel Type and Size Class, 1997 .......................... 8-6<br />
Truck Fuel Economy by Size Class, 1977,1982, 1987, 1992, and 1997 .............. 8-6<br />
List of Clean Cities as of 12/l/99 by Designation ................................ 9-8<br />
Map of Clean Cities as of 12/l/99 ............................................ 9-9<br />
Collected<br />
Corporate Average Fuel Economy (CAFE) Fines Collected, 1983-98 ............... 7-19<br />
<strong>TRANSPORTATION</strong> <strong>ENERGY</strong> <strong>DATA</strong> <strong>BOOK</strong>: <strong>EDITION</strong> <strong>20</strong>-<strong>20</strong>00<br />
I-7
I-8<br />
Commerce<br />
Tonnage Statistics <strong>for</strong> Domestic and International Waterborne Commerce, 1970-98 .<br />
Summary Statistics <strong>for</strong> Domestic Waterborne Commerce, 1970-98 ...............<br />
Commodity<br />
Breakdown of Domestic Marine Cargo by Commodity Class, 1998 ..............<br />
Railroad Revenue Carloads by Commodity Group, 1974 and 1998 ...............<br />
Growth of Freight Activity in the United States: Comparison of the 1997 and 1993<br />
Commodity Flow Surveys ............................................<br />
Commodity Flow Survey Freight Activity, 1997 .............................<br />
Composition<br />
Fleet Vehicle Composition by Vehicle Type, 199 1 ............................<br />
Compounds<br />
Total National Emissions of Volatile Organic Compounds, 1970-98 ..............<br />
Emissions of Volatile Organic Compounds from Highway Vehicles, 1970-98 ......<br />
Consortium<br />
U.S. Advanced Battery Consortium Goals <strong>for</strong> Electric Vehicle Batteries ...........<br />
Consumed<br />
Fuel Consumed by Federal Government Fleets, FY 1997 .......................<br />
Consumer<br />
Consumer Price Indices, 1970-99 .........................................<br />
Consumption<br />
United States Petroleum Production and Consumption, 1973-99 .................<br />
Consumption by Petroleum by End-Use Sector, 1973-99 .......................<br />
World Oil Consumption, 1960-97 .........................................<br />
Alternative Vehicle Fuel Consumption, 1992-<strong>20</strong>00 ...........................<br />
World Consumption of Primary Energy by Selected Country Groups, 1989-98 .....<br />
U. S. Consumption of Total Energy by End-Use Sector, 1970-99 ................<br />
Distribution of Energy Consumption by Source, 1973, 1980, and 1999 ............<br />
Domestic Consumption of Transportation Energy by Mode and Fuel Type, 1998 ....<br />
Transportation Energy Consumption by Mode, 1970-98 .......................<br />
U.S. Carbon Dioxide Emissions from Fossil Energy Consumption by End-Use Sector,<br />
1984-98 ..........................................................<br />
Average Material Consumption <strong>for</strong> a Domestic Automobile, 1978, 1985, and 1999 . .<br />
Conventional<br />
. 12-4<br />
. 12-5<br />
. 12-6<br />
. 12-9<br />
. 8-12<br />
. 8-13<br />
. 10-4<br />
. . 4-7<br />
. . 4-8<br />
. 9-10<br />
. 10-7<br />
* 5-17<br />
. 1-12<br />
. 1-14<br />
. . l-4<br />
. 2-11<br />
. . 2-3<br />
. . 2-4<br />
. , 2-5<br />
. . 2-6<br />
. . 2-8<br />
. . 3-6<br />
. 7-15<br />
Conventional and Alternative Fuel Refueling Stations ......................... . 7-17<br />
<strong>TRANSPORTATION</strong><strong>ENERGY</strong><strong>DATA</strong>BOOIC <strong>EDITION</strong>~O-<strong>20</strong>00
Corporate<br />
Corporate Average Fuel Economy (CAFE) Standards versus Sales-Weighted Fuel<br />
Economy Estimates <strong>for</strong> Automobiles and Light Tmclts, 1978-99 ............... 7- 18<br />
Corporate Average Fuel Economy (CAFE) Fines Collected, 1983-98 ............... 7- 19<br />
Corporation<br />
cost<br />
costs<br />
Summary Statistics <strong>for</strong> the National Railroad Passenger Corporation (Amtrak),<br />
1971-98 ........................................................... 12-11<br />
Automobile Operating Cost per Mile, 1975-99 ................................. 5-l 5<br />
Fixed Automobile Operating Costs per Year, 1975-99 ........................... 5-16<br />
Countries<br />
Petroleum Stocks in OECD Countries, End of Year 1973-98 ....................... l-5<br />
Gasoline Prices <strong>for</strong> Selected Countries, 1978-99 ................................. 5-2<br />
Gasoline Prices <strong>for</strong> Selected Countries, 1990 and 1998 ........................... 5-3<br />
Diesel Fuel Prices <strong>for</strong> Selected Countries, 1978-99 .............................. 5-4<br />
Diesel Fuel Prices <strong>for</strong> Selected Countries, 1990 and 1998 ......................... 5-5<br />
Automobile Registrations <strong>for</strong> Selected Countries, 1950-96 ........................ 6-2<br />
Truck and Bus Registrations <strong>for</strong> Selected Countries, 1950-96 ...................... 6-3<br />
Country<br />
Crash<br />
World Production of Primary Energy by Selected Country Groups, 1989-98 .......... 2-2<br />
World Consumption of Primary Energy by Selected Country Groups, 1989-98 ........ 2-3<br />
Crashes by Crash Severity, Crash Type, and Vehicle Type, 1998 .................. 7-3 1<br />
Percent Rollover Occurrence by Vehicle Type and Crash Severity ................. 7-32<br />
Crashes<br />
Criteria<br />
Crude<br />
Crashes by Crash Severity, Crash Type, and Vehicle Type, 1998 .................. 7-3 1<br />
State-level Emissions <strong>for</strong> Criteria Pollutants, 1998 .............................. 4- 14<br />
NEAR-TERM Technology: Fuel-Cycle Energy and Criteria Pollutant Emission Changes<br />
of Alternative Transportation Fuels and Advanced Vehicle Technologies ......... 4-17<br />
Total National Emissions of the Criteria Air Pollutants by Sector, 1998 .............. 4-2<br />
U.S. Refinery Input of Crude Oil and Petroleum Products, 1987-98 ................ 1 - 10<br />
Refinery Yield of Petroleum Products fi-om a Barrel of Crude Oil, 1978-98 .......... l-l 1<br />
World Crude Oil Production, 1960-98 ......................................... l-3<br />
Crude Oil Prices, 1870-98 .................................................. l-6<br />
Prices <strong>for</strong> a Barrel of Crude Oil and a Gallon of Gasoline, 1978-99 .................. 5-6<br />
<strong>TRANSPORTATION</strong><strong>ENERGY</strong><strong>DATA</strong>BOOIC <strong>EDITION</strong>~O-<strong>20</strong>00<br />
I-9
I-10<br />
Curb<br />
Daily<br />
Sales-Weighted Curb Weight of New Domestic and Import Automobiles by Size Class,<br />
Sales Periods 1976-99 . . . . . . . . . . . . . . . . . . . . . . . . . . . . . . . . . . . . . . . . . . . . . . , . . 7-11<br />
Engine Size, Curb Weight, and Interior Space of New Domestic and Import<br />
Automobiles, 1976-99 . . . . . . . . . . . . . . . . . . . . . . . . . . . . . . . . . . . . . . . . . . . . . . . . . 7- 13<br />
I Average Annual and Daily Vehicle-Miles of Travel <strong>for</strong> Fleet Vehicles, 1991 . . . . . . . . 10-4<br />
Dealerships<br />
New Light Vehicle Dealerships and Sales, 1970-98 . . . . . . . . . . . . . . . . . . . . . . . . . . . . . 7-16<br />
Defending<br />
Summary of 1996 Military Expenditures <strong>for</strong> Defending Oil Supplies from the<br />
Demographic<br />
MiddleEast . . . . . . . . . . . . . . . . . . . . . . . . . . . . . . . . . . . . . . . . . . . . . . . . . . . . . . . . . . l-8<br />
Demographic Statistics, 1969, 1977, 1983, 1990, and 1995 NPTS . . . . . . . . . . . . . . . . . . 1 l-5<br />
Designation<br />
List of Clean Cities as of 12/l/99 by Designation . . . . . . . . . . . . . . . . . . . . . . . . . . . . . . , . 9-8<br />
Destination<br />
Diesel<br />
Long-Distance Trips by Destination, 1995 . . . . . . . . . . . . . . . . . . . . . . . . . . . . . . . . . . . 1 l- 17<br />
Federal Exhaust Emission Certification Standards <strong>for</strong> Gasoline- and Diesel-Powered<br />
Light Vehicles . . . . . . . . . . . . . . . . . . . . . . . . . . . . . . . . . . . . . . . . . . . . . . . . . . . . . . . 4-33<br />
Federal Exhaust Emission Certification Standards <strong>for</strong> Gasoline- and Diesel-Powered<br />
LightTrucks . . . . . . . . . . . . . . . . . . . . . . . . . . . . . . . . . . . . . . . . . . . . . . . . . . . . . . . . . 4-34<br />
Federal Exhaust Emission Certification Standards <strong>for</strong> Gasoline- and Diesel-Powered<br />
Light Trucks . . . . . . . . . . . . . . . . . . . . . . . . . . . . . . . . . . . . . . . . . . . . . . . . . . . . . . . . . 4-35<br />
Federal Exhaust Emission Certification Standards <strong>for</strong> Gasoline- and Diesel-Powered<br />
LightT~cks......................................................... 4-36<br />
Federal Exhaust Emission Certification Standards <strong>for</strong> Gasoline- and Diesel-Powered<br />
LightTrucks . . . . . . . . . . . . . . . . . . . . . . . . . . . . . . . . . . . . . . . . . . . . . . . . . . . . . . . . . 4-37<br />
Federal Exhaust Emission Certification Standards <strong>for</strong> Gasoline- and Diesel-Powered<br />
LightHeavyTrucks . . . . . . . . . . . . . . . . . . . . . . . . . . . . . . . . . . . . . . . . . . . . . . . . . . . 4-38<br />
Federal Exhaust Emission Certification Standards <strong>for</strong> Gasoline- and Diesel-Powered<br />
Heavy Heavy Trucks . . . . . . . . . . . . . . . . . . . . . . . . . . . . . . . . . . . . . . . . . . . . . . , . , . 4-3 9<br />
Diesel Fuel Prices <strong>for</strong> Selected Countries, 1978-99 . . . . . . . . . . . . . . . . . . . . . . . . . . . . . . 5-4<br />
Diesel Fuel Prices <strong>for</strong> Selected Countries, 1990 and 1998 . . . . . . . . . . . . . . . . . . . . . . . . . 5-5<br />
<strong>TRANSPORTATION</strong><strong>ENERGY</strong><strong>DATA</strong>BOOIC <strong>EDITION</strong>~O-<strong>20</strong>00
Dioxide<br />
International Man-Made Emissions of Carbon Dioxide, 1990-97 .................... 3-3<br />
International Man-Made Emissions of Carbon Dioxide by Source Category, 1990<br />
and1997 ............................................................. 3-4<br />
U.S. Carbon Dioxide Emissions from Fossil Energy Consumption by End-Use Sector,<br />
1984-98 ............................................................. 3-6<br />
U.S. Carbon Dioxide Emissions from Energy Use in the Transportation Sector,<br />
1980-98 ............................................................. 3-7<br />
Numerical Estimates of Global Warming Potentials Compared With Carbon Dioxide ... 3-8<br />
Distance<br />
Long-Distance Trips by Destination, 1995 ................................... 1 l- 17<br />
Long-Distance Trips by Mode and Purpose, 1995 ............................. 11-18<br />
Long-Distance Household Trips by Mode and Trip Distance, 1995 ................ 1 l- 19<br />
Shares of Long-Distance Person Trips by Mode and Household Income, 1995 ....... 1 l-<strong>20</strong><br />
Distribution<br />
Distribution of Energy Consumption by Source, 1973, 1980, and 1999 ............... 2-5<br />
Domestic<br />
Summary Statistics <strong>for</strong> U.S. Domestic and International Certificated Route Air Carriers,<br />
1970-98 ............................................................ 12-2<br />
Tonnage Statistics <strong>for</strong> Domestic and International Waterborne Commerce, 1970-98 , . . 12-4<br />
Summary Statistics <strong>for</strong> Domestic Waterborne Commerce, 1970-98 ................. 12-5<br />
Breakdown of Domestic Marine Cargo by Commodity Class, 1998 ................ 12-6<br />
Domestic Consumption of Transportation Energy by Mode and Fuel Type, 1998 ....... 2-6<br />
Sales-Weighted Engine Size of New Domestic and Import Light Trucks by Size Class,<br />
Sales Periods 1976-99 ................................................. 7-10<br />
Sales-Weighted Curb Weight of New Domestic and Import Automobiles by Size Class,<br />
Sales Periods 1976-99 ................................................. 7- 11<br />
Sales-Weighted Interior Space of New Domestic and Import Automobiles by Size Class,<br />
Sales Periods 1976-99 ................................................. 7- 12<br />
Engine Size, Curb Weight, and Interior Space of New Domestic and Import<br />
Automobiles, 1976-99 ................................................. 7- 13<br />
Average Material Consumption <strong>for</strong> a Domestic Automobile, 1978, 1985, and 1999 .... 7-l 5<br />
Period Sales, Market Shares, and Sales-Weighted Fuel Economies of New Domestic and<br />
Import Automobiles, Selected Sales Periods 1976-99 .......................... 7-6<br />
Period Sales, Market Shares, and Sales-Weighted Fuel Economies of New Domestic and<br />
Import Light Trucks, Selected Sales Period 1976-99 .......................... 7-7<br />
Sales-Weighted Engine Size of New Domestic and Import Automobiles by Size Class,<br />
Sales Periods 1976-99 .................................................. 7-9<br />
<strong>TRANSPORTATION</strong><strong>ENERGY</strong><strong>DATA</strong>BOOIC <strong>EDITION</strong>~O-<strong>20</strong>00<br />
I-11
I-12<br />
Driving<br />
Urban Driving Cycle ..................................................... 7-26<br />
Highway Driving Cycle ................................................... 7-26<br />
New York City Driving Cycle .............................................. 7-27<br />
East<br />
Representative Number Five Driving Cycle ................................... 7-27<br />
US06 Driving Cycle ...................................................... 7-28<br />
Summary of 1996 Military Expenditures <strong>for</strong> Defending Oil Supplies from the<br />
MiddleEast .......................................................... l-8<br />
Economic<br />
Economic Indicators, 1970-99 .............................................. 5- 17<br />
Economies<br />
Period Sales, Market Shares, and Sales-Weighted Fuel Economies of New Domestic and<br />
Import Automobiles, Selected Sales Periods 1976-99 .......................... 7-6<br />
Period Sales, Market Shares, and Sales-Weighted Fuel Economies of New Domestic and<br />
Economy<br />
Import Light Trucks, Selected Sales Period 1976-99 .......................... 7-7<br />
Corporate Average Fuel Economy (CAFE) Standards versus Sales-Weighted Fuel<br />
Economy Estimates <strong>for</strong> Automobiles and Light Trucks, 1978-99 ............... 7-l 8<br />
Corporate Average Fuel Economy (CAFE) Fines Collected, 1983-98 ............... 7-19<br />
Fuel Economy by Speed, 1973,1984 and 1997 ................................. 7-23<br />
Fuel Economy by Speed, 1973,1984 and 1997. ................................ 7-24<br />
Steady Speed Fuel Economy <strong>for</strong> Tested Vehicles ............................... 7-25<br />
Truck Fuel Economy by Fuel Type and Size Class, 1997 .......................... 8-6<br />
Truck Fuel Economy by Size Class, 1977,1982,1987,1992, and 1997 .............. 8-6<br />
Electric<br />
U.S. Advanced Battery Consortium Goals <strong>for</strong> Electric Vehicle Batteries ............. 9 10<br />
PNGV Goals and Specifications of Hybrid-Electric Vehicles ...................... 9- 11<br />
Emission<br />
NEAR-TERM Technology: Fuel-Cycle Energy and Greenhouse Gas Emission Changes<br />
of Alternative Transportation Fuels and Advanced Vehicle Technologies ......... 3-l 1<br />
LONG-TERM Technology: Fuel-Cycle Energy and Greenhouse Gas Emission Changes<br />
of Alternative Transportation Fuels and Advanced Vehicle Technologies ......... 3-12<br />
National Lead Emission Estimates, 1970-98 ................................... 4- 13<br />
NEAR-TERM Technology: Fuel-Cycle Energy and Criteria Pollutant Emission Changes<br />
of Alternative Transportation Fuels and Advanced Vehicle Technologies ......... 4-17<br />
<strong>TRANSPORTATION</strong> <strong>ENERGY</strong> <strong>DATA</strong> <strong>BOOK</strong>: EDUION <strong>20</strong>-<strong>20</strong>00
Emission (continued)<br />
LONG-TERM Technology: Fuel-Cycle Energy and Greenhouse Gas Emission Changes<br />
of Alternative Transportation Fuels and Advanced Vehicle Technologies ......... 4-19<br />
Tier 2 Federal Emission Standards .......................................... 4-32<br />
Federal Exhaust Emission Certification Standards <strong>for</strong> Gasoline- and Diesel-Powered<br />
LightVehicles ....................................................... 4-33<br />
Federal Exhaust Emission Certification Standards <strong>for</strong> Gasoline- and Diesel-Powered<br />
LightTrucks.. ....................................................... 4-34<br />
Federal Exhaust Emission Certification Standards <strong>for</strong> Gasoline- and Diesel-Powered<br />
LightT~cks ......................................................... 4-35<br />
Federal Exhaust Emission Certification Standards <strong>for</strong> Gasoline- and Diesel-Powered<br />
LightTrucks ......................................................... 4-36<br />
Federal Exhaust Emission Certification Standards <strong>for</strong> Gasoline- and Diesel-Powered<br />
LightTrucks.. ....................................................... 4-37<br />
Federal Exhaust Emission Certification Standards <strong>for</strong> Gasoline- and Diesel-Powered<br />
LightHeavyTrucks ................................................... 4-38<br />
Federal Exhaust Emission Certification Standards <strong>for</strong> Gasoline- and Diesel-Powered<br />
Heavy Heavy Trucks .................................................. 4-39<br />
Cali<strong>for</strong>nia Passenger Cars and Light Trucks Emission Certification Standards ........ 4-40<br />
Cali<strong>for</strong>nia Vehicle Emission Reduction <strong>for</strong> Passenger Cars and Light Trucks ......... 4-41<br />
Cali<strong>for</strong>nia Air Resources Board Requirements <strong>for</strong> Meeting Emission Standards ....... 4-42<br />
Emissions<br />
International Man-Made Emissions of Greenhouse Gases, 1990-97 .................. 3-2<br />
International Man-Made Emissions of Carbon Dioxide, 1990-97 .................... 3-3<br />
International Man-Made Emissions of Carbon Dioxide by Source Category, 1990<br />
and1997 ............................................................. 3-4<br />
Estimated U.S. Emissions of Greenhouse Gases, 1990-98 ......................... 3-5<br />
U.S. Carbon Dioxide Emissions from Fossil Energy Consumption by End-Use Sector,<br />
1984-98 ............................................................. 3-6<br />
U.S. Carbon Dioxide Emissions from Energy Use in the Transportation Sector,<br />
1980-98 ............................................................. 3-7<br />
Emissions of Particulate Matter (PM-lo) from Highway Vehicles, 1970-98 .......... 4-10<br />
Total National Emissions of Particulate Matter (PM-2.5), 1990-98 ................. 4-11<br />
Emissions of Particulate Matter (PM-2.5) from Highway Vehicles, 1990-98 .......... 4-12<br />
State-level Emissions <strong>for</strong> Criteria Pollutants, 1998 .............................. 4- 14<br />
Total National Emissions of the Criteria Air Pollutants by Sector, 1998 .............. 4-2<br />
Total National Emissions of Carbon Monoxide, 1970-98 .......................... 4-3<br />
Emissions of Carbon Monoxide from Highway Vehicles, 1970-98 .................. 4-4<br />
<strong>TRANSPORTATION</strong><strong>ENERGY</strong><strong>DATA</strong>BOOIC <strong>EDITION</strong> <strong>20</strong>-<strong>20</strong>00<br />
I-13
I-14<br />
Emissions (continued)<br />
Total National Emissions of Nitrogen Oxides, 1970-98 ........................... 4-5<br />
Emissions of Nitrogen Oxides from Highway Vehicles, 1970-98 .................... 4-6<br />
Total National Emissions of Volatile Organic Compounds, 1970-98 ................. 4-7<br />
Emissions of Volatile Organic Compounds from Highway Vehicles, 1970-98 ......... 4-8<br />
Total National Emissions of Particulate Matter (PM-l 0), 1970-98 ................... 4-9<br />
Employees<br />
Employees of Motor Vehicle and Related Industries, 1990 and 1997 ................ 5-l 9<br />
Employment<br />
Motor Vehicle Manufacturing Employment Statistics, 1972-98 .................... 5-18<br />
Employment in Transportation and Related Industries, 1960-98 ................... 5-<strong>20</strong><br />
Energy<br />
Energy Policy Act Purchase Requirements of Light Alternative Fuel Vehicles ........ 10-8<br />
Passenger Travel and Energy Use in the United States, 1998 ...................... 2- 13<br />
Energy Intensities of Passenger Modes, 1970-98 ............................... 2- 14<br />
Energy Intensity <strong>for</strong> Transit in the U.S., 1998 .................................. 2-l 5<br />
Intercity Freight Movement and Energy Use in the United States, 1998 ............. 2-16<br />
Energy Intensities of Freight Modes, 1970-98 ................................. 2-l 7<br />
World Production of Primary Energy by Selected Country Groups, 1989-98 .......... 2-2<br />
World Consumption of Primary Energy by Selected Country Groups, 1989-98 ........ 2-3<br />
U. S. Consumption of Total Energy by End-Use Sector, 1970-99 ................... 2-4<br />
Distribution of Energy Consumption by Source, 1973, 1980, and 1999 ............... 2-5<br />
Domestic Consumption of Transportation Energy by Mode and Fuel Type, 1998 ....... 2-6<br />
Transportation Energy Use by Mode, 1997-98 .................................. 2-7<br />
Transportation Energy Consumption by Mode, 1970-98 .......................... 2-8<br />
NEAR-TERM Technology: Fuel-Cycle Energy and Greenhouse Gas Emission Changes<br />
of Alternative Transportation Fuels and Advanced Vehicle Technologies ......... 3-l 1<br />
LONG-TERM Technology: Fuel-Cycle Energy and Greenhouse Gas Emission Changes<br />
of Alternative Transportation Fuels and Advanced Vehicle Technologies ......... 3-12<br />
U.S. Carbon Dioxide Emissions from Fossil Energy Consumption by End-Use Sector,<br />
1984-98 ............................................................. 3-6<br />
U.S. Carbon Dioxide Emissions from Energy Use in the Transportation Sector,<br />
1980-98 ............................................................. 3-7<br />
NEAR-TERM Technology: Fuel-Cycle Energy and Criteria Pollutant Emission Changes<br />
of Alternative Transportation Fuels and Advanced Vehicle Technologies ......... 4-17<br />
LONG-TERM Technology: Fuel-Cycle Energy and Greenhouse Gas Emission Changes<br />
of Alternative Transportation Fuels and Advanced Vehicle Technologies ......... 4-19<br />
<strong>TRANSPORTATION</strong> <strong>ENERGY</strong> <strong>DATA</strong> <strong>BOOK</strong>: <strong>EDITION</strong> <strong>20</strong>-<strong>20</strong>00
Engine<br />
Sales-Weighted Engine Size of New Domestic and Import Light Trucks by Size Class,<br />
Sales Periods 1976-99 ................................................. 7-l 0<br />
Engine Size, Curb Weight, and Interior Space of New Domestic and Import<br />
Automobiles, 1976-99 ................................................. 7- 13<br />
Sales-Weighted Engine Size of New Domestic and Import Automobiles by Size Class,<br />
Sales Periods 1976-99 .................................................. 7-9<br />
Estimated<br />
Estimated U.S. Emissions of Greenhouse Gases, 1990-98 ......................... 3-5<br />
Estimates<br />
Numerical Estimates of Global Warming Potentials Compared With Carbon Dioxide ... 3-8<br />
National Lead Emission Estimates, 1970-98 ................................... 4- 13<br />
Corporate Average Fuel Economy (CAFE) Standards versus Sales-Weighted Fuel<br />
Economy Estimates <strong>for</strong> Automobiles and Light Trucks, 1978-99 ............... 7- 18<br />
Estimates of Alternative Fuel Vehicles in Use, 1992-<strong>20</strong>00 ......................... 9-3<br />
Estimates of Light Alternative Fuel Vehicles, 1996, 1998, and <strong>20</strong>00 ................. 9-4<br />
Estimates of Heavy Alternative Fuel Vehicles, 1996, 1998, and <strong>20</strong>00 ................ 9-5<br />
Ethanol<br />
Excise<br />
U.S. Production and Imports of MTBE and Fuel Ethanol, 1978-99 ................. 2-12<br />
States With Ethanol Tax Incentives .......................................... 5-12<br />
Federal Excise Taxes on Motor Fuels ........................................ 5-l 1<br />
Exemptions<br />
State Tax Exemptions <strong>for</strong> Gasohol, January 1,<strong>20</strong>0O ............................. 5-l 1<br />
Exhaust<br />
Federal Exhaust Emission Certification Standards <strong>for</strong> Gasoline- and Diesel-Powered<br />
LightVehicles ....................................................... 4-33<br />
Federal Exhaust Emission Certification Standards <strong>for</strong> Gasoline- and Diesel-Powered<br />
LightTrucks.. .......................................................<br />
Federal Exhaust Emission Certification Standards <strong>for</strong> Gasoline- and Diesel-Powered<br />
Light Trucks.. ....................................................... 4-35<br />
Federal Exhaust Emission Certification Standards <strong>for</strong> Gasoline- and Diesel-Powered<br />
Light Trucks.. ....................................................... 4-36<br />
Federal Exhaust Emission Certification Standards <strong>for</strong> Gasoline- and Diesel-Powered<br />
LightTrucks.. ....................................................... 4-37<br />
Federal Exhaust Emission Certification Standards <strong>for</strong> Gasoline- and Diesel-Powered<br />
LightHeavyTrucks ................................................... 4-38<br />
Federal Exhaust Emission Certification Standards <strong>for</strong> Gasoline- and Diesel-Powered<br />
4-34<br />
HeavyHeavyTrucks .................................................. 4-39<br />
<strong>TRANSPORTATION</strong> <strong>ENERGY</strong> <strong>DATA</strong> <strong>BOOK</strong>: <strong>EDITION</strong> <strong>20</strong>-<strong>20</strong>00<br />
I-15
I-16<br />
Expenditures<br />
Summary of 1996 Military Expenditures <strong>for</strong> Defending Oil Supplies from the<br />
MiddleEast ........................................................<br />
Average Annual Expenditures of Households by Income, 1998 ...................<br />
Facility<br />
Percentage of Trucks by Major Use and Primary Refueling Facility, 1997 ..........<br />
Percentage of Trucks by Fleet Size and Primary Refueling Facility, 1997 ...........<br />
Fatalities<br />
Federal<br />
Fines<br />
Fiscal<br />
Occupant Fatalities by Vehicle Type and Nonoccupant Fatalities, 1975-98 ..........<br />
Worldwide Federal Inventory, 1992-97 ......................................<br />
Average Miles per Federal Vehicle by Vehicle Type, 1997 ......................<br />
Federal Governrnent Vehicles by Agency, Fiscal Year 1997 .....................<br />
Federal Fleet Vehicle Acquisitions by Fuel Type, FY 1997 ......................<br />
Fuel Consumed by Federal Government Fleets, FY 1997 ........................<br />
Tier 2 Federal Emission Standards .........................................<br />
Federal Exhaust Emission Certification Standards <strong>for</strong> Gasoline- and Diesel-Powered<br />
LightVehicles ......................................................<br />
Federal Exhaust Emission Certification Standards <strong>for</strong> Gasoline- and Diesel-Powered<br />
Light Trucks.. ......................................................<br />
Federal Exhaust Emission Certification Standards <strong>for</strong> Gasoline- and Diesel-Powered<br />
LightTrucks.. ......................................................<br />
Federal Exhaust Emission Certification Standards <strong>for</strong> Gasoline- and Diesel-Powered<br />
Light Trucks.. ......................................................<br />
Federal Exhaust Emission Certification Standards <strong>for</strong> Gasoline- and Diesel-Powered<br />
Light Trucks.. ......................................................<br />
Federal Exhaust Emission Certification Standards <strong>for</strong> Gasoline- and Diesel-Powered<br />
LightHeavyTrucks ..................................................<br />
Federal Exhaust Emission Certification Standards <strong>for</strong> Gasoline- and Diesel-Powered<br />
Heavy Heavy Trucks .................................................<br />
Federal Excise Taxes on Motor Fuels .......................................<br />
Corporate Average Fuel Economy (CAFE) Fines Collected, 1983-98 ..............<br />
Federal Government Vehicles by Agency, Fiscal Year 1997 .....................<br />
Fixed<br />
. l-8<br />
11-3<br />
8-10<br />
. 8-9<br />
Fixed Automobile Operating Costs per Year, 1975-99 .......................... 5-16<br />
<strong>TRANSPORTATION</strong> <strong>ENERGY</strong> <strong>DATA</strong> <strong>BOOK</strong>: <strong>EDITION</strong> <strong>20</strong>-<strong>20</strong>00<br />
7-29<br />
10-5<br />
10-5<br />
10-6<br />
10-7<br />
10-7<br />
4-32<br />
4-33<br />
4-34<br />
4-35<br />
4-36<br />
4-37<br />
4-38<br />
4-39<br />
5-11<br />
7-19<br />
10-6
Fleet<br />
Fleet Vehicles in Service as of January 1,1999 ................................ 10-2<br />
Fleet Vehicle Composition by Vehicle Type, 1991 .............................. 1 O-4<br />
Average Length of Time Fleet Vehicles are Kept Be<strong>for</strong>e Sold to Others, 1991 ........ 1 O-4<br />
Average Annual and Daily Vehicle-Miles of Travel <strong>for</strong> Fleet Vehicles, 1991 ......... 1 O-4<br />
Federal Fleet Vehicle Acquisitions by Fuel Type, FY 1997 ....................... 1 O-7<br />
Percentage of Trucks by Fleet Size and Primary Refueling Facility, 1997 ............. 8-9<br />
Fleets<br />
Flow<br />
Fossil<br />
Freight<br />
Fuel<br />
Top Ten States with Fleets of Ten Vehicles or More, 1999 ....................... 10-3<br />
Fuel Consumed by Federal Government Fleets, FY 1997 ......................... 1 O-7<br />
Growth of Freight Activity in the United States: Comparison of the 1997 and 1993<br />
Commodity Flow Surveys .............................................. 8- 12<br />
Commodity Flow Survey Freight Activity, 1997 ............................... 8-l 3<br />
World Fossil Fuel Potential ................................................. l-2<br />
U.S. Carbon Dioxide Emissions from Fossil Energy Consumption by End-Use Sector,<br />
1984-98 ............................................................. 3-6<br />
Class I Railroad Freight Systems in the United States Ranked by Revenue Ton-Miles,<br />
1998 ............................................................... 12-7<br />
Summary Statistics <strong>for</strong> Class I Freight Railroads, 1970-98 ........................ 12-8<br />
Intercity Freight Movement and Energy Use in the United States, 1998 ............. 2- 16<br />
Energy Intensities of Freight Modes, 1970-98 ................................. 2- 17<br />
Growth of Freight Activity in the United States: Comparison of the 1997 and 1993<br />
Commodity Flow Surveys .............................................. 8- 12<br />
Commodity Flow Survey Freight Activity, 1997 ............................... 8-13<br />
World Fossil Fuel Potential ................................................. l-2<br />
Federal Fleet Vehicle Acquisitions by Fuel Type, FY 1997 ....................... 10-7<br />
Fuel Consumed by Federal Government Fleets, FY 1997 ......................... 10-7<br />
Energy Policy Act Purchase Requirements of Light Alternative Fuel Vehicles .......o 1 O-8<br />
Alternative Vehicle Fuel Consumption, 1992-<strong>20</strong>00 ............................. 2- 11<br />
U.S. Production and Imports of MTBE and Fuel Ethanol, 1978-99 ................. 2-12<br />
Domestic Consumption of Transportation Energy by Mode and Fuel Type, 1998 ....... 2-6<br />
NEAR-TERM Technology: Fuel-Cycle Energy and Greenhouse Gas Emission Changes<br />
of Alternative Transportation Fuels and Advanced Vehicle Technologies ......... 3-l 1<br />
<strong>TRANSPORTATION</strong> <strong>ENERGY</strong> <strong>DATA</strong> <strong>BOOK</strong>: <strong>EDITION</strong> <strong>20</strong>-<strong>20</strong>00<br />
I-17
I-18<br />
Fuel<br />
Fuels<br />
LONG-TERM Technology: Fuel-Cycle Energy and Greenhouse Gas Emission Changes<br />
of Alternative Transportation Fuels and Advanced Vehicle Technologies ......... 3-12<br />
NEAR-TERM Technology: Fuel-Cycle Energy and Criteria Pollutant Emission Changes<br />
of Alternative Transportation Fuels and Advanced Vehicle Technologies ......... 4-17<br />
LONG-TERM Technology: Fuel-Cycle Energy and Greenhouse Gas Emission Changes<br />
of Alternative Transportation Fuels and Advanced Vehicle Technologies ......... 4-19<br />
Diesel Fuel Prices <strong>for</strong> Selected Countries, 1978-99 .............................. 5-4<br />
Diesel Fuel Prices <strong>for</strong> Selected Countries, 1990 and 1998 ......................... 5-5<br />
Retail Prices <strong>for</strong> Motor Fuel, 1978-99 ......................................... 5-7<br />
Conventional and Alternative Fuel Refueling Stations ........................... 7- 17<br />
Corporate Average Fuel Economy (CAFE) Standards versus Sales-Weighted Fuel<br />
Economy Estimates <strong>for</strong> Automobiles and Light Trucks, 1978-99 ............... 7-l 8<br />
Corporate Average Fuel Economy (CAFE) Fines Collected, 1983-98 ............... 7-19<br />
Fuel Economy by Speed, 1973,1984 and 1997 ................................. 7-23<br />
Fuel Economy by Speed, 1973,1984 and 1997 ................................. 7-24<br />
Steady Speed Fuel Economy <strong>for</strong> Tested Vehicles ............................... 7-25<br />
Period Sales, Market Shares, and Sales-Weighted Fuel Economies of New Domestic and<br />
Import Automobiles, Selected Sales Periods 1976-99 .......................... 7-6<br />
Period Sales, Market Shares, and Sales-Weighted Fuel Economies of New Domestic and<br />
Import Light Trucks, Selected Sales Period 1976-99 .......................... 7-7<br />
Truck Fuel Economy by Fuel Type and Size Class, 1997 .......................... 8-6<br />
Truck Fuel Economy by Size Class, 1977,1982,1987,1992, and 1997 .............. 8-6<br />
Estimates of Alternative Fuel Vehicles in Use, 1992-<strong>20</strong>00 ......................... 9-3<br />
Estimates of Light Alternative Fuel Vehicles, 1996, 1998, and <strong>20</strong>00 ................. 9-4<br />
Estimates of Heavy Alternative Fuel Vehicles, 1996, 1998, and <strong>20</strong>00 ................ 9-5<br />
Alternative Fuel Vehicles Available by Manufacturer, Model Year <strong>20</strong>00 ............. 9-6<br />
Number of Alternative Refuel Sites by State and Fuel Type, 1999 ................... 9-7<br />
Highway Usage of Gasoline and Special Fuels, 1973-98 .......................... 2-9<br />
NEAR-TERM Technology: Fuel-Cycle Energy and Greenhouse Gas Emission Changes<br />
of Alternative Transportation Fuels and Advanced Vehicle Technologies ......... 3-l 1<br />
LONG-TERM Technology: Fuel-Cycle Energy and Greenhouse Gas Emission Changes<br />
of Alternative Transportation Fuels and Advanced Vehicle Technologies ......... 3-12<br />
NEAR-TERM Technology: Fuel-Cycle Energy and Criteria Pollutant Emission Changes<br />
of Alternative Transportation Fuels and Advanced Vehicle Technologies ......... 4-17<br />
LONG-TERM Technology: Fuel-Cycle Energy and Greenhouse Gas Emission Changes<br />
of Alternative Transportation Fuels and Advanced Vehicle Technologies ......... 4-l 9<br />
<strong>TRANSPORTATION</strong> <strong>ENERGY</strong> DA’IYA <strong>BOOK</strong>: <strong>EDITION</strong> <strong>20</strong>-<strong>20</strong>00
Fuels (continued)<br />
Gallon<br />
Gas<br />
Gases<br />
Federal Excise Taxes on Motor Fuels ........................................ 5- 11<br />
Prices <strong>for</strong> Selected Transportation Fuels, 1978-99 ............................... 5-8<br />
State Taxes on Motor Fuels, 1999 ............................................ 5-9<br />
Prices <strong>for</strong> a Barrel of Crude Oil and a,Gallon of Gasoline, 1978-99 .................. 5-6<br />
NEAR-TERM Technology: Fuel-Cycle Energy and Greenhouse Gas Emission Changes<br />
of Alternative Transportation Fuels and Advanced Vehicle Technologies ......... 3-l 1<br />
LONG-TERM Technology: Fuel-Cycle Energy and Greenhouse Gas Emission Changes<br />
of Alternative Transportation Fuels and Advanced Vehicle Technologies ......... 3-12<br />
LONG-TERM Technology: Fuel-Cycle Energy and Greenhouse Gas Emission Changes<br />
of Alternative Transportation Fuels and Advanced Vehicle Technologies ......... 4-19<br />
Tax Receipts from the Sale of Gas Guzzlers, 1980-98 ........................... 7-19<br />
The Gas Guzzler Tax on New Cars .......................................... 7-<strong>20</strong><br />
International Man-Made Emissions of Greenhouse Gases, 1990-97 .................. 3-2<br />
Estimated U.S. Emissions of Greenhouse Gases, 1990-98 ......................... 3-5<br />
Gasohol<br />
State Tax Exemptions <strong>for</strong> Gasohol, January 1,<strong>20</strong>0O ............................. 5-l 1<br />
Gasoline<br />
Motor Gasoline Quantities by Type, 1981 and 1998 ............................. 2-10<br />
Highway Usage of Gasoline and Special Fuels, 1973-98 .......................... 2-9<br />
Federal Exhaust Emission Certification Standards <strong>for</strong> Gasoline- and Diesel-Powered<br />
LightVehicles ....................................................... 4-33<br />
Federal Exhaust Emission Certification Standards <strong>for</strong> Gasoline- and Diesel-Powered<br />
LightTrucks.. ....................................................... 4-34<br />
Federal Exhaust Emission Certification Standards <strong>for</strong> Gasoline- and Diesel-Powered<br />
Light Trucks.. ....................................................... 4-35<br />
Federal Exhaust Emission Certification Standards <strong>for</strong> Gasoline- and Diesel-Powered<br />
Light Trucks.. ....................................................... 4-36<br />
Federal Exhaust Emission Certification Standards <strong>for</strong> Gasoline- and Diesel-Powered<br />
LightT~cks ......................................................... 4-37<br />
Federal Exhaust Emission Certification Standards <strong>for</strong> Gasoline- and Diesel-Powered<br />
LightHeavyTrucks ................................................... 4-38<br />
Federal Exhaust Emission Certification Standards <strong>for</strong> Gasoline- and Diesel-Powered<br />
Heavy Heavy Trucks .................................................. 4-39<br />
Gasoline Prices <strong>for</strong> Selected Countries, 1978-99 ................................. 5-2<br />
<strong>TRANSPORTATION</strong> <strong>ENERGY</strong> <strong>DATA</strong> <strong>BOOK</strong>: <strong>EDITION</strong> <strong>20</strong>-<strong>20</strong>00<br />
I-19
I-<strong>20</strong><br />
Gasoline (continued)<br />
Global<br />
Goals<br />
Gasoline Prices <strong>for</strong> Selected Countries, 1990 and 1998 ....................... . . 5-3<br />
Prices <strong>for</strong> a Barrel of Crude Oil and a Gallon of Gasoline, 1978-99 .............. . . 5-6<br />
Numerical Estimates of Global Warming Potentials Compared With Carbon Dioxide . . 3-8<br />
U.S. Advanced Battery Consortium Goals <strong>for</strong> Electric Vehicle Batteries .......... . 9-10<br />
PNGV Goals and Specifications of Hybrid-Electric Vehicles ................... . 9-11<br />
Government<br />
Federal Government Vehicles by Agency, Fiscal Year 1997 ...................... 10-6<br />
Fuel Consumed by Federal Government Fleets, FY 1997 ......................... 10-7<br />
Greenhouse<br />
Gross<br />
NEAR-TERM Technology: Fuel-Cycle Energy and Greenhouse Gas Emission Changes<br />
of Alternative Transportation Fuels and Advanced Vehicle Technologies ......... 3-l 1<br />
LONG-TERM Technology: Fuel-Cycle Energy and Greenhouse Gas Emission Changes<br />
of Alternative Transportation Fuels and Advanced Vehicle Technologies ......... 3-12<br />
International Man-Made Emissions of Greenhouse Gases, 1990-97 .................. 3-2<br />
Estimated U.S. Emissions of Greenhouse Gases, 1990-98 ......................... 3-5<br />
LONG-TERM Technology: Fuel-Cycle Energy and Greenhouse Gas Emission Changes<br />
of Alternative Transportation Fuels and Advanced Vehicle Technologies ......... 4-l 9<br />
Refinery Gross Output by World Region, 1999 ................................. l-9<br />
New Retail Truck Sales by Gross Vehicle Weight, 1970-98 ........................ 8-3<br />
Truck Statistics by Gross Vehicle Weight Class, 1997 ............................ 8-5<br />
Growth<br />
Growth of Freight Activity in the United States: Comparison of the 1997 and 1993<br />
Commodity Flow Surveys .............................................. 8- 12<br />
Guzzler<br />
The Gas Guzzler Tax on New Cars .......................................... 7-<strong>20</strong><br />
Guzzlers<br />
GVW<br />
Heavy<br />
Tax Receipts from the Sale of Gas Guzzlers, 1980-98 ........................... 7-l 9<br />
New Retail Sales of Trucks 10,000 pounds GVW and Less in the United States,<br />
1970-98 ........................................ ..1.................. 7-5<br />
Federal Exhaust Emission Certification Standards <strong>for</strong> Gasoline- and Diesel-Powered<br />
Light Heavy Trucks ................................................... 4-3 8<br />
<strong>TRANSPORTATION</strong> <strong>ENERGY</strong> <strong>DATA</strong> <strong>BOOK</strong>: <strong>EDITION</strong> <strong>20</strong>-<strong>20</strong>00
Heavy (continued)<br />
Federal Exhaust Emission Certification Standards <strong>for</strong> Gasoline- and Diesel-Powered<br />
Heavy Heavy Trucks .................................................. 4-39<br />
Estimates of Heavy Alternative Fuel Vehicles, 1996, 1998, and <strong>20</strong>00 ................ 9-5<br />
Highway<br />
Highway Usage of Gasoline and Special Fuels, 1973-98 .......................... 2-9<br />
. Emissions of Particulate Matter (PM-lo) from Highway Vehicles, 1970-98 .......... 4-10<br />
Emissions of Particulate Matter (PM-2.5) from Highway Vehicles, 1990-98 .......... 4-12<br />
Emissions of Carbon Monoxide from Highway Vehicles, 1970-98 .................. 4-4<br />
Emissions of Nitrogen Oxides from Highway Vehicles, 1970-98 .................... 4-6<br />
Emissions of Volatile Organic Compounds from Highway Vehicles, 1970-98 ......... 4-8<br />
Highway Vehicle Miles Traveled by Vehicle Type, 1970-98 ....................... 6-7<br />
Highway Driving Cycle ................................................... 7-26<br />
Household<br />
Average Annual Miles per Vehicle by Household Vehicle Ownership, 1995 NPTS .... 1 1 - 12<br />
Average Age of Vehicles by Household Vehicle Ownership, 1995 NPTS ........... 1 l-12<br />
Average Annual Miles per Household Vehicle by Vehicle Age ................... 1 l-l 3<br />
Long-Distance Household Trips by Mode and Trip Distance, 1995 ................ 1 l-19<br />
Shares of Long-Distance Person Trips by Mode and Household Income, 1995 ....... 1 l-<strong>20</strong><br />
Household Vehicle Ownership, 1960-90 Census ............................... 1 l-4<br />
Average Annual Vehicle-Miles, Vehicle Trips and Trip Length per Household ....... 1 l-6<br />
Average Annual Person-Miles Traveled (PMT), Person Trips and Trip Length per<br />
Household by Selected Trip Purposes ..................................... 1 l-7<br />
Average Number of Vehicles and Vehicle Travel per Household, 1990 and<br />
Households<br />
Hybrid<br />
Import<br />
1995NPTS .......................................................... 11-8<br />
Average Annual Expenditures of Households by Income, 1998 .................... 1 l-3<br />
PNGV Goals and Specifications of Hybrid-Electric Vehicles ...................... 9-l 1<br />
Sales-Weighted Engine Size of New Domestic and Import Light Trucks by Size Class,<br />
Sales Periods 1976-99 ................................................. 7-l 0<br />
Sales-Weighted Curb Weight of New Domestic and Import Automobiles by Size Class,<br />
Sales Periods 1976-99 ................................................. 7- 11<br />
Sales-Weighted Interior Space of New Domestic and Import Automobiles by Size Class,<br />
Sales Periods 1976-99 ................................................. 7-12<br />
Engine Size, Curb Weight, and Interior Space of New Domestic and Import<br />
Automobiles, 1976-99 ................................................. 7-l 3<br />
<strong>TRANSPORTATION</strong> <strong>ENERGY</strong> <strong>DATA</strong> <strong>BOOK</strong>: EDIRON <strong>20</strong>-<strong>20</strong>00<br />
I-21
I-22<br />
Import (continued)<br />
Period Sales, Market Shares, and Sales-Weighted Fuel Economies of New Domestic and<br />
Import Automobiles, Selected Sales Periods 1976-99 .......................... 7-6<br />
Period Sales, Market Shares, and Sales-Weighted Fuel Economies of New Domestic and<br />
Import Light Trucl~s, Selected Sales Period 1976-99 .......................... 7-7<br />
Sales-Weighted Engine Size of New Domestic and Import Automobiles by Size Class,<br />
Imports<br />
Sales Periods 1976-99 .................................................. 7-9<br />
U.S. Petroleum Net Imports by World Region of Origin, 1960-98 ................... l-7<br />
U.S. Production and Imports of MTBE and Fuel Ethanol, 1978-99 ................. 2-12<br />
Incentives<br />
Income<br />
States With Ethanol Tax Incentives .......................................... 5-12<br />
Shares of Long-Distance Person Trips by Mode and Household Income, 1995 ....... 1 l-<strong>20</strong><br />
Average Annual Expenditures of Households by Income, 1998 .................... 1 l-3<br />
Indicators<br />
Indices<br />
Economic Indicators, 1970-99 .............................................. 5- 17<br />
Consumer Price Indices, 1970-99 ........................................... 5- 17<br />
Industries<br />
Input<br />
Employees of Motor Vehicle and Related Industries, 1990 and 1997 ................ 5-l 9<br />
Employment in Transportation and Related Industries, 1960-98 ................... 5-<strong>20</strong><br />
U.S. Refinery Input of Crude Oil and Petroleum Products, 1987-98 ................ l-10<br />
Intensities<br />
Energy Intensities of Passenger Modes, 1970-98 ............................... 2- 14<br />
Energy Intensities of Freight Modes, 1970-98 ................................. 2- 17<br />
Intensity<br />
Energy Intensity <strong>for</strong> Transit in the U.S., 1998 .................................. 2-15<br />
Intercity<br />
Interior<br />
Intercity Freight Movement and Energy Use in the United States, 1998 ............. 2- 16<br />
Sales-Weighted Interior Space of New Domestic and Import Automobiles by Size Class,<br />
Sales Periods 1976-99 ................................................. 7-12<br />
Engine Size, Curb Weight, and Interior Space of New Domestic and Import<br />
Automobiles, 1976-99 ................................................. 7- 13<br />
Intermodal<br />
Inter-modal Rail Traffic, 1965-98 ........................................... 12-10<br />
<strong>TRANSPORTATION</strong><strong>ENERGY</strong><strong>DATA</strong><strong>BOOK</strong>: <strong>EDITION</strong> <strong>20</strong>-<strong>20</strong>00
International<br />
Summary Statistics <strong>for</strong> U.S. Domestic and International Certificated Route Air Carriers,<br />
1970-98 ............................................................ 12-2<br />
Tonnage Statistics <strong>for</strong> Domestic and International Waterborne Commerce, 1970-98 ... 12-4<br />
International Man-Made Emissions of Greenhouse Gases, 1990-97 .................. 3-2<br />
International Man-Made Emissions of Carbon Dioxide, 1990-97 .................... 3-3<br />
International Man-Made Emissions of Carbon Dioxide by Source Category, 1990 and<br />
Inventory<br />
1997 ................................................................ 3-4<br />
Worldwide Federal Inventory, 1992-97 ....................................... 1 O-5<br />
January<br />
Fleet Vehicles in Service as of January 1,1999 ................................ 10-2<br />
State Tax Exemptions <strong>for</strong> Gasohol, January 1,<strong>20</strong>0O ............................. 5-l 1<br />
Journey<br />
Lead<br />
Length<br />
Light<br />
Journey-to-Work Statistics, 1983, 1990, and 1995 NPTS ........................ 11-14<br />
National and Metropolitan Area Comparisons of Journey-to-Work Statistics,<br />
1990Census ........................................................ 11-16<br />
National Lead Emission Estimates, 1970-98 ................................... 4-l 3<br />
Average Length of Time Fleet Vehicles are Kept Be<strong>for</strong>e Sold to Others, 1991 ........ 10-4<br />
Average Annual Vehicle-Miles, Vehicle Trips and Trip Length per Household ....... 11-6<br />
Average Annual Person-Miles Traveled (PMT), Person Trips and Trip Length per<br />
Household by Selected Trip Purposes ..................................... 1 l-7<br />
Energy Policy Act Purchase Requirements of Light Alternative Fuel Vehicles ........ 10-8<br />
Pollution from a Typical New Car and Light Truck, <strong>20</strong>00 Model Year .............. 4-32<br />
Federal Exhaust Emission Certification Standards <strong>for</strong> Gasoline- and Diesel-Powered<br />
LightVehicles ....................................................... 4-33<br />
Federal Exhaust Emission Certification Standards <strong>for</strong> Gasoline- and Diesel-Powered<br />
LightTrucks.. ....................................................... 4-34<br />
Federal Exhaust Emission Certification Standards <strong>for</strong> Gasoline- and Diesel-Powered<br />
Light Trucks.. ....................................................... 4-35<br />
Federal Exhaust Emission Certification Standards <strong>for</strong> Gasoline- and Diesel-Powered<br />
LightT~cks .......................................................... 4-36<br />
Federal Exhaust Emission Certification Standards <strong>for</strong> Gasoline- and Diesel-Powered<br />
LightTrucks.. ....................................................... 4-37<br />
<strong>TRANSPORTATION</strong> <strong>ENERGY</strong> <strong>DATA</strong> <strong>BOOK</strong>: EDUION <strong>20</strong>-<strong>20</strong>00<br />
I-23
I-24<br />
Light (continued)<br />
Man<br />
Federal Exhaust Emission Certification Standards <strong>for</strong> Gasoline- and Diesel-Powered<br />
LightHeavyTrucks ................................................... 4-38<br />
Cali<strong>for</strong>nia Passenger Cars and Light Trucks Emission Certification Standards ........ 4-40<br />
Cali<strong>for</strong>nia Vehicle Emission Reduction <strong>for</strong> Passenger Cars and Light Trucks ......... 4-41<br />
Light Truck Scrappage and Survival Rates .................................... 6-13<br />
Light Truck Survival Rates ................................................ 6-14<br />
Sales-Weighted Engine Size of New Domestic and Import Light Trucks by Size Class,<br />
Sales Periods .I 976-99 ................................................. 7-10<br />
Sales-Weighted Wheelbase of New Automobiles and Light Trucks, Sales Period<br />
1976-99 ............................................................ 7-14<br />
New Light Vehicle Dealerships and Sales, 1970-98 ............................. 7- 16<br />
Corporate Average Fuel Economy (CAFE) Standards versus Sales-Weighted Fuel<br />
Economy Estimates <strong>for</strong> Automobiles and Light Trucks, 1978-99 ............... 7- 18<br />
Light Vehicle Occupant Safety Data, 1975-98 ................................. 7-30<br />
Period Sales, Market Shares, and Sales-Weighted Fuel Economies of New Domestic and<br />
Import Light Trucks, Selected Sales Period 1976-99 .......................... 7-7<br />
Light Vehicle Market Shares by Size Class, Sales Period 1976-99 ................... 7-8<br />
Estimates of Light Alternative Fuel Vehicles, 1996, 1998, and <strong>20</strong>00 ................. 9-4<br />
International Man-Made Emissions of Greenhouse Gases, 1990-97 .................. 3-2<br />
International Man-Made Emissions of Carbon Dioxide, 1990-97 . . . . . . . . . . . . . . . . . . . . 3-3<br />
International Man-Made Emissions of Carbon Dioxide by Source Category,<br />
Manufacturer<br />
1990and1997 . . . . . . . . . . . . . . . . . . . . . . . . . . . . . . . . . . . . . . . . . . . . . . . . . . . . . . . . 3-4<br />
Alternative Fuel Vehicles Available by Manufacturer, Model Year <strong>20</strong>00 . . . . . . . . . . . . . 9-6<br />
Manufacturing<br />
Motor Vehicle Manufacturing Employment Statistics, 1972-98 . . . . . . . . . . . . . . . . . . . . 5-18<br />
Map<br />
Map of Clean Cities as of 12/l/99 . . . . . . . . . . . . . . . . . . . . . . . . . . . . . . . . . . . . . . . . . . . . 9-9<br />
Marine<br />
Market<br />
Breakdown of Domestic Marine Cargo by Commodity Class, 1998 . . . . . . . . . . . . . . . . 12-6<br />
Period Sales, Market Shares, and Sales-Weighted Fuel Economies of New Domestic and<br />
Import Automobiles, Selected Sales Periods 1976-99 . . . . . . . . . . . . . . . . . . . . . . . . . . 7-6<br />
Period Sales, Market Shares, and Sales-Weighted Fuel Economies of New Domestic and<br />
Import Light Trucks, Selected Sales Period 1976-99 . . . . . . . . . . . . . . . . . . . . . . . . . . 7-7<br />
Light Vehicle Market Shares by Size Class, Sales Period 1976-99 . . . . . . . . . . . . . . . . . . . 7-8<br />
<strong>TRANSPORTATION</strong> <strong>ENERGY</strong> <strong>DATA</strong> <strong>BOOK</strong>: <strong>EDITION</strong> <strong>20</strong>-<strong>20</strong>00
Material<br />
Matter<br />
Average Material Consumption <strong>for</strong> a Domestic Automobile, 1978, 1985, and 1999<br />
Emissions of Particulate Matter (PM-lo) from Highway Vehicles, 1970-98 . . . . . .<br />
Total National Emissions of Particulate Matter (PM-2.5), 1990-98 . . . . . . . . . . . . .<br />
Emissions of Particulate Matter (PM-2.5) from Highway Vehicles, 1990-98 . . . . . .<br />
/ Total National Emissions of Particulate Matter (PM-l 0), 1970-98 . . . . . . . . . . . . . .<br />
Meeting<br />
I Cali<strong>for</strong>nia Air Resources Board Requirements <strong>for</strong> Meeting Emission Standards . . .<br />
Metropolitan<br />
Middle<br />
Mile<br />
Miles<br />
National and Metropolitan Area Comparisons of Journey-to-Work Statistics,<br />
. . . 7-15<br />
. . . 4-10<br />
. . . 4-11<br />
. 4-12<br />
. . . . 4-9<br />
. . . 4-42<br />
1990Census ........................................................ 11-16<br />
Summary of 1996 Military Expenditures <strong>for</strong> Defending Oil Supplies from the<br />
.MiddleEast .......................................................... l-8<br />
Automobile Operating Cost per Mile, 1975-99 ................................. 5-15<br />
Average Annual and Daily Vehicle-Miles of Travel <strong>for</strong> Fleet Vehicles, 1991 ......... 1 O-4<br />
Average Miles per Federal Vehicle by Vehicle Type, 1997 ....................... 1 O-5<br />
Vehicle-Miles by Trip Purpose, 1995 NPTS .................................. 1 l-l 1<br />
Average Annual Miles per Vehicle by Household Vehicle Ownership, 1995 NPTS ... 11-12<br />
Average Annual Miles per Household Vehicle by Vehicle Age ................... 1 l-1 3<br />
Average Annual Vehicle-Miles, Vehicle Trips and Trip Length per Household ....... 1 l-6<br />
Average Annual Person-Miles Traveled (PMT), Person Trips and Trip Length per<br />
Household by Selected Trip Purposes ..................................... 1 l-7<br />
Class I Railroad Freight Systems in the United States Ranked by Revenue Ton-Miles,<br />
1998 ............................................................... 12-7<br />
Highway Vehicle Miles Traveled by Vehicle Type, 1970-98 ....................... 6-7<br />
Military<br />
Mode<br />
Summary of 1996 Military Expenditures <strong>for</strong> Defending Oil Supplies from the<br />
MiddleEast .......................................................... l-8<br />
Transportation of Petroleum and Petroleum Products in the U.S. by Mode, 1975-98 ... 1-15<br />
Long-Distance Trips by Mode and Purpose, 1995 .............................. 11-18<br />
Long-Distance Household Trips by Mode and Trip Distance, 1995 ................ 1 l- 19<br />
Shares of Long-Distance Person Trips by Mode and Household Income, 1995 ....... 1 l-<strong>20</strong><br />
Domestic Consumption of Transportation Energy by Mode and Fuel Type, 1998 ....... 2-6<br />
<strong>TRANSPORTATION</strong><strong>ENERGY</strong><strong>DATA</strong>BOOIC <strong>EDITION</strong>~O-<strong>20</strong>00<br />
I-25
I-26<br />
Mode (continued)<br />
Model<br />
Modes<br />
Transportation Energy Use by Mode, 1997-98 ............................<br />
Transportation Energy Consumption by Mode, 1970-98 ....................<br />
Pollution from a Typical New Car and Light Truck, <strong>20</strong>00 Model Year .........<br />
Alternative Fuel Vehicles Available by Manufacturer, Model Year <strong>20</strong>00 .......<br />
Energy Intensities of Passenger Modes, 1970-98 ..........................<br />
Energy Intensities of Freight Modes, 1970-98 ............................<br />
Monoxide<br />
Motor<br />
Total National Emissions of Carbon Monoxide, 1970-98 ....................<br />
Emissions of Carbon Monoxide from Highway Vehicles, 1970-98 ............<br />
Motor Gasoline Quantities by Type, 1981 and 1998 ........................<br />
Federal Excise Taxes on Motor Fuels ...................................<br />
Motor Vehicle Manufacturing Employment Statistics, 1972-98 ...............<br />
Employees of Motor Vehicle and Related Industries, 1990 and 1997 ...........<br />
Retail Prices <strong>for</strong> Motor Fuel, 1978-99 ...................................<br />
State Taxes on Motor Fuels, 1999 ......................................<br />
Movement<br />
MTBE<br />
Intercity Freight Movement and Energy Use in the United States, 1998 ........<br />
U.S. Production and Imports of MTBE and Fuel Ethanol; 1978-99 ............<br />
National<br />
Net<br />
National and Metropolitan Area Comparisons of Journey-to-Work Statistics,<br />
1990Census ....................................................<br />
Summary Statistics <strong>for</strong> the National Railroad Passenger Corporation (Amtrak),<br />
1971-98 .......................................................<br />
Total National Emissions of Particulate Matter (PM-2.5), 1990-98 ............<br />
National Lead Emission Estimates, 1970-98 ..............................<br />
Total National Emissions of the Criteria Air Pollutants by Sector, 1998 ........<br />
Total National Emissions of Carbon Monoxide, 1970-98 ....................<br />
Total National Emissions of Nitrogen Oxides, 1970-98 .....................<br />
Total National Emissions of Volatile Organic Compounds, 1970-98 ...........<br />
Total National Emissions of Particulate Matter (PM- lo), 1970-98 .............<br />
. . . . . 2-7<br />
. . . . . 2-8<br />
. . . . 4-32<br />
. . . 9-6<br />
. . . . 2-14<br />
. . . . 2-17<br />
. . . . . 4-3<br />
. . . . . 4-4<br />
. . . . 2-10<br />
. . . . 5-11<br />
. . . . 5-18<br />
. . . . 5-19<br />
. . . . 5-7<br />
. . . . . 5-9<br />
. . . . 2-16<br />
. . . . 2-12<br />
. . . 11-16<br />
. . . 12-11<br />
. . . . 4-11<br />
. . . . 4-13<br />
. . . . . 4-2<br />
. . . . . 4-3<br />
. . . . . 4-5<br />
. . . . . 4-7<br />
. . . . . 4-9<br />
U.S. Petroleum Net Imports by World Region of Origin, 1960-98 ............. . . . . . l-7<br />
<strong>TRANSPORTATION</strong><strong>ENERGY</strong><strong>DATA</strong>BOOIC: <strong>EDITION</strong>~O-<strong>20</strong>00
Nitrogen<br />
Total National Emissions of Nitrogen Oxides, 1970-98 . . . . . . . . . . . . . . . . . . . . . .<br />
Emissions of Nitrogen Oxides from Highway Vehicles, 1970-98 . . . . . . . . . . . . . .<br />
Nonoccupant<br />
NPTS<br />
Occupant Fatalities by Vehicle Type and Nonoccupant Fatalities, 1975-98 . . . . . . .<br />
Average Vehicle Occupancy by Trip Purpose, 1977,1983,1990, and 1995 NPTS .<br />
Vehicle-Miles by Trip Purpose, 1995 NPTS . . . . . . . . . . . . . . . . . . . . . . . . . . . . . . .<br />
Average Annual Miles per Vehicle by Household Vehicle Ownership, 1995 NPTS<br />
Average Age of Vehicles by Household Vehicle Ownership, 1995 NPTS . . . . . . . .<br />
Journey-to-Work Statistics, 1983, 1990, and 1995 NPTS . . . . . . . . . . . . . . . . . . . . .<br />
Demographic Statistics, 1969, 1977, 1983, 1990, and 1995 NPTS . . . . . . . . . . . . . .<br />
Average Number of Vehicles and Vehicle Travel per Household, 1990 and<br />
. . . . 4-5<br />
. . . 4-6<br />
. . . 7-29<br />
. . 1 l-10<br />
. . 11-11<br />
. . 11-12<br />
. . 11-12<br />
. . 11-14<br />
. . . 11-5<br />
1995NPTS . . . . . . . . . . . . . . . . . . . . . . . . . . . . . . . . . . . . . . . . . . . . . . . . . . . . . . . . . 1 l-8<br />
Average Vehicle Occupancy by Vehicle Type, 1995 NPTS ....................... 1 l-9<br />
Numerical<br />
Numerical Estimates of Global Warming Potentials Compared With Carbon Dioxide ... 3-8<br />
Occupancy<br />
Average Vehicle Occupancy by Trip Purpose, 1977,1983, 1990, and 1995 NPTS .... 1 l-10<br />
Average Vehicle Occupancy by Vehicle Type, 1995 NPTS ....................... 1 l-9<br />
Occupant<br />
Occupant Fatalities by Vehicle Type and Nonoccupant Fatalities, 1975-98 ........... 7-29<br />
Light Vehicle Occupant Safety Data, 1975-98 ................................. 7-30<br />
OECD<br />
Oil<br />
Petroleum Stocks in OECD Countries, End of Year 1973-98 ....................... 1-5<br />
U.S. Refinery Input of Crude Oil and Petroleum Products, 1987-98 ................ 1 - 10<br />
Refinery Yield of Petroleum Products from a Barrel of Crude Oil, 1978-98 .......... l-l 1<br />
World Crude Oil Production, 1960-98 ......................................... l-3<br />
World Oil Consumption, 1960-97 ............................................ l-4<br />
Crude Oil Prices, 1870-98 .................................................. l-6<br />
Summary of 1996 Military Expenditures <strong>for</strong> Defending Oil Supplies from the<br />
MiddleEast .......................................................... l-8<br />
Prices <strong>for</strong> a Barrel of Crude Oil and a Gallon of Gasoline, 1978-99 .................. 5-6<br />
Operating<br />
Automobile Operating Cost per Mile, 1975-99 ................................. 5-15<br />
Fixed Automobile Operating Costs per Year, 1975-99 ........................... 5-16<br />
<strong>TRANSPORTATION</strong> <strong>ENERGY</strong> <strong>DATA</strong> <strong>BOOK</strong>: <strong>EDITION</strong> <strong>20</strong>-<strong>20</strong>00<br />
I-27
I-28<br />
Operation<br />
Automobiles in Operation and Vehicle Travel by Age, 1970 and 1998 ...........<br />
Trucks in Operation and Vehicle Travel by Age, 1970 and 1998 ................<br />
Operations<br />
Summary Statistics <strong>for</strong> Rail Transit Operations, 1970-98 ......................<br />
Organic<br />
Total National Emissions of Volatile Organic Compounds, 1970-98 .............<br />
Origin<br />
Others<br />
output<br />
Emissions of Volatile Organic Compounds from Highway Vehicles, 1970-98 .....<br />
U.S. Petroleum Net Imports by World Region of Origin, 1960-98 ...............<br />
Average Length of Time Fleet Vehicles are Kept Be<strong>for</strong>e Sold to Others, 1991 .....<br />
Refinery Gross Output by World Region, 1999 .............................<br />
Ownership<br />
Average Annual Miles per Vehicle by Household Vehicle Ownership, 1995 NPTS .<br />
Oxides<br />
Average Age of Vehicles by Household Vehicle Ownership, 1995 NPTS .........<br />
Household Vehicle Ownership, 1960-90 Census ............................<br />
Total National Emissions of Nitrogen Oxides, 1970-98 ........................<br />
Emissions of Nitrogen Oxides from Highway Vehicles, 1970-98 ................<br />
Particulate<br />
Emissions of Particulate Matter (PM-lo) from Highway Vehicles, 1970-98 .......<br />
Total National Emissions of Particulate Matter (PM-2.5), 1990-98 ..............<br />
Emissions of Particulate Matter (PM-2.5) from Highway Vehicles, 1990-98 .......<br />
Total National Emissions of Particulate Matter (PM-IO), 1970-98 ...............<br />
Passenger<br />
Summary Statistics <strong>for</strong> the National Railroad Passenger Corporation (Amtrak),<br />
1971-98 .........................................................<br />
Passenger Travel and Energy Use in the United States, 1998 ...................<br />
Energy Intensities of Passenger Modes, 1970-98 ............................<br />
. . . 6-8<br />
. . . 6-9<br />
. 12-12<br />
. . . 4-7<br />
. . . 4-8<br />
. . . l-7<br />
. . 10-4<br />
. . . l-9<br />
. 11-12<br />
. 11-12<br />
. . 11-4<br />
. . . 4-5<br />
. . . 4-6<br />
. * 4-10<br />
. * 4-l 1<br />
. . 4-12<br />
. . . 4-9<br />
. 12-11<br />
. . 2-13<br />
. . 2-14<br />
Cali<strong>for</strong>nia Passenger Cars and Light Trucks Emission Certification Standards ........ 4-40<br />
Cali<strong>for</strong>nia Vehicle Emission Reduction <strong>for</strong> Passenger Cars and Light Trucks ......... 4-41<br />
Summary Statistics <strong>for</strong> Passenger Cars, 1970-98 ................................ 7-2<br />
Percentage<br />
Percentage of Trucks by Major Use and Primary Refueling Facility, 1997 ........... 8-10<br />
Percentage of Trucks by Size Class, 1977, 1982, 1987, 1992, and 1997 .............. 8-5<br />
<strong>TRANSPORTATION</strong> <strong>ENERGY</strong> <strong>DATA</strong> <strong>BOOK</strong>: <strong>EDITION</strong> <strong>20</strong>-<strong>20</strong>00
Percentage (continued)<br />
Periods<br />
Person<br />
Percentage of Trucks by Size Ranked by Major Use, 1997 . . . . . . . . . . . . . . . . . . . . . . . . . 8-8<br />
Percentage of Trucks by Fleet Size and Primary Refueling Facility, 1997 . . . . . . . . . . . . . 8-9<br />
Sales-Weighted Engine Size of New Domestic and Import Light Trucks by Size Class,<br />
Sales Periods 1976-99 . . . . . . . . . . . . . . . . . . . . . . . . . . . . . . . . . . . . . . . . . . . . . . . . . 7- 10<br />
Sales-Weighted Curb Weight of New Domestic and Import Automobiles by Size Class,<br />
Sales Periods 1976-99 . . . . . . . . . . . . . . . . . . . . . . . . . . . . . . . . . . . . . . . . . . . . . . . . . 7- 11<br />
Sales-Weighted Interior Space of New Domestic and Import Automobiles by Size Class,<br />
Sales Periods 1976-99 . . . . . . . . . . . . . . . . . . . . . . . . . . . . . . . . . . . . . . . . . . . . . . . . . 7-12<br />
Period Sales, Market Shares, and Sales-Weighted Fuel Economies of New Domestic and<br />
Import Automobiles, Selected Sales Periods 1976-99 . . . . . . . . . . . . . . . . . . . . . . . . . . 7-6<br />
Sales-Weighted Engine Size of New Domestic and Import Automobiles by Size Class,<br />
Sales Periods 1976-99 . . . . . . . . . . . . . . . . . . . . . . . . . . . . . . . . . . . . . . . , . . . . . . . . . 7-9<br />
Shares of Long-Distance Person Trips by Mode and Household Income, 1995 . . . . . . . 1 l-<strong>20</strong><br />
Average Annual Person-Miles Traveled (PMT), Person Trips and Trip Length per<br />
Petroleum<br />
PM<br />
PMT<br />
Household by Selected Trip Purposes . . . . . . . . . . . . . . . . . . . . . . . . . . . . . . . . . . . . . 11-7<br />
U.S. Refinery Input of Crude Oil and Petroleum Products, 1987-98 . . . . . . . . . . . . . . . . l-10<br />
Refinery Yield of Petroleum Products from a Barrel of Crude Oil, 1978-98 . . . . . . . . . . l-l 1<br />
United States Petroleum Production and Consumption, 1973-99 . . . . . . . . . . . . . . . . . . . 1- 12<br />
PNGV<br />
Policy<br />
Consumption by Petroleum by End-Use Sector, 1973-99 . . . . . . . . . . . . . . . . . . . . . . . . . l-14<br />
Transportation of Petroleum and Petroleum Products in the U.S. by Mode, 1975-98 . . . l-15<br />
Petroleum Stocks in OECD Countries, End of Year 1973-98 . . . . . . . . . . . . . . . . . . . . . . . l-5<br />
U.S. Petroleum Net Imports by World Region of Origin, 1960-98 . . . . . . . . . . . . . . . . . . . 1-7<br />
Emissions of Particulate Matter (PM-lo) from Highway Vehicles, 1970-98 . . . . . . . . . . 4-10<br />
Total National Emissions of Particulate Matter (PM-2.5), 1990-98 . . . . . . . . . . . . . . . . . 4-l 1<br />
Emissions of Particulate Matter (PM-2.5) from Highway Vehicles, 1990-98 . . . . . . . . . . 4-12<br />
Total National Emissions of Particulate Matter (PM-l 0), 1970-98 . . . . . . . . . . , . . . . . . . . 4-9<br />
Average Annual Person-Miles Traveled (PMT), Person Trips and Trip Length per<br />
Household by Selected Trip Purposes . . . . . . . . . . . . . . . . . . . . . . . . . . . . . . . . . . . . . 1 l-7<br />
PNGV Goals and Specifications of Hybrid-Electric Vehicles . . . . . . . . . , . . . . . . . . . . , . 9- 11<br />
Energy Policy Act Purchase Requirements of Light Alternative Fuel Vehicles . . . . . . . . 10-8<br />
<strong>TRANSPORTATION</strong> <strong>ENERGY</strong> <strong>DATA</strong> <strong>BOOK</strong>: <strong>EDITION</strong> <strong>20</strong>-<strong>20</strong>00<br />
I-29
I-30<br />
Pollutant<br />
NEAR-TERM Technology: Fuel-Cycle Energy and Criteria Pollutant Emission Changes<br />
Pollutants<br />
of Alternative Transportation Fuels and Advanced Vehicle Technologies . . . . . . . . . 4-17<br />
State-level Emissions <strong>for</strong> Criteria Pollutants, 1998 . . . . . . . . . . . . . . . . . . . . . . . . . . . . . . 4- 14<br />
Total National Emissions of the Criteria Air Pollutants by Sector, 1998 . . . . . . . . . . . . . . 4-2<br />
Pollution<br />
Pollution from a Typical New Car and Light Truck, <strong>20</strong>00 Model Year . . . . . . . . . . . . . . 4-32<br />
Population<br />
Population and Vehicle Profile, 1950-98 . . . . . . . . . . . . . . . . . . . . . . . . . . . . . . . . . . . . . . 1 l-2<br />
Potential<br />
World Fossil Fuel Potential . . . . . . . . . . . . . . . . . . . . . . . . . . . . . . . . . . . . . . . . . . . . . . . . . l-2<br />
Potentials<br />
Pounds<br />
Numerical Estimates of Global Warming Potentials Compared With Carbon Dioxide . . . 3-8<br />
New Retail Sales of Trucks 10,000 pounds GVW and Less in the United States,<br />
Powered<br />
Price<br />
1970-98 . . . . . . . . . . . . . . . . . . . . . . . . . . . . . . . . . . . . . . . . . . . . . . . . . . . . . . . . . . . . . 7-5<br />
Federal Exhaust Emission Certification Standards <strong>for</strong> Gasoline- and Diesel-Powered<br />
LightVehicles . . . . . . . . . . . . . . . . . . . . . . . . . . . . . . . . . . . . . . . . . . . . . . . . . . . . . . . 4-33<br />
Federal Exhaust Emission Certification Standards <strong>for</strong> Gasoline- and Diesel-Powered<br />
LightTrucks . . . . . . . . . . . . . . . . . . . . . . . . . . . . . . . . . . . . . . . . . . . . . . . . . . . . . . . . . 4-34<br />
Federal Exhaust Emission Certification Standards <strong>for</strong> Gasoline- and Diesel-Powered<br />
LightT~cks......................................................... 4-35<br />
Federal Exhaust Emission Certification Standards <strong>for</strong> Gasoline- and Diesel-Powered<br />
Light Trucks . . . . . . . . . . . . . . . . . . . . . . . . . . . . . . . . . . . . . . . . . . . . . . . . . . . . . . . . . 4-36<br />
Federal Exhaust Emission Certification Standards <strong>for</strong> Gasoline- and Diesel-Powered<br />
LightTmcks......................................................... 4-37<br />
Federal Exhaust Emission Certification Standards <strong>for</strong> Gasoline- and Diesel-Powered<br />
Light Heavy Trucks . . . . . . . . . . . . . . . . . . . . . . . . . . . . . . . . . . . . . . . . . . . . . . . . . . . 4-38<br />
Federal Exhaust Emission Certification Standards <strong>for</strong> Gasoline- and Diesel-Powered<br />
HeavyHeavyTrucks . . . . . . . . . . . . . . . . . . . . . . . . . . . . . . . . . . . . . . . . . . . . . . . . . . 4-39<br />
Average Price of a New Car, 1970-99 . . . . . . . . . . . . . . . . . . . . . . . . . . . . . . . . . . . . . . . . 5-13<br />
Average Price of a New Car by Sector, 1970-99 . . . . . . . . . . . . . . . . . . . . . . . . . . . . . . . . 5-14<br />
Consumer Price Indices, 1970-99 . . . . . . . . . . . . . . . . . . . . . . . . . . . . . . . . . . . . . . . . . . . 5- 17<br />
<strong>TRANSPORTATION</strong> <strong>ENERGY</strong> <strong>DATA</strong> <strong>BOOK</strong>: <strong>EDITION</strong> <strong>20</strong>-<strong>20</strong>00
Prices<br />
CrudeOilPrices,1870-98 . . . . . . . . . . . . . . . . . . . . . . . . . . . . . . . . . . . . . . . . . . . . .<br />
Gasoline Prices <strong>for</strong> Selected Countries, 1978-99 . . . . . . . . . . . . . . . . . . . . . . . . . . . .<br />
Gasoline Prices <strong>for</strong> Selected Countries, 1990 and 1998 . . . . . . . . . . . . . . . . . . . . . .<br />
Diesel Fuel Prices <strong>for</strong> Selected Countries, 1978-99 . . . . . . . . . . . . . . . . . . . . . . . . ,<br />
Diesel Fuel Prices <strong>for</strong> Selected Countries, 1990 and 1998 . . . . . . . . . . . . . . . . . . . .<br />
Prices <strong>for</strong> a Barrel of Crude Oil and a Gallon of Gasoline, 1978-99 . . . . . . . . . . . . .<br />
Retail Prices <strong>for</strong> Motor Fuel, 1978-99 . . . . . . . . . . . . . . . . . . . . . . . . . . . . . . . . . . . .<br />
Prices <strong>for</strong> Selected Transportation Fuels, 1978-99 . . . . . . . . . . . . . . . . . . . . . . . . . .<br />
Primary<br />
World Production of Primary Energy by Selected Country Groups, 1989-98 . . . . .<br />
World Consumption of Primary Energy by Selected Country Groups, 1989-98 . . .<br />
Percentage of Trucks by Major Use and Primary Refueling Facility, 1997 . . . . . . .<br />
Percentage of Trucks by Fleet Size and Primary Refueling Facility, 1997 . . . . . . . .<br />
Products<br />
Profile<br />
U.S. Refinery Input of Crude Oil and Petroleum Products, 1987-98 . . . . . . . . . . . .<br />
Refinery Yield of Petroleum Products from a Barrel of Crude Oil, 1978-98 . . . . . .<br />
Transportation of Petroleum and Petroleum Products in the U.S. by Mode, 1975-98<br />
. . . . l-6<br />
. . . . 5-2<br />
. . . . 5-3<br />
. . . 5-4<br />
. . . 5-5<br />
. . . . 5-6<br />
. . . 5-7<br />
. . . . 5-8<br />
. . . . 2-2<br />
. . . . 2-3<br />
. . . 8-10<br />
. . . . 8-9<br />
. . . l-10<br />
. . . l-11<br />
. . . 1-15<br />
Population and Vehicle Profile, 1950-98 . . . . . . . . . . . . . . . . . . . . . . . . . . . . . . . . . . . . . . 1 l-2<br />
Purchase<br />
Energy Policy Act Purchase Requirements of Light Alternative Fuel Vehicles . . . . . . . 10-8<br />
Purpose<br />
Average Vehicle Occupancy by Trip Purpose, 1977,1983, 1990, and 1995 NPTS . . , : 1 l-10<br />
Vehicle-Miles by Trip Purpose, 1995 NPTS . . . . . . . . . . . . . . . . . . . . . . . . . . . . . . . . . . 1 l-l 1<br />
Long-Distance Trips by Mode and Purpose, 1995 . . . . . . . . . . . . . . . . . . . . . . . . . . . . . 11-18<br />
Purposes<br />
Rail<br />
Average Annual Person-Miles Traveled (PMT), Person Trips and Trip Length per<br />
Household by Selected Trip Purposes . . . . . . . . . . . . . . . . . . . . . . . . . . . . . . . . . . . . . 1 l-7<br />
Intermodal Rail Traffic, 1965-98 . . . . . . . . . . . . . . . . . . . . . . . . . . . . . . . . . . . . . . . . . . . 12-l 0<br />
Summary Statistics <strong>for</strong> Rail Transit Operations, 1970-98 . . . . . . . . . . . . . . . . . . . . . . . . 12-12<br />
Railroad<br />
Summary Statistics <strong>for</strong> the National Railroad Passenger Corporation (Amtrak),<br />
1971-98 . . . . . . . . . . . . . . . . . . . . . . . . . . . . . . . . . . . . . . . . . . . . . . . . . . . . . . . . . . . 12-11<br />
Class I Railroad Freight Systems in the United States Ranked by Revenue Ton-Miles,<br />
1998 . . . . . . . . . . . . . . . . . . . . . . . . . . . . . . . . . . . . . . . . . . . . . . . . . . . . . . . . . . . . . . . 12-7<br />
Railroad Revenue Carloads by Commodity Group, 1974 and 1998 . . . . . . . . . . . . . . . . , 12-9<br />
<strong>TRANSPORTATION</strong> <strong>ENERGY</strong> <strong>DATA</strong> <strong>BOOK</strong>: <strong>EDITION</strong> <strong>20</strong>-<strong>20</strong>00<br />
I-3 1
I-32<br />
Railroads<br />
Ranked<br />
Rates<br />
Summary Statistics <strong>for</strong> Class I Freight Railroads, 1970-98 . . . . . . . . . . . . . . . . . . . . . .<br />
Class I Railroad Freight Systems in the United States Ranked by Revenue Ton-Miles,<br />
1998 . . . . . . . . . . . . . . . . . . . . . . . . . . . . . . . . . . . . . . . . . . . . . . . . . . . . . . . . . . . . .<br />
Percentage of Trucks by Size Ranked by Major Use, 1997 . . . . . . . . . . . . . . . . . . . . . .<br />
Automobile Scrappage and Survival Rates . . . . . . . . . . . . . . . . . . . . . . . . . . . . . . . . . .<br />
Automobile Survival Rates . . . . . . . . . . . . . . . . . . . . . . . . . . . . . . . . . . . . . . . . . . . . . .<br />
Light Truck Scrappage and Survival Rates . . . . . . . . . . . . . . . . . . . . . . . . . . . . . . . . . .<br />
Light Truck Survival Rates . . . . . . . . . . . . . . . . . . . . . . . . . . . . . . . . . . . . . . . . , . . . . .<br />
Receipts<br />
Tax Receipts from the Sale of Gas Guzzlers, 1980-98 . . . . . . . . . . . . . , . . . . . . . . . . .<br />
Reduction<br />
. 12-8<br />
. 12-7<br />
. . 8-8<br />
. 6-11<br />
. 6-12<br />
. 6-13<br />
. 6-14<br />
. 7-19<br />
Cali<strong>for</strong>nia Vehicle Emission Reduction <strong>for</strong> Passenger Cars and Light Trucks . . . . . . . . . 4-41<br />
Refinery<br />
Refuel<br />
U.S. Refinery Input of Crude Oil and Petroleum Products, 1987-98 ................ l-10<br />
Refinery Yield of Petroleum Products from a Barrel of Crude Oil, 1978-98 .......... l-l 1<br />
Refinery Gross Output by World Region, 1999 ................................. 1-9<br />
Number of Alternative Refuel Sites by State and Fuel Type, 1999 ................... 9-7<br />
Refueling<br />
Region<br />
Conventional and Alternative Fuel Refueling Stations ........................... 7- 17<br />
Percentage of Trucks by Major Use and Primary Refueling Facility, 1997 ........... 8-10<br />
Percentage of Trucks by Fleet Size and Primary Refueling Facility, 1997 ............. 8-9<br />
U.S. Petroleum Net Imports by World Region of Origin, 1960-98 ................... l-7<br />
Refinery Gross Output by World Region, 1999 ................................. l-9<br />
Registrations<br />
Automobile Registrations <strong>for</strong> Selected Countries, 1950-96 ........................ 6-2<br />
Truck and Bus Registrations <strong>for</strong> Selected Countries, 1950-96 ...................... 6-3<br />
Representative<br />
Representative Number Five Driving Cycle ................................... 7-27<br />
Resources<br />
Retail<br />
Cali<strong>for</strong>nia Air Resources Board Requirements <strong>for</strong> Meeting Emission Standards ....... 4-42<br />
Retail Prices <strong>for</strong> Motor Fuel, 1978-99 ......................................... 5-7<br />
New Retail Automobile Sales in the United States, 1970-98 ....................... 7-4<br />
<strong>TRANSPORTATION</strong> <strong>ENERGY</strong> <strong>DATA</strong> <strong>BOOK</strong>: <strong>EDITION</strong> <strong>20</strong>-<strong>20</strong>00
Retail (continued)<br />
New Retail Sales of Trucks 10,000 pounds GVW and Less in the United States,<br />
1970-98 . . . . . . . . . . . . . . . . . . . . . . . . . . . . . . . . . . . . . . . . . . . . . . . . . . . . . . . . . . . . . 7-5<br />
New Retail Truck Sales by Gross Vehicle Weight, 1970-98 . . . . . . . . . . . . . . . . . . . . . . . . 8-3<br />
Revenue<br />
Class I Railroad Freight Systems in the United States Ranked by Revenue Ton-Miles,<br />
1998 . . . . . . . . . . . . . . . . . . . . . . . . . . . . . . . . . . . . . . . . . . . . . . . . . . . . . . . . . . . . . . . 12-7<br />
Railroad Revenue Carloads by Commodity Group, 1974 and 1998 . . . . . . , . . . . . . . . . . 12-9<br />
Rollover<br />
Route<br />
Safety<br />
Sale<br />
Sales<br />
Percent Rollover Occurrence by Vehicle Type and Crash Severity . . . . . . . . . . . . . . . . . 7-32<br />
Summary Statistics <strong>for</strong> U.S. Domestic and International Certificated Route Air Carriers,<br />
1970-98 . . . . . . . . . . . . . . . . . . . . . . . . . . . . . . . . . . . . . . . . . . . . . . . . . . . . . . . . . . . . 12-2<br />
Light Vehicle Occupant Safety Data, 1975-98 . . . . . . . . . . . . . . . . . . . . . . . . . . . . . . . . . 7-30<br />
Tax Receipts from the Sale of Gas Guzzlers, 1980-98 . . . . . . . . . . . . . . . . . . . . . . . . . . . 7-19<br />
Vehicle Stock and New Sales in United States, 1998 Calendar Year ................. 6-6<br />
Sales-Weighted Engine Size of New Domestic and Import Light Trucl~s by Size Class,<br />
Sales Periods 1976-99 ................................................. 7-l 0<br />
Sales-Weighted Curb Weight of New Domestic and Import Automobiles by Size Class,<br />
Sales Periods 1976-99 ................................................. 7-l 1<br />
Sales-Weighted Interior Space of New Domestic and Import Automobiles by Size Class,<br />
Sales Periods 1976-99 ................................................. 7-12<br />
Sales-Weighted Wheelbase of New Automobiles and Light Trucks, Sales Period<br />
1976-99 ............................................................ 7-14<br />
New Light Vehicle Dealerships and Sales, 1970-98 ............................. 7-16<br />
Corporate Average Fuel Economy (CAFE) Standards versus Sales-Weighted Fuel<br />
Economy Estimates <strong>for</strong> Automobiles and Light Trucks, 1978-99 ............... 7-l 8<br />
New Retail Automobile Sales in the United States, 1970-98 ....................... ,7-4<br />
New Retail Sales of Trucks 10,000 pounds GVW and Less in the United States,<br />
1970-98 ............................................................. 7-5<br />
Period Sales, Market Shares, and Sales-Weighted Fuel Economies of New Domestic and<br />
Import Automobiles, Selected Sales Periods 1976-99 .......................... 7-6<br />
Period Sales, Market Shares, and Sales-Weighted Fuel Economies of New Domestic and<br />
Import Light Trucks, Selected Sales Period 1976-99 .......................... 7-7<br />
Light Vehicle Market Shares by Size Class, Sales Period 1976-99 ................... 7-8<br />
<strong>TRANSPORTATION</strong> <strong>ENERGY</strong> <strong>DATA</strong> <strong>BOOK</strong>: <strong>EDITION</strong> <strong>20</strong>-<strong>20</strong>00<br />
I-33
I-34<br />
Sales (continued)<br />
Sales-Weighted Engine Size of New Domestic and Import Automobiles by Size Class,<br />
Sales Periods 1976-99 .................................................. 7-9<br />
New Retail Truck Sales by Gross Vehicle Weight, 1970-98 ........................ 8-3<br />
Scrappage<br />
Automobile Scrappage and Survival Rates .................................... 6-l 1<br />
. Light Truck Scrappage and Survival Rates .................................... 6- 13<br />
Sector<br />
Consumption by Petroleum by End-Use Sector, 1973-99 ......................... 1 - 14<br />
U. S. Consumption of Total Energy by End-Use Sector, 1970-99 ................... 2-4<br />
U.S. Carbon Dioxide Emissions from Fossil Energy Consumption by End-Use Sector,<br />
1984-98 ............................................................. 3-6<br />
U.S. Carbon Dioxide Emissions from Energy Use in the Transportation Sector,<br />
1980-98 ............................................................. 3-7<br />
Total National Emissions of the Criteria Air Pollutants by Sector, 1998 .............. 4-2<br />
Average Price of a New Car by Sector, 1970-99 ................................ 5-14<br />
Selected<br />
Average Annual Person-Miles Traveled (PMT), Person Trips and Trip Length per<br />
Household by Selected Trip Purposes ..................................... 1 l-7<br />
World Production of Primary Energy by Selected Country Groups, 1989-98 .......... 2-2<br />
World Consumption of Primary Energy by Selected Country Groups, 1989-98 ........ 2-3<br />
Gasoline Prices <strong>for</strong> Selected Countries, 1978-99 ................................. 5-2<br />
Gasoline Prices <strong>for</strong> Selected Countries, 1990 and 1998 ........................... 5-3<br />
Diesel Fuel Prices <strong>for</strong> Selected Countries, 1978-99 .............................. 5-4<br />
Diesel Fuel Prices <strong>for</strong> Selected Countries, 1990 and 1998 ......................... 5-5<br />
Prices <strong>for</strong> Selected Transportation Fuels, 1978-99 ............................... 5-8<br />
Automobile Registrations <strong>for</strong> Selected Countries, 1950-96 ........................ 6-2<br />
Truck and Bus Registrations <strong>for</strong> Selected Countries, 1950-96 ...................... 6-3<br />
Period Sales, Market Shares, and Sales-Weighted Fuel Economies of New Domestic and<br />
Import Automobiles, Selected Sales Periods 1976-99 .......................... 7-6<br />
Period Sales, Market Shares, and Sales-Weighted Fuel Economies of New Domestic and<br />
Service<br />
Import Light Trucks, Selected Sales Period 1976-99 .......................... 7-7<br />
Fleet Vehicles in Service as of January 1, 1999 ................................ 10-2<br />
Severity<br />
Crashes by Crash Severity, Crash Type, and Vehicle Type, 1998 .................. 7-3 1<br />
Percent Rollover Occurrence by Vehicle Type and Crash Severity ................. 7-32<br />
<strong>TRANSPORTATION</strong> <strong>ENERGY</strong> <strong>DATA</strong> <strong>BOOK</strong>: <strong>EDITION</strong> <strong>20</strong>-<strong>20</strong>00
Shares<br />
Shares of Long-Distance Person Trips by Mode and Household Income, 1995 ....... 1 l-<strong>20</strong><br />
Single<br />
Sites<br />
Sold<br />
Source<br />
Space<br />
Period Sales, Market Shares, and Sales-Weighted Fuel Economies of New Domestic and<br />
Import Automobiles, Selected Sales Periods 1976-99 .......................... 7-6<br />
Period Sales, Market Shares, and Sales-Weighted Fuel Economies of New Domestic and<br />
Import Light Trucks, Selected Sales Period 1976-99 .......................... 7-7<br />
Light Vehicle Market Shares by Size Class, Sales Period 1976;99 ................... 7-8<br />
Summary Statistics <strong>for</strong> Other Single-Unit and Combination Trucks, 1970-98 .......... 8-2<br />
Number of Alternative Refuel Sites by State and Fuel Type, 1999 ................... 9-7<br />
Average Length of Time Fleet Vehicles are Kept Be<strong>for</strong>e Sold to Others, 1991 ........ 1 O-4<br />
Distribution of Energy Consumptionby Source, 1973, 1980, and 1999 ............... 2-5<br />
International Man-Made Emissions of Carbon Dioxide by Source Category, 1990<br />
and1997 ............................................................. 3-4<br />
Sales-Weighted Interior Space of New Domestic and Import Automobiles by Size Class,<br />
Sales Periods 1976-99 ................................................. 7-12<br />
Engine Size, Curb Weight, and Interior Space of New Domestic and Import<br />
Specifications<br />
Speed<br />
Automobiles, 1976-99 ................................................. 7- 13<br />
Vehicle Specifications <strong>for</strong> Tested Vehicles .................................... 7-22<br />
PNGV Goals and Specifications of Hybrid-Electric Vehicles ...................... 9- 11<br />
Fuel Economy by Speed, 1973,1984 and 1997. ................................ 7-23<br />
Fuel Economy by Speed, 1973,1984 and 1997 ................................. 7-24<br />
Steady Speed Fuel Economy <strong>for</strong> Tested Vehicles ............................... 7-25<br />
Standards<br />
Tier 2 Federal Emission Standards .......................................... 4-32<br />
Federal Exhaust Emission Certification Standards <strong>for</strong> Gasoline- and Diesel-Powered<br />
LightVehicles ....................................................... 4-33<br />
Federal Exhaust Emission Certification Standards <strong>for</strong> Gasoline- and Diesel-Powered<br />
LightTrucks.. ....................................................... 4-34<br />
Federal Exhaust Emission Certification Standards <strong>for</strong> Gasoline- and Diesel-Powered<br />
LightTrucks ......................................................... 4-35<br />
<strong>TRANSPORTATION</strong> <strong>ENERGY</strong> <strong>DATA</strong> <strong>BOOK</strong>: <strong>EDITION</strong> <strong>20</strong>-<strong>20</strong>00<br />
I-35
I-36<br />
Standards (continued)<br />
Federal Exhaust Emission Certification Standards <strong>for</strong> Gasoline- and Diesel-Powered<br />
LightTrucks.. ....................................................... 4-36<br />
Federal Exhaust Emission Certification Standards <strong>for</strong> Gasoline- and Diesel-Powered<br />
Light Trucks.. ....................................................... 4-37<br />
Federal Exhaust Emission Certification Standards <strong>for</strong> Gasoline- and Diesel-Powered Light<br />
Heavy Trucks ........................................................ 4-38<br />
Federal Exhaust Emission Certification Standards <strong>for</strong> Gasoline- and Diesel-Powered<br />
HeavyHeavyTrucks .................................................. 4-39<br />
Cali<strong>for</strong>nia Passenger Cars and Light Trucks Emission Certification Standards ........ 4-40<br />
Cali<strong>for</strong>nia Air Resources Board Requirements <strong>for</strong> Meeting Emission Standards ....... 4-42<br />
Corporate Average Fuel Economy (CAFE) Standards versus Sales-Weighted Fuel<br />
Economy Estimates <strong>for</strong> Automobiles and Light Trucks, 1978-99 ............... 7-l 8<br />
Stations<br />
Conventional and Alternative Fuel Refueling Stations ........................... 7- 17<br />
Statistics<br />
Journey-to-Work Statistics, 1983, 1990, and 1995 NPTS ........................ 11-14<br />
National and Metropolitan Area Comparisons of Journey-to-Work Statistics,<br />
1990Census ........................................................ 11-16<br />
Demographic Statistics, 1969, 1977, 1983, 1990, and 1995 NPTS .................. 1 l-5<br />
Summary Statistics <strong>for</strong> the National Railroad Passenger Corporation (Amtrak),<br />
1971-98 ........................................................... 12-11<br />
Summary Statistics <strong>for</strong> Rail Transit Operations, 1970-98 ........................ 12-12<br />
Summary Statistics <strong>for</strong> U.S. Domestic and International Certificated Route Air Carriers,<br />
1970-98 ............................................................. 12-2<br />
Summary Statistics <strong>for</strong> General Aviation, 1970-98 .............................. 12-3<br />
Tonnage Statistics <strong>for</strong> Domestic and International Waterborne Commerce, 1970-98 ... 12-4<br />
Summary Statistics <strong>for</strong> Domestic Waterborne Commerce, 1970-98 ................. 12-5<br />
Summary Statistics <strong>for</strong> Class I Freight Railroads, 1970-98 ........................ 12-8<br />
Motor Vehicle Manufacturing Employment Statistics, 1972-98 .................... 5- 18<br />
Summary Statistics <strong>for</strong> Passenger Cars, 1970-98 ................................ 7-2<br />
Summary Statistics <strong>for</strong> Two-Axle, Four-Tire Trucks, 1970-98 ...................... 7-3<br />
Summary Statistics on Buses by Type, 1970-98 ................................ 8-14<br />
Summary Statistics <strong>for</strong> Other Single-Unit and Combination Trucks, 1970-98 .......... 8-2<br />
Truck Statistics by Gross Vehicle Weight Class, 1997 ............................ 8-5<br />
Truck Statistics by Size, 1997 ............................................... 8-7<br />
Steady<br />
Steady Speed Fuel Economy <strong>for</strong> Tested Vehicles ............................... 7-25<br />
<strong>TRANSPORTATION</strong><strong>ENERGY</strong> <strong>DATA</strong><strong>BOOK</strong>: <strong>EDITION</strong>~O-<strong>20</strong>00
s toc1<<br />
s toc1
1-38<br />
Tax (continued)<br />
Tax Receipts from the Sale of Gas Guzzlers, 1980-98 . . . . . . . . . . . . . . . . . . . . , . . . . . . 7-19<br />
The Gas Guzzler Tax on New Cars . . . . . . . . . . . . . . . . . . . . . . . . . . . . . . . . . . . . . . . . . . 7-<strong>20</strong><br />
Taxes<br />
Federal Excise Taxes on Motor Fuels . . . . . . . . . . . . . . . . . . . . . . . . . . . . . . . . . . . . . . . . 5-l 1<br />
State Taxes on Motor Fuels, 1999 . . . . . . . . . . . . . . . . . . . . . . . . . . . . . . . . . . . . . . . . . . . . 5-9<br />
Technologies<br />
NEAR-TERM Technology: Fuel-Cycle Energy and Greenhouse Gas Emission Changes<br />
of Alternative Transportation Fuels and Advanced Vehicle Technologies . . . . . . . . . 3-11<br />
LONG-TERM Technology: Fuel-Cycle Energy and Greenhouse Gas Emission Changes<br />
of Alternative Transportation Fuels and Advanced Vehicle Technologies . . . . . . . . . 3-12<br />
NEAR-TERM Technology: Fuel-Cycle Energy and Criteria Pollutant Emission Changes<br />
of Alternative Transportation Fuels and Advanced Vehicle Technologies . . . . . . . . . 4-17<br />
LONG-TERM Technology: Fuel-Cycle Energy and Greenhouse Gas Emission Changes<br />
Technology<br />
TERM<br />
of Alternative Transportation Fuels and Advanced Vehicle Technologies . . . . . . . . . 4-19<br />
NEAR-TERM Technology: Fuel-Cycle Energy and Greenhouse Gas Emission Changes<br />
of Alternative Transportation Fuels and Advanced Vehicle Technologies . . . . . . . . . 3-l 1<br />
LONG-TERM Technology: Fuel-Cycle Energy and Greenhouse Gas Emission Changes<br />
of Alternative Transportation Fuels and Advanced Vehicle Technologies . . . . . . . . . 3-12<br />
NEAR-TERM Technology: Fuel-Cycle Energy and Criteria Pollutant Emission Changes<br />
of Alternative Transpertation Fuels and Advanced Vehicle Technologies . . . . . . . . . 4-l 7<br />
LONG-TERM Technology: Fuel-Cycle Energy and Greenhouse Gas Emission Changes<br />
of Alternative Transportation Fuels and Advanced Vehicle Technologies . . . . . . . . . 4-19<br />
NEAR-TERM Technology: Fuel-Cycle Energy and Greenhouse Gas Emission Changes<br />
of Alternative Transportation Fuels and Advanced Vehicle Technologies . . . . . . . . . 3-l 1<br />
LONG-TERM Technology: Fuel-Cycle Energy and Greenhouse Gas Emission Changes<br />
of Alternative Transportation Fuels and Advanced Vehicle Technologies . . . . . . . . . 3-12<br />
NEAR-TERM Technology: Fuel-Cycle Energy and Criteria Pollutant Emission Changes<br />
of Alternative Transportation Fuels and Advanced Vehicle Technologies . . . . . . . . 4-17<br />
LONG-TERM Technology: Fuel-Cycle Energy and Greenhouse Gas Emission Changes<br />
of Alternative Transportation Fuels and Advanced Vehicle Technologies . . . . . . . . 4-l 9<br />
Tested<br />
Vehicle Specifications <strong>for</strong> Tested Vehicles . . . . . . . . . . . . . . . . . . . . . . . . . . . . . . . . . . . . 7-22<br />
Tier<br />
Steady Speed Fuel Economy <strong>for</strong> Tested Vehicles . . . . . . . . . . . . . . . . . . . . . . . . . . . . . . . 7-25<br />
Tier 2 Federal Emission Standards . . . . . . . . . . . . . . . . . . . . . . . . . . . . . . . . . . . . . . . . . . 4-32<br />
<strong>TRANSPORTATION</strong> <strong>ENERGY</strong> <strong>DATA</strong> <strong>BOOK</strong>: <strong>EDITION</strong> <strong>20</strong>-<strong>20</strong>00
Time<br />
Tire<br />
Ton<br />
Average Length of Time Fleet Vehicles are Kept Be<strong>for</strong>e Sold to Others, 1991 . . . . . .<br />
Summary Statistics <strong>for</strong> Two-Axle, Four-Tire Trucks, 1970-98 . . . . . . . . . . . . . . . . . . .<br />
Class I Railroad Freight Systems in the United States Ranked by Revenue Ton-Miles,<br />
Tonnage<br />
1998 . . . . . . . . . . . . . . . . . . . . . . . . . . . . . . . . . . . . . . . . . . . . . . . . . . . . . . . . . . . . .<br />
Tonnage Statistics <strong>for</strong> Domestic and International Waterborne Commerce, 1970-98 .<br />
. 10-4<br />
. . 7-3<br />
. 12-7<br />
. 12-4<br />
Top<br />
Top Ten States with Fleets of Ten Vehicles or More, 1999 . . . . . . . . . . . . . . . . . . . . . . . 10-3<br />
Traffic<br />
Transit<br />
Intermodal Rail Traffic, 1965-98 ........................................... 12- 10<br />
Summary Statistics <strong>for</strong> Rail Transit Operations, 1970-98 ........................ 12- 12<br />
Energy Intensity <strong>for</strong> Transit in the U.S., 1998 .................................. 2-15<br />
Transportation<br />
Transportation of Petroleum and Petroleum Products in the U.S. by Mode, 1975-98 ... 1-l 5<br />
Travel<br />
Means of Transportation to Work, 1980 and 1990 Census ....................... 1 1 - 15<br />
Domestic Consumption of Transportation Energy by Mode and Fuel Type, 1998 ....... 2-6<br />
Transportation Energy Use by Mode, 1997-98 .................................. 2-7<br />
Transportation Energy Consumption by Mode, 1970-98 .......................... 2-8<br />
NEAR-TERM Technology: Fuel-Cycle Energy and Greenhouse Gas Emission Changes<br />
of Alternative Transportation Fuels and Advanced Vehicle Technologies ......... 3-l 1<br />
LONG-TERM Technology: Fuel-Cycle Energy and Greenhouse Gas Emission Changes<br />
of Alternative Transportation Fuels and Advanced Vehicle Technologies ......... 3-12<br />
U.S. Carbon Dioxide Emissions from Energy Use in the Transportation Sector,<br />
1980-98 ............................................................. 3-7<br />
NEAR-TERM Technology: Fuel-Cycle Energy and Criteria Pollutant Emission Changes<br />
of Alternative Transportation Fuels and Advanced Vehicle Technologies ......... 4-17<br />
LONG-TERM Technology: Fuel-Cycle Energy and Greenhouse Gas Emission Changes<br />
of Alternative Transportation Fuels and Advanced Vehicle Technologies ......... 4-19<br />
Employment in Transportation and Related Industries, 1960-98 ................... 5-<strong>20</strong><br />
Prices <strong>for</strong> Selected Transportation Fuels, 1978-99 ............................... 5-8<br />
Average Annual and Daily Vehicle-Miles of Travel <strong>for</strong> Fleet Vehicles, 1991 ......... 1 O-4<br />
Average Number of Vehicles and Vehicle Travel per Household, 1990 and<br />
1995NPTS .......................................................... 11-8<br />
<strong>TRANSPORTATION</strong> <strong>ENERGY</strong> <strong>DATA</strong> <strong>BOOK</strong>: <strong>EDITION</strong> <strong>20</strong>-<strong>20</strong>00<br />
I-39
I-40<br />
Travel (continued)<br />
Passenger Travel and Energy Use in the United States, 1998 ...................... 2-l 3<br />
Automobiles in Operation and Vehicle Travel by Age, 1970 and 1998 ............... 6-8<br />
Trucks in Operation and Vehicle Travel by Age, 1970 and 1998 .................... 6-9<br />
Traveled<br />
Trip<br />
Trips<br />
Truck<br />
Average Annual Person-Miles Traveled (PMT), Person Trips and Trip Length per<br />
Household by Selected Trip Purposes ..................................... 1 l-7<br />
Highway Vehicle Miles Traveled by Vehicle Type, 1970-98 ....................... 6-7<br />
Average Vehicle Occupancy by Trip Purpose, 1977,1983,1990, and 1995 NPTS .... 1 l-10<br />
Vehicle-Miles by Trip Purpose, 1995 NPTS .................................. 1 l-l 1<br />
Long-Distance Household Trips by Mode and Trip Distance, 1995 ................ 1 l-l 9<br />
Average Annual Vehicle-Miles, Vehicle Trips and Trip Length per Household ....... 1 l-6<br />
Average Annual Person-Miles Traveled (PMT), Person Trips and Trip Length per<br />
Household by Selected Trip Purposes ..................................... 1 l-7<br />
Long-Distance Trips by Destination, 1995 ................................... 1 l-l 7<br />
Long-Distance Trips by Mode and Purpose,‘1995 ............................. 11-18<br />
Long-Distance Household Trips by Mode and Trip Distance, 1995 ................ 1 l-l 9<br />
Shares of Long-Distance Person Trips by Mode and Household Income, 1995 ....... 1 l-<strong>20</strong><br />
Average Annual Vehicle-Miles, Vehicle Trips and Trip Length per Household ....... 1 l-6<br />
Average Annual Person-Miles Traveled (PMT), Person Trips and Trip Length per<br />
Household by Selected Trip Purposes ..................................... 1 l-7<br />
Pollution from a Typical New Car and Light Truck, <strong>20</strong>00 Model Year .............. 4-32<br />
Light Truck Scrappage and Survival Rates .................................... 6- 13<br />
Light Truck Survival Rates ................................................ 6- 14<br />
Truck and Bus Registrations <strong>for</strong> Selected Countries, 1950-96 ...................... 6-3<br />
New Retail Truck Sales by Gross Vehicle Weight, 1970-98 ........................ 8-3<br />
Truck Statistics by Gross Vehicle Weight Class, 1997 ............................ 8-5<br />
Truck Fuel Economy by Fuel Type and Size Class, 1997 .......................... 8-6<br />
Trucks<br />
Truck Fuel Economy by Size Class, 1977,1982,1987,1992, and 1997 .............. 8-6<br />
Truck Statistics by Size, 1997 ............................................... 8-7<br />
Federal Exhaust Emission Certification Standards <strong>for</strong> Gasoline- and Diesel-Powered<br />
LightTrucks.. ....................................................... 4-34<br />
Federal Exhaust Emission Certification Standards <strong>for</strong> Gasoline- and Diesel-Powered<br />
LightTrucks ......................................................... 4-35<br />
<strong>TRANSPORTATION</strong> <strong>ENERGY</strong><strong>DATA</strong>BOOIC <strong>EDITION</strong>~O-<strong>20</strong>00
Trucks (continued)<br />
Unit<br />
Federal Exhaust Emission Certification Standards <strong>for</strong> Gasoline- and Diesel-Powered<br />
LightT~cks ......................................................... 4-36<br />
Federal Exhaust Emission Certification Standards <strong>for</strong> Gasoline- and Diesel-Powered<br />
LightTrucks.. ....................................................... 4-37<br />
Federal Exhaust Emission Certification Standards <strong>for</strong> Gasoline- and Diesel-Powered<br />
Light Heavy Trucks ................................................... 4-38<br />
Federal Exhaust Emission Certification Standards <strong>for</strong> Gasoline- and Diesel-Powered<br />
Heavy Heavy Trucks .................................................. 4-39<br />
Cali<strong>for</strong>nia Passenger Cars and Light Trucks Emission Certification Standards ........ 4-40<br />
Cali<strong>for</strong>nia Vehicle Emission Reduction <strong>for</strong> Passenger Cars and Light Trucks ......... 4-41<br />
Average Age of Automobiles and Trucks in Use, 1970-98 ........................ 6-10<br />
Automobiles and Trucks in Use, 1970-98 ...................................... 6-5<br />
Trucks in Operation and Vehicle Travel by Age, 1970 and 1998 .................... 6-9<br />
Sales-Weighted Engine Size of New Domestic and Import Light Trucks by Size Class,<br />
Sales Periods 1976-99 ................................................. 7- 10<br />
Sales-Weighted Wheelbase of New Automobiles and Light Trucks, Sales Period<br />
1976-99 ............................................................ 7-14<br />
Corporate Average Fuel Economy (CAFE) Standards versus Sales-Weighted Fuel<br />
Economy Estimates <strong>for</strong> Automobiles and Light Trucks, 1978-99 ............... 7-18<br />
Summary Statistics <strong>for</strong> Two-Axle, Four-Tire Trucks, 1970-98 ...................... 7-3<br />
New Retail Sales of Trucks 10,000 pounds GVW and Less in the United States,<br />
1970-98 ............................................................. 7-5<br />
Period Sales, Market Shares, and Sales-Weighted Fuel Economies of New Domestic and<br />
Import Light Trucks, Selected Sales Period 1976-99 .......................... 7-7<br />
Percentage of Trucks by Major Use and Primary Refueling Facility, 1997 ........... 8-10<br />
Summary Statistics <strong>for</strong> Other Single-Unit and Combination Trucks, 1970-98 .......... 8-2<br />
Percentage of Trucks by Size Class, 1977,1982,1987,1992, and 1997 .............. 8-5<br />
Percentage of Trucks by Size Ranked by Major Use, 1997 ......................... 8-8<br />
United<br />
Percentage of Trucks by Fleet Size and Primary Refueling Facility, 1997 ............. 8-9<br />
Summary Statistics <strong>for</strong> Other Single-Unit and Combination Trucks, 1970-98 .......... 8-2<br />
United States Petroleum Production and Consumption, 1973-99 ................... l- 12<br />
Class I Railroad Freight Systems in the United States Ranked by Revenue Ton-Miles,<br />
1998 ............................................................... 12-7<br />
Passenger Travel and Energy Use in the United States, 1998 ...................... 2-13<br />
Intercity Freight Movement and Energy Use in the United States, 1998 ............. 2- 16<br />
<strong>TRANSPORTATION</strong> <strong>ENERGY</strong> <strong>DATA</strong> <strong>BOOK</strong>: <strong>EDITION</strong> <strong>20</strong>-<strong>20</strong>00<br />
I-41
I-42<br />
United (continued)<br />
Vehicle Stock and New Sales in United States, 1998 Calendar Year . . . . . . . . . . . . . .<br />
New Retail Automobile Sales in the United States, 1970-98 . . . . . . . . . . . . . . . . . . . .<br />
New Retail Sales of Trucks 10,000 pounds GVW and Less in the United States,<br />
1970-98 . . . . . . . . . . . . . . . . . . . . . . . . . . . . . . . . . . . . . . . . . . . . . . . . . . . . . . . . . .<br />
Growth of Freight Activity in the United States: Comparison of the 1997 and 1993<br />
Commodity Flow Surveys . . . . . . . . . . . . . . . . . . . . . . . . . . . . . . . . . . . . . . . . . . . .<br />
Urban<br />
Urban Driving Cycle . . . . . . . . . . . . . . . . . . . . . . . . . . . . . . . . . . . . . . . . . . . . . . , . . . .<br />
US06<br />
US06 Driving Cycle ...................................................<br />
Vehicle<br />
. . 7-28<br />
Fleet Vehicle Composition by Vehicle Type, 1991 ........................... . . 10-4<br />
Average Annual and Daily Vehicle-Miles of Travel <strong>for</strong> Fleet Vehicles, 1991 ...... . . 10-4<br />
Average Miles per Federal Vehicle by Vehicle Type, 1997 .................... . . 10-5<br />
Federal Fleet Vehicle Acquisitions by Fuel Type, FY 1997 .................... . . 10-7<br />
Average Vehicle Occupancy by Trip Purpose, 1977,1983,1990, and 1995 NPTS . . . 11-10<br />
Vehicle-Miles by Trip Purpose, 1995 NPTS ................................ . 11-11<br />
Average Annual Miles per Vehicle by Household Vehicle Ownership, 1995 NPTS . . 11-12<br />
Average Age of Vehicles by Household Vehicle Ownership, 1995 NPTS ......... . 11-12<br />
Average Annual Miles per Household Vehicle by Vehicle Age ................. . 11-13<br />
Population and Vehicle Profile, 1950-98 ................................... . . 11-2<br />
Household Vehicle Ownership, 1960-90 Census ............................ . . 11-4<br />
Average Annual Vehicle-Miles, Vehicle Trips and Trip Length per Household .... . . l l - 6<br />
Average Number of Vehicles and Vehicle Travel per Household, 1990 and<br />
1995NPTS.......................................................... 11-8<br />
Average Vehicle Occupancy by Vehicle Type, 1995 NPTS . . . . . . . . . . . . . . . . . . . . . . . 1 l-9<br />
Alternative Vehicle Fuel Consumption, 1992-<strong>20</strong>00 . . . . . . . . . . . . . . . . . . . . . . . . . . . . . 2- 11<br />
NEAR-TERM Technology: Fuel-Cycle Energy and Greenhouse Gas Emission Changes<br />
of Alternative Transportation Fuels and Advanced Vehicle Technologies . . . . . . . . . 3-l 1<br />
LONG-TERM Technology: Fuel-Cycle Energy and Greenhouse Gas Emission Changes<br />
of Alternative Transportation Fuels and Advanced Vehicle Technologies . . . . . . . . . 3-12<br />
NEAR-TERM Technology: Fuel-Cycle Energy and Criteria Pollutant Emission Changes<br />
of Alternative Transportation Fuels and Advanced Vehicle Technologies . . . . . . . . . 4-17<br />
LONG-TERM Technology: Fuel-Cycle Energy and Greenhouse Gas Emission Changes<br />
. . 6-6<br />
. . 7-4<br />
. . 7-5<br />
. 8-12<br />
. 7-26<br />
of Alternative Transportation Fuels and Advanced Vehicle Technologies . . . . . . . . . 4-19<br />
Cali<strong>for</strong>nia Vehicle Emission Reduction <strong>for</strong> Passenger Cars and Light Trucks . . . . . . . . . 4-41<br />
Motor Vehicle Manufacturing Employment Statistics, 1972-98 . . . . . . . . . . . . . . . . . . . . 5-18<br />
<strong>TRANSPORTATION</strong> <strong>ENERGY</strong> <strong>DATA</strong> <strong>BOOK</strong>: <strong>EDITION</strong> <strong>20</strong>-<strong>20</strong>00
Vehicle (continued)<br />
Employees of Motor Vehicle and Related Industries, 1990 and 1997 ........<br />
Vehicle Stock and New Sales in United States, 1998 Calendar Year ........<br />
Highway Vehicle Miles Traveled by Vehicle Type, 1970-98 ..............<br />
Automobiles in Operation and Vehicle Travel by Age, 1970 and 1998 ......<br />
Trucks in Operation and Vehicle Travel by Age, 1970 and 1998 ...........<br />
. New Light Vehicle Dealerships and Sales, 1970-98 .....................<br />
Vehicle Specifications <strong>for</strong> Tested Vehicles ............................<br />
Occupant Fatalities by Vehicle Type and Nonoccupant Fatalities, 1975-98 ...<br />
Light Vehicle Occupant Safety Data, 1975-98 .........................<br />
Crashes by Crash Severity, Crash Type, and Vehicle Type, 1998 ..........<br />
Percent Rollover Occurrence by Vehicle Type and Crash Severity .........<br />
Light Vehicle Market Shares by Size Class, Sales Period 1976-99 ..........<br />
New Retail Truck Sales by Gross Vehicle Weight, 1970-98 ...............<br />
Truck Statistics by Gross Vehicle Weight Class, 1997 ...................<br />
U.S. Advanced Battery Consortium Goals <strong>for</strong> Electric Vehicle Batteries .....<br />
Vehicles<br />
. . . . . 5-19<br />
. . . . . . 6-6<br />
. . . . . . 6-7<br />
. . . . . . 6-8<br />
. . . . . . 6-9<br />
. . . . . 7-16<br />
. . . . . 7-22<br />
. . . . . 7-29<br />
. . . . . 7-30<br />
. . . . . 7-31<br />
. . . . . 7-32<br />
. . . . . . 7-8<br />
. . . . . . 8-3<br />
. . . . . . 8-5<br />
. . . . . 9-10<br />
Fleet Vehicles in Service as of January 1, 1999 ................................ 1 O-2<br />
Top Ten States with Fleets of Ten Vehicles or More, 1999 ....................... 1 O-3<br />
Average Length of Time Fleet Vehicles are Kept Be<strong>for</strong>e Sold to Others, 1991 ........ 10-4<br />
Average Annual and Daily Vehicle-Miles of Travel <strong>for</strong> Fleet Vehicles, 1991 ......... 10-4<br />
Federal Government Vehicles by Agency, Fiscal Year 1997 ...................... IO-6<br />
Energy Policy Act Purchase Requirements of Light Alternative Fuel Vehicles ........ 10-8<br />
Average Age of Vehicles by Household Vehicle Ownership, 1995 NPTS ........... 11-12<br />
Average Number of Vehicles and Vehicle Travel per Household, 1990 and<br />
1995NPTS .......................................................... 11-8<br />
Emissions of Particulate Matter (PM-lo) from Highway Vehicles, 1970-98 .......... 4-10<br />
Emissions of Particulate Matter (PM-2.5) from Highway Vehicles, 1990-98 .......... 4-12<br />
Federal Exhaust Emission Certification Standards <strong>for</strong> Gasoline- and Diesel-Powered<br />
Light Vehicles ....................................................... 4-33<br />
Emissions of Carbon Monoxide from Highway Vehicles, 1970-98 .................. 4-4<br />
Emissions of Nitrogen Oxides from Highway Vehicles, 1970-98 .................... 4-6<br />
Emissions of Volatile Organic Compounds from Highway Vehicles, 1970-98 ......... 4-8<br />
Vehicle Specifications <strong>for</strong> Tested Vehicles .................................... 7-22<br />
Steady Speed Fuel Economy <strong>for</strong> Tested Vehicles ............................... 7-25<br />
PNGV Goals and Specifications of Hybrid-Electric Vehicles ...................... 9-l 1<br />
Estimates of Alternative Fuel Vehicles in use, 1992-<strong>20</strong>00 ......................... 9-3<br />
Estimates of Light Alternative Fuel Vehicles, 1996, 1998, and <strong>20</strong>00 ................. 9-4<br />
<strong>TRANSPORTATION</strong> <strong>ENERGY</strong> <strong>DATA</strong> <strong>BOOK</strong>: <strong>EDITION</strong> <strong>20</strong>-<strong>20</strong>00<br />
I-43
I-44<br />
Vehicle (continued)<br />
Estimates of Heavy Alternative Fuel Vehicles, 1996, 1998, and <strong>20</strong>00 . . . . . . . . . . . . . . . , 9-5<br />
Alternative Fuel Vehicles Available by Manufacturer, Model Year <strong>20</strong>00 . . . . . . . . . . . . . 9-6<br />
Volatile<br />
Total National Emissions of Volatile Organic Compounds, 1970-98 . . . . . . . . . . . . . . . . 4-7<br />
Emissions of Volatile Organic Compounds from Highway Vehicles, 1970-98 . . . . . . . . . 4-8<br />
Warming<br />
Numerical Estimates of Global Warming Potentials Compared With Carbon Dioxide . . . 3-8<br />
Waterborne<br />
Weight<br />
Tonnage Statistics <strong>for</strong> Domestic and International Waterborne Commerce, 1970-98 . . . 12-4<br />
Summary Statistics <strong>for</strong> Domestic Waterborne Commerce, 1970-98 . . . . . . . . . . . . . . . . . 12-5<br />
Sales-Weighted Curb Weight of New Domestic and Import Automobiles by Size Class,<br />
Sales Periods 1976-99 . . . . . . . . . . . . . . . . . . . . . . . . . . . . . . . . . . . . . . . . . . . . . . . . . 7-l 1<br />
Engine Size, Curb Weight, and Interior Space of New Domestic and Import<br />
Automobiles, 1976-99 . . . . . . . . . . . . . . . . . . . . . . . . . . . . . . . . . . . . . . . . . . . . . . . . . 7-l 3<br />
New Retail Truck Sales by Gross Vehicle Weight, 1970-98 . . . . . . . . . . . . . . . . . . . . . . . . 8-3<br />
Truck Statistics by Gross Vehicle Weight Class, 1997 . . . . . . . . . . . . . . . . . . . . . . . . . . . . 8-5<br />
Weighted<br />
Sales-Weighted Engine Size of New Domestic and Import Light Trucks by Size Class,<br />
Sales Periods 1976-99 . . . . . . . . . . . . . . . . . . . . . . . . . . . . . . . . . . . . . . . . . . . . . . . . . 7- 10<br />
Sales-Weighted Curb Weight of New Domestic and Import Automobiles by Size Class,<br />
Sales Periods 1976-99 . . . . . . . . . . . . . . . . . . . . . . . . . . . . . . . . . . . . . . . . . . . . . . . . . 7- 11<br />
Sales-Weighted Interior Space of New Domestic and Import Automobiles by Size Class,<br />
Sales Periods 1976-99 . . . . . . . . . . . . . . . . . . . . . . . . . . . . . . . . . . . . . . . . . . . . . . . . . 7-12<br />
Sales-Weighted Wheelbase of New Automobiles and Light Trucks, Sales Period<br />
1976-99 . . . . . . . . . . . . . . . . . . . . . . . . . . . . . . . . . . . . . . . . . . . . . . . . . . . . . . . . . . . . 7-14<br />
Corporate Average Fuel Economy (CAFE) Standards versus Sales-Weighted Fuel<br />
Economy Estimates <strong>for</strong> Automobiles and Light Trucks, 1978-99 . . . . . . . . . . . . . . . 7-l 8<br />
Period Sales, Market Shares, and Sales-Weighted Fuel Economies of New Domestic and<br />
Import Automobiles, Selected Sales Periods 1976-99 . . . . . . . . . . . . . . . . . . . . . . . . . . 7-6<br />
Period Sales, Market Shares, and Sales-Weighted Fuel Economies of New Domestic and<br />
Import Light Trucks, Selected Sales Period 1976-99 . . . . . . . . . . . . . . . . . . . . . . . . . . 7-7<br />
Sales-Weighted Engine Size of New Domestic and Import Automobiles by Size Class,<br />
Wheelbase<br />
Sales Periods 1976-99 . . . . . . . . . . . . . . . . . . . . . . . . . . . . . . . . . . . . . . . . . . . . . . . . . . 7-9<br />
Sales-Weighted Wheelbase of New Automobiles and Light Trucks, Sales Period<br />
1976-99 . . . . . . . . . . . . . . . . . . . . . . . . . . . . . . . . . . . . . . . . . . . . . . . . . . . . . . . . . . . . 7-14<br />
<strong>TRANSPORTATION</strong> <strong>ENERGY</strong> <strong>DATA</strong> <strong>BOOK</strong>: <strong>EDITION</strong> <strong>20</strong>-<strong>20</strong>00
Work<br />
World<br />
Journey-to-Work Statistics, 1983, 1990, and 1995 NPTS . . . . . . . . . . . . . . . . . . . . . . . . 11-14<br />
Means of Transportation to Work, 1980 and 1990 Census . . . . . . . . . . . . . . . . . . . . . . . 11-15<br />
National and Metropolitan Area Comparisons of Journey-to-Work Statistics,<br />
1990Census........................................................ 11-16<br />
World Fossil Fuel Potential . . . . . . . . . . . . . . . . . . . . . . . . . . . . . . . . . . . . . . . . . . . . . . . . . l-2<br />
World Crude Oil Production, 1960-98 . . . . . . . . . . . . . . . . . . . . . . . . . . . . . . . . . . . . . . . . . l-3<br />
World Oil Consumption, 1960-97 . . . . . . . . . . . . . . . . . . . . . . . . . . . . . . . . . . . . . . . . . . . . l-4<br />
U.S. Petroleum Net Imports by World Region of Origin, 1960-98 . . . . . . . . . . . . . . . . . . . l-7<br />
Refinery Gross Output by World Region, 1999 . . . . . . . . . . . . . . . . . . . . . . . . . . . . . . . . . l-9<br />
World Production of Primary Energy by Selected Country Groups, 1989-98 . . . . . . . . . . 2-2<br />
World Consumption of Primary Energy by Selected Country Groups, 1989-98 . . . . . . . . 2-3<br />
Worldwide<br />
Yield<br />
York<br />
Worldwide Federal Inventory, 1992-97 . . . . . . . . . . . . . . . . . . . . . . . . . . . . . . . . . . . . . . . 1 O-5<br />
Refinery Yield of Petroleum Products fi-om a Barrel of Crude Oil, 1978-98 . . . . . . . . . . l-l 1<br />
New York City Driving Cycle . . . . . . . . . . . . . . . . . . . . . . . . . . . . . . . . . . . . . . . . . . . . . . 7-27<br />
<strong>TRANSPORTATION</strong> <strong>ENERGY</strong> <strong>DATA</strong> <strong>BOOK</strong>: <strong>EDITION</strong> <strong>20</strong>-<strong>20</strong>00<br />
I-45
INTERNAL DISTRIBUTION<br />
1. V. D. Baxter <strong>20</strong>. L. N. McCold<br />
2. T. J. Blasing 21. C. I. Moser<br />
3. R. Boundy 22. W. N. Naegeli<br />
4. J. E. Christian 23. R. D. Perlack<br />
5. G. E. Courville 24. B. E. Peterson<br />
6. T. R. Curlee 25. C. G. Rizy<br />
7. S. Das 26. A. C. Schaffhauser<br />
8. S . C. Davis 27. R. B. Shelton<br />
9. D. L. Greene 28. S. Singh<br />
10. E. T. Grostick 29. J. E. Sorensen<br />
11. L. D. Han 30. F. Southworth<br />
12. I. G. Harrison 31. J. W. Terry<br />
13. R. B. Honea 32. L. F. Truett<br />
14. P. S. Hu 33. J. W. Van Dyke<br />
15. C. R. Hudson 34. J. VanCoevering<br />
16. P. J. Hughes 35. R. E. Ziegler<br />
17. D. W. Jones 36. Central Research Library<br />
18. P. N. Leiby 37. Document Reference Section<br />
19. G. Marland 38. Laboratory Records<br />
39.<br />
40.<br />
41.<br />
42.<br />
43.<br />
44.<br />
45-1<strong>20</strong>0.<br />
EXTERNAL DISTRIBUTION<br />
ORNL4959<br />
L. A. Abron, President, PEER Consultants, P.C., 1460 Gulf Blvd., 11” Floor, Clearwater,<br />
Florida 34630<br />
S. L. Cutter, Director, Hazards Research Lab, Department of Geography, University of<br />
South Carolina, Columbia, South Carolina 29<strong>20</strong>8<br />
S. G. Hildebrand, Director, Environmental Sciences Division, Oak Ridge National<br />
Laboratory, Post Office Box <strong>20</strong>08, Oak Ridge, Tennessee 3783 l-6037<br />
P. R. Rittelmann, FAIA, Executive Vice President, Burt Hill Kosar Rittelmann Associates,<br />
400 Morgan <strong>Center</strong>, Butler, Pennsylvania 1600 1-5977<br />
S. F. Tierney, The Economic Resource Group, Inc., One Mifflin Place, Cambridge,<br />
Massachusetts 02 13 8<br />
C. M. Walton, Ernest H. Cockrell Centennial Chair in Engineering and Chairman,<br />
Department of Civil Engineering, University of Texas at Austin,E Cockrell, Jr. Hall I,<br />
Suite 4210, Austin, Texas 78712-1075<br />
<strong>Center</strong> <strong>for</strong> Transportation Analysis, Energy Division, Building 3 156, Room 102.


