

TRANSPORTATION ENERGY DATA BOOK: EDITION 20 - Center for ...
TRANSPORTATION ENERGY DATA BOOK: EDITION 20 - Center for ...
TRANSPORTATION ENERGY DATA BOOK: EDITION 20 - Center for ...

You also want an ePaper? Increase the reach of your titles
YUMPU automatically turns print PDFs into web optimized ePapers that Google loves.
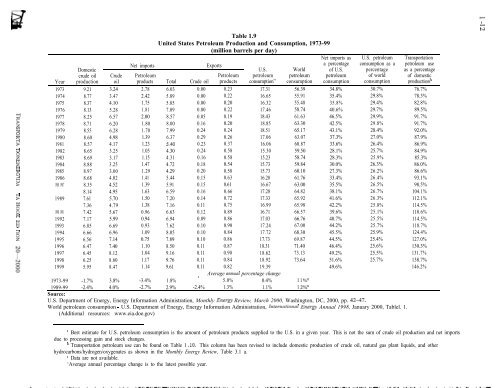
Table 1.9<br />
United States Petroleum Production and Consumption, 1973-99<br />
(million barrels per day)<br />
Net imports as U.S. petroleum Transportation<br />
Net imports Exports<br />
U.S. World<br />
a percentage<br />
of U.S.<br />
consumption as a<br />
percentage<br />
petroleum use<br />
as a percentage<br />
Crude Petroleum Petroleum petroleum petroleum petroleum of world of domestic<br />
oil products Total Crude oil products consumption” consumption consumption consumption productior?<br />
Year<br />
Domestic<br />
crude oil<br />
production<br />
1973 9.21 3.24 2.78 6.03 0.00 0.23<br />
17.31 56.39 34.8%<br />
30.7%<br />
1974 8.77 3.47 2.42 5.89 0.00 0.22<br />
16.65<br />
55.91<br />
35.4%<br />
29.8%<br />
1975 8.37 4.10 1.75 5.85 0.00 0.<strong>20</strong><br />
16.32<br />
55.48<br />
35.8%<br />
29.4%<br />
1976 8.13 5.28 1.81 7.09 0.00 0.22<br />
17.46 58.74 40.6%<br />
29.7%<br />
1977 8.25 6.57 2.00 8.57 0.05 0.19<br />
18.43<br />
61.63 46.5%<br />
29.9%<br />
1978 8.71 6.<strong>20</strong> 1.80 8.00 0.16 0.<strong>20</strong><br />
18.85 63.30 42.5%<br />
29.8%<br />
e 1979 8.55 6.28 1.70 7.99 0.24 0.24<br />
18.51 65.17 43.1%<br />
28.4%<br />
E 1980 8.60 4.98 1.39 6.37 0.29 0.26<br />
17.06<br />
63.07<br />
37.3%<br />
27.0%<br />
2 1981 8.57 4.17 1.23 5.40 0.23 0.37<br />
16.06<br />
60.87<br />
33.6%<br />
26.4%<br />
z 1982 8.65 3.25 1.05 4.30 0.24 0.58<br />
15.30 59.50 28.1%<br />
25.7%<br />
2 1983 8.69 3.17 1.15 4.31 0.16 0.58<br />
15.23 58.74 28.3%<br />
25.9%<br />
k2 1984 8.88 3.25 1.47 4.72 0.18 0.54<br />
15.73 59.84 30.0%<br />
26.3%<br />
E 1985 8.97 3.00 1.29 4.29 0.<strong>20</strong> 0.58<br />
15.73 60.10 27.3%<br />
26.2%<br />
2 1986 8.68 4.02 1.41 5.44 0.15 0.63<br />
16.28 61.76 33.4%<br />
26.4%<br />
Y 1988 1987 8.35 4.52 1.39 5.91 0.15 0.61<br />
16.67 63.00 35.5%<br />
26.5%<br />
8.14 4.95 1.63 6.59 0.16 0.66<br />
17.28<br />
64.82<br />
38.1%<br />
26.7%<br />
2 1989 7.61 5.70 1.50 7.<strong>20</strong> 0.14 0.72<br />
17.33<br />
65.92 41.6%<br />
26.3%<br />
7.36 4.79 1.38 7.16 0.11 0.75<br />
16.99<br />
65.98 42.2%<br />
25.8%<br />
E<br />
R<br />
.<br />
1990 1991<br />
1992<br />
7.42<br />
7.17<br />
5.67<br />
5.99<br />
0.96<br />
0.94<br />
6.63<br />
6.94<br />
0.12<br />
0.09<br />
0.89<br />
0.86<br />
16.71<br />
17.03<br />
66.57<br />
66.76<br />
39.6%<br />
40.7%<br />
25.1%<br />
25.5%<br />
k? 1993 6.85 6.69 0.93 7.62 0.10 0.90<br />
17.24<br />
67.00 44.2%<br />
25.7%<br />
7 1994 6.66 6.96 1.09 8.05 0.10 0.84<br />
17.72 68.30 45.5%<br />
25.9%<br />
2 1995 6.56 7.14 0.75 7.89 0.10 0.86<br />
17.73<br />
69.87 44.5%<br />
25.4%<br />
1996 6.47 7.40 1.10 8.50 0.11 0.87<br />
18.31 71.40 46.4%<br />
25.6%<br />
1997 6.45 8.12 1.04 9.16 0.11 0.90<br />
18.62<br />
73.13<br />
49.2%<br />
25.5%<br />
1998 6.25 8.60 1.17 9.76 0.11 0.84<br />
18.92 73.64 51.6%<br />
25.7%<br />
1999 5.95 8.47 1.14 9.61 0.11 0.82<br />
19.39<br />
49.6%<br />
1973-99 -1.7% 3.8% -3.4% 1.8%<br />
c<br />
Average nnnunl percentage change<br />
5.0% 0.4% 1 1 OXd<br />
1989-99<br />
Source:<br />
-2.4% 4.0% -2.7% 2.9% -2.4% 1.3% 1.1% 1 .2%6<br />
U.S. Department of Energy, Energy In<strong>for</strong>mation Administration, Monthly Ener,oy Review, March <strong>20</strong>00, Washington, DC, <strong>20</strong>00, pp. 42-47.<br />
World petroleum consumption - U.S. Department of Energy, Energy In<strong>for</strong>mation Administration, Internatiomd Ener*,o Annual 1998, January <strong>20</strong>00, Tablel. 1.<br />
(Additional resources: www.eia.doe.gov)<br />
a Best estimate <strong>for</strong> U.S. petroleum consumption is the amount of petroleum products supplied to the U.S. in a given year. This is not the sum of crude oil production and net imports<br />
due to processing gain and stock changes.<br />
b Transportation petroleum use can be found on Table 1 .lO. This column has been revised to include domestic production of crude oil, natural gas plant liquids, and other<br />
hydrocarbons/hydrogen/oxygenates as shown in the Monthly Energy Review, Table 3.1 a.<br />
’ Data are not available.<br />
‘Average annual percentage change is to the latest possible year.<br />
76.7%<br />
78.3%<br />
82.8%<br />
89.5%<br />
91.7%<br />
91.7%<br />
92.0%<br />
87.9%<br />
86.9%<br />
84.9%<br />
85.3%<br />
86.0%<br />
86.6%<br />
93.1%<br />
98.5%<br />
104.1%<br />
112.1%<br />
114.5%<br />
110.6%<br />
114.5%<br />
118.7%<br />
124.4%<br />
127.0%<br />
130.3%<br />
131.7%<br />
138.7%<br />
146.2%<br />
I<br />
w N


