- Page 1:
Center for Transportation Analysis
- Page 5 and 6:
TABLE OF CONTENTS FOREWORD ........
- Page 7 and 8:
Table 3.5 Table 3.6 Table 3.7 Table
- Page 9 and 10:
Table 5.5 Table 5.6 Table 5.7 Table
- Page 11 and 12:
TABLE OF CONTENTS (Continued) Table
- Page 13 and 14:
TABLE OF CONTENTS (Continued) Table
- Page 15:
of them. FOREWORD This edition has
- Page 19:
ABSTRACT The Transportation Energy
- Page 23 and 24:
Source Table 1.2 Table 1.3 Chapter
- Page 25 and 26:
Table 1.2 World Crude Oil Productio
- Page 27 and 28:
I The UnitedStates has increased it
- Page 29 and 30:
I The share ofpetroleum imported to
- Page 31 and 32:
100 90 80 70 60 50 40 30 20 IO 0 No
- Page 33 and 34:
I When crude oil and other hydrocar
- Page 35 and 36:
TRANSPORTATIONENERGYDATABOOK: EDITI
- Page 37:
Table 1.11 Transportation of Petrol
- Page 40 and 41:
1989 World total 134.66 136.35 135.
- Page 42 and 43:
2-4 I Total energy use in the U.S.
- Page 44 and 45:
2-6 I As duta about alternative jil
- Page 46 and 47:
The Federal Highway Administration
- Page 48 and 49:
Q) k s e b Y u IOO- 90 - 80 - 70 -
- Page 50 and 51:
2-12 Table 2.10 U.S. Production and
- Page 52 and 53:
Great care should be taken when com
- Page 54 and 55:
I Great care should be taken when c
- Page 57 and 58:
Source Chapter 3 Greenhouse Gas Emi
- Page 59 and 60:
1990 (million metric tonnes) Austra
- Page 61 and 62:
Table 3.4 Estimated U.S. Emissions
- Page 63 and 64:
Fuel Motor gasoline LPG” Jet fuel
- Page 65 and 66:
The Greenhouse Gases, Regulated Emi
- Page 67 and 68:
Table 3.8 NEAR-TERM Technology Cfor
- Page 69 and 70:
Table 3.9 (continued) LONG-TERM Tec
- Page 71 and 72:
Table 3.9 (continued) LONG-TERM Tec
- Page 73 and 74:
Table 3.9 (continued) LONG-TERM Tec
- Page 75 and 76:
Source Chapter 4 Criteria Pollutant
- Page 77 and 78:
I The transportation sector account
- Page 79 and 80:
I The transportation sector account
- Page 81 and 82:
I The transportation sector account
- Page 83 and 84:
I The transportation sector account
- Page 85 and 86:
The transportation sector accounted
- Page 87 and 88:
I Historically the transportation s
- Page 89 and 90:
The Greenhouse Gases, Regulated Emi
- Page 91 and 92:
Table 4.14 NEAR-TERM Technology Cfo
- Page 93 and 94:
Table 4.15 LONG-TERM Technology Gfo
- Page 95 and 96:
Table 4.15 (continued) LONG-TERM Te
- Page 97 and 98:
Table 4.15 (continued) LONG-TERM Te
- Page 99 and 100:
Table 4.15 (continued) LONG-TERM Te
- Page 101 and 102:
Table 4.15 (continued) LONG-TERM Te
- Page 103 and 104:
Table 4.15 (continued) LONG-TERM Te
- Page 105 and 106:
Table 4.15 (continued) LONG-TERM Te
- Page 107 and 108:
Table 4.18 Federal Exhaust Emission
- Page 109 and 110:
Table 4.20 Federal Exhaust Emission
- Page 111 and 112:
2 2 % 0” z Table 4.22 Federal Exh
- Page 113 and 114:
Gasoline Hydrocarbons (HC) Nitrogen
- Page 115 and 116:
I Califknia’s Low-Emission Vehicl
- Page 117 and 118:
Source Figure 5.1 Table 5.4 Table 5
- Page 119 and 120:
Figure 5.1. Gasoline Prices for Sel
- Page 121 and 122:
- I . I . I . I I Figure 5.2. Diese
- Page 123 and 124:
Year Current Diesel fuel a Constant
- Page 125 and 126:
Table 5.6 State Taxes on Motor Fuel
- Page 127 and 128:
As of January 2000, only five state
- Page 129 and 130:
I In current dollars, import cars,
- Page 131 and 132:
I The total cost of operating an au
- Page 133 and 134:
Year 1970 1980 1990 1997 1998 1970
- Page 135 and 136:
Employees of motor vehicle and rela
- Page 137 and 138:
Source Table 6.1 Table 6.2 Table 6.
- Page 139 and 140:
Year China India Japan France 1950
- Page 141 and 142:
1970 1971 1972 E 1973 2 1974 4 1975
- Page 143 and 144:
Table 6.5 Highway Vehicle Miles Tra
- Page 145 and 146:
Table 6.7 Trucks in Operation and V
- Page 147 and 148:
I Using current registration data a
- Page 149 and 150:
I Using current registration data a
- Page 151 and 152:
Source Chapter 7 Light Vehicles and
- Page 153 and 154:
The Federal Highway Administration
- Page 155 and 156:
Table 7.4 New Retail Sales of Truck
- Page 157 and 158:
Table 7.6 Period Sales, Market Shar
- Page 159 and 160:
Table 7.8 Sales-Weighted Engine Siz
- Page 161 and 162:
Sales period” 1976 1977 1978 1979
- Page 163 and 164:
0.8 F 0 0.6 u' 2 s = 0.4 0.2 Figure
- Page 165 and 166:
I The average auto lost over 300pou
- Page 167 and 168:
I The number of conventional refuel
- Page 169 and 170: Table 7.17 Corporate Average Fuel E
- Page 171 and 172: Fuel Economy by Vehicle Speed ORNL
- Page 173 and 174: I The two earlier studies by the Fe
- Page 175 and 176: Speed (mph) 1988 1993 Chevrolet Sub
- Page 177 and 178: I The New York Test Cycle was devel
- Page 179 and 180: Table 7.23 Occupant Fatalities by V
- Page 181 and 182: B0 P I In 1998, nearly 40% of all p
- Page 183 and 184: Source Table 8.1 Table 8.1 Table 8.
- Page 185 and 186: Table 8.2 New Retail Truck Sales by
- Page 187 and 188: I These tables illustrate the diffe
- Page 189 and 190: Trucks Trucks (%) Miles per truck T
- Page 191 and 192: I Nearly 1 GO% of all truckfleets u
- Page 193 and 194: Commodity Flow Survey The Commodity
- Page 195 and 196: Some,freight activities, such as pi
- Page 197 and 198: Chapter 9 Alternative Fuel Vehicles
- Page 199 and 200: I There are more LPG vehicles in us
- Page 201 and 202: Table 9.3 Estimates of Heavy Altern
- Page 203 and 204: This list includes public and priva
- Page 205 and 206: Figure 9.1 Map of Clean Cities as o
- Page 207: The Partnership for a New Generatio
- Page 210 and 211: . mm . . . SigniJicant changes have
- Page 212 and 213: 1 o-4 ama . . . .I . I TheseJleet d
- Page 214 and 215: 1 O-G @Ea6Ll I VW . . I Department
- Page 216 and 217: 10-8 I The Energy Policy Act of 199
- Page 218 and 219: . D. Year 1950 1955 1960 1965 1970
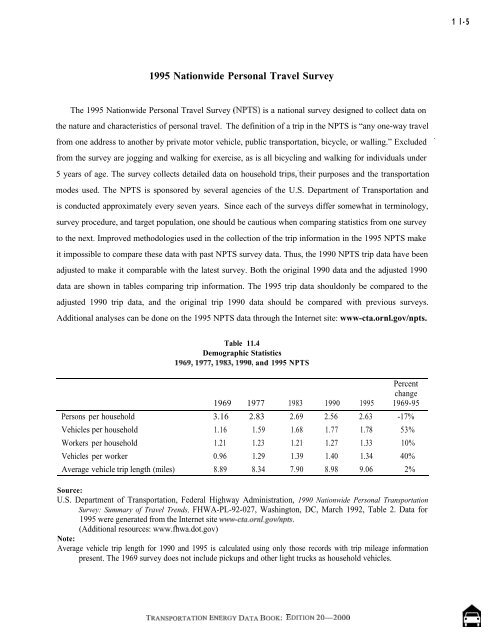
- Page 222 and 223: 1 l-6 e. . The 1995 NPTS data shoul
- Page 224 and 225: 11-8 El . . TRANSPORTATIONENERGYDAT
- Page 226 and 227: oooz-02 NOI.I>Ia~ :>I008 VLVa A!X%N
- Page 228 and 229: 11-12 I As households owned more ve
- Page 230 and 231: 11-14 a. . I In 1995 the average jo
- Page 232 and 233: 11-16 I3 . . Table 11.14 National a
- Page 234 and 235: . D. Principal means of transportat
- Page 236 and 237: . D. 90- IO- O- Figure 11.5. Shares
- Page 238 and 239: Table 12.1 Summary Statistics for U
- Page 240 and 241: 124 In the early seventies, domesti
- Page 242 and 243: Fifty-six percent of all domestic m
- Page 244 and 245: Table 12.7 Summary’Statistics for
- Page 246 and 247: 12-10 The number of trailers and co
- Page 248 and 249: Table 12.11 Summary Statistics for
- Page 250 and 251: A-2 AAMA APTA Amtrak Btu DOC DOE DO
- Page 252 and 253: A-4 Trucks Off-Highway Nonhighwav A
- Page 254 and 255: A-6 Rail Total: Sum of freight and
- Page 256 and 257: A-8 Buses Trucks Sum of transit, in
- Page 258 and 259: A-10 Pipeline Rail Recreational Boa
- Page 260 and 261: A-12 Highway Automobiles Personal T
- Page 262 and 263: A-14 Nonhighway Air Recreational Bo
- Page 264 and 265: A-16 Pipeline Rail Natural Gas: Ton
- Page 266 and 267: A-18 Light Trucks Buses Vmt - DOT,
- Page 268 and 269: A-20 Highway Table 2.14 Energy Inte
- Page 270 and 271:
A-22 Trucks Stock - Vehicles in use
- Page 272 and 273:
A-24 Energy Use Transit buses: Amer
- Page 274 and 275:
B-2 Automotive gasoline Diesel moto
- Page 276 and 277:
B-4 Table B.3 Energy Unit Conversio
- Page 278 and 279:
B-6 Table B.7 Volume and Flow Rate
- Page 280 and 281:
FROM Pound Kilogram Pound 1 0.4536
- Page 282 and 283:
B-10 One million million millionth
- Page 284 and 285:
B-12 Conversion of Constant Dollar
- Page 286 and 287:
Table B.14 Gross National Product (
- Page 288 and 289:
c-2 Table C.l Census Divisions and
- Page 291 and 292:
GLOSSARY Acceleration power - Measu
- Page 293 and 294:
Bunker - A storage tank. Bunkering
- Page 295 and 296:
separating facilities. Crude oil pr
- Page 297 and 298:
General aviation - That portion of
- Page 299 and 300:
Lease Condensate - A liquid recover
- Page 301 and 302:
Oil Stocks - Oil stocks include cru
- Page 303 and 304:
Petroleum inventories: The amounts
- Page 305 and 306:
Single unit truck - Includes two-ax
- Page 307 and 308:
TITLE INDEX TRANSPORTATION ENERGY D
- Page 309 and 310:
Alternative (continued) NEAR-TERM T
- Page 311 and 312:
Aviation Axle Barrel Summary Statis
- Page 313 and 314:
Certification (continued) Cities Ci
- Page 315 and 316:
Corporate Corporate Average Fuel Ec
- Page 317 and 318:
Dioxide International Man-Made Emis
- Page 319 and 320:
Emission (continued) LONG-TERM Tech
- Page 321 and 322:
Engine Sales-Weighted Engine Size o
- Page 323 and 324:
Fleet Fleet Vehicles in Service as
- Page 325 and 326:
Fuels (continued) Gallon Gas Gases
- Page 327 and 328:
Heavy (continued) Federal Exhaust E
- Page 329 and 330:
International Summary Statistics fo
- Page 331 and 332:
Material Matter Average Material Co
- Page 333 and 334:
Nitrogen Total National Emissions o
- Page 335 and 336:
Percentage (continued) Periods Pers
- Page 337 and 338:
Prices CrudeOilPrices,1870-98 . . .
- Page 339 and 340:
Retail (continued) New Retail Sales
- Page 341 and 342:
Shares Shares of Long-Distance Pers
- Page 343 and 344:
s toc1< s toc1
- Page 345 and 346:
Time Tire Ton Average Length of Tim
- Page 347 and 348:
Trucks (continued) Unit Federal Exh
- Page 349 and 350:
Vehicle (continued) Employees of Mo
- Page 351:
Work World Journey-to-Work Statisti