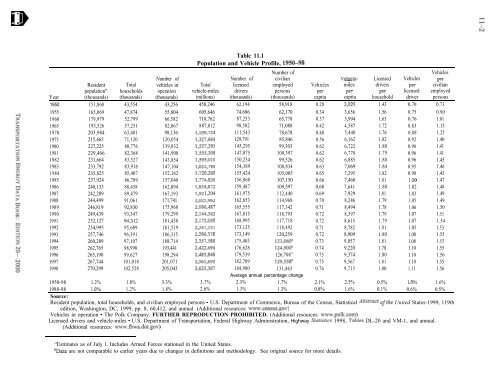
. D. Year 1950 1955 1960 1965 1970 1975 1980 1981 1982 1983 1984 1985 1986 1987 1988 1989 1990 1991 1992 1993 1994 1995 1996 1997 1998 Resident population” (thousands) 151,868 165,069 179,979 193,526 <strong>20</strong>3,984 215,465 227,225 229,466 231,664 233,792 235,825 237,924 240,133 242,289 244,499 246,819 249,439 252,127 254,995 257,746 260,289 262,765 265,190 267,744 270,299 Total households (thousands) 43,554 47,874 52,799 57,251 63,401 71,1<strong>20</strong> 80,776 82,368 83,527 83,918 85,407 86,789 88,458 89,479 91,061 92,830 93,347 94,3 12 95,689 96,391 97,107 98,990 99,627 101,018 102,528 Number of vehicles in operation (thousands) 43,256 55,804 66,582 82,067 98,136 1<strong>20</strong>,054 139,832 141,908 143,854 147,104 152,162 157,048 162,094 167,193 171,741 175,960 179,299 181,438 181,519 186,315 188,714 193,441 198,294 <strong>20</strong>1,071 <strong>20</strong>5,043 Table 11.1 Population and Vehicle Profile, 1950-98 Total vehicle-miles (millions) 458,246 605,646 718,762 887,812 1,109,724 1,327,664 1,527,295 1,555,308 1,595,OlO 1,652,788 1,7<strong>20</strong>,269 1,774,826 1,834,872 1,92 1,<strong>20</strong>4 2,025,962 2,096,487 2,144,362 2,172,050 2,247,151 2,296,378 2,357,588 2,422,696 2,485,848 2,561,695 2,625,367 Number of licensed drivers (thousands) 62,194 Number of civilian employed persons (thousands) 58,918 74,686 62,170 87,253 65,778 98,502 71,088 111,543 78,678 129,791 85,846 145,295 99,303 147,075 100,397 150,234 99,526 154,389 100,834 155,424 105,005 156,868 107,150 159,487 109,597 161,975 112,440 162,853 114,968 165,555 117,342 167,015 118,793 168,995 117,718 173,125 118,492 173,149 1<strong>20</strong>,259 175,403 123,060b 176,628 124,900b 179,539 126,708” 182,709 129,558b 184,980 131,463 Average annual percentage change 2.3% 1.7% Vehicles per capita 0.28 Vehicle- Licensed miles drivers per capita per household 3,929 1.43 Vehicles Per licensed driver 0.70 Vehicles per civilian employed persons 0.73 0.34 3,656 1.56 0.75 0.90 0.37 3,994 1.65 0.76 1.01 0.42 4,587 1.72 0.83 1.15 0.48 5,440 1.76 0.88 1.25 0.56 6,162 1.82 0.92 1.40 0.62 6,722 1.80 0.96 1.41 0.62 6,778 1.79 0.96 1.41 0.62 6,885 1.80 0.96 1.45 0.63 7,069 1.84 0.95 1.46 0.65 7,295 1.82 0.98 1.45 0.66 7,460 1.81 1 .oo 1.47 0.68 7,641 1.80 1.02 1.48 0.69 7,929 1.81 1.03 1.49 0.70 8,286 1.79 1.05 1.49 0.71 8,494 1.78 1.06 1.50 0.72 8,597 1.79 1.07 1.51 0.72 8,615 1.79 1.07 1.54 0.71 8,782 1.81 1.05 1.53 0.72 8,909 1.80 1.08 1.55 0.73 9,057 1.81 1.08 1.53 0.74 9,2<strong>20</strong> 1.78 1.10 1.55 0.75 9,374 1.80 1.10 1.56 0.75 9,567 1.81 1.10 1.55 0.76 9,713 1.80 1.11 1.56 1950-98 1.2% 1.8% 3.3% 3.7% 2.1% 2.5% 0.5% 1 .O% 1.6% 1988-98 1 .O% 1.2% 1.8% 2.6% 1.3% 1.3% 0.8% 1.6% 0.1% 0.6% 0.5% Source: Resident population, total households, and civilian employed persons - U.S. Department of Commerce, Bureau of the Census, Statistical Abstvuct ofthe United States-1999, 119th edition, Washington, DC, 1999, pp. 8, 60,412, and annual. (Additional resources: www.census.gov) Vehicles in operation - The Polk Company. FURTHER REPRODUCTION PROHIBITED. (Additional resources: www.polk.com) Licensed drivers and vehicle-miles - U.S. Department of Transportation, Federal Highway Administration, Highway Sfatistics 1998, Tables DL-<strong>20</strong> and VM-1, and annual. (Additional resources: www.fhwa.dot.gov) “Estimates as of July 1, Includes Armed Forces stationed in the United States. bData are not comparable to earlier years due to changes in definitions and methodology. See original source <strong>for</strong> more details.
. D. I Transportation (18.2%) is second only to housing (31.8%) as the largest expenditure <strong>for</strong> the average household. In 1998, approximately 15% of transportation expenditures were <strong>for</strong> purchasing gasoline and motor oil. There is an average of two vehicles per household. Table 11.2 Average Annual Expenditures of Households by Income, 199P Income be<strong>for</strong>e taxes All Less than $5,000- $10,000- $15,000- $<strong>20</strong>,000- $30,000- $40,000- $50,000- $70,000 households $5,000 $9999 $14999 $19,999 $29,999 $39,999 $49,999 $69,999 and over Total expenditures $37,260 $17,502 $14,838 $19,958 $22,810 $27,941 $33,616 $39,934 $49,376 $73,786 Percentage of total expenditures” Food’ 14.4% 18.1% 18.5% 15.4% 16.3% 15.5% 15.3% 14.8% 14.0% 12.5% Housing 31.8% 34.8% 39.0% 36.8% 34.8% 33.3% 32.2% 30.0% 29.4% 30.6% Apparel and services 4.7% 6.4% 4.7% 4.1% 4.0% 4.8% 5.2% 5.1% 4.3% 4.7% Transportation 18.2% 16.4% 13.7% 17.9% 18.4% 19.1% 18.6% 18.8% 19.9% 17.4% Vehicle purchases (net outlay) 8.2% 6.8% 5.6% 8.6% 8.2% 8.6% 7.7% 8.2% 9.4% 7.8% Gasoline and motor oil 2.8% 3.2% 2.9% 3.0% 3.2% 3.2% 3.1% 3.1% 2.8% 2.2% Other vehicle expenditures 6.1% 5.2% 4.1% 5.3% 5.9% 6.2% 6.7% 6.5% 6.7% 5.9% Public transportation 1.1% 1.2% 1.1% 1.0% 1.0% 1.0% 1.0% 1.0% 0.9% 1.5% Health care 5.3% 4.9% 7.9% 8.3% 9.4% 6.6% 5.5% 5.2% 4.4% 3.9% Entertainment 4.9% 5.2% 3.8% 4.5% 3.9% 4.3% 4.3% 4.9% 5.3% 5.4% Personal Insurance & pensions 11.0% 2.7% 2.1% 3.0% 4.4% 6.5% 9.3% 11.7% 13.2% 15.8% Other@ 9.7% 11.6% 10.3% 10.1% 8.9% 9.9% 9.7% 9.5% 9.4% 9.8% Households (thousands) 84,115 4,259 8,143 8,469 7,352 12,621 10,123 7,654 11,300 14,193 Percentage of households 100% 5.1% 9.7% 10.1% 8.7% 15.0% 12.0% 9.1% 13.4% 16.9% Average number of vehicles in HH 2.0 1.0 0 . 9 1.3 1.5 1.9 2.1 2.3 2.6 2.9 Source: U.S. Department of Labor, Bureau of Labor Statistics, web site: www.bls.gov/csxll998/Standardlincome.pdf., February <strong>20</strong>00. (Additional resources: www.bls.gov) a Public assistance monies are included in reported income. Data <strong>for</strong> those reporting income. b Percentages may not sum to totals due to rounding. ’ Includes alcoholic beverages. d Includes personal care, reading, education, tobacco and smoking supplies, cash contributions, and miscellaneous items.
- Page 1:
Center for Transportation Analysis
- Page 5 and 6:
TABLE OF CONTENTS FOREWORD ........
- Page 7 and 8:
Table 3.5 Table 3.6 Table 3.7 Table
- Page 9 and 10:
Table 5.5 Table 5.6 Table 5.7 Table
- Page 11 and 12:
TABLE OF CONTENTS (Continued) Table
- Page 13 and 14:
TABLE OF CONTENTS (Continued) Table
- Page 15:
of them. FOREWORD This edition has
- Page 19:
ABSTRACT The Transportation Energy
- Page 23 and 24:
Source Table 1.2 Table 1.3 Chapter
- Page 25 and 26:
Table 1.2 World Crude Oil Productio
- Page 27 and 28:
I The UnitedStates has increased it
- Page 29 and 30:
I The share ofpetroleum imported to
- Page 31 and 32:
100 90 80 70 60 50 40 30 20 IO 0 No
- Page 33 and 34:
I When crude oil and other hydrocar
- Page 35 and 36:
TRANSPORTATIONENERGYDATABOOK: EDITI
- Page 37:
Table 1.11 Transportation of Petrol
- Page 40 and 41:
1989 World total 134.66 136.35 135.
- Page 42 and 43:
2-4 I Total energy use in the U.S.
- Page 44 and 45:
2-6 I As duta about alternative jil
- Page 46 and 47:
The Federal Highway Administration
- Page 48 and 49:
Q) k s e b Y u IOO- 90 - 80 - 70 -
- Page 50 and 51:
2-12 Table 2.10 U.S. Production and
- Page 52 and 53:
Great care should be taken when com
- Page 54 and 55:
I Great care should be taken when c
- Page 57 and 58:
Source Chapter 3 Greenhouse Gas Emi
- Page 59 and 60:
1990 (million metric tonnes) Austra
- Page 61 and 62:
Table 3.4 Estimated U.S. Emissions
- Page 63 and 64:
Fuel Motor gasoline LPG” Jet fuel
- Page 65 and 66:
The Greenhouse Gases, Regulated Emi
- Page 67 and 68:
Table 3.8 NEAR-TERM Technology Cfor
- Page 69 and 70:
Table 3.9 (continued) LONG-TERM Tec
- Page 71 and 72:
Table 3.9 (continued) LONG-TERM Tec
- Page 73 and 74:
Table 3.9 (continued) LONG-TERM Tec
- Page 75 and 76:
Source Chapter 4 Criteria Pollutant
- Page 77 and 78:
I The transportation sector account
- Page 79 and 80:
I The transportation sector account
- Page 81 and 82:
I The transportation sector account
- Page 83 and 84:
I The transportation sector account
- Page 85 and 86:
The transportation sector accounted
- Page 87 and 88:
I Historically the transportation s
- Page 89 and 90:
The Greenhouse Gases, Regulated Emi
- Page 91 and 92:
Table 4.14 NEAR-TERM Technology Cfo
- Page 93 and 94:
Table 4.15 LONG-TERM Technology Gfo
- Page 95 and 96:
Table 4.15 (continued) LONG-TERM Te
- Page 97 and 98:
Table 4.15 (continued) LONG-TERM Te
- Page 99 and 100:
Table 4.15 (continued) LONG-TERM Te
- Page 101 and 102:
Table 4.15 (continued) LONG-TERM Te
- Page 103 and 104:
Table 4.15 (continued) LONG-TERM Te
- Page 105 and 106:
Table 4.15 (continued) LONG-TERM Te
- Page 107 and 108:
Table 4.18 Federal Exhaust Emission
- Page 109 and 110:
Table 4.20 Federal Exhaust Emission
- Page 111 and 112:
2 2 % 0” z Table 4.22 Federal Exh
- Page 113 and 114:
Gasoline Hydrocarbons (HC) Nitrogen
- Page 115 and 116:
I Califknia’s Low-Emission Vehicl
- Page 117 and 118:
Source Figure 5.1 Table 5.4 Table 5
- Page 119 and 120:
Figure 5.1. Gasoline Prices for Sel
- Page 121 and 122:
- I . I . I . I I Figure 5.2. Diese
- Page 123 and 124:
Year Current Diesel fuel a Constant
- Page 125 and 126:
Table 5.6 State Taxes on Motor Fuel
- Page 127 and 128:
As of January 2000, only five state
- Page 129 and 130:
I In current dollars, import cars,
- Page 131 and 132:
I The total cost of operating an au
- Page 133 and 134:
Year 1970 1980 1990 1997 1998 1970
- Page 135 and 136:
Employees of motor vehicle and rela
- Page 137 and 138:
Source Table 6.1 Table 6.2 Table 6.
- Page 139 and 140:
Year China India Japan France 1950
- Page 141 and 142:
1970 1971 1972 E 1973 2 1974 4 1975
- Page 143 and 144:
Table 6.5 Highway Vehicle Miles Tra
- Page 145 and 146:
Table 6.7 Trucks in Operation and V
- Page 147 and 148:
I Using current registration data a
- Page 149 and 150:
I Using current registration data a
- Page 151 and 152:
Source Chapter 7 Light Vehicles and
- Page 153 and 154:
The Federal Highway Administration
- Page 155 and 156:
Table 7.4 New Retail Sales of Truck
- Page 157 and 158:
Table 7.6 Period Sales, Market Shar
- Page 159 and 160:
Table 7.8 Sales-Weighted Engine Siz
- Page 161 and 162:
Sales period” 1976 1977 1978 1979
- Page 163 and 164:
0.8 F 0 0.6 u' 2 s = 0.4 0.2 Figure
- Page 165 and 166:
I The average auto lost over 300pou
- Page 167 and 168: I The number of conventional refuel
- Page 169 and 170: Table 7.17 Corporate Average Fuel E
- Page 171 and 172: Fuel Economy by Vehicle Speed ORNL
- Page 173 and 174: I The two earlier studies by the Fe
- Page 175 and 176: Speed (mph) 1988 1993 Chevrolet Sub
- Page 177 and 178: I The New York Test Cycle was devel
- Page 179 and 180: Table 7.23 Occupant Fatalities by V
- Page 181 and 182: B0 P I In 1998, nearly 40% of all p
- Page 183 and 184: Source Table 8.1 Table 8.1 Table 8.
- Page 185 and 186: Table 8.2 New Retail Truck Sales by
- Page 187 and 188: I These tables illustrate the diffe
- Page 189 and 190: Trucks Trucks (%) Miles per truck T
- Page 191 and 192: I Nearly 1 GO% of all truckfleets u
- Page 193 and 194: Commodity Flow Survey The Commodity
- Page 195 and 196: Some,freight activities, such as pi
- Page 197 and 198: Chapter 9 Alternative Fuel Vehicles
- Page 199 and 200: I There are more LPG vehicles in us
- Page 201 and 202: Table 9.3 Estimates of Heavy Altern
- Page 203 and 204: This list includes public and priva
- Page 205 and 206: Figure 9.1 Map of Clean Cities as o
- Page 207: The Partnership for a New Generatio
- Page 210 and 211: . mm . . . SigniJicant changes have
- Page 212 and 213: 1 o-4 ama . . . .I . I TheseJleet d
- Page 214 and 215: 1 O-G @Ea6Ll I VW . . I Department
- Page 216 and 217: 10-8 I The Energy Policy Act of 199
- Page 220 and 221: 11-4 I Household vehicle ownership
- Page 222 and 223: 1 l-6 e. . The 1995 NPTS data shoul
- Page 224 and 225: 11-8 El . . TRANSPORTATIONENERGYDAT
- Page 226 and 227: oooz-02 NOI.I>Ia~ :>I008 VLVa A!X%N
- Page 228 and 229: 11-12 I As households owned more ve
- Page 230 and 231: 11-14 a. . I In 1995 the average jo
- Page 232 and 233: 11-16 I3 . . Table 11.14 National a
- Page 234 and 235: . D. Principal means of transportat
- Page 236 and 237: . D. 90- IO- O- Figure 11.5. Shares
- Page 238 and 239: Table 12.1 Summary Statistics for U
- Page 240 and 241: 124 In the early seventies, domesti
- Page 242 and 243: Fifty-six percent of all domestic m
- Page 244 and 245: Table 12.7 Summary’Statistics for
- Page 246 and 247: 12-10 The number of trailers and co
- Page 248 and 249: Table 12.11 Summary Statistics for
- Page 250 and 251: A-2 AAMA APTA Amtrak Btu DOC DOE DO
- Page 252 and 253: A-4 Trucks Off-Highway Nonhighwav A
- Page 254 and 255: A-6 Rail Total: Sum of freight and
- Page 256 and 257: A-8 Buses Trucks Sum of transit, in
- Page 258 and 259: A-10 Pipeline Rail Recreational Boa
- Page 260 and 261: A-12 Highway Automobiles Personal T
- Page 262 and 263: A-14 Nonhighway Air Recreational Bo
- Page 264 and 265: A-16 Pipeline Rail Natural Gas: Ton
- Page 266 and 267: A-18 Light Trucks Buses Vmt - DOT,
- Page 268 and 269:
A-20 Highway Table 2.14 Energy Inte
- Page 270 and 271:
A-22 Trucks Stock - Vehicles in use
- Page 272 and 273:
A-24 Energy Use Transit buses: Amer
- Page 274 and 275:
B-2 Automotive gasoline Diesel moto
- Page 276 and 277:
B-4 Table B.3 Energy Unit Conversio
- Page 278 and 279:
B-6 Table B.7 Volume and Flow Rate
- Page 280 and 281:
FROM Pound Kilogram Pound 1 0.4536
- Page 282 and 283:
B-10 One million million millionth
- Page 284 and 285:
B-12 Conversion of Constant Dollar
- Page 286 and 287:
Table B.14 Gross National Product (
- Page 288 and 289:
c-2 Table C.l Census Divisions and
- Page 291 and 292:
GLOSSARY Acceleration power - Measu
- Page 293 and 294:
Bunker - A storage tank. Bunkering
- Page 295 and 296:
separating facilities. Crude oil pr
- Page 297 and 298:
General aviation - That portion of
- Page 299 and 300:
Lease Condensate - A liquid recover
- Page 301 and 302:
Oil Stocks - Oil stocks include cru
- Page 303 and 304:
Petroleum inventories: The amounts
- Page 305 and 306:
Single unit truck - Includes two-ax
- Page 307 and 308:
TITLE INDEX TRANSPORTATION ENERGY D
- Page 309 and 310:
Alternative (continued) NEAR-TERM T
- Page 311 and 312:
Aviation Axle Barrel Summary Statis
- Page 313 and 314:
Certification (continued) Cities Ci
- Page 315 and 316:
Corporate Corporate Average Fuel Ec
- Page 317 and 318:
Dioxide International Man-Made Emis
- Page 319 and 320:
Emission (continued) LONG-TERM Tech
- Page 321 and 322:
Engine Sales-Weighted Engine Size o
- Page 323 and 324:
Fleet Fleet Vehicles in Service as
- Page 325 and 326:
Fuels (continued) Gallon Gas Gases
- Page 327 and 328:
Heavy (continued) Federal Exhaust E
- Page 329 and 330:
International Summary Statistics fo
- Page 331 and 332:
Material Matter Average Material Co
- Page 333 and 334:
Nitrogen Total National Emissions o
- Page 335 and 336:
Percentage (continued) Periods Pers
- Page 337 and 338:
Prices CrudeOilPrices,1870-98 . . .
- Page 339 and 340:
Retail (continued) New Retail Sales
- Page 341 and 342:
Shares Shares of Long-Distance Pers
- Page 343 and 344:
s toc1< s toc1
- Page 345 and 346:
Time Tire Ton Average Length of Tim
- Page 347 and 348:
Trucks (continued) Unit Federal Exh
- Page 349 and 350:
Vehicle (continued) Employees of Mo
- Page 351:
Work World Journey-to-Work Statisti